Headlines
|
|
A bevy of Golden Crosses:
After a long drought, the small-cap Russell 2000 index has triggered a Golden Cross, with its 50-day moving average crossing above its 200-day average. The same thing happened in Emerging Markets, and it may be about to trigger on the S&P 500. These signals have been consistently positive for future returns.
|
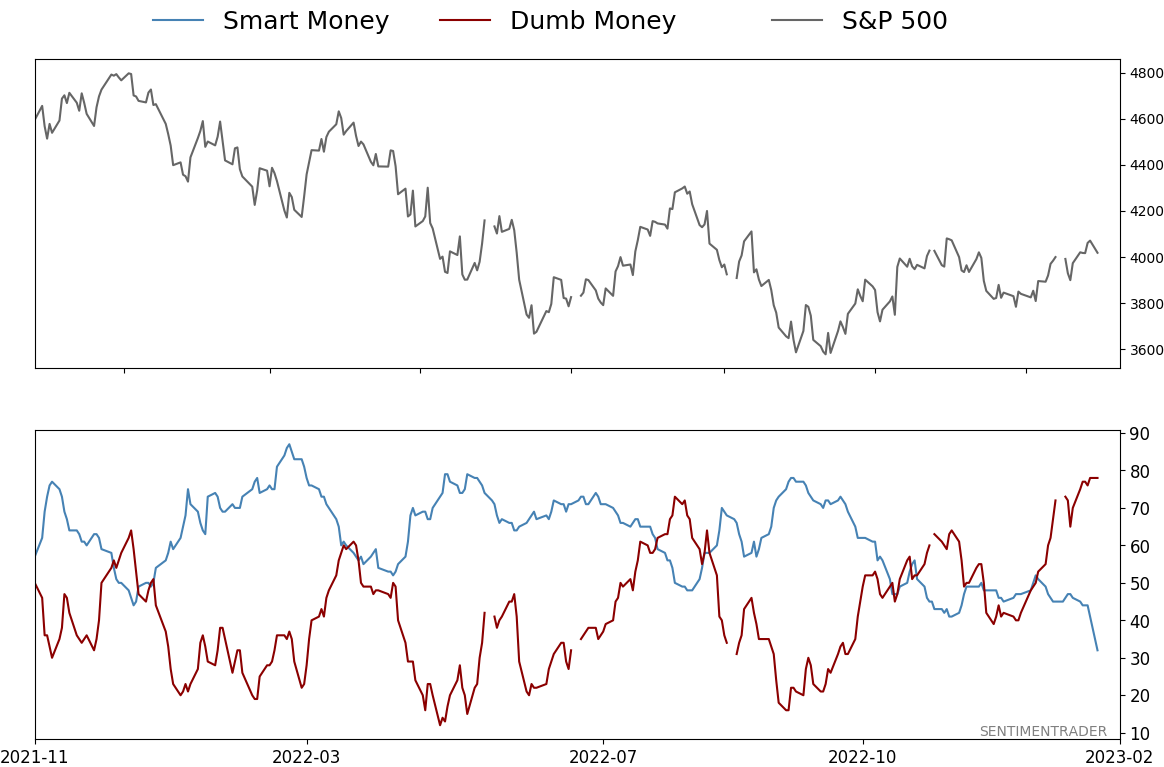
Smart / Dumb Money Confidence
|
Smart Money Confidence: 32%
Dumb Money Confidence: 78%
|
|
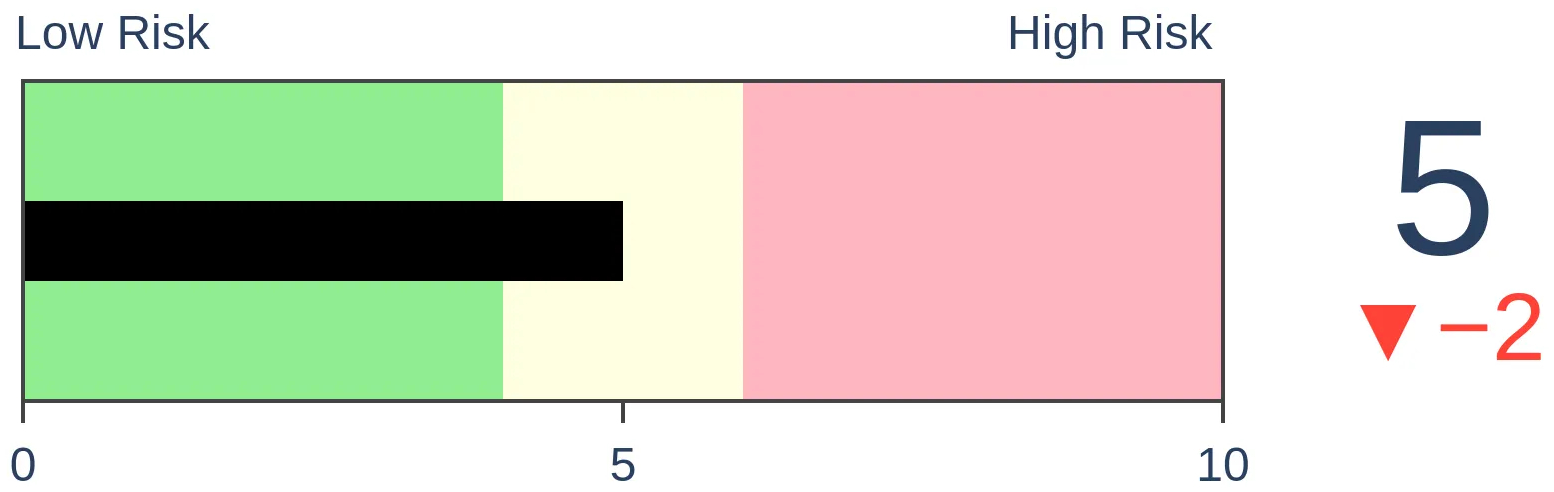
Risk Levels
Stocks Short-Term
|
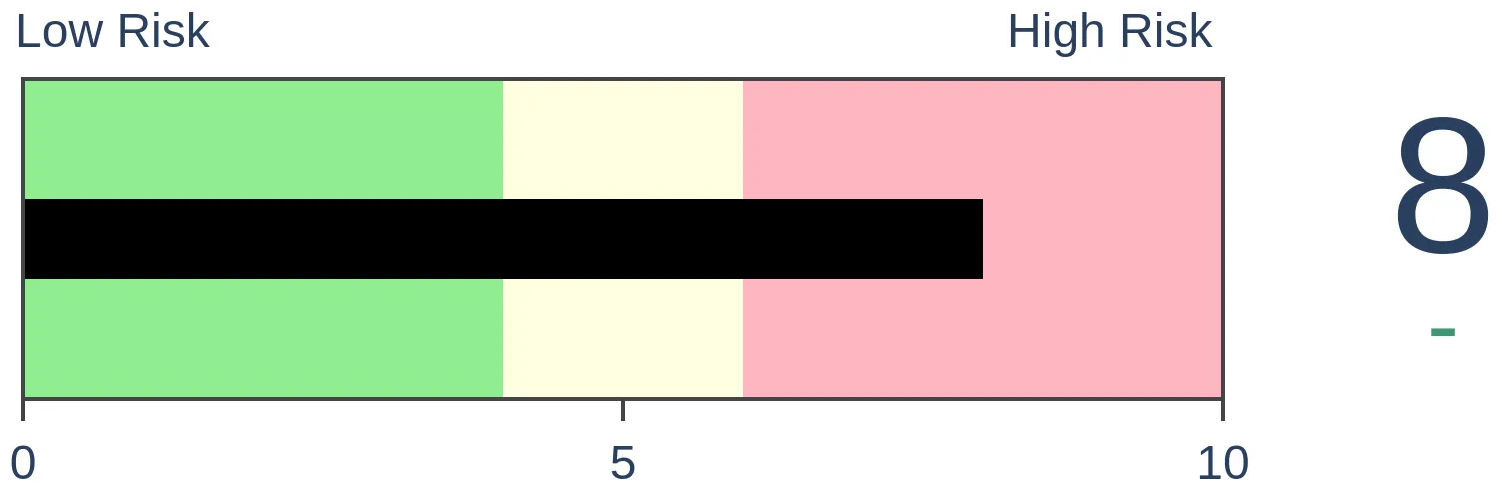
Stocks Medium-Term
|
|
Bonds
|
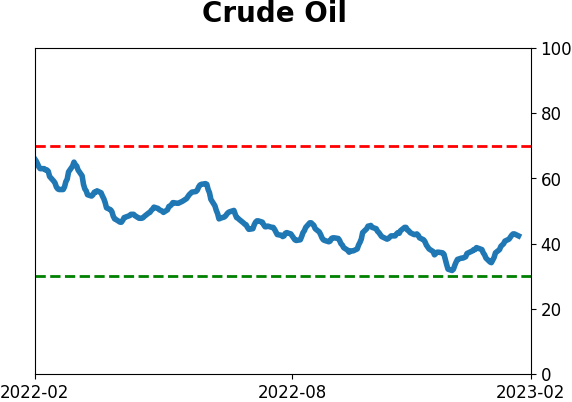
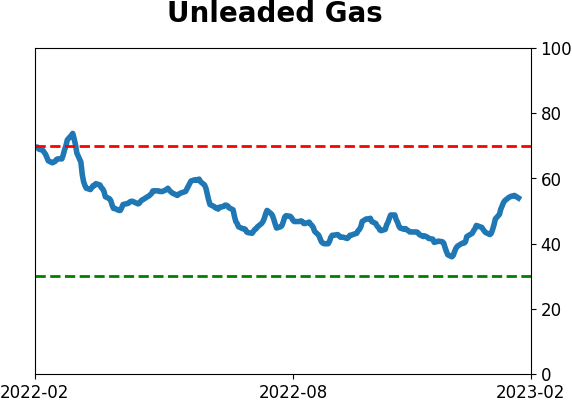
Crude Oil
|
|
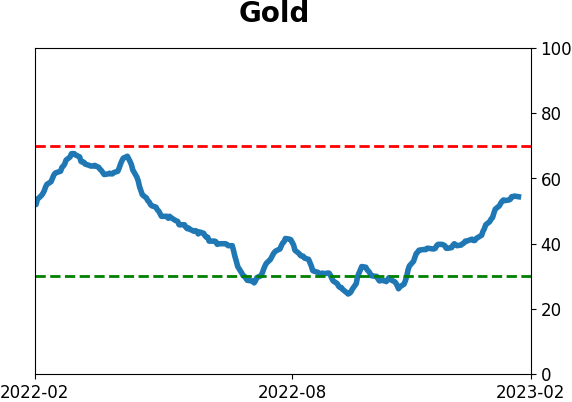
Gold

|
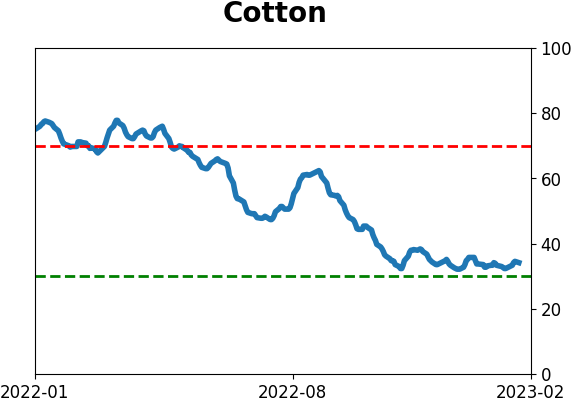
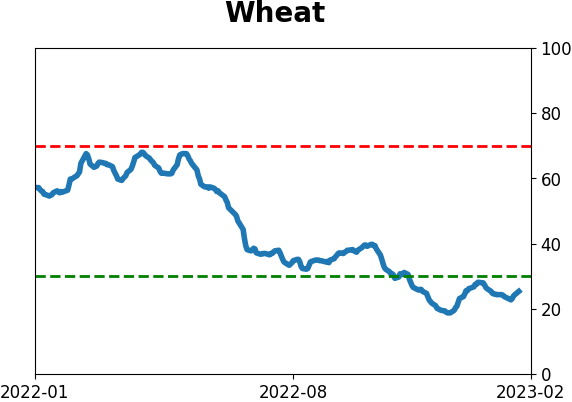
Agriculture
|
|
Research
By Jason Goepfert
BOTTOM LINE
After a long drought, the small-cap Russell 2000 index has triggered a Golden Cross, with its 50-day moving average crossing above its 200-day average. The same thing happened in Emerging Markets, and it may be about to trigger on the S&P 500. These signals have been consistently positive for future returns.
FORECAST / TIMEFRAME
None
|
Key points:
- The small-cap Russell 2000 index has triggered a Golden Cross
- Emerging market indexes have as well, and the S&P 500 may trigger one this week
- Crosses after a long absence have been consistently positive signs for future returns
After more than a year, small-cap stocks enjoy a positive trend
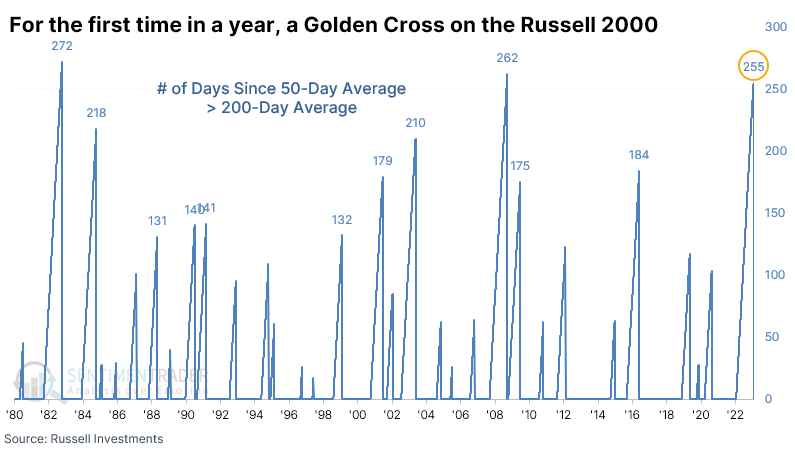
Small-cap stocks are often seen as a harbinger of the domestic economy or at least the prospect for its stocks. In that sense, last week proved to be a good omen. For the first time in over a year, the 50-day moving average of the Russell 2000 index crossed above its 200-day moving average.
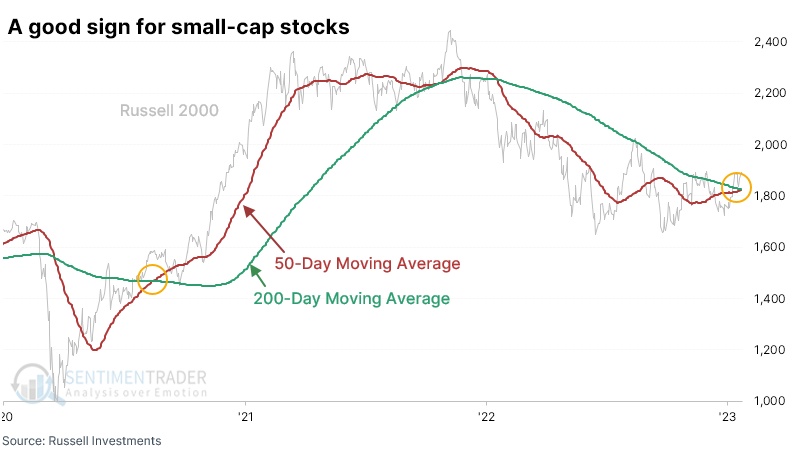
This ended the 3rd-longest streak without a positive medium- to long-term trend since the index's inception.
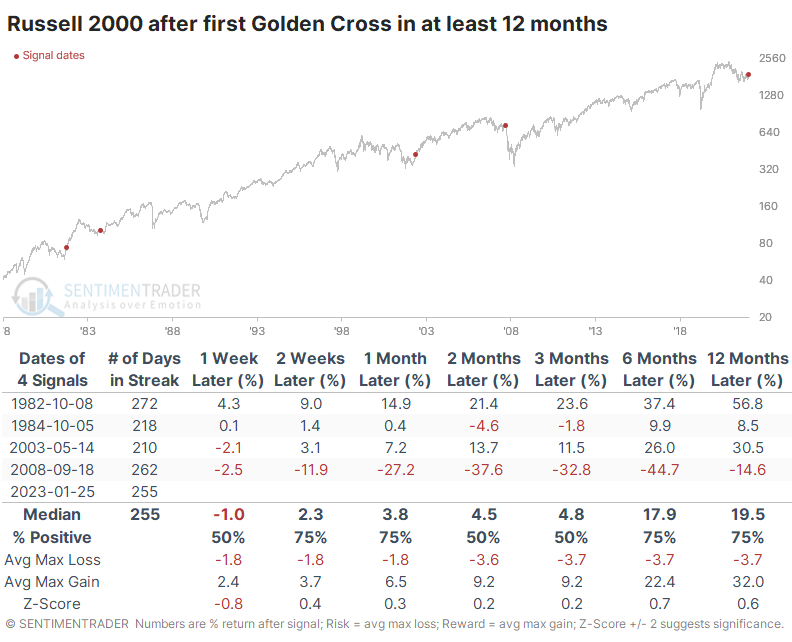
After the longest streaks ended, the Russell tended to power higher, except for a miserable fakeout in 2008. The index lost more than half its value within six months following that signal.
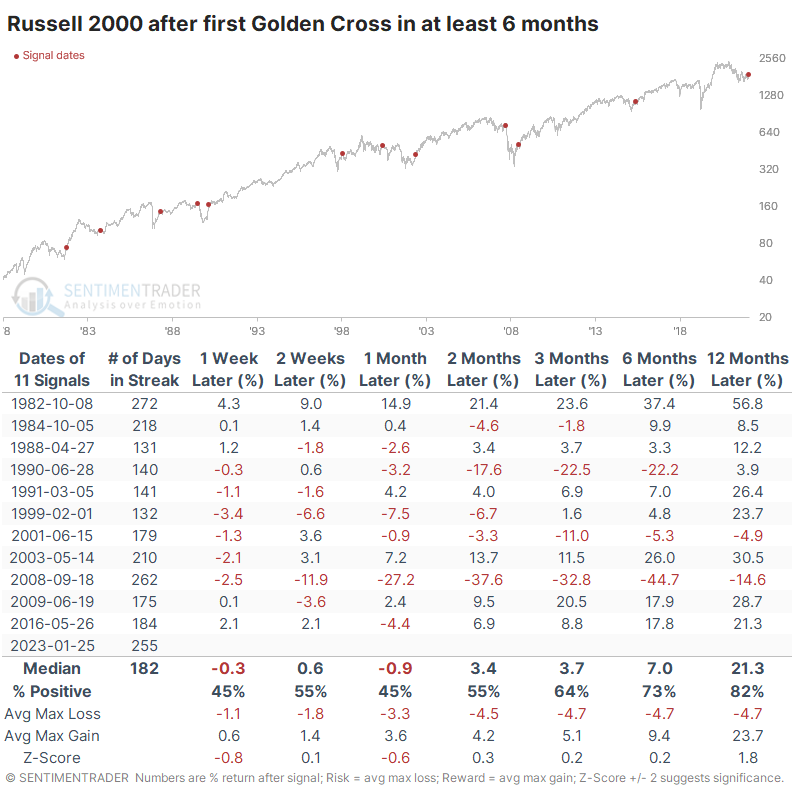
If we relax the parameters to the first Cross in at least six months, we expand the sample size, with mostly positive results. Like the 2008 signal, there was one in 1990 that preceded an almost immediate and substantial decline.
Golden Crosses after steep drawdowns are good signs
Context is important, and this signal came after small-cap stocks had been hammered over the past year. The Russell 2000 suffered a drawdown of more than 30%, one of its largest in more than 40 years.
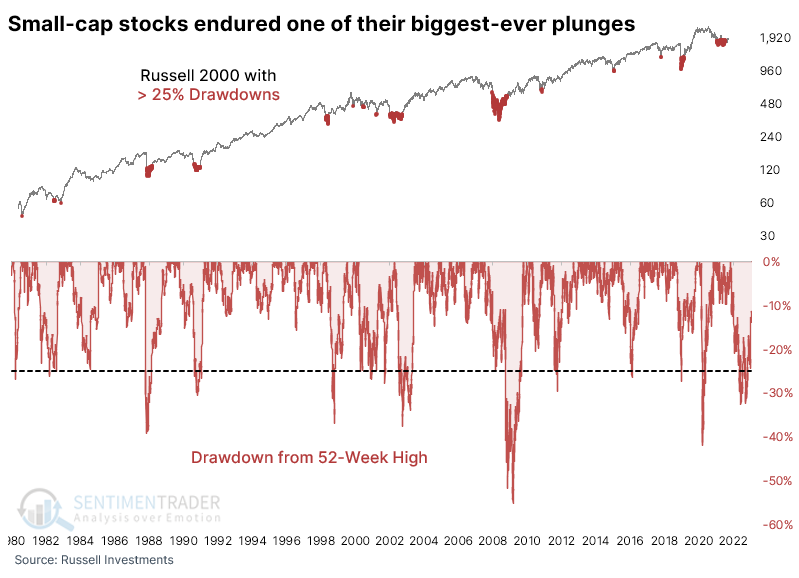
When these Golden Cross signals were triggered after a large drawdown of more than 25%, future returns in the index were excellent. Over the next six months, there were only two modest losses, though one of those ended up leading to the pandemic panic in 2020.
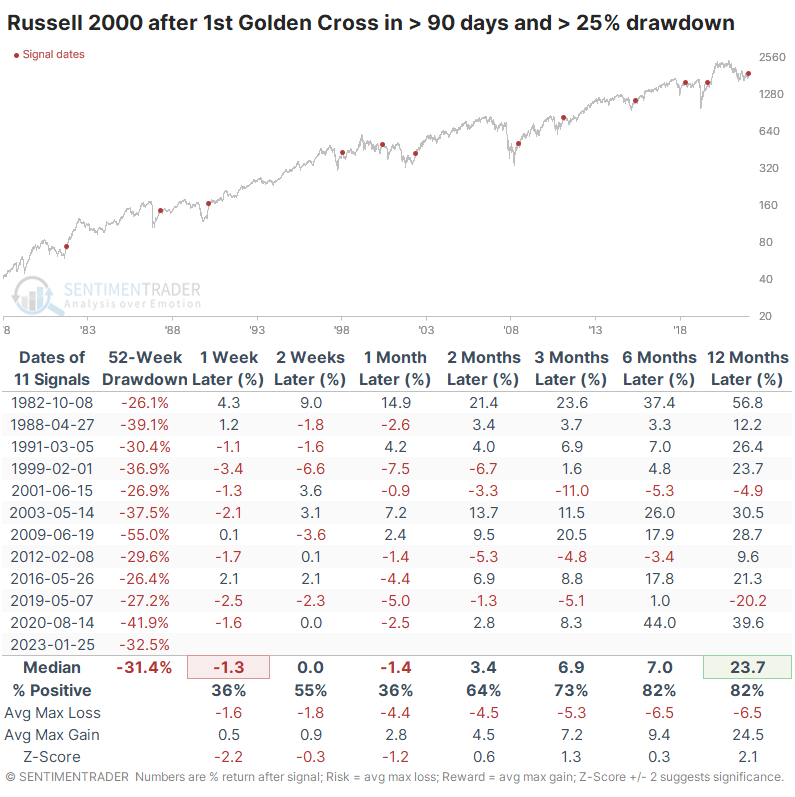
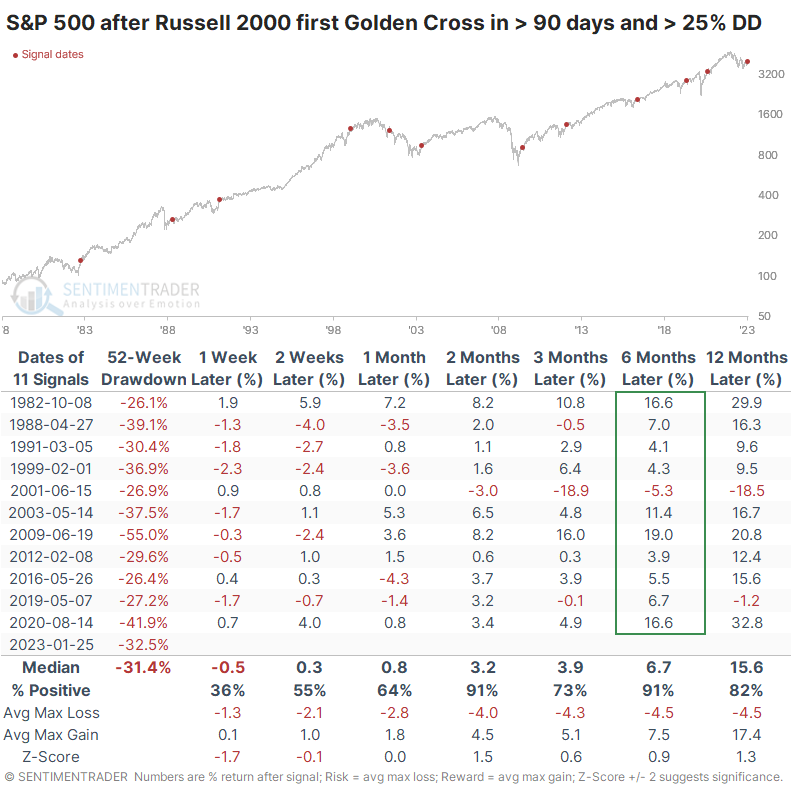
These signals were also a positive sign for the broader market, with only a single loss in the S&P 500 over the next six months.
Emerging markets have emerging bull trends
After being left on the rubbage heap in 2022, emerging market stocks have roared back in recent weeks. The MSCI Emerging Markets Index has, as well, now formed a Golden Cross. The last time that happened, in 2020, it preceded a massive bull market.
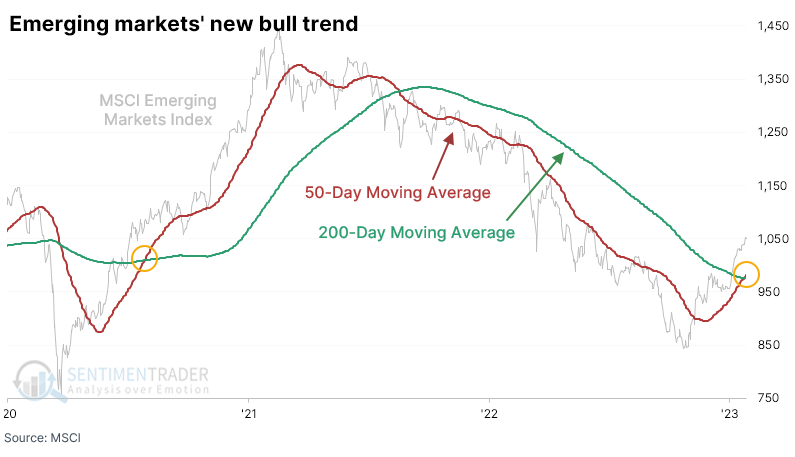
The Cross in these stocks was the first time in 375 sessions when the 50-day average was above the 200-day average. That's tied for the 2nd-longest streak in the index's history.
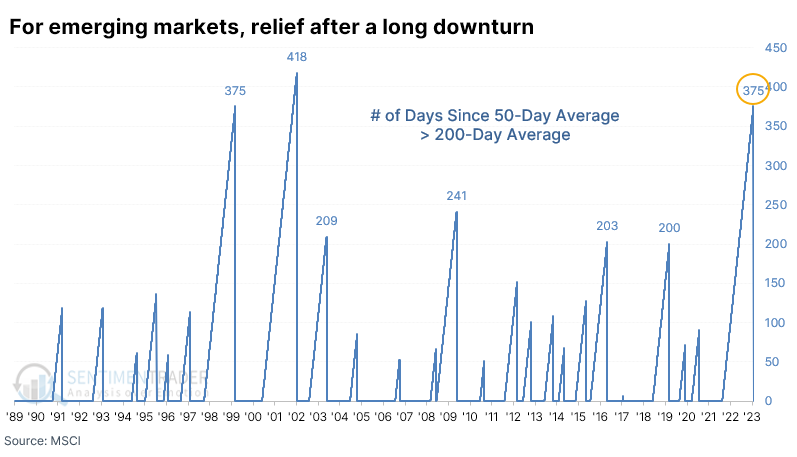
After any streak of 200 days or more ended without a positive trend in those moving averages, emerging markets tended to do quite well, especially over the next three months. There was only a single loss, and it was limited. On average, the stocks gained more than 20% at some point within the next six months.
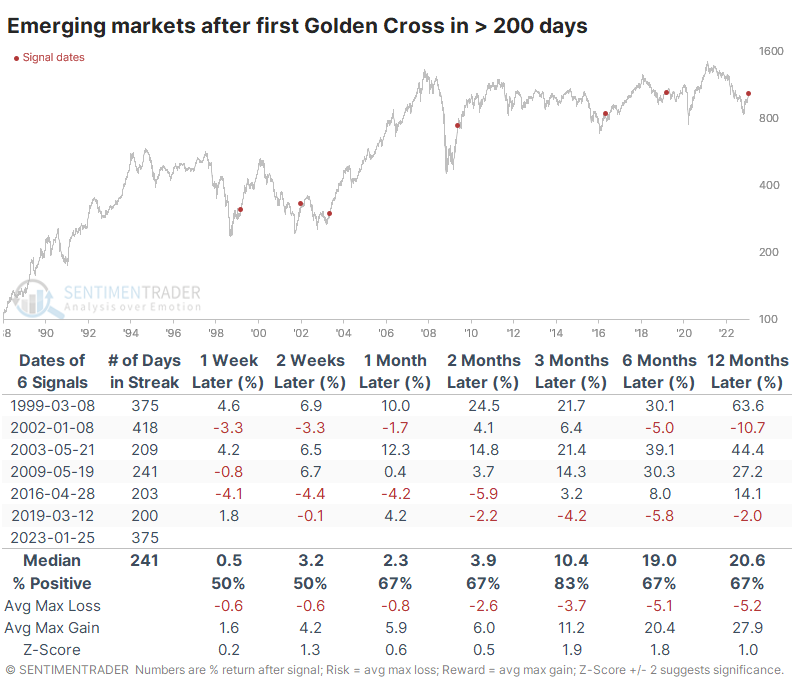
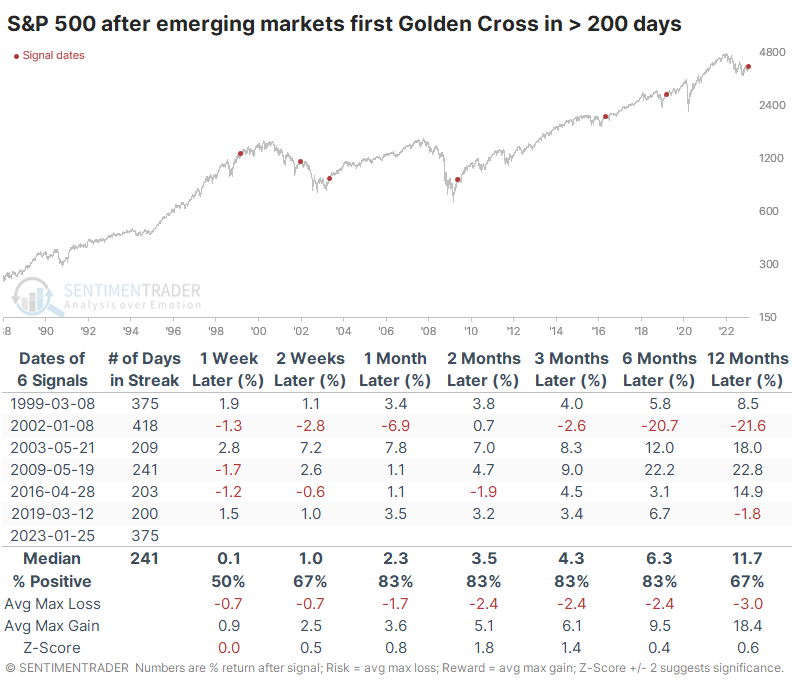
Recoveries in emerging markets tended to coincide with good markets across the globe. New Golden Crosses in those stocks tended to be positive signs for the S&P 500, though it failed in 2002.
Almost there on the S&P 500, too
Speaking of the S&P 500, if the index holds up over the next several days, it will almost certainly trigger its own Golden Cross for the first time in at least 200 sessions. These tended to be very good signs for forward returns.
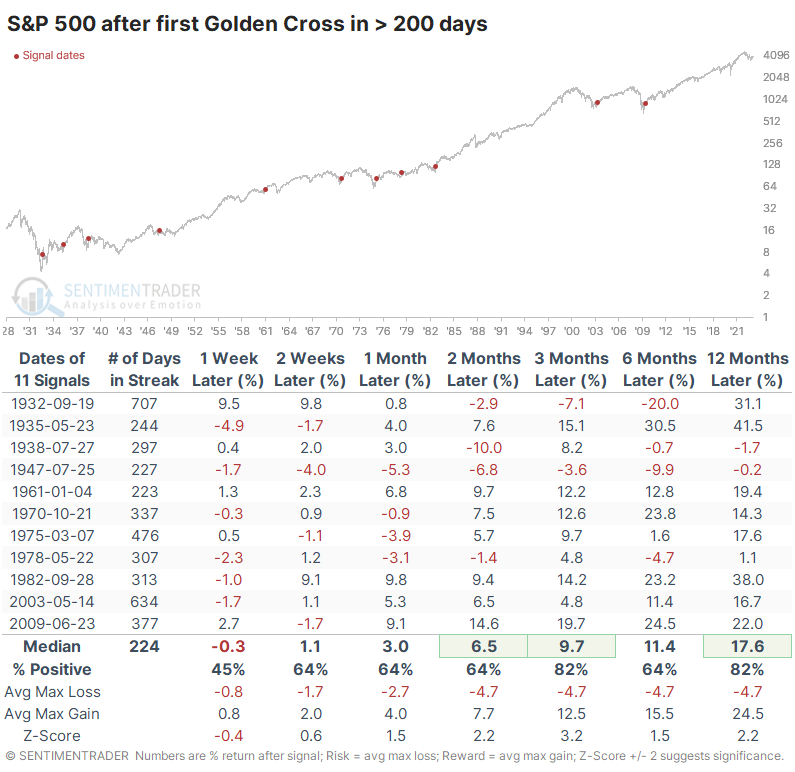
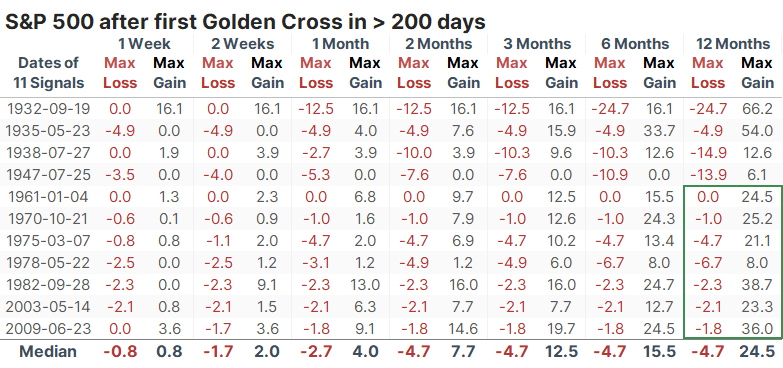
Most impressive was the maximum decline versus maximum gain over the next year since 1950. The index showed a strong tendency toward limited losses and significant gains.
What the research tells us...
We spent a lot of time in September and October outlining the historic degree of pessimism among investors. And since then, a lot of time on the overwhelming, broad, and global return of buying interest among stocks, sectors, indexes, and even other markets like bonds. Both the deep and persistent pessimism and the impressive buying thrusts have excellent records at preceding further gains over the next 6-12 months at least. The recoveries in medium- and long-term trends among various indexes, especially those sensitive to domestic and emerging economies, also have an impressive track record at preceding further gains. These are good signs for patient investors.
Indicators at Extremes
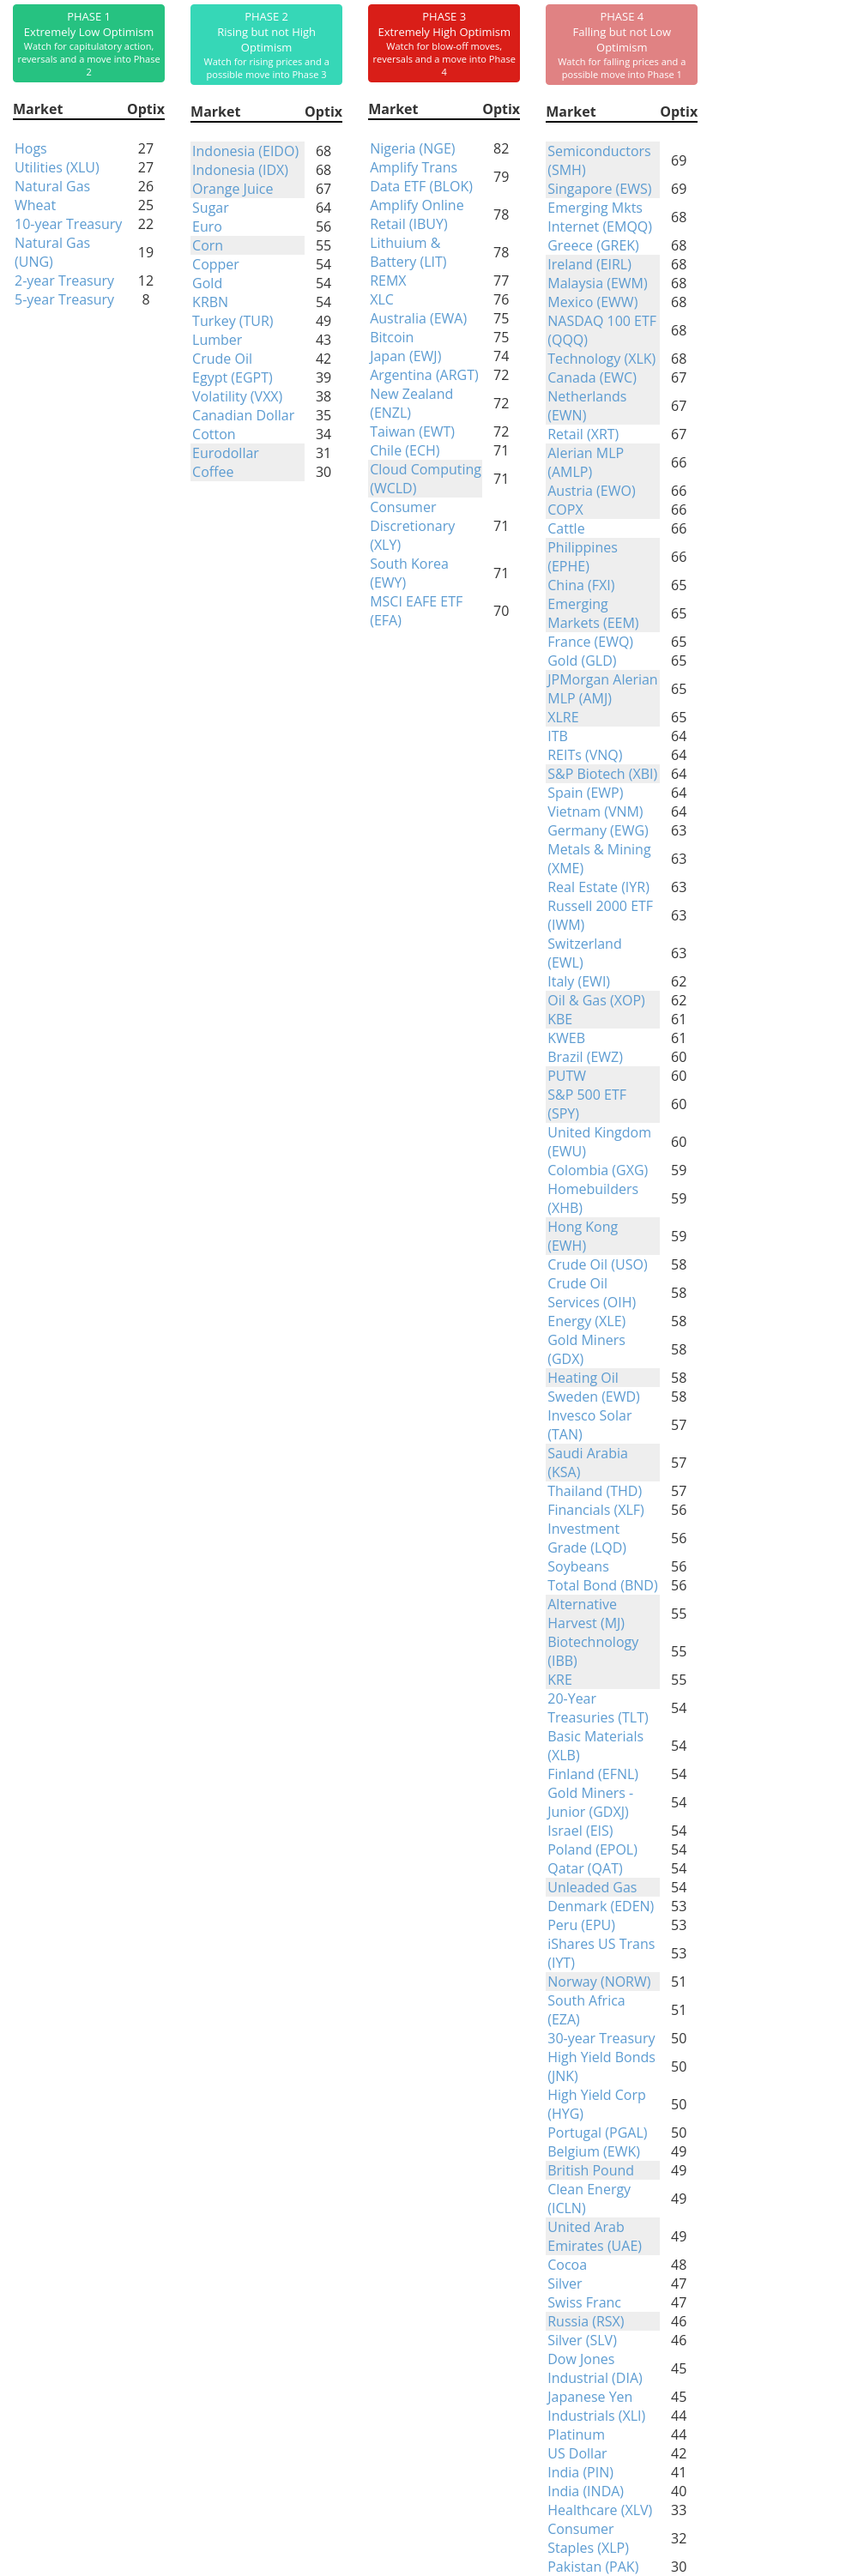
Phase Table
Ranks
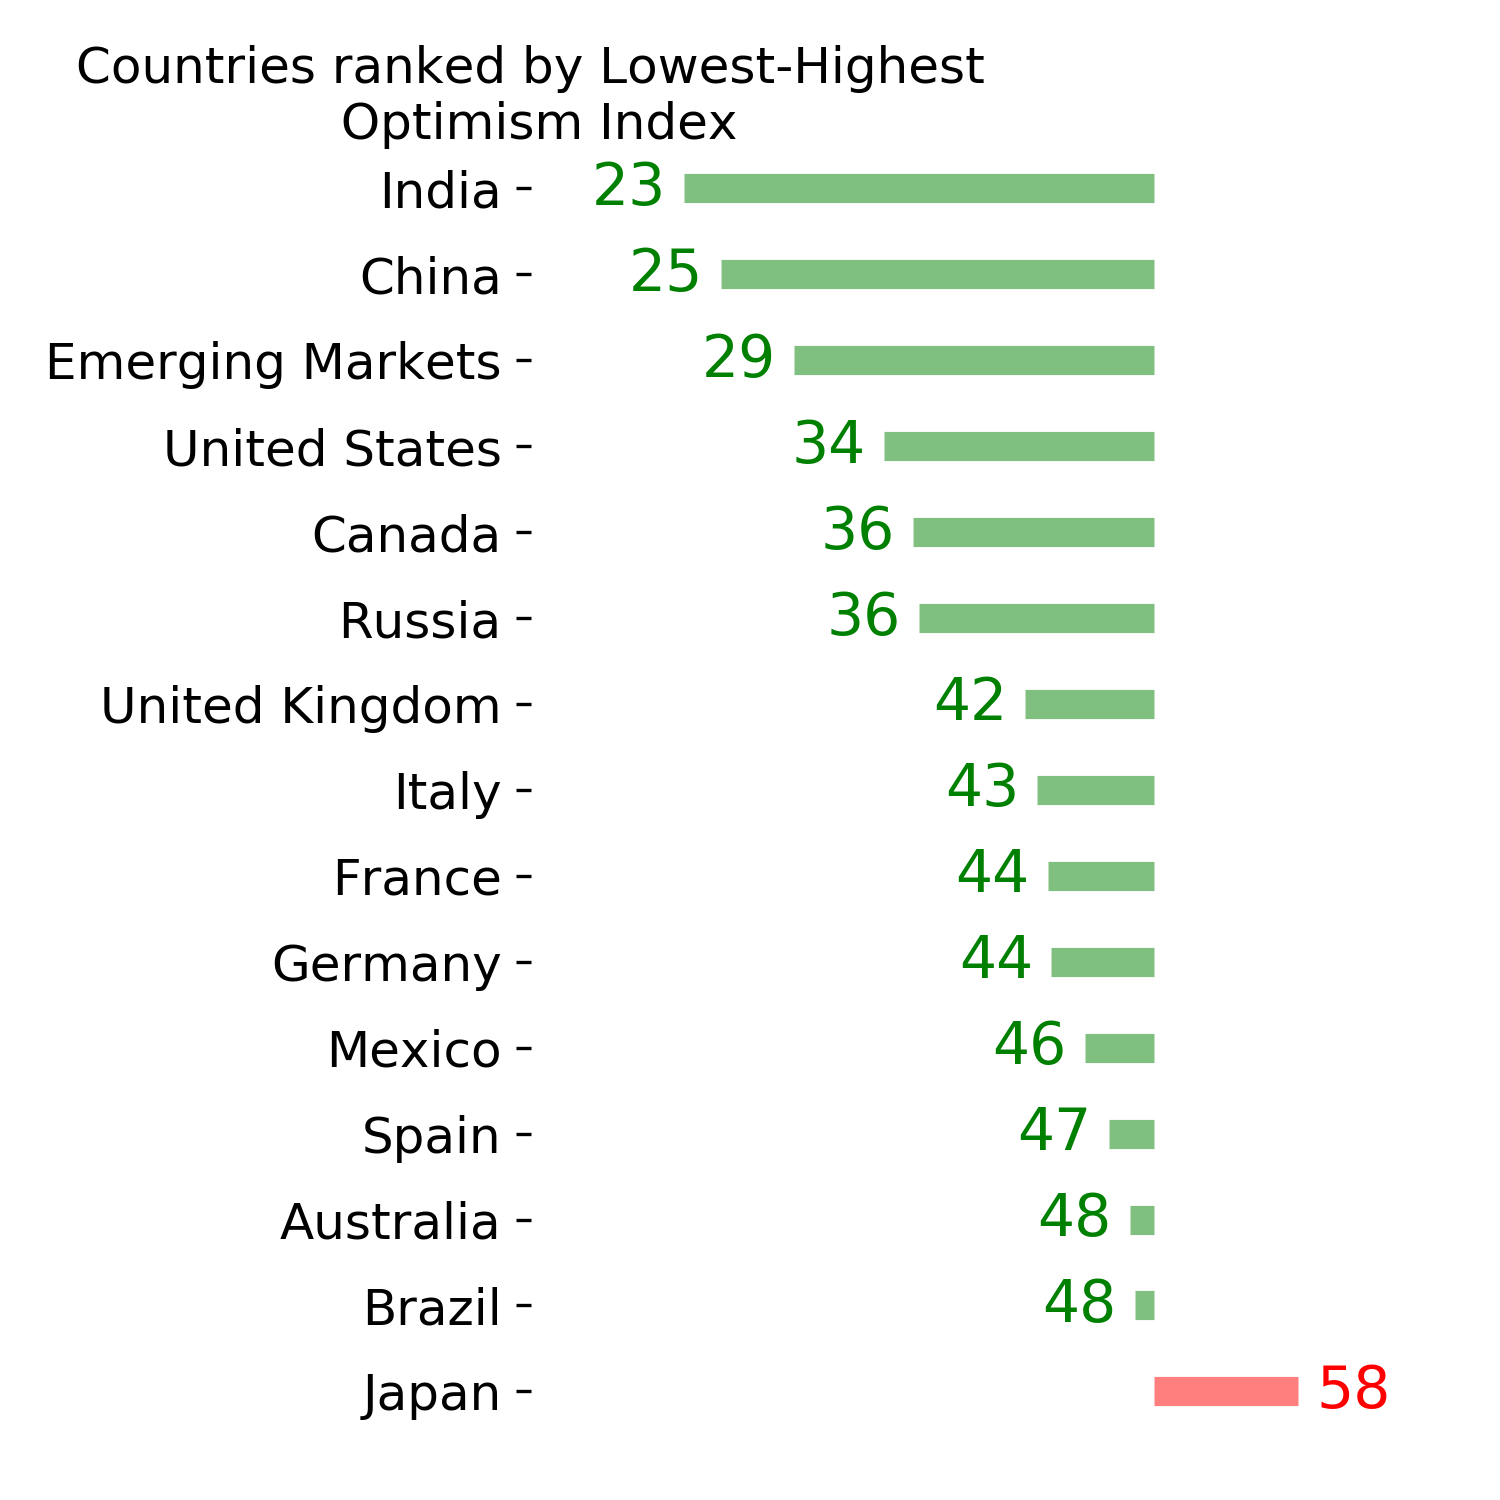
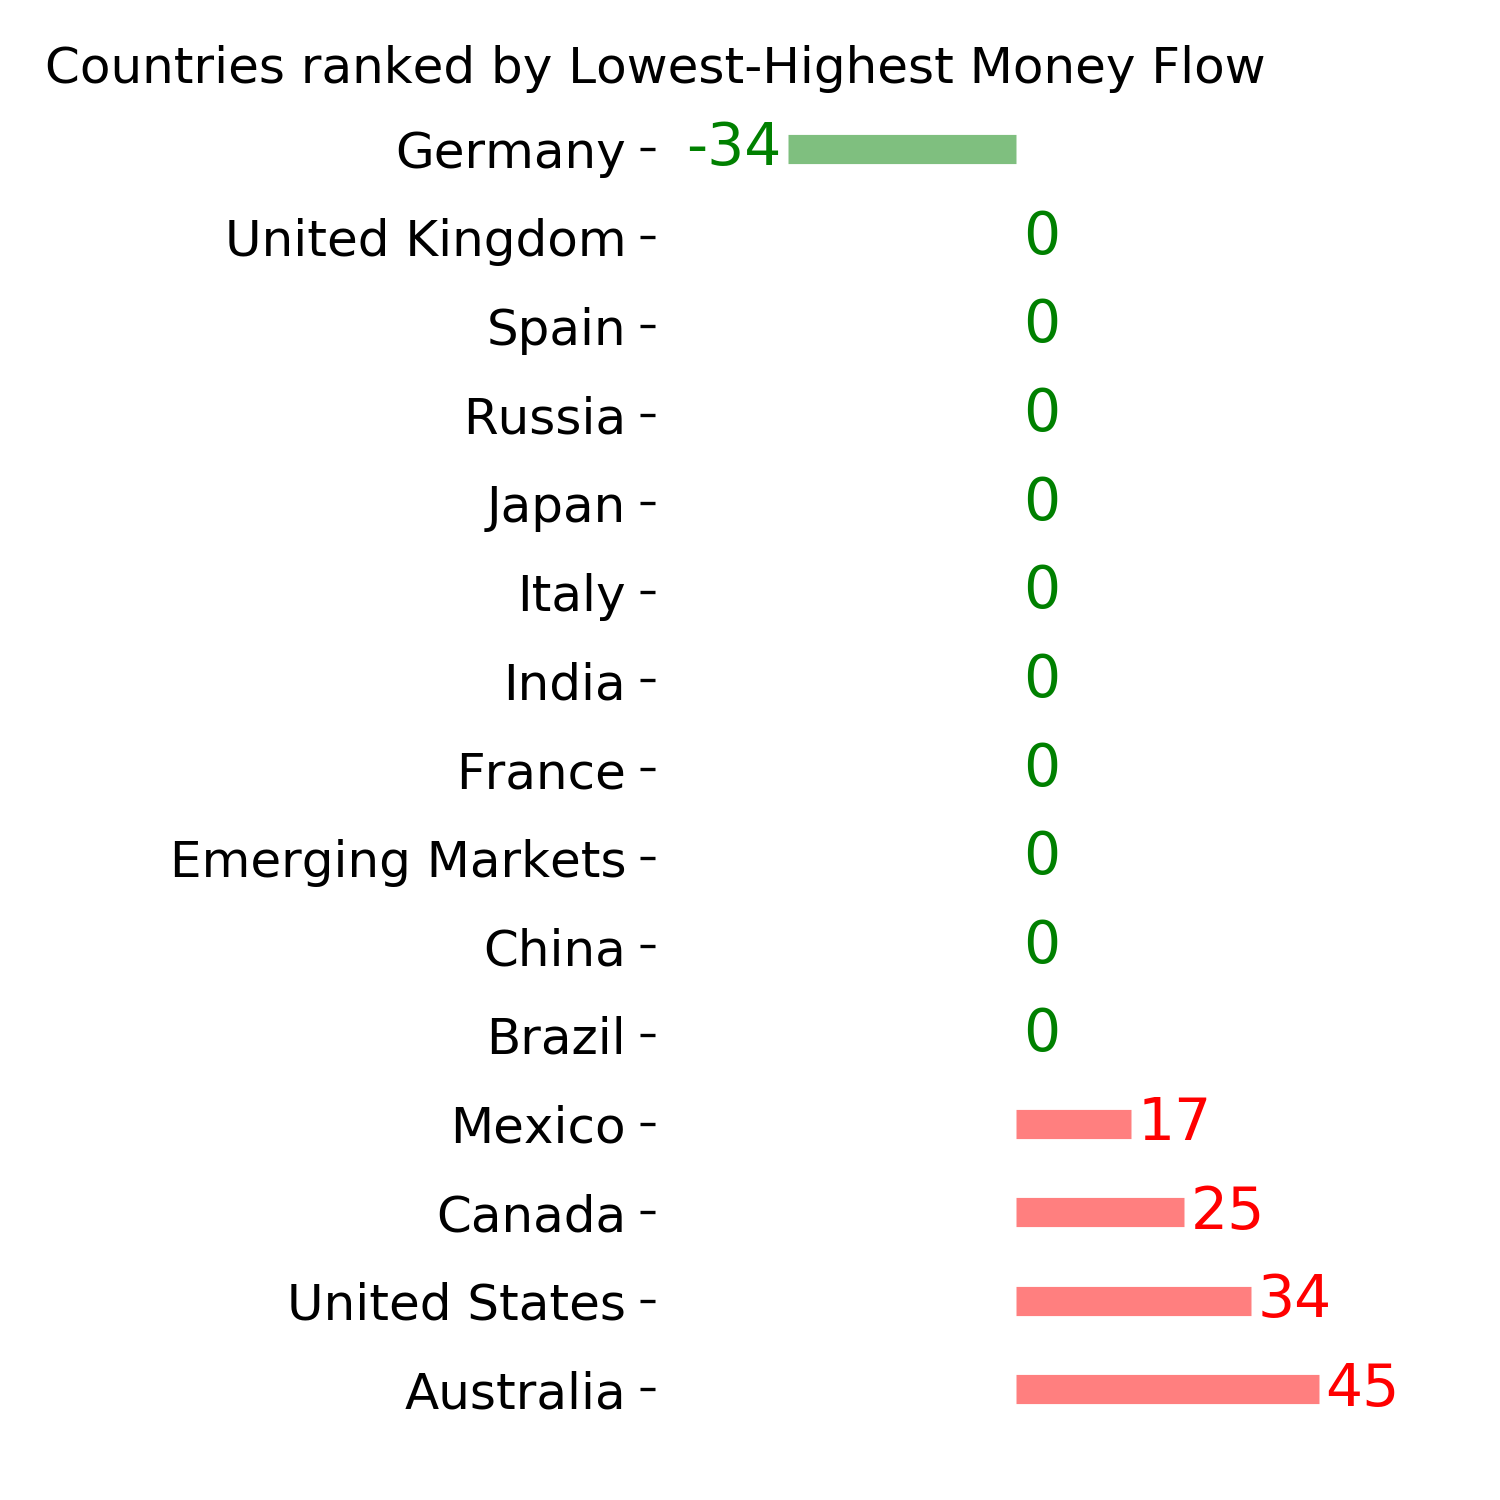
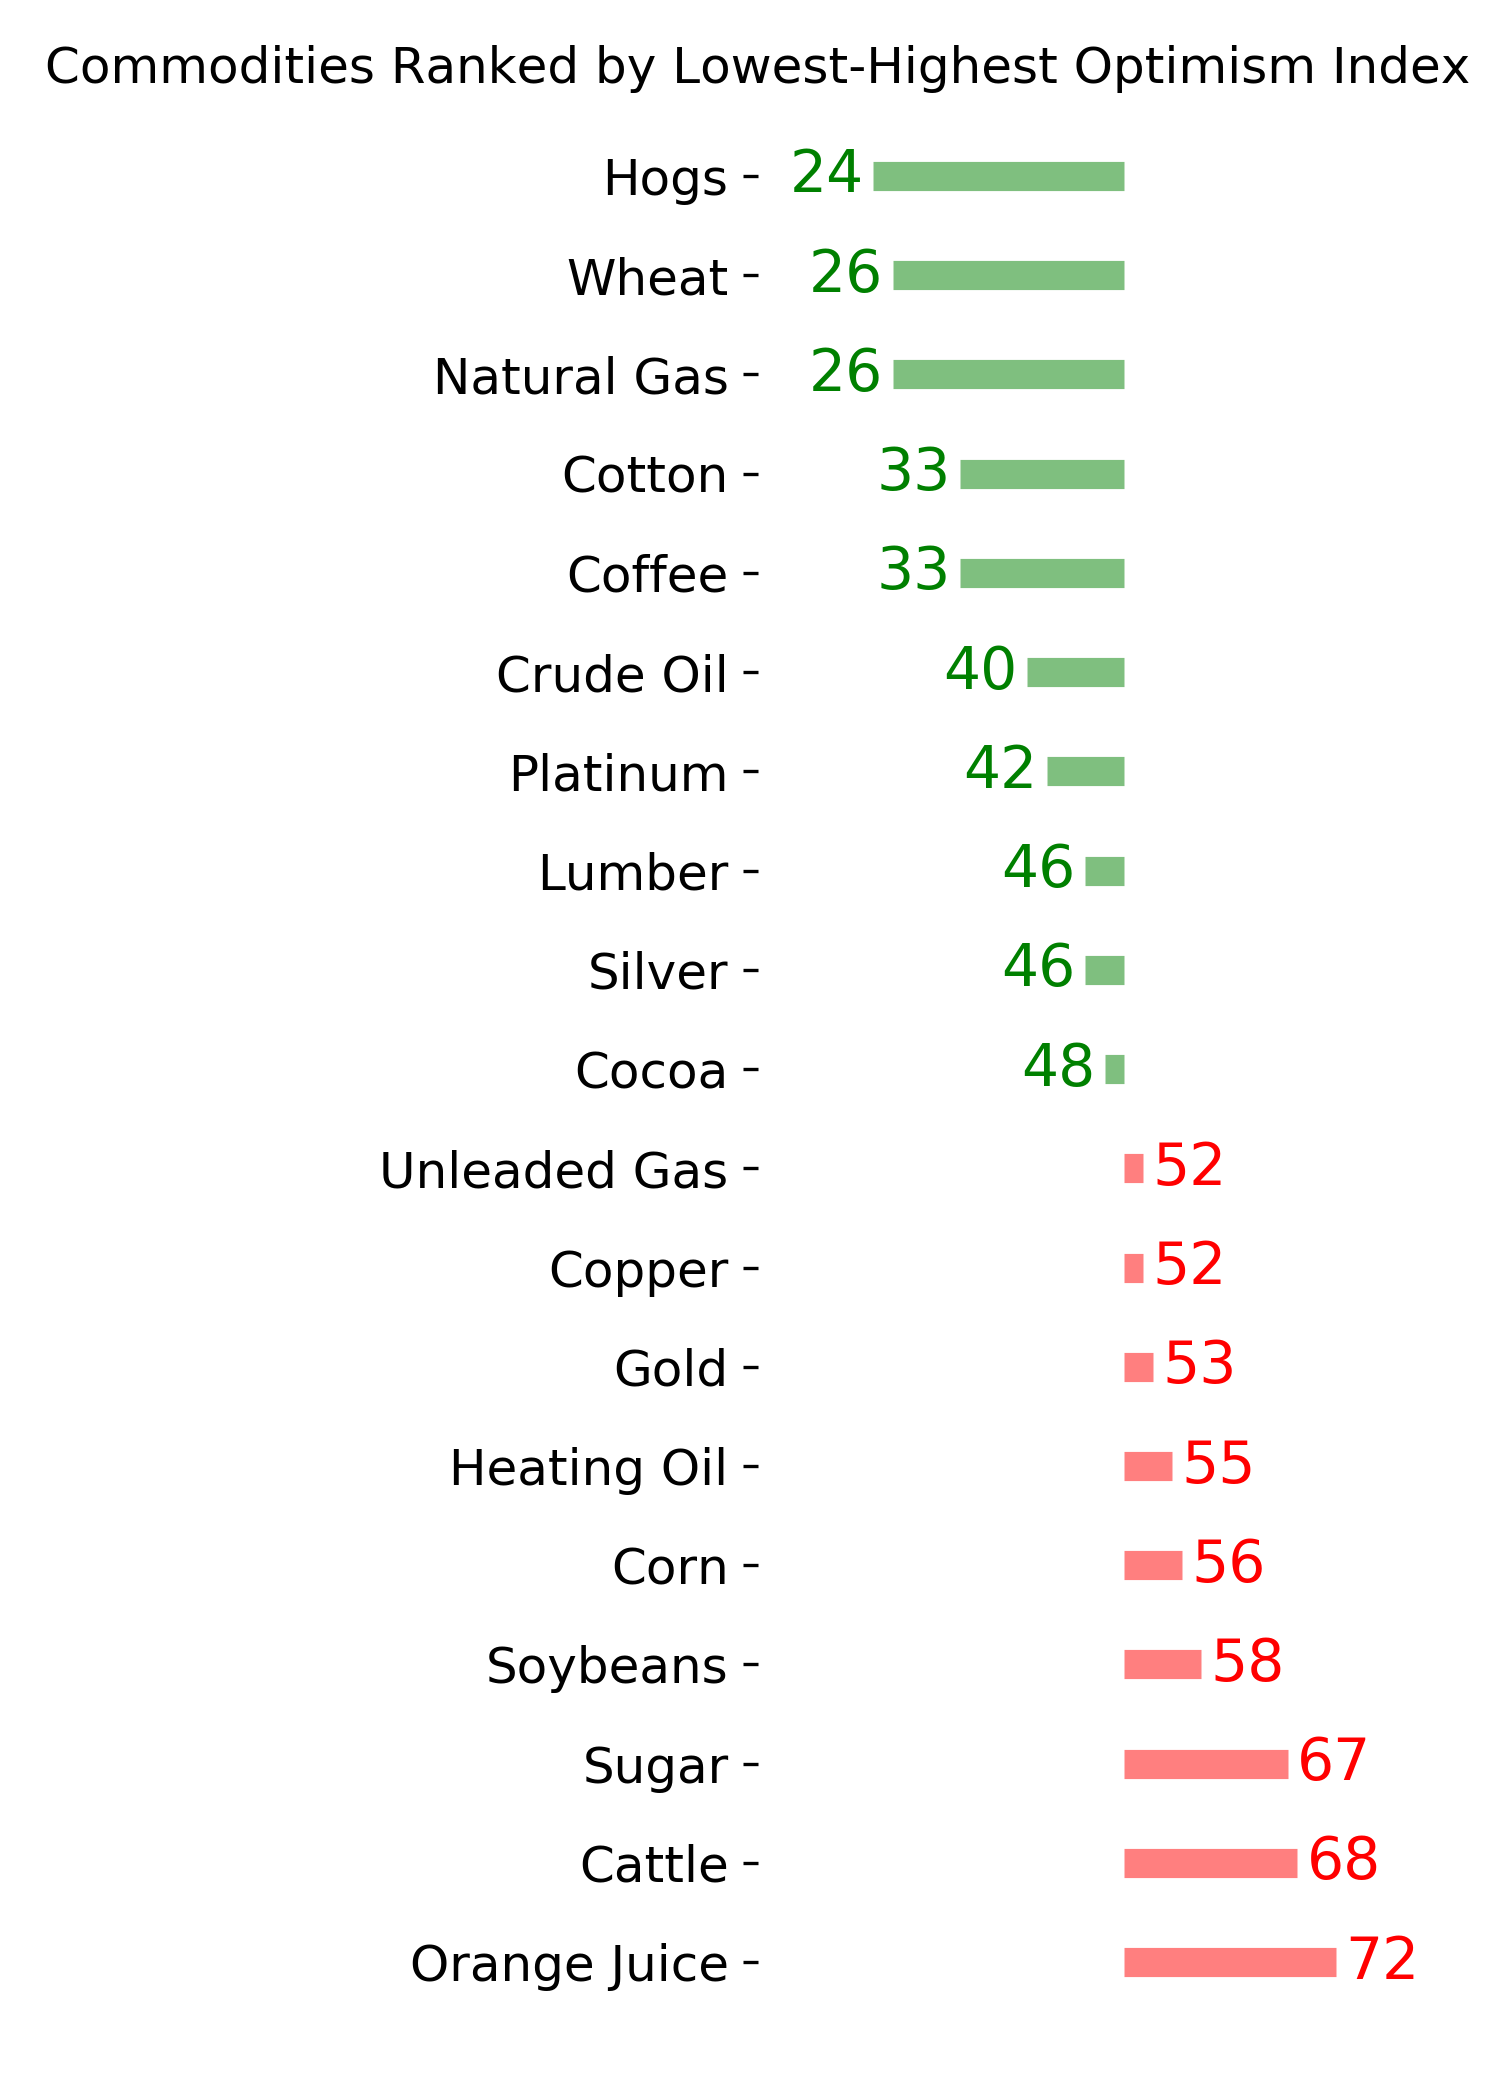
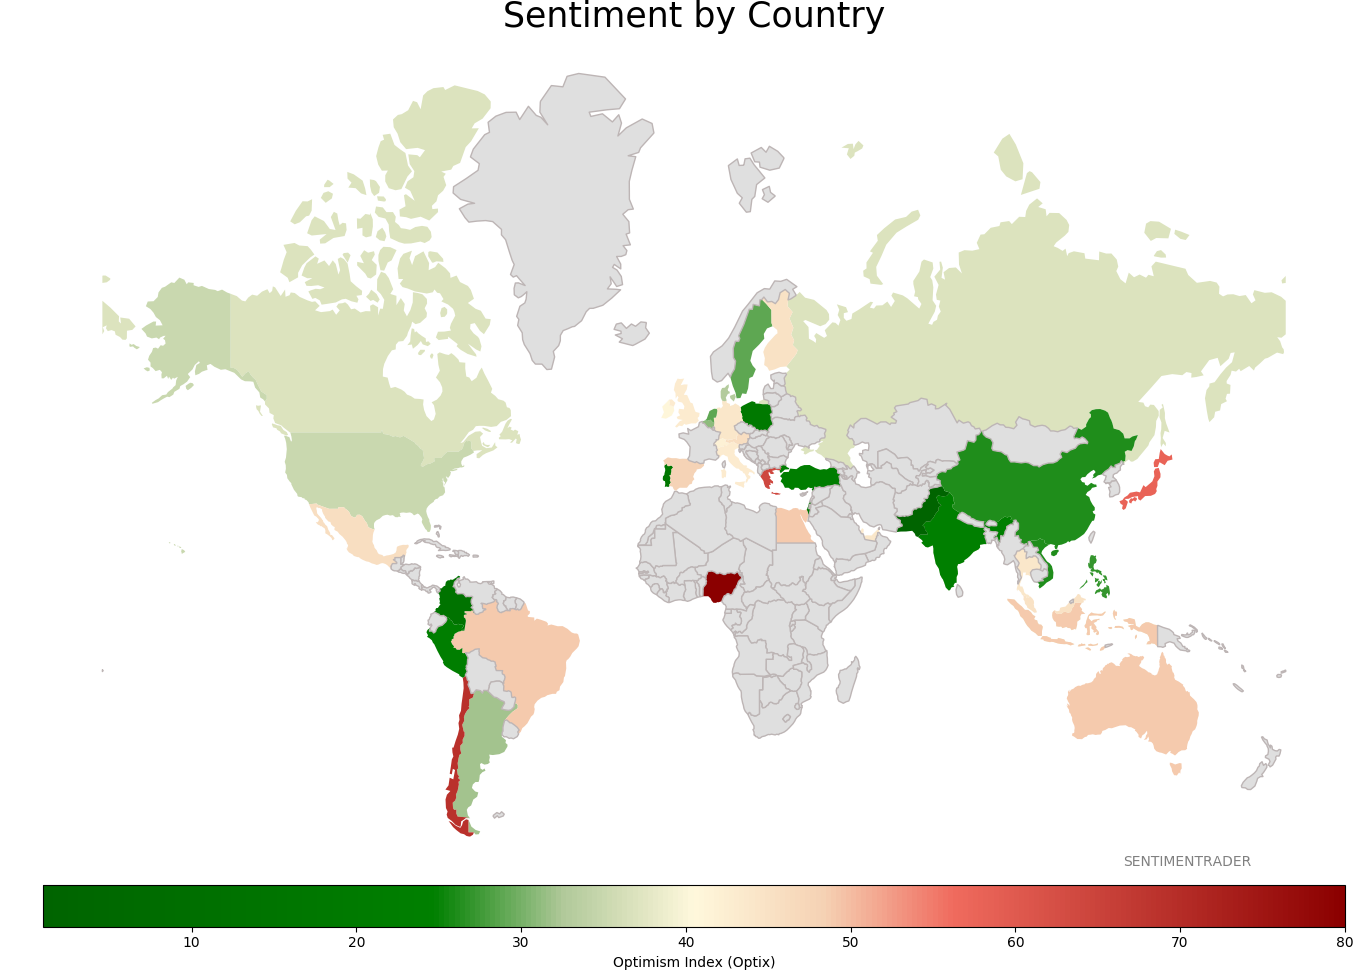
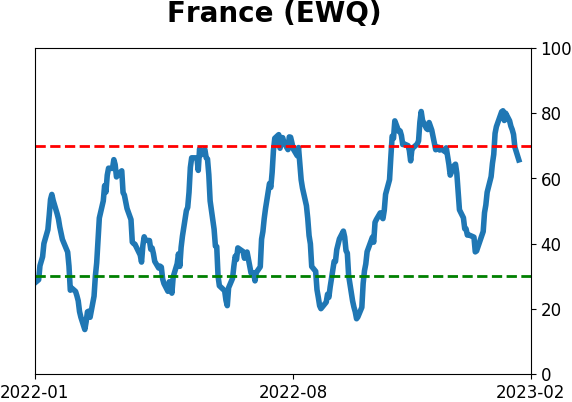
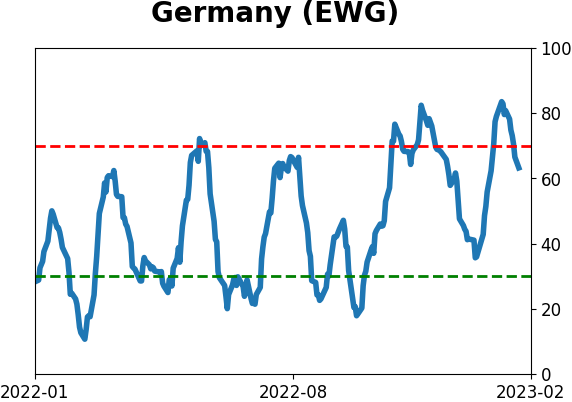
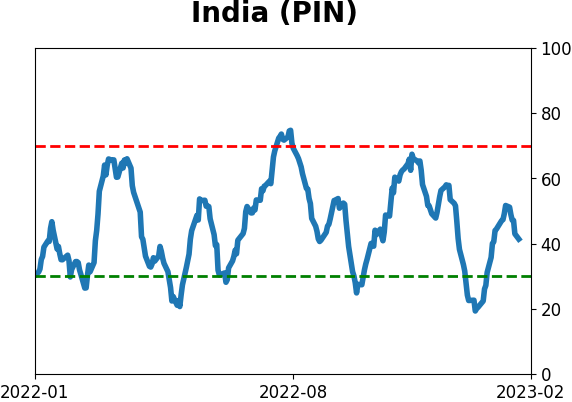
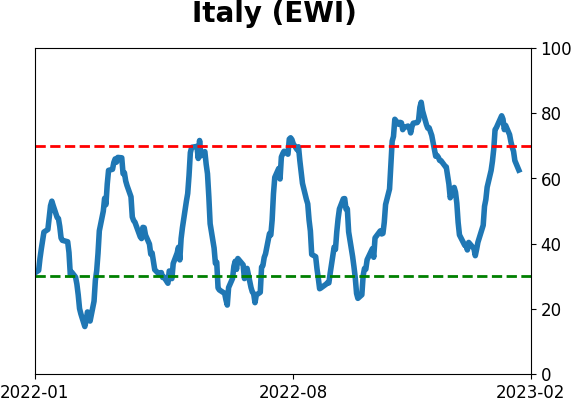
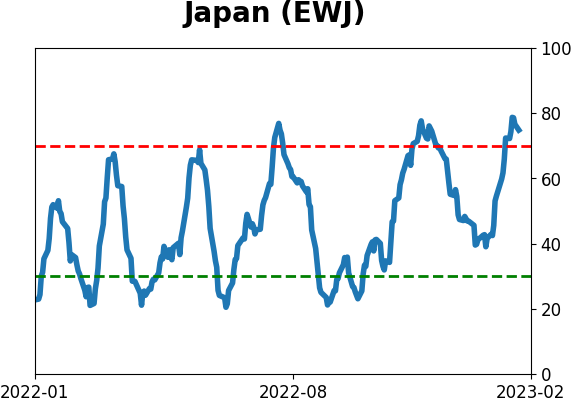
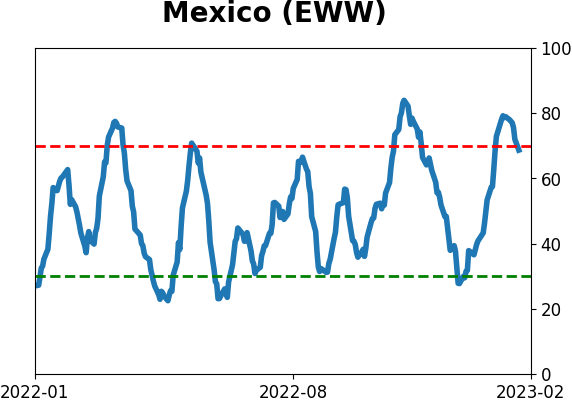
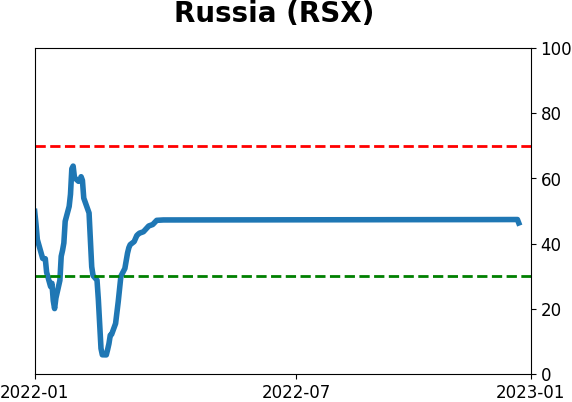
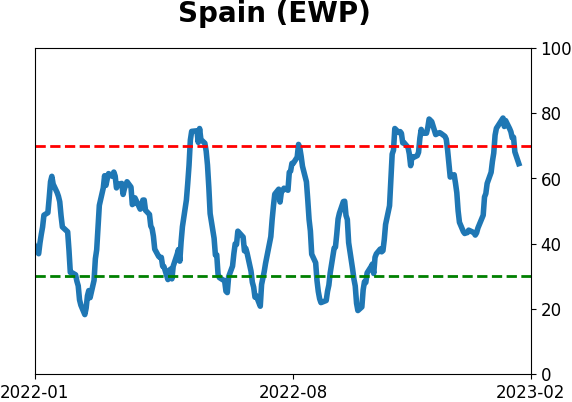
Sentiment Around The World
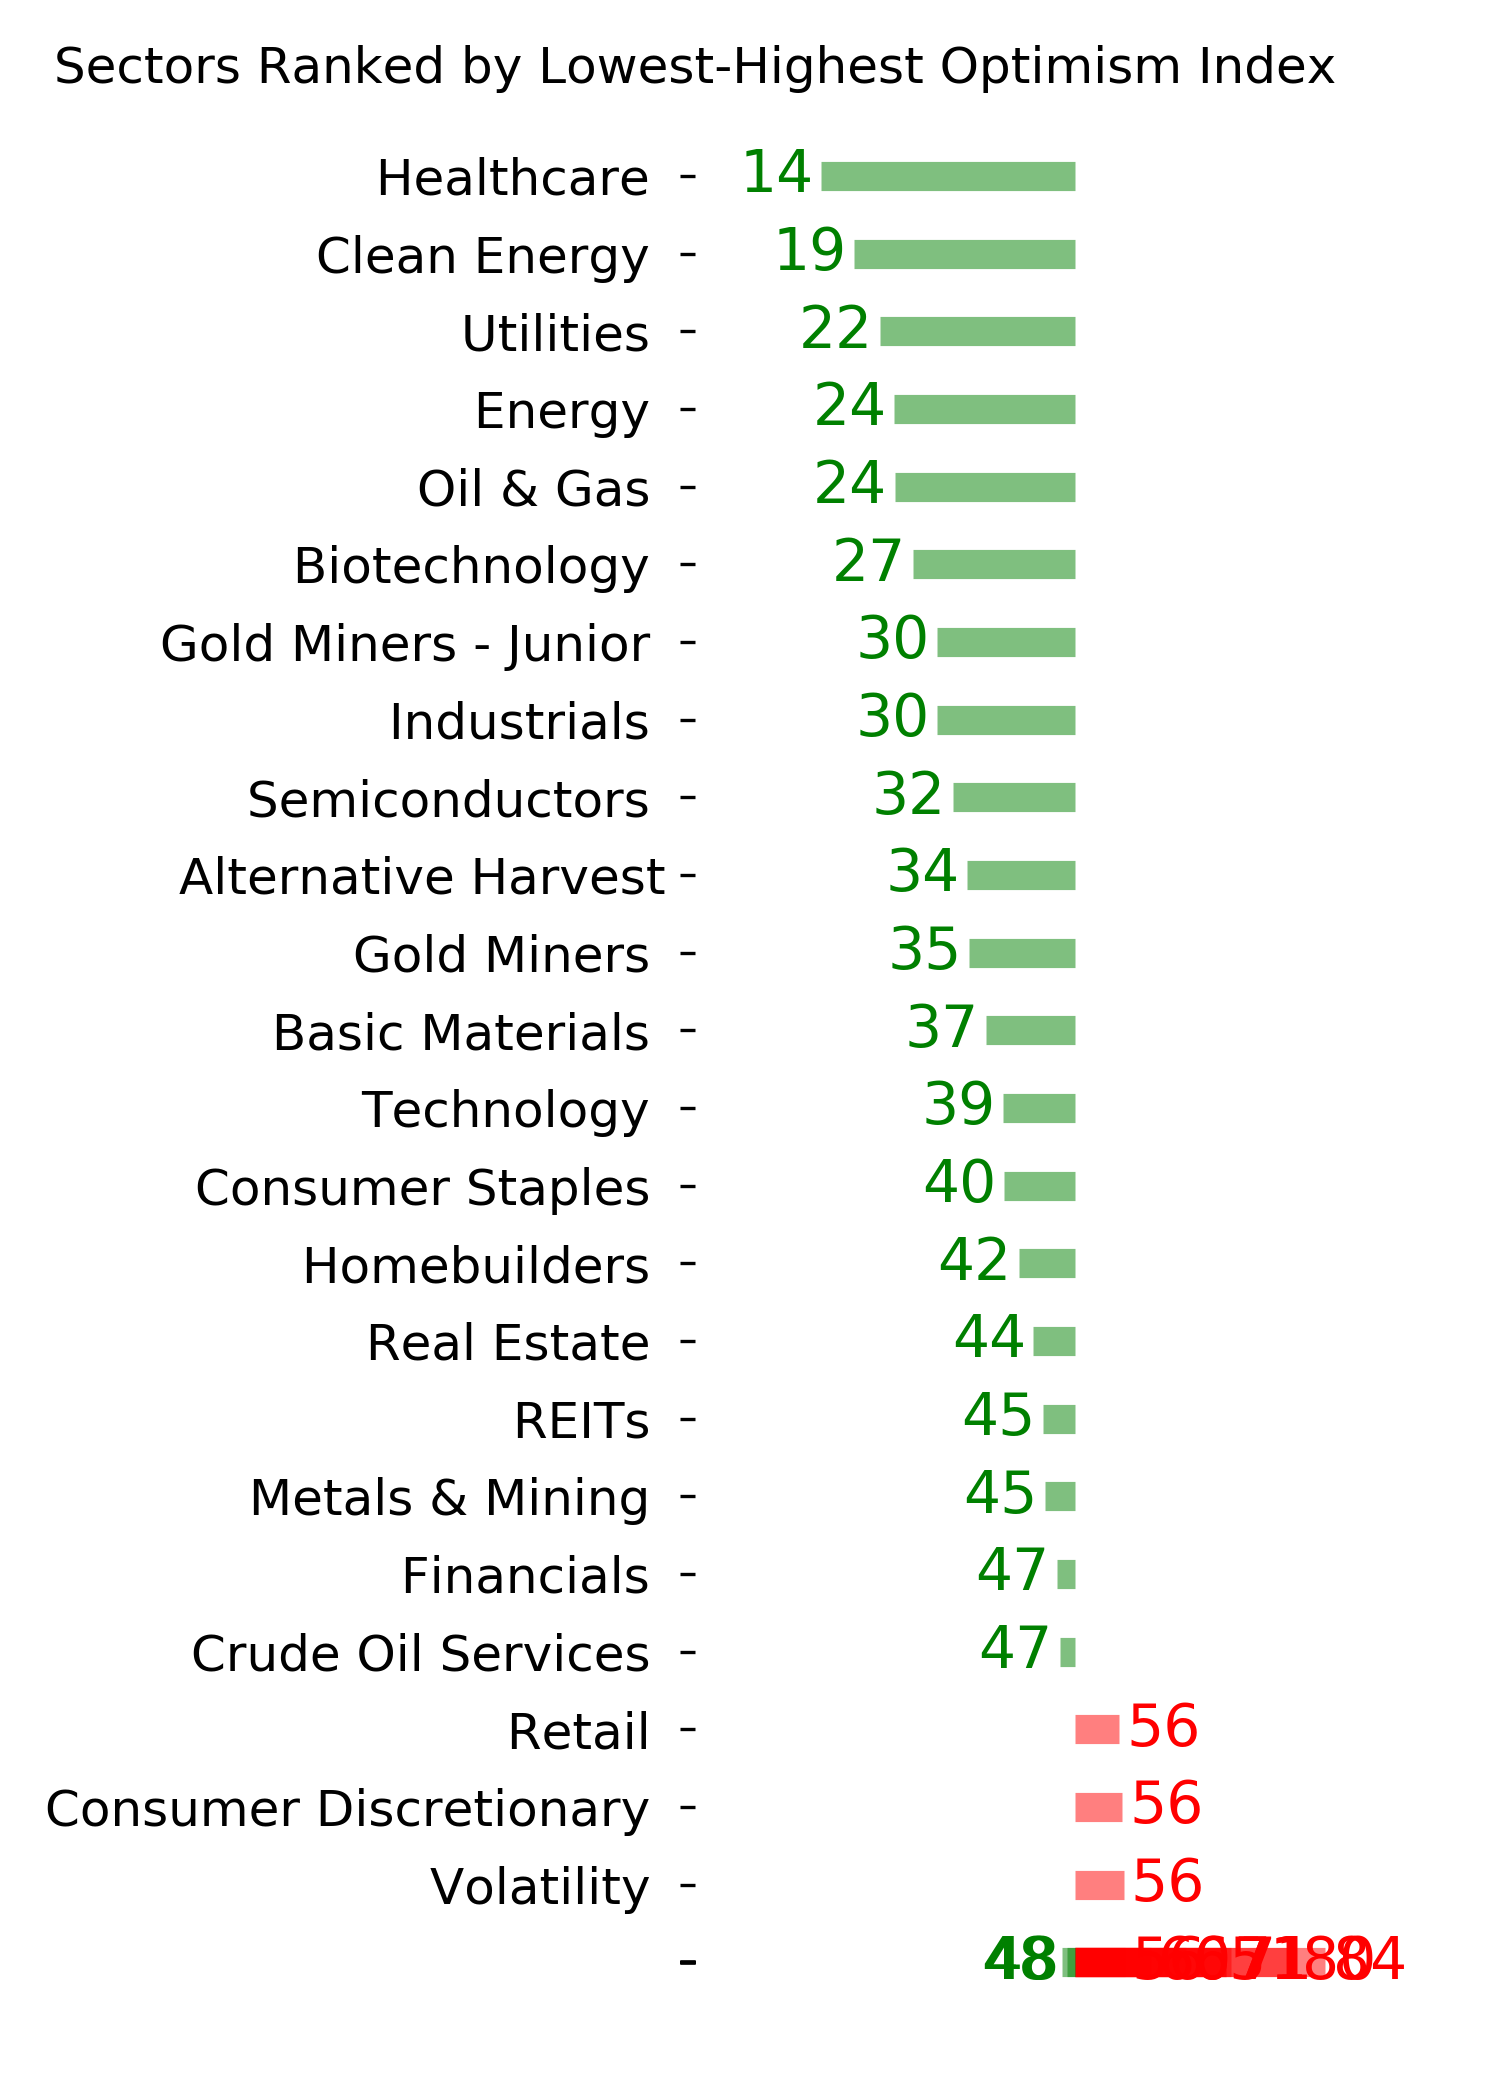
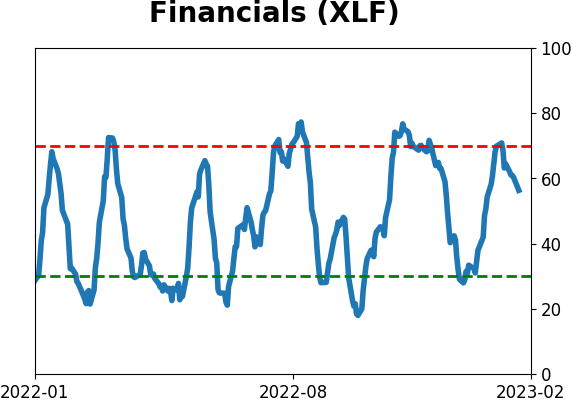
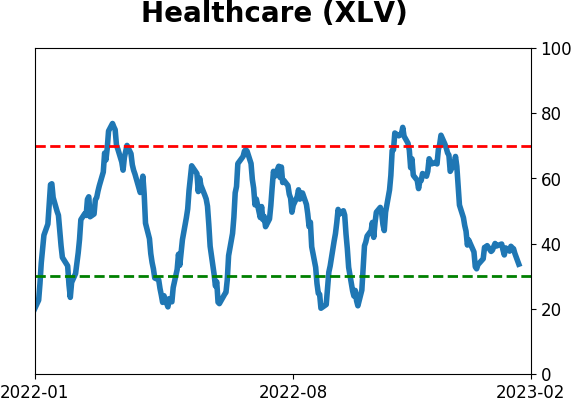
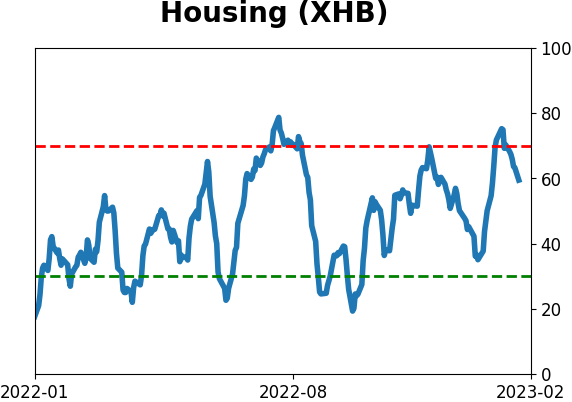
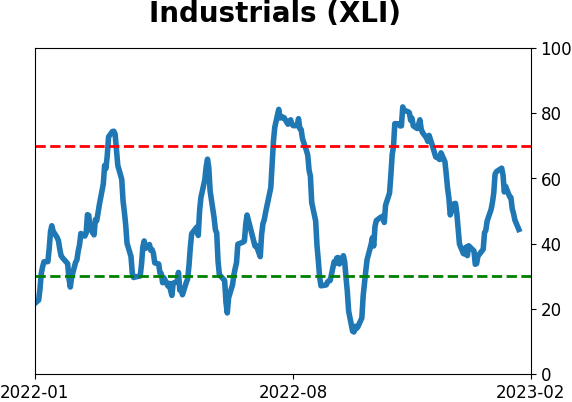
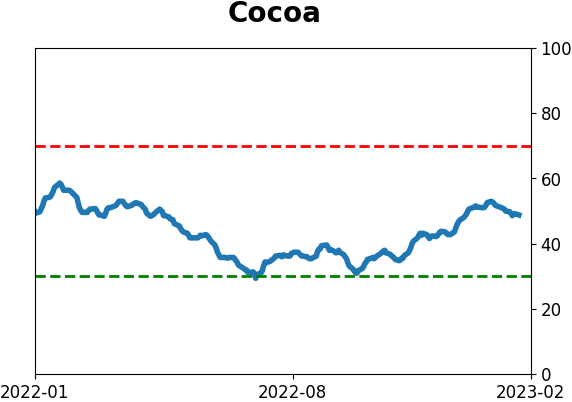
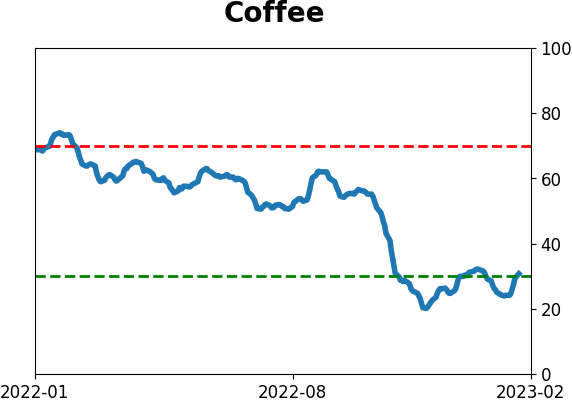
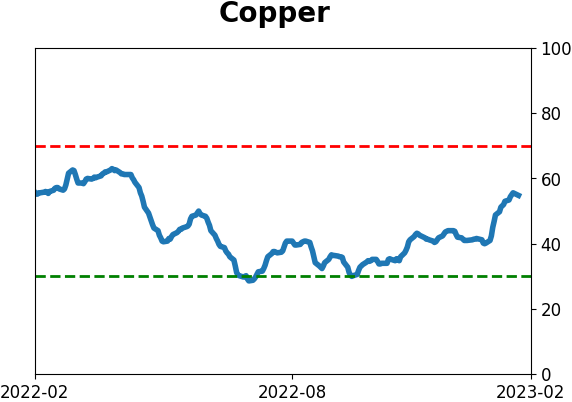
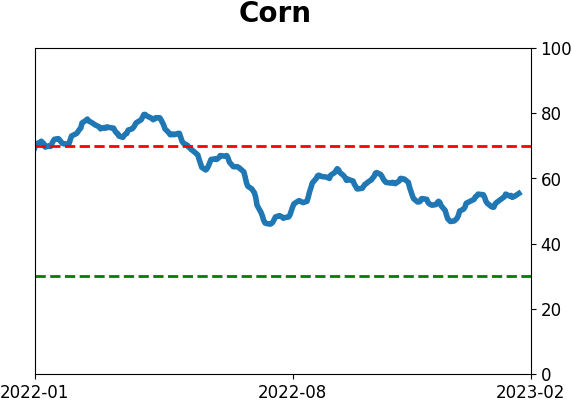
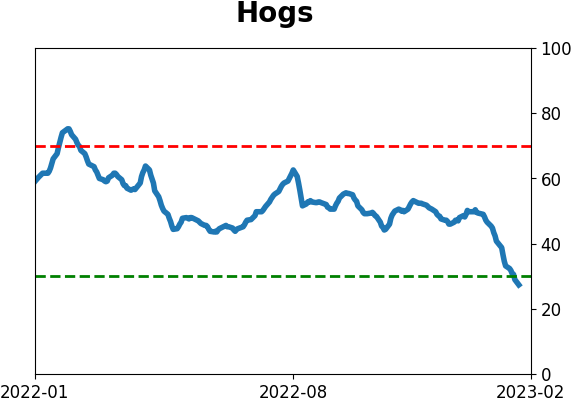
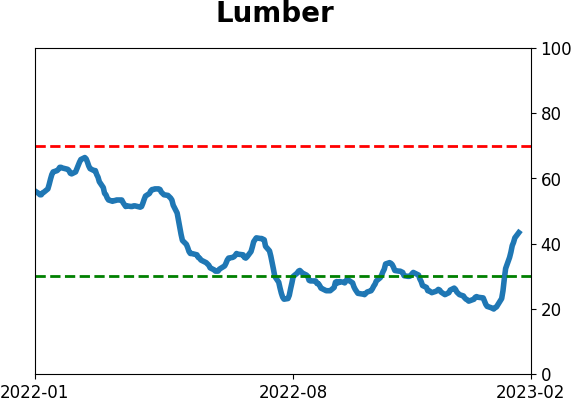
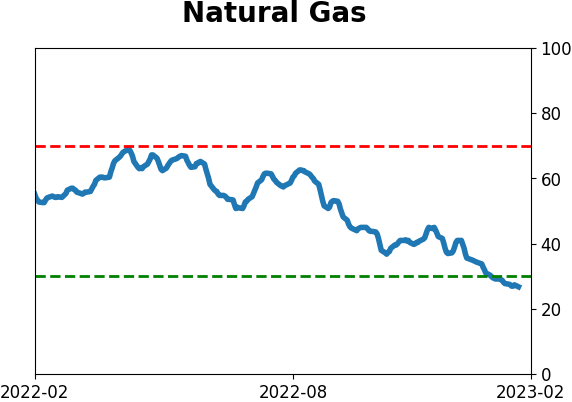
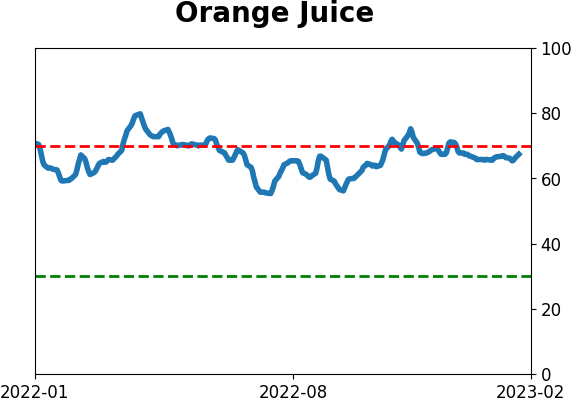
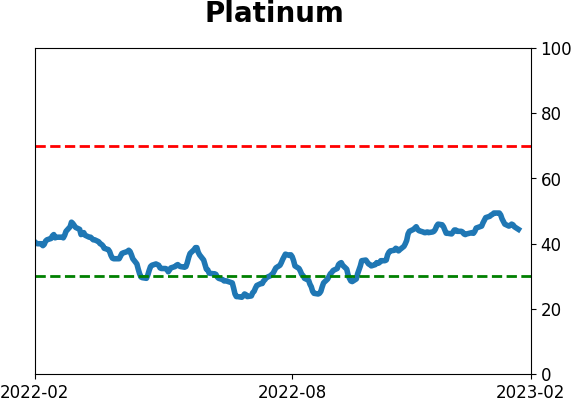
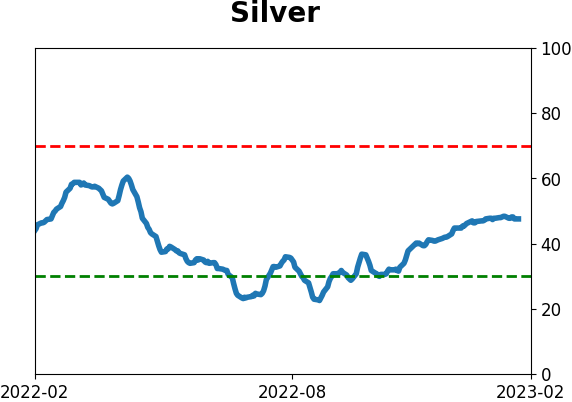
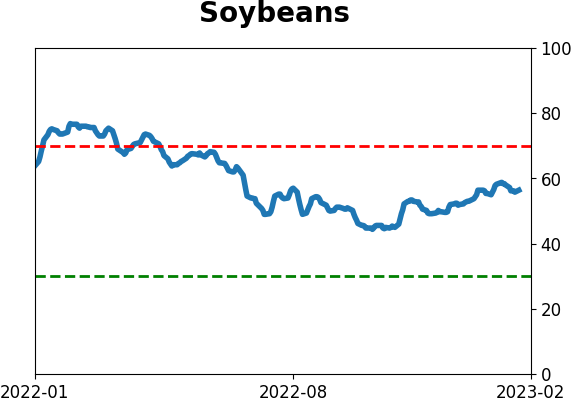
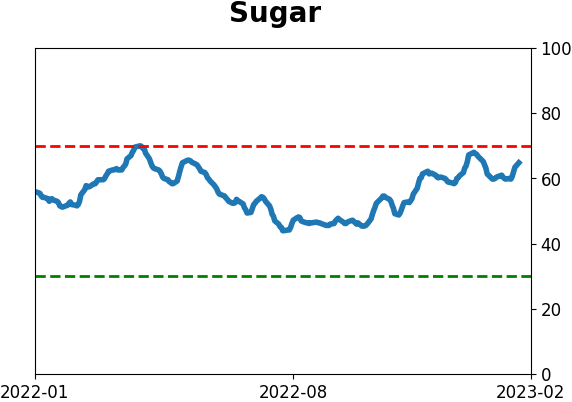
Optimism Index Thumbnails
|
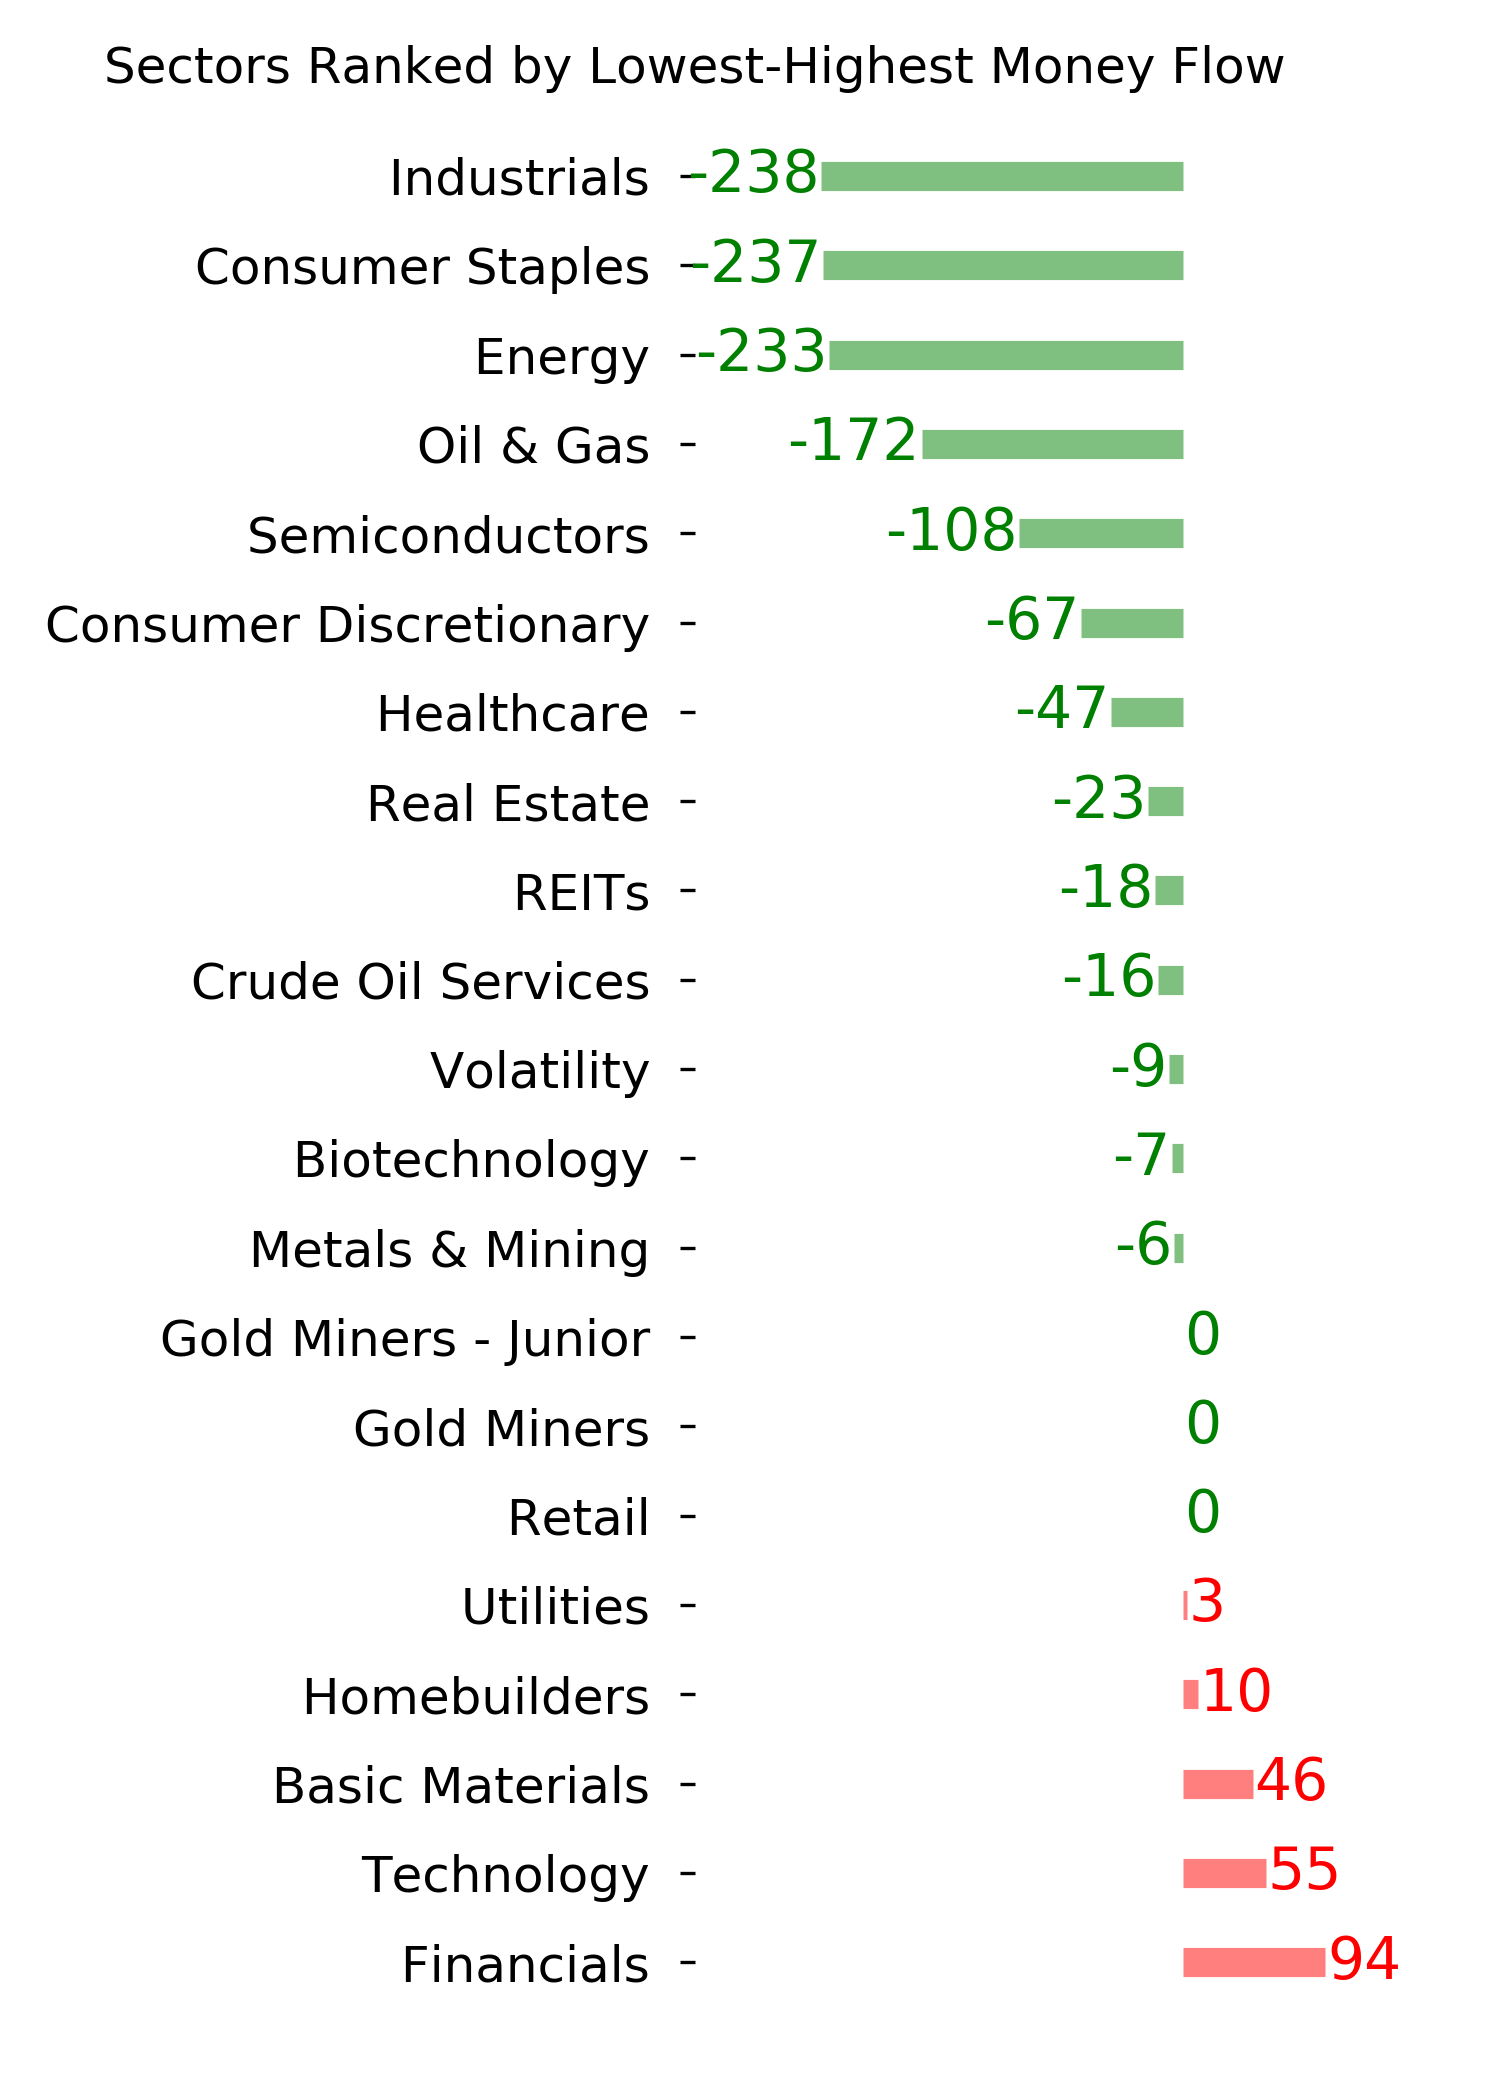
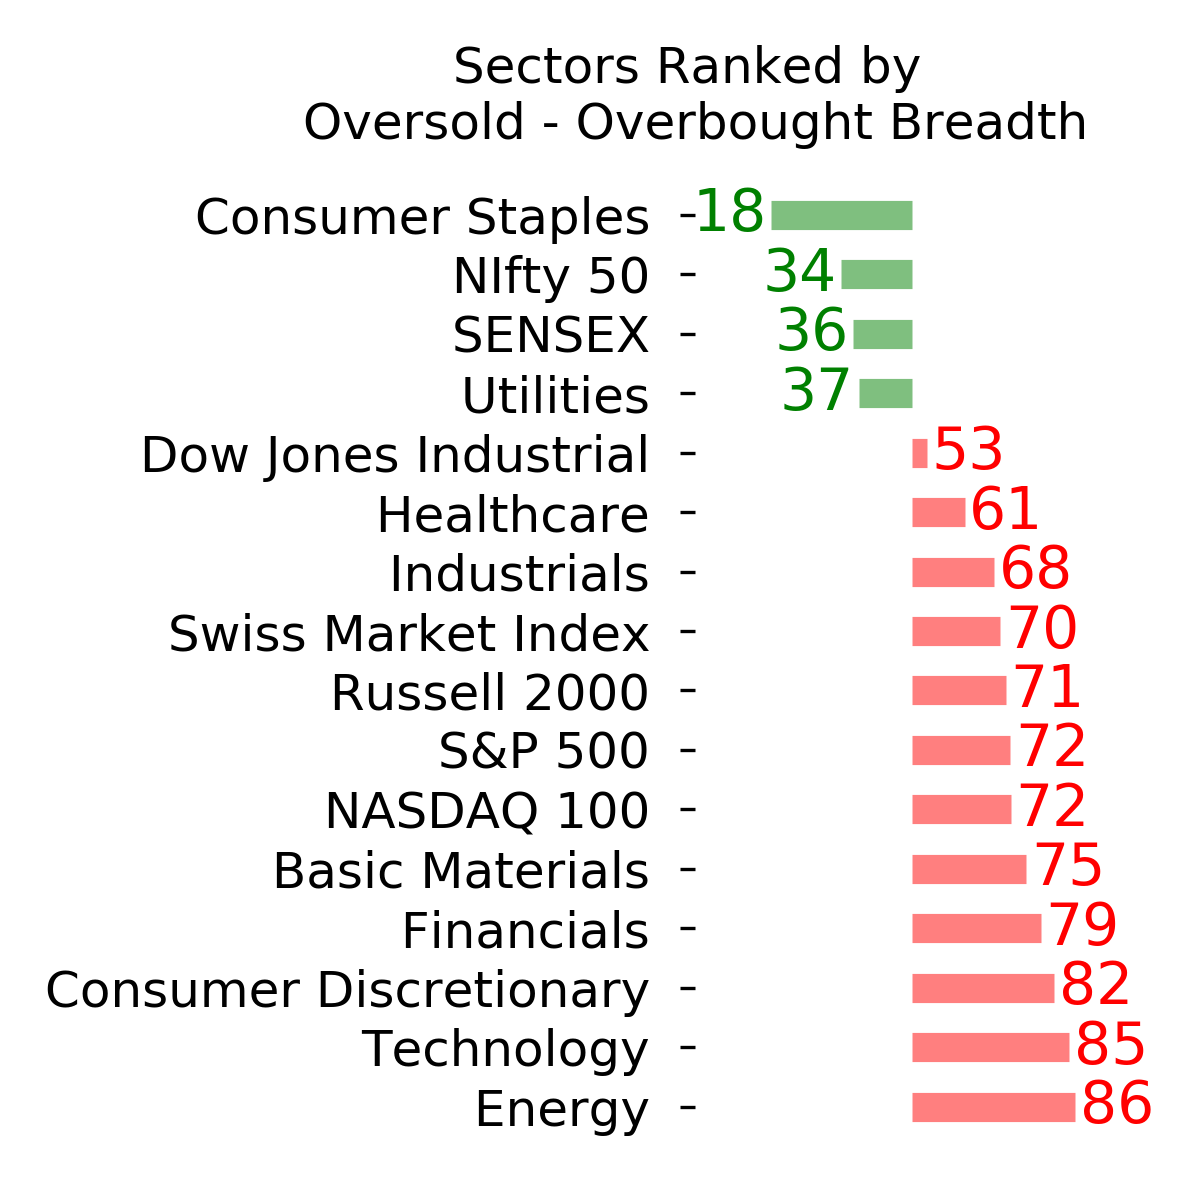
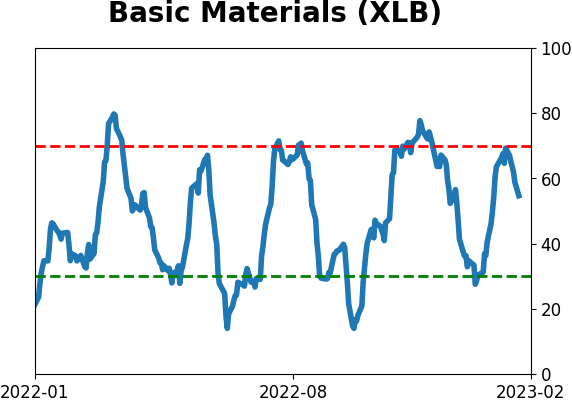
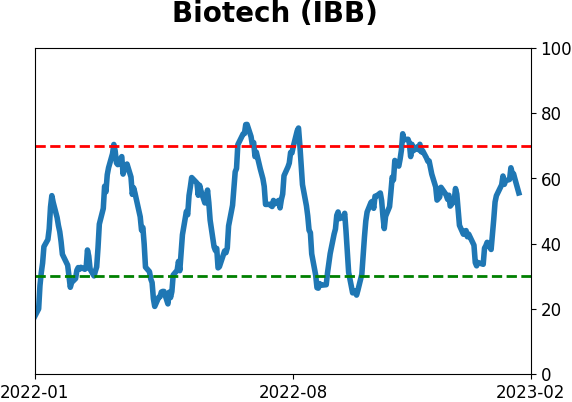
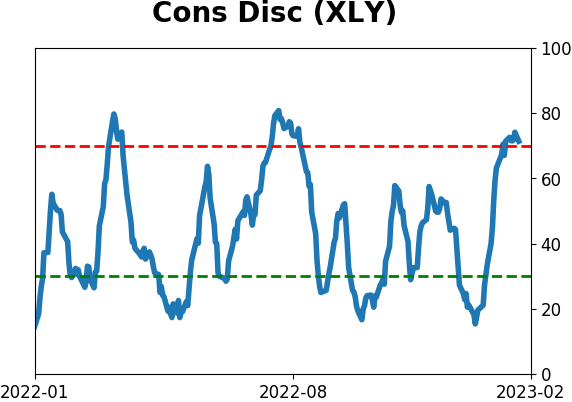
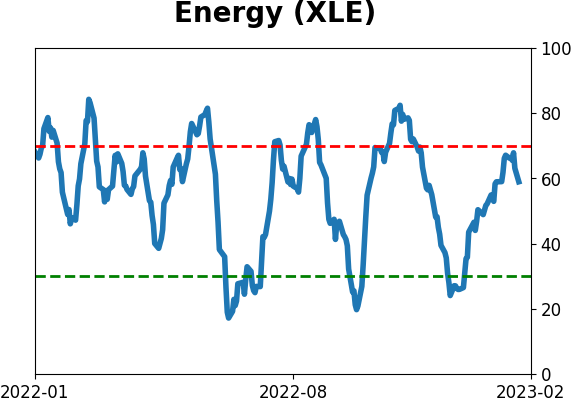
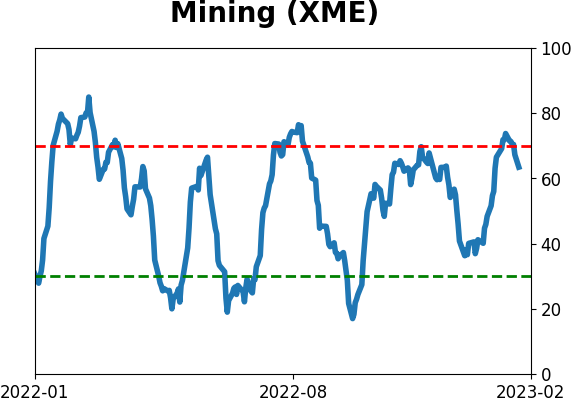
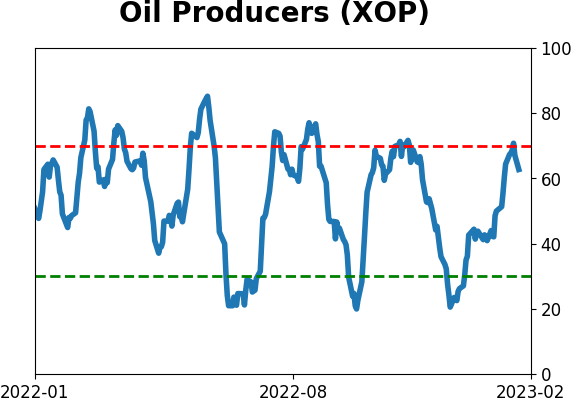
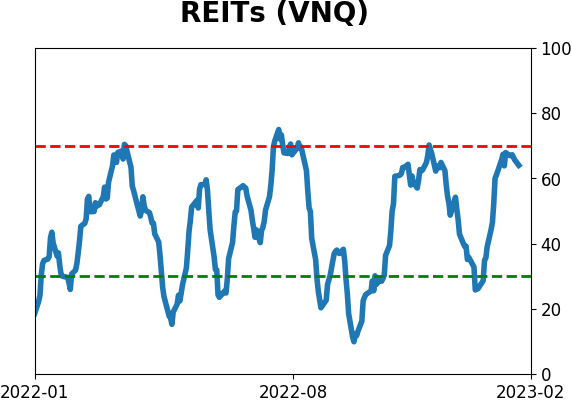
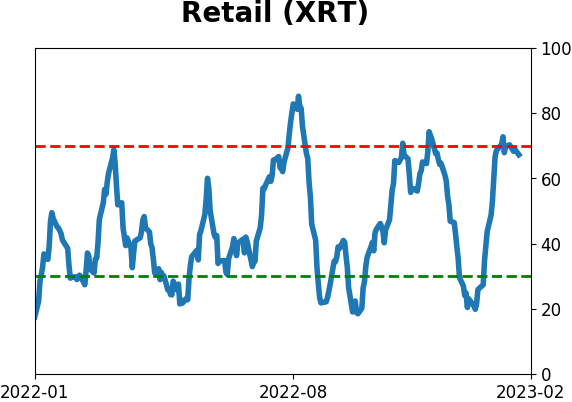
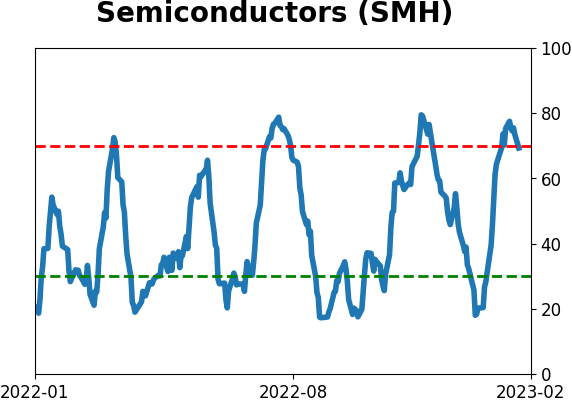
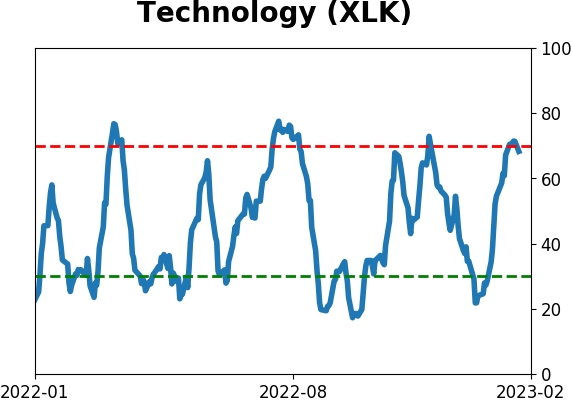
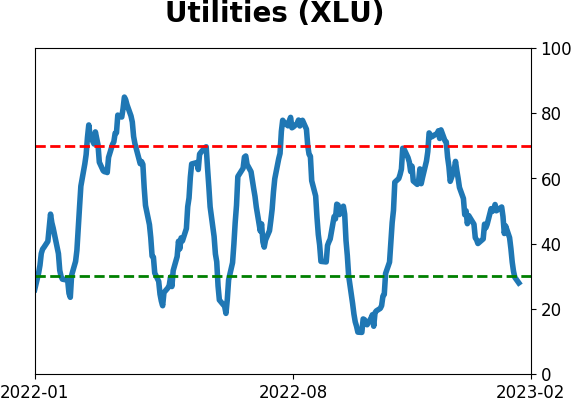
Sector ETF's - 10-Day Moving Average
|
|
|
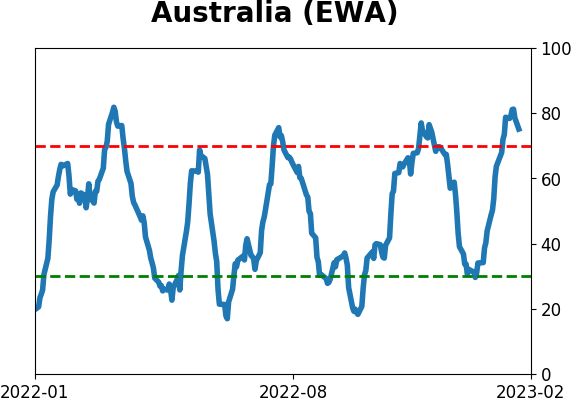
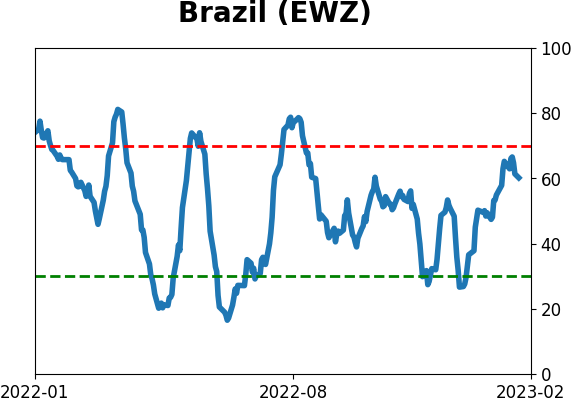
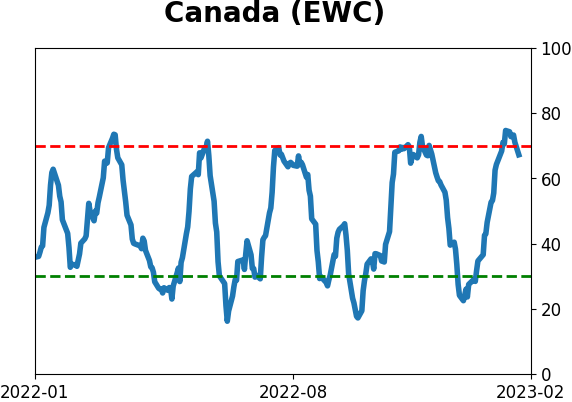
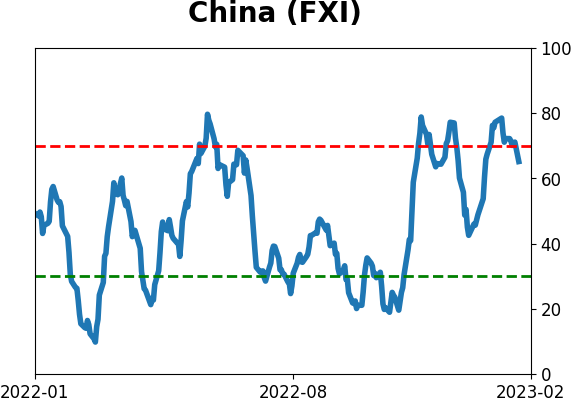
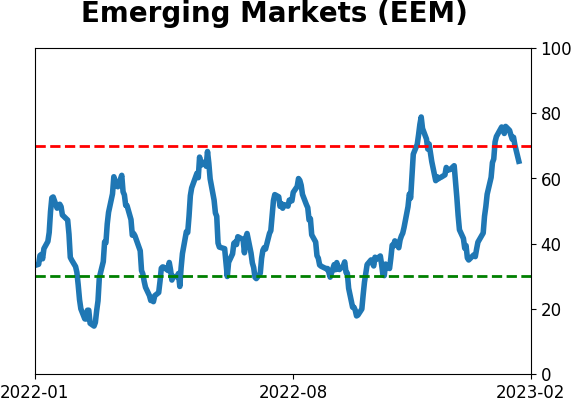
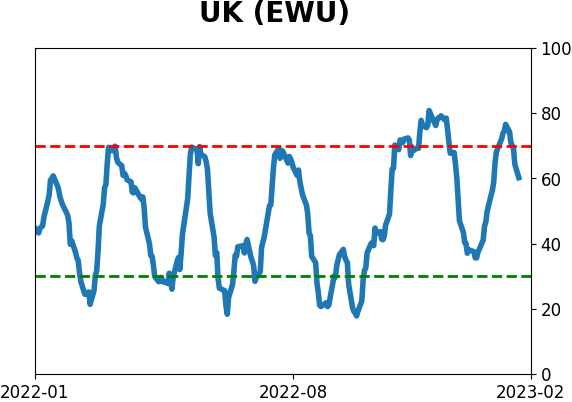
Country ETF's - 10-Day Moving Average
|
|
|
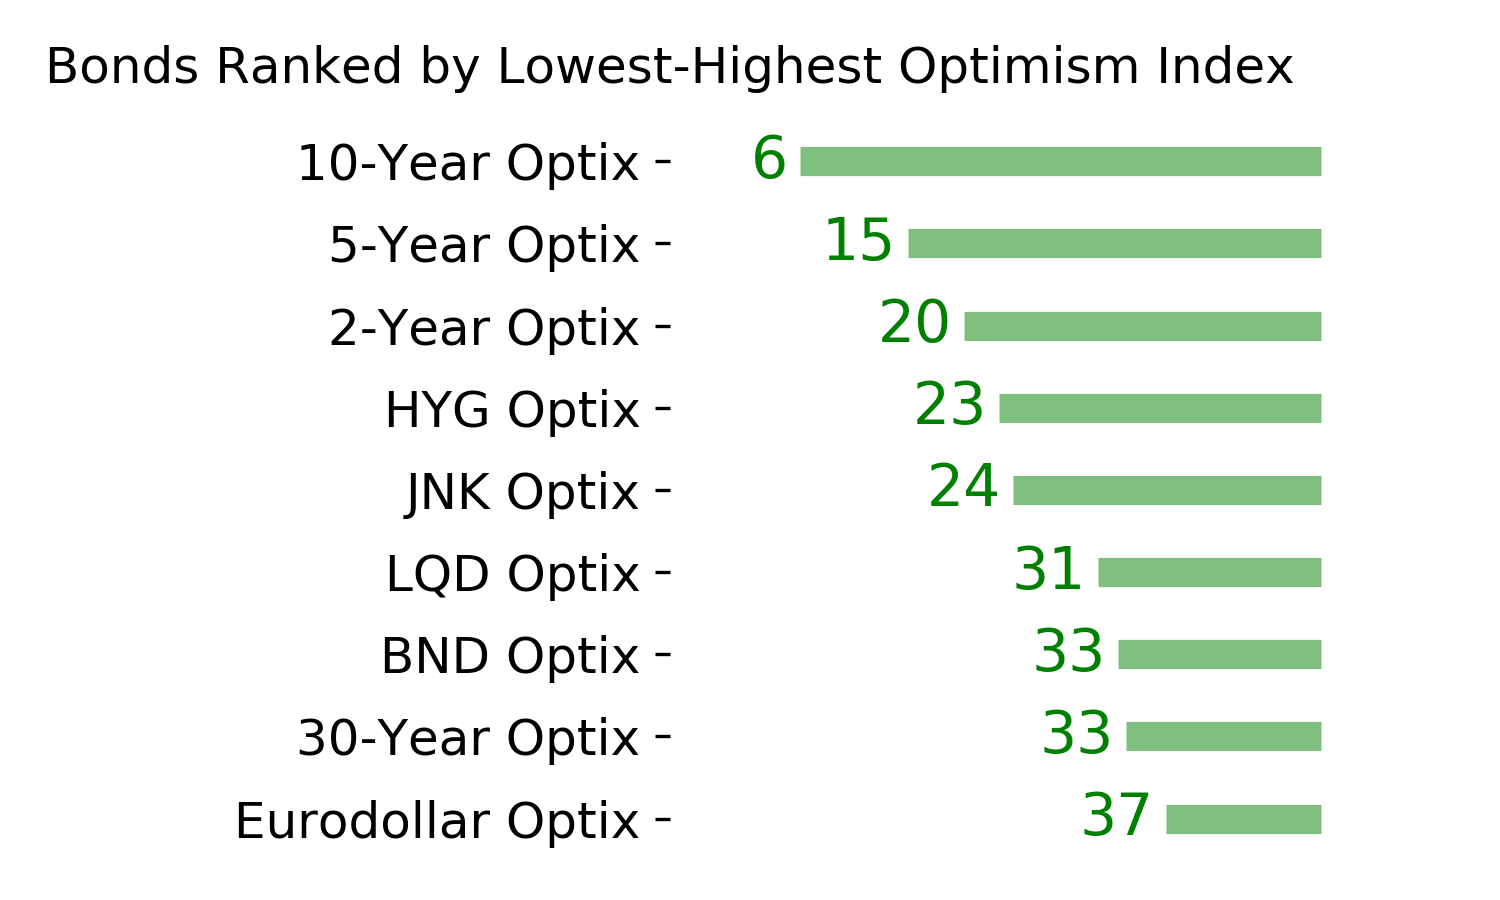
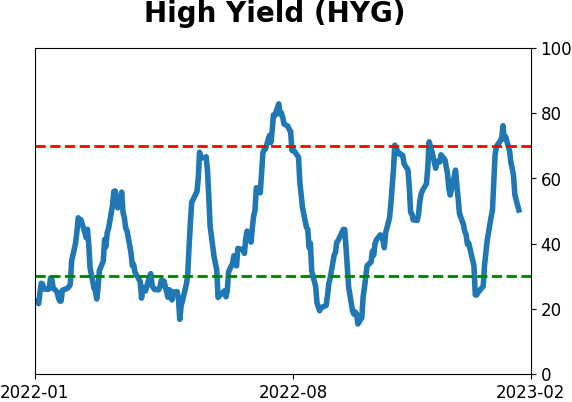
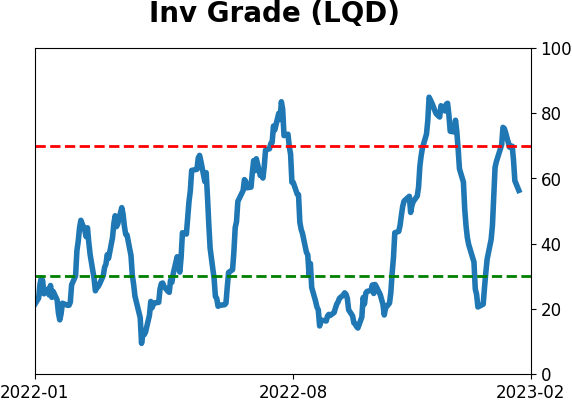
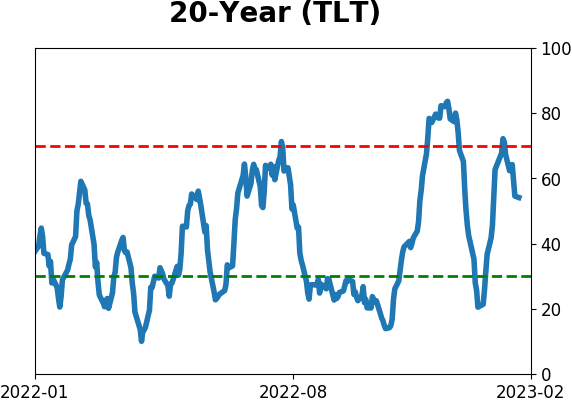
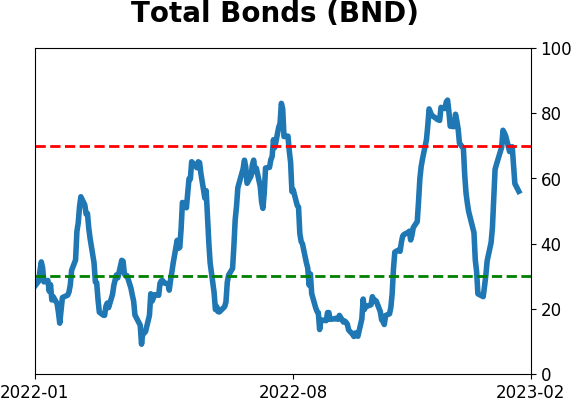
Bond ETF's - 10-Day Moving Average
|
|
|
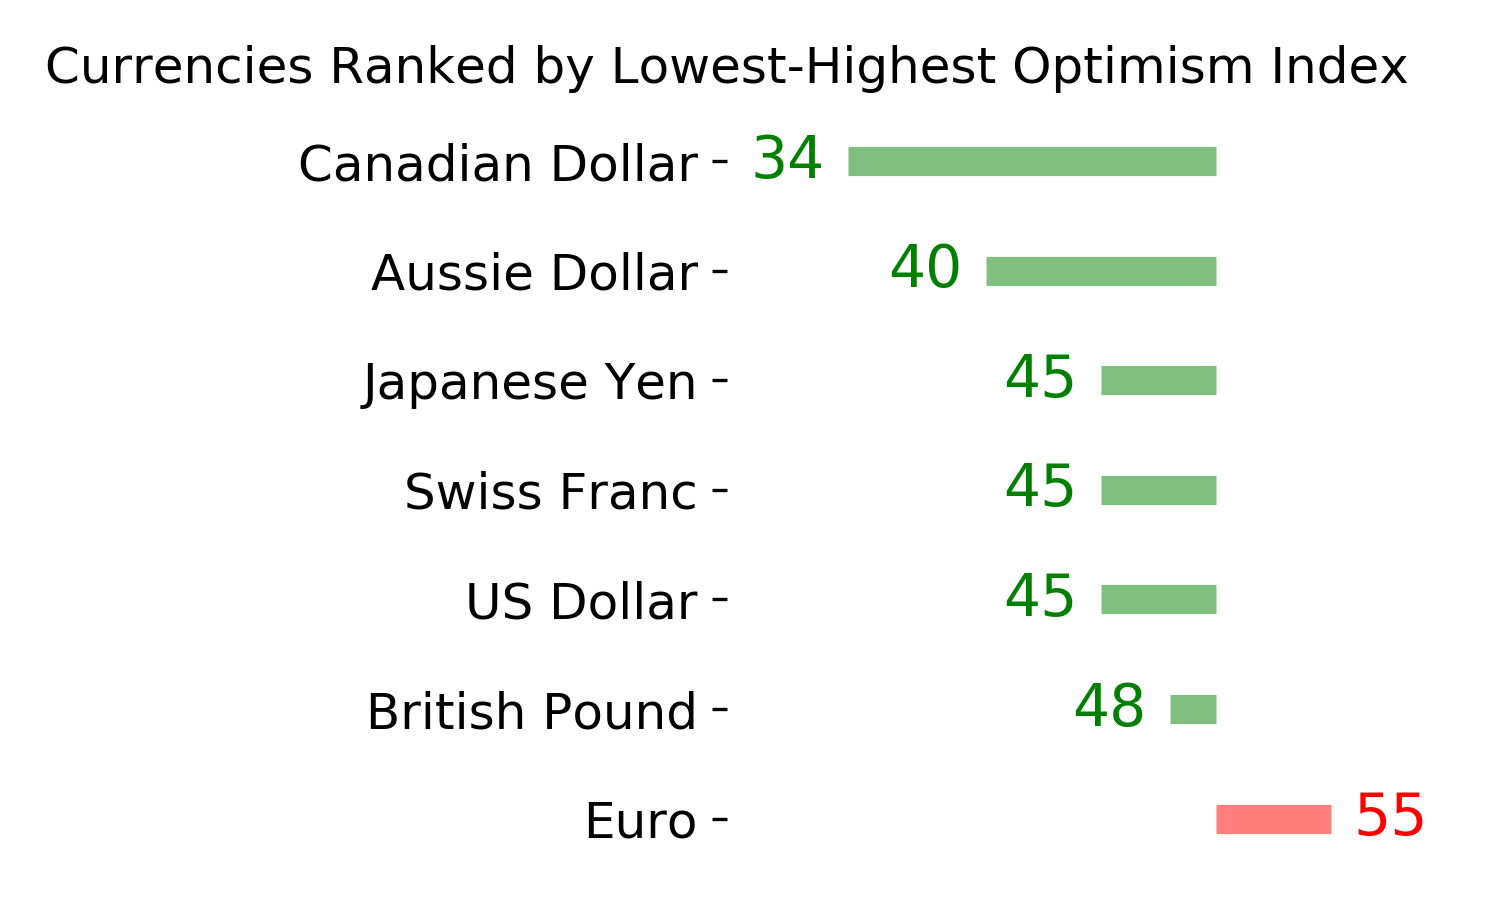
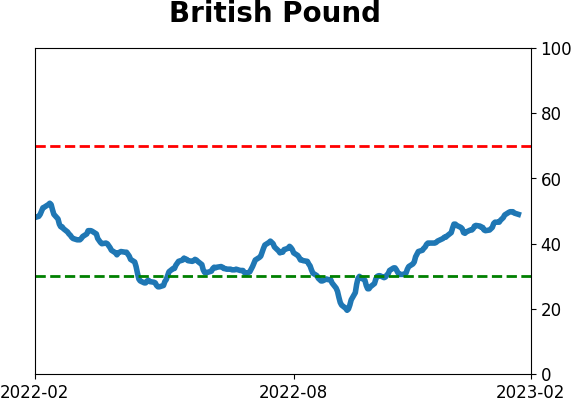
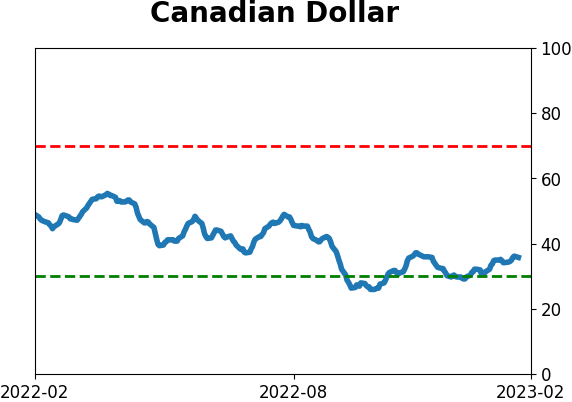
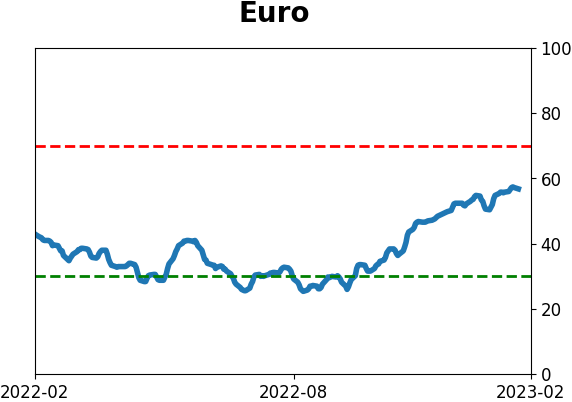
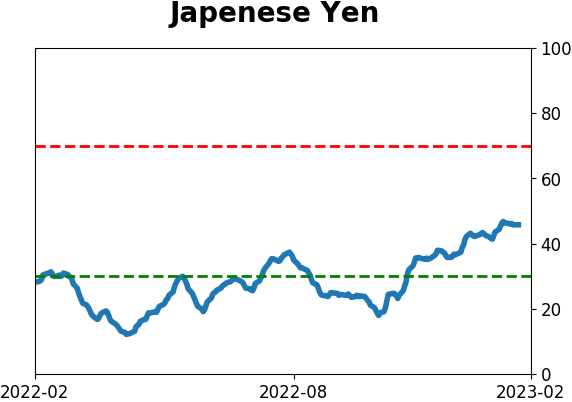
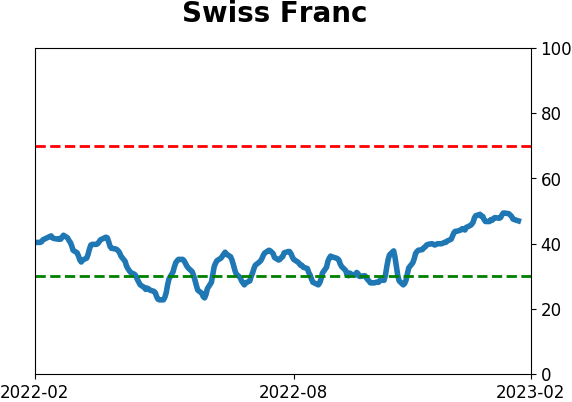
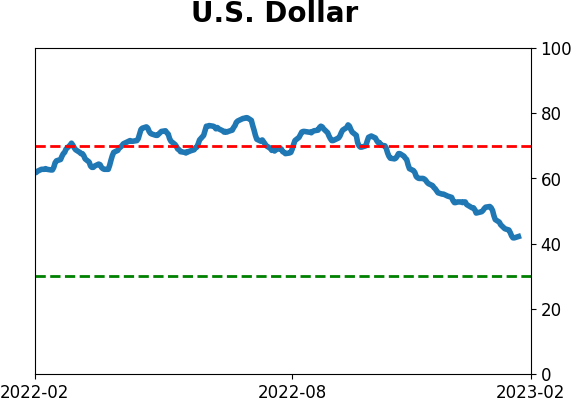
Currency ETF's - 5-Day Moving Average
|
|
|
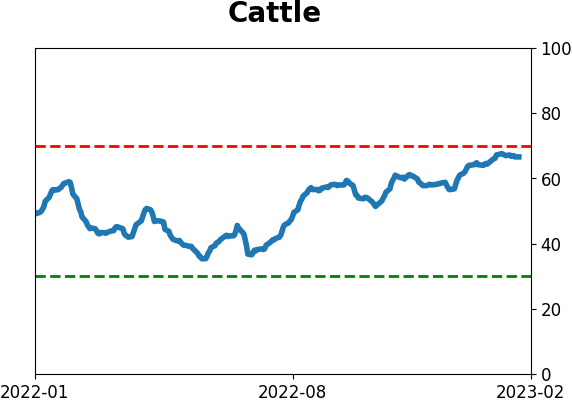
Commodity ETF's - 5-Day Moving Average
|
|