Headlines
|
|
A new high...but with heavy selling pressure:
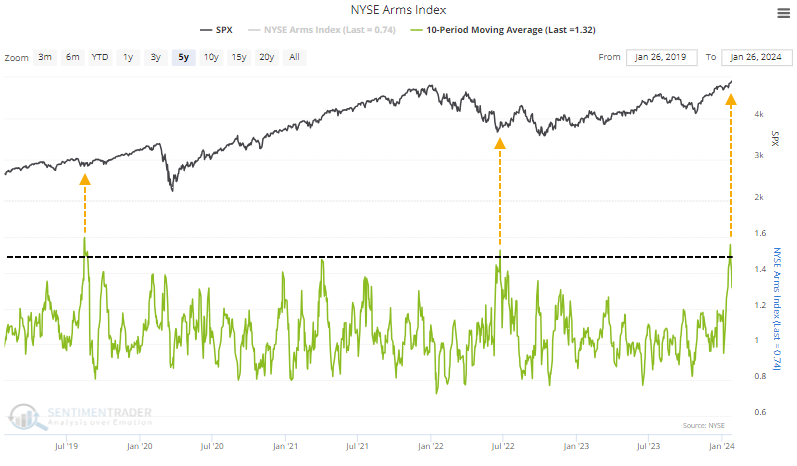
The S&P 500 recorded multiple new highs last week, yet an indicator of underlying selling pressure spiked to an extremely high level. It's unprecedented to see the Arms Index above 1.5 when the S&P is at a high, as it almost always triggers after a decline. The implications are positive, but with an asterisk.
|
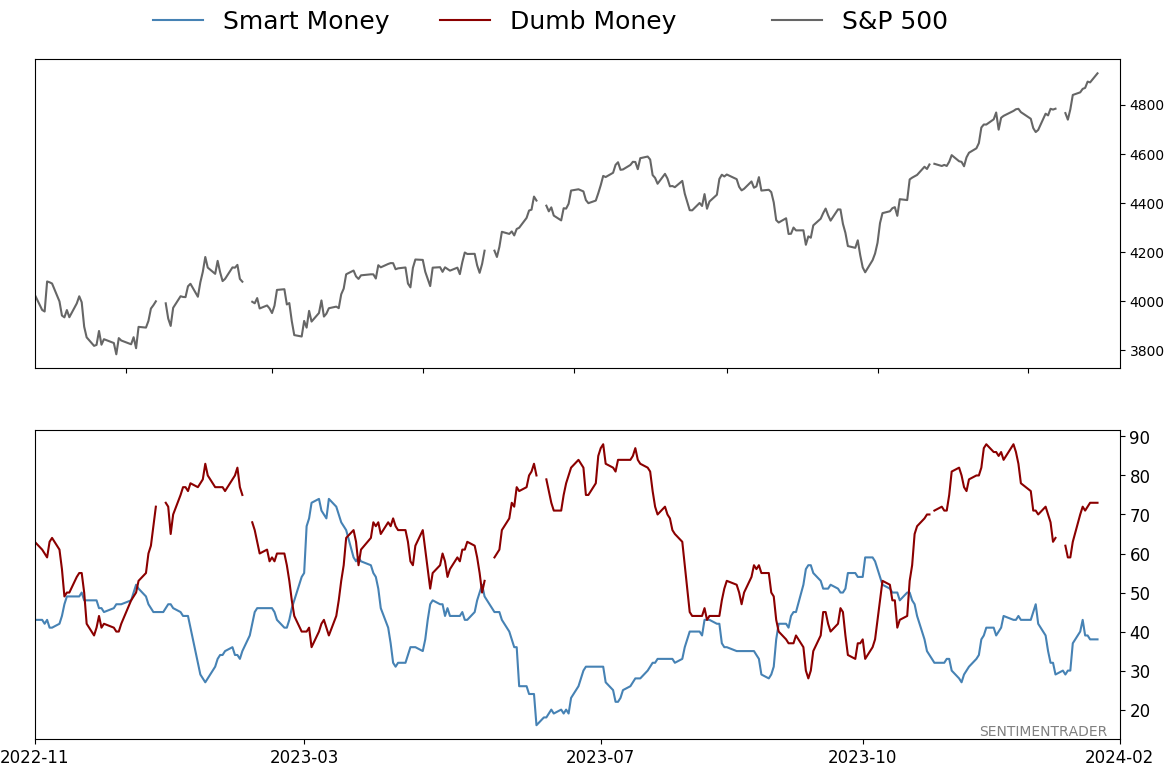
Smart / Dumb Money Confidence
|
Smart Money Confidence: 38%
Dumb Money Confidence: 73%
|
|
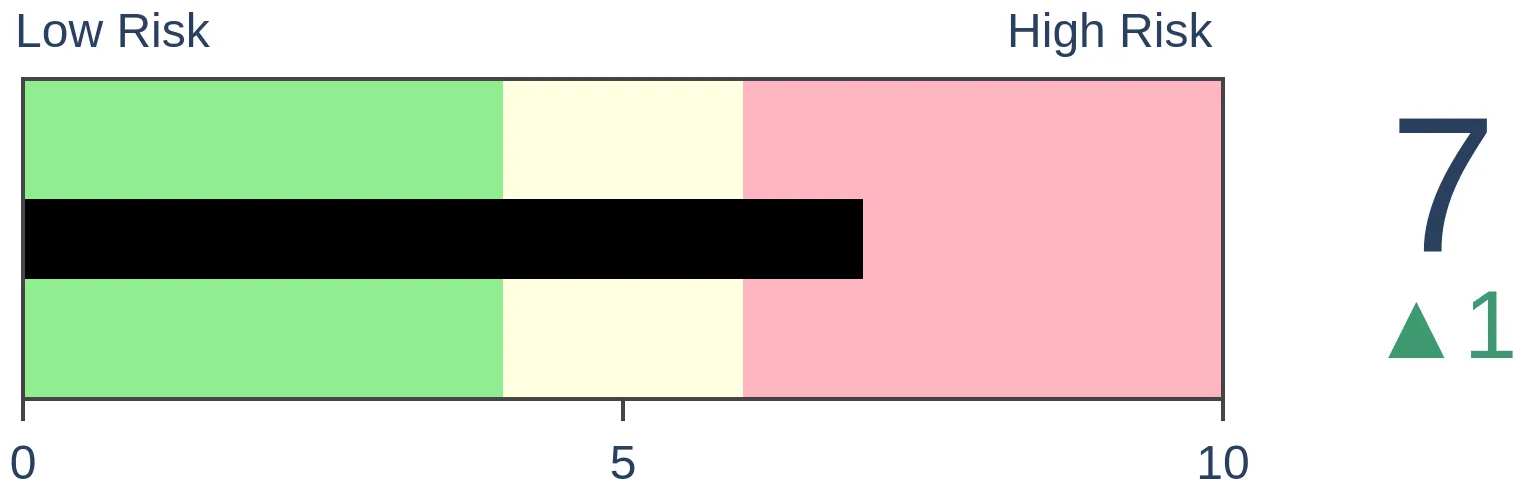
Risk Levels
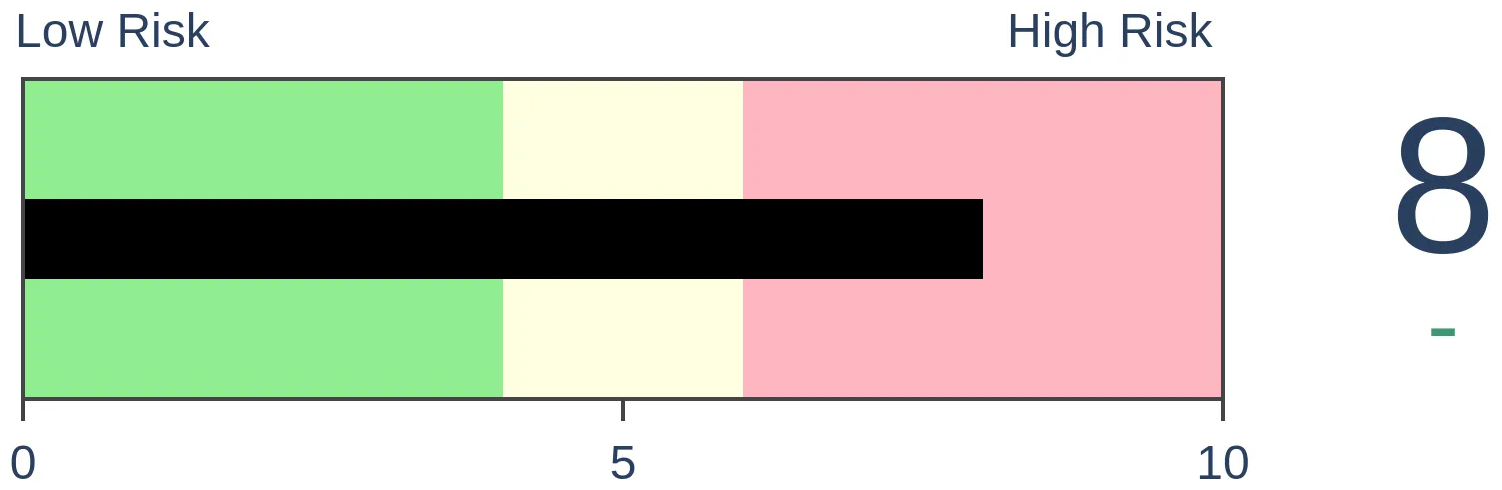
Stocks Short-Term
|
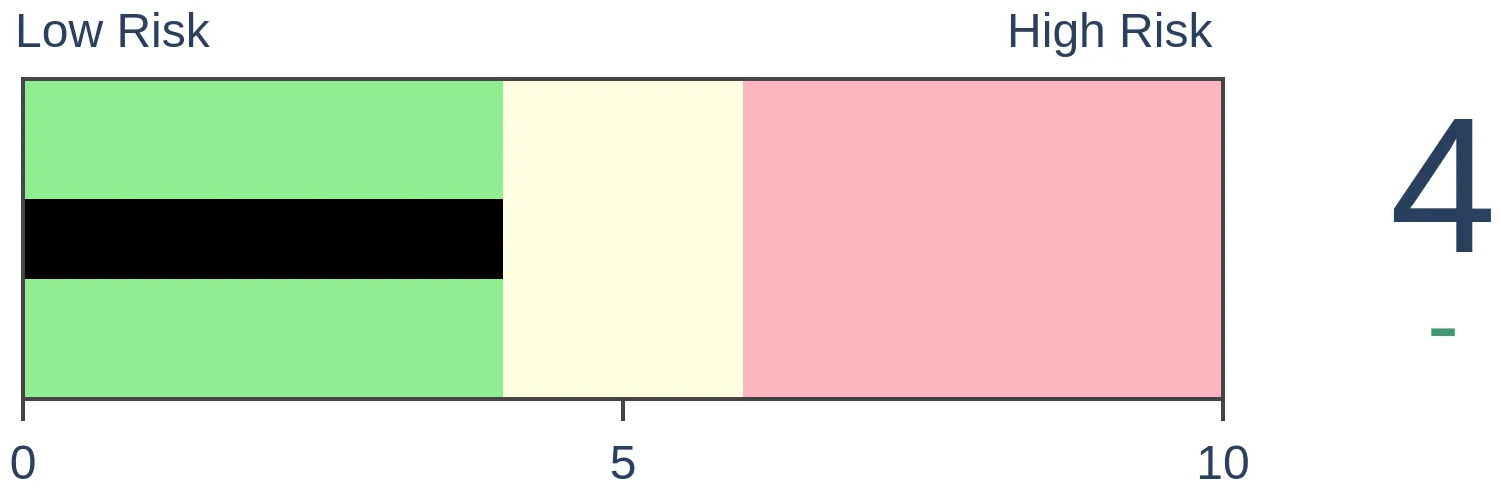
Stocks Medium-Term
|
|
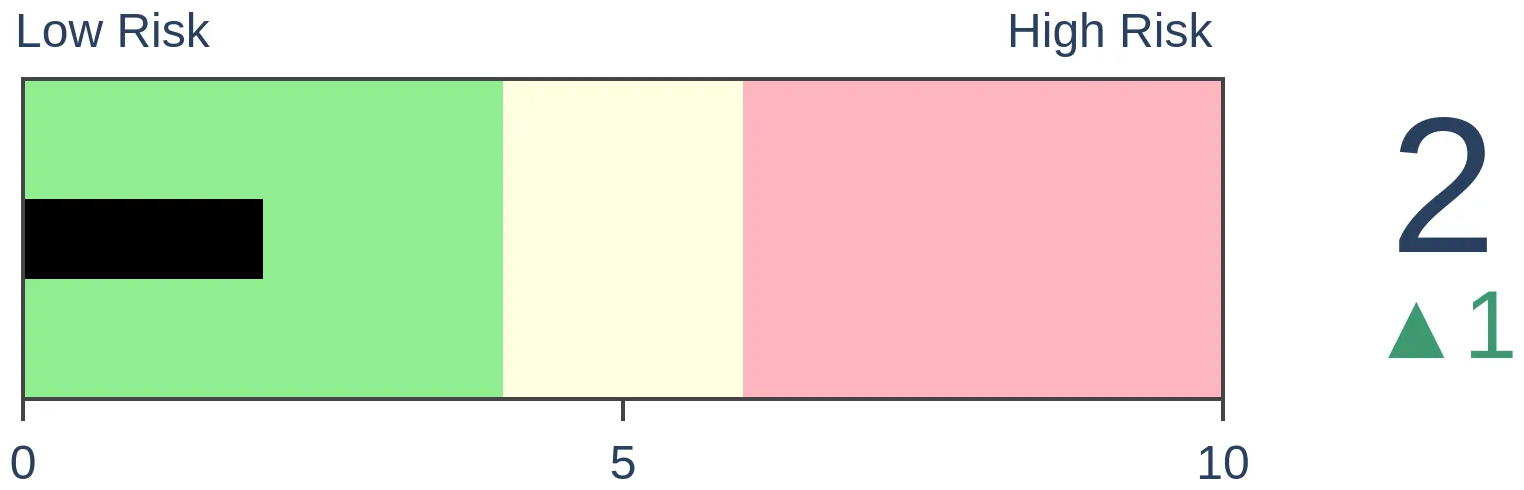
Bonds
|
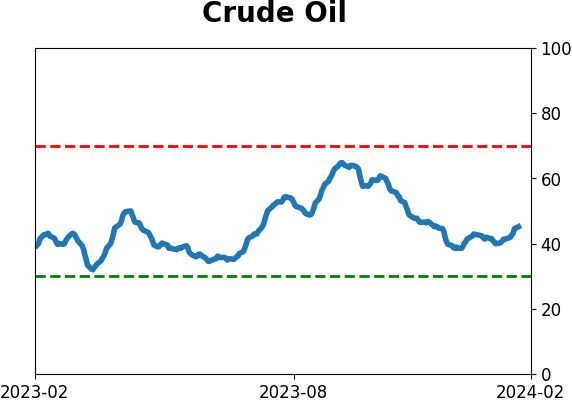
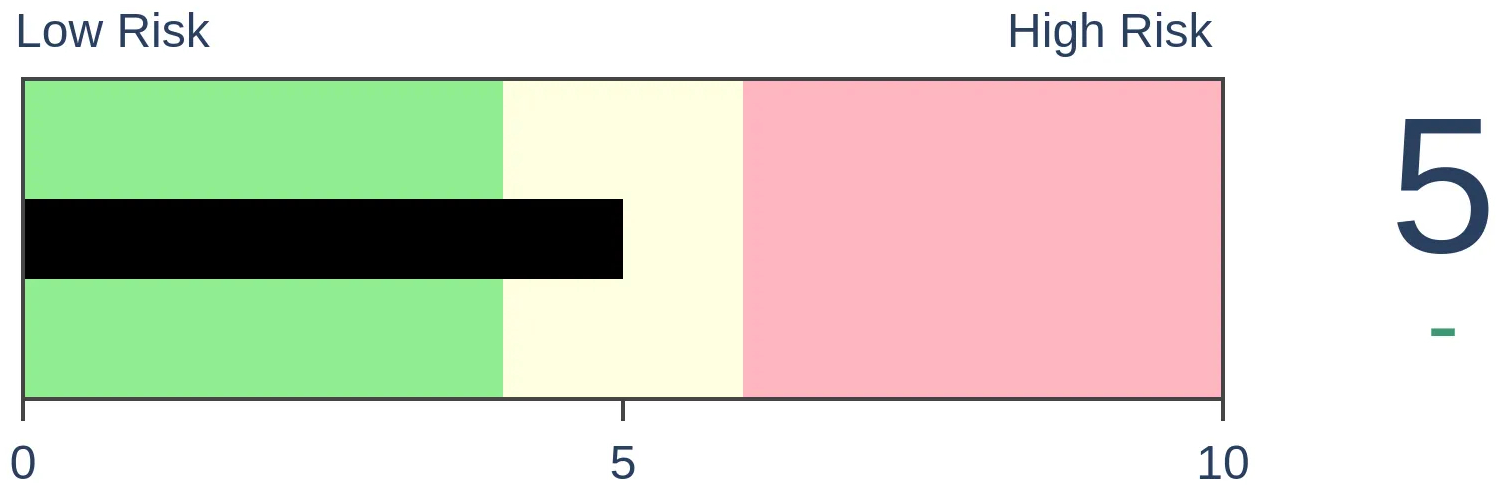
Crude Oil
|
|
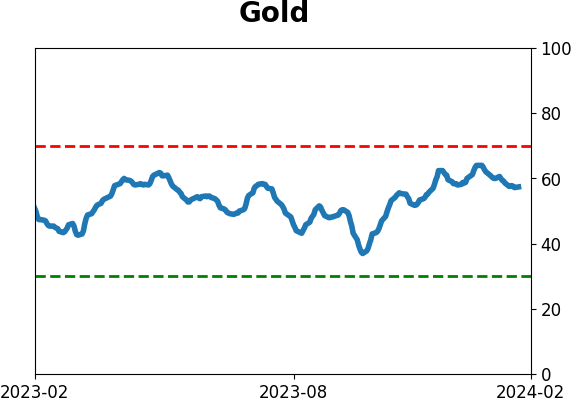
Gold

|
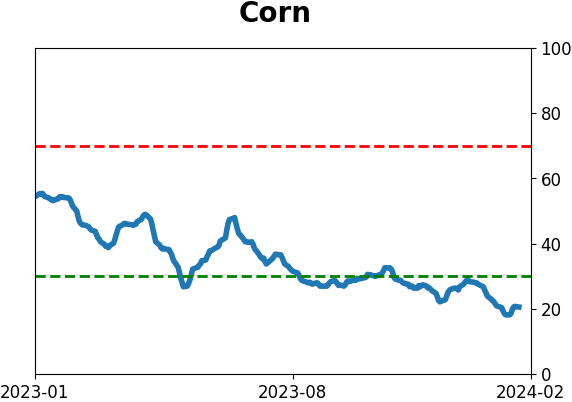
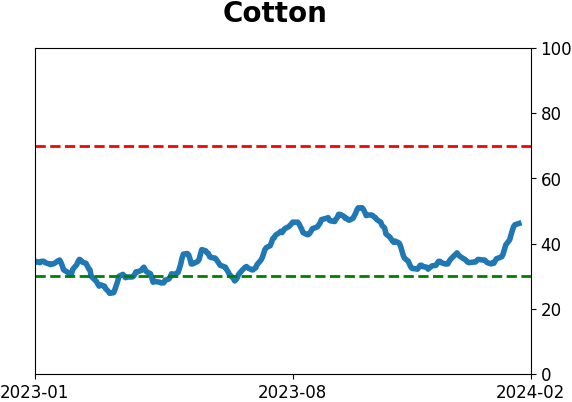
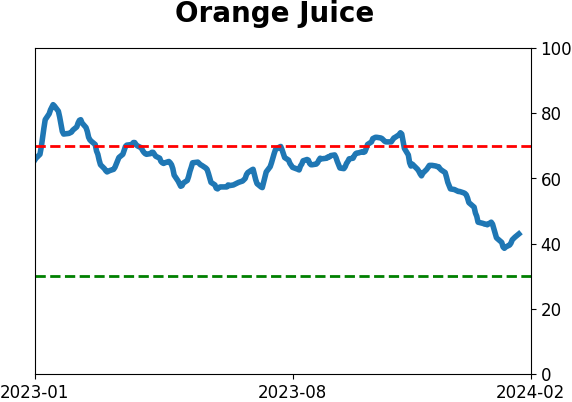
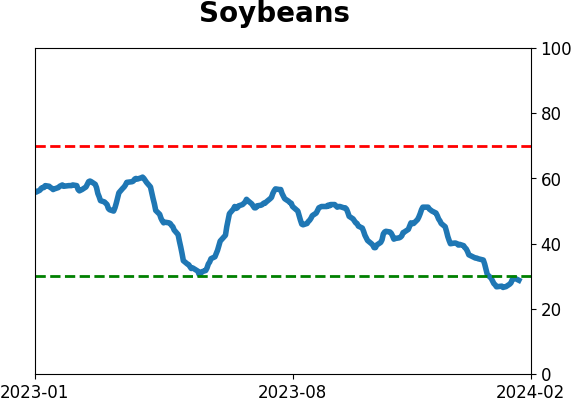
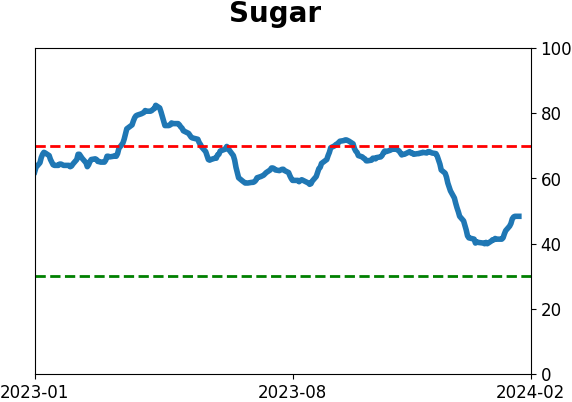
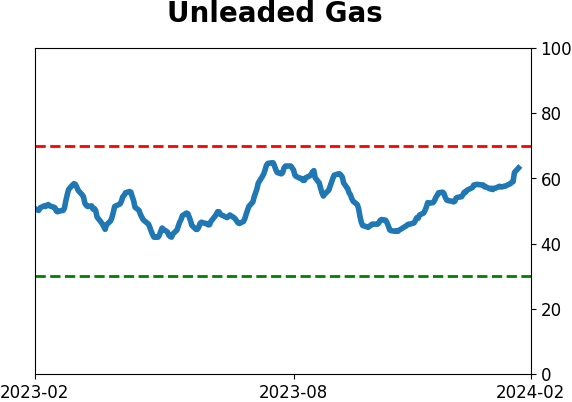
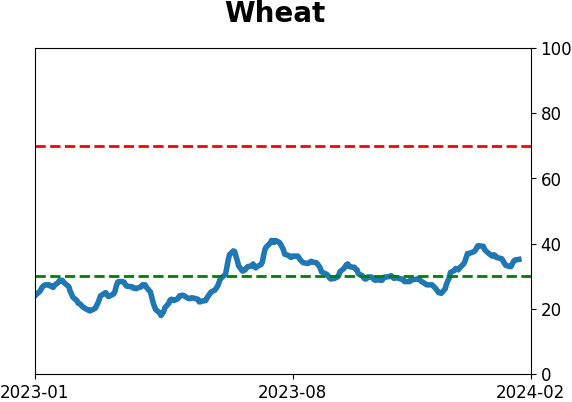
Agriculture
|
|
Research
By Jason Goepfert
BOTTOM LINE
The S&P 500 recorded multiple new highs last week, yet an indicator of underlying selling pressure spiked to an extremely high level. It's unprecedented to see the Arms Index above 1.5 when the S&P is at a high, as it almost always triggers after a decline. The implications are positive, but with an asterisk.
FORECAST / TIMEFRAME
None
|
Key points:
- An indicator of selling pressure has been elevated, despite many indexes being at new highs
- High readings in the Arms Index have been almost universally bullish for future returns
- However, this one is unprecedented in that it triggered with the S&P 500 at a new high
Heavy selling under the surface
There's something weird happening under the surface of the stock market.
Despite many of the major indexes hitting new high after new high, over the past couple of weeks, there have been several days with individual stocks vastly underperforming the index, and heavily skewed volume into some of those declining issues. Jaunty performance in some of the largest stocks has helped to mask some of this, but it shows up in some of the breadth figures.
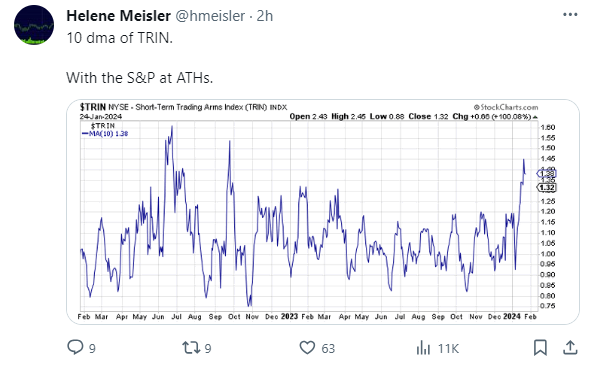
One of these oddities was pointed out by respected technician Helene Meisler. Even though the S&P 500 was hitting all-time highs, the Arms Index (aka TRIN) had spiked to a very high level.
The indicator was popularized by technician Richard Arms, and calculated as follows:
(Advancing Issues / Declining Issues) / (Up Volume / Down Volume)
Because it is a ratio of a ratio, it can record extremely high or low values if there are a few stocks with extreme volume that are up or down together on a certain day. Using a moving average like ten days helps to smooth out those extreme values. And as Helene pointed out, the 10-day average is extremely elevated. High levels are typically associated with heavy selling or downright panic.
High Arms Index readings tend to be very bullish, but...
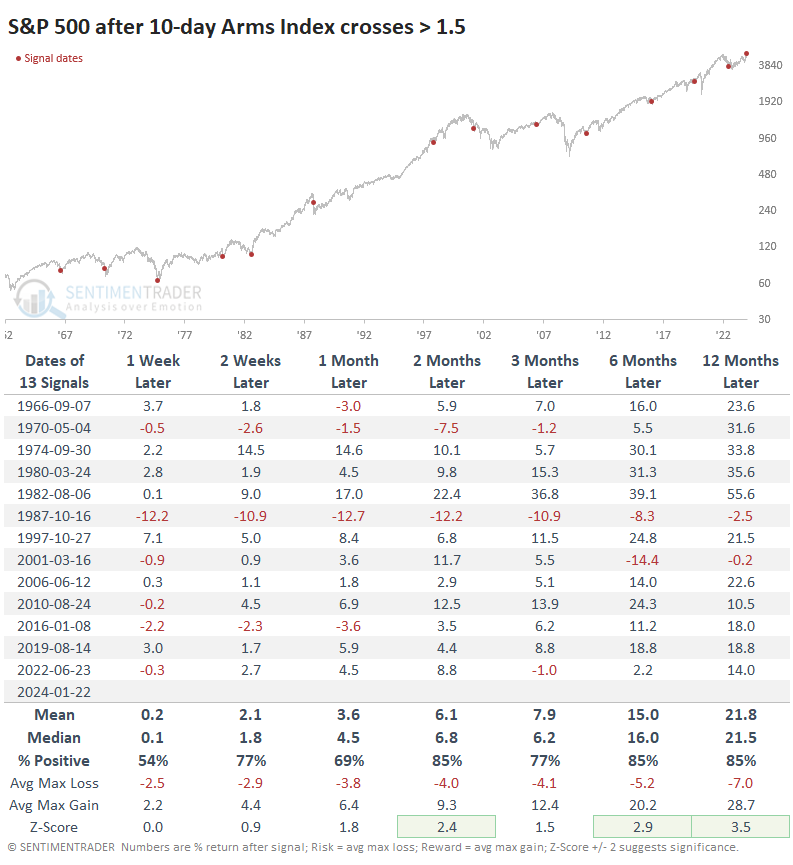
The table below shows each time the 10-day Arms Index first crossed above 1.5. It's obvious from the dots on the chart that this has almost exclusively occurred after a prolonged or sharp decline. And as such, forward returns tended to be robust. From 2-12 months later, the S&P 500's median return was well above random, with low risk relative to reward, and only a couple of losses.
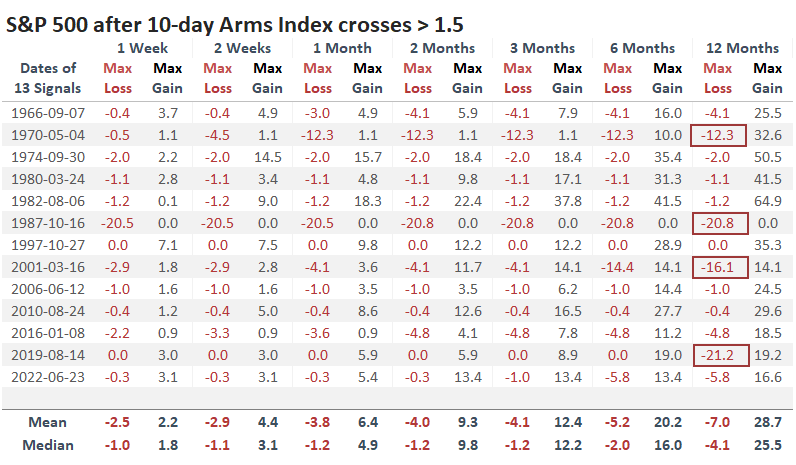
The table of maximum gains and losses across time frames shows that the latter tended to be minimal up to a year later, though the signal was early in 1970, a day early in 1987, way early in 2001, and interrupted by the pandemic in 2020. Other than those signals, the S&P didn't decline any more than -5.8% at any point up to a year later. Of course, if we could just ignore the exceptions, any signal would look great.
What's especially weird about this signal is that it triggered while the S&P 500 was sitting at record highs. That's never happened before, not even close. "Weird" in our analysis isn't a good thing, because it lessens the confidence we have that the future will look anything like the past.
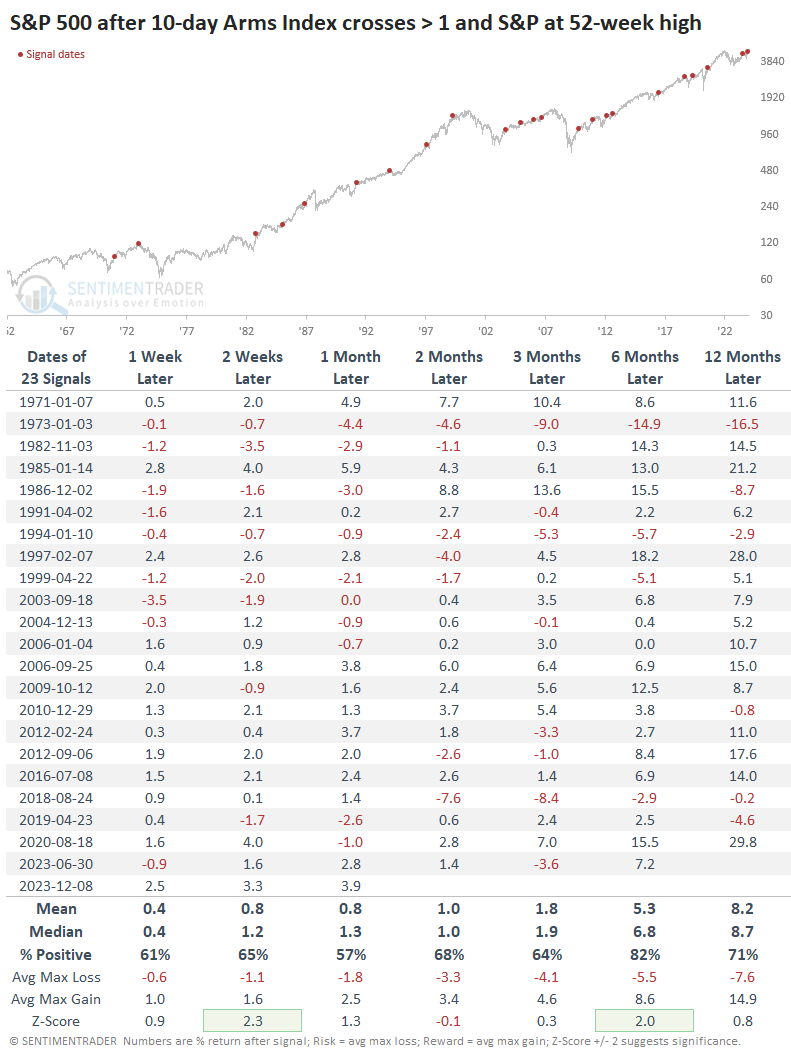
Since the 10-day Arms Index had never been close to 1.5 when the S&P was sitting at a high, we have to relax the parameter. The table below shows times when the S&P was at a 52-week high, and the 10-day Arms was above 1. It's the closest we can come to having a decent sample size with somewhat similar behavior.
This didn't seem to degrade the conclusion of the table above too much. While future returns in the S&P weren't nearly as strong or consistent, they still had a positive skew.
What the research tells us...
Since the October 2022 bottom, stocks have pretty much done what they're supposed to do. The indexes have mostly performed in line with what the studies have suggested after behavior like we witnessed leading up to and after that bottom. There hasn't been much in what we've discussed since then that cast much doubt on the probability of the rallying continuing.
In recent weeks, there have been a few nascent signs of odd behavior under the surface of the indexes. Nothing to get to hot and bothered about, not even remotely, but odd enough to pay more attention in the weeks ahead. While on its surface, the high Arms Index reading has positive implications, it's odd that we're seeing it now. And odd is rarely good when looking at underlying behavior with stocks at new highs.
Indicators at Extremes
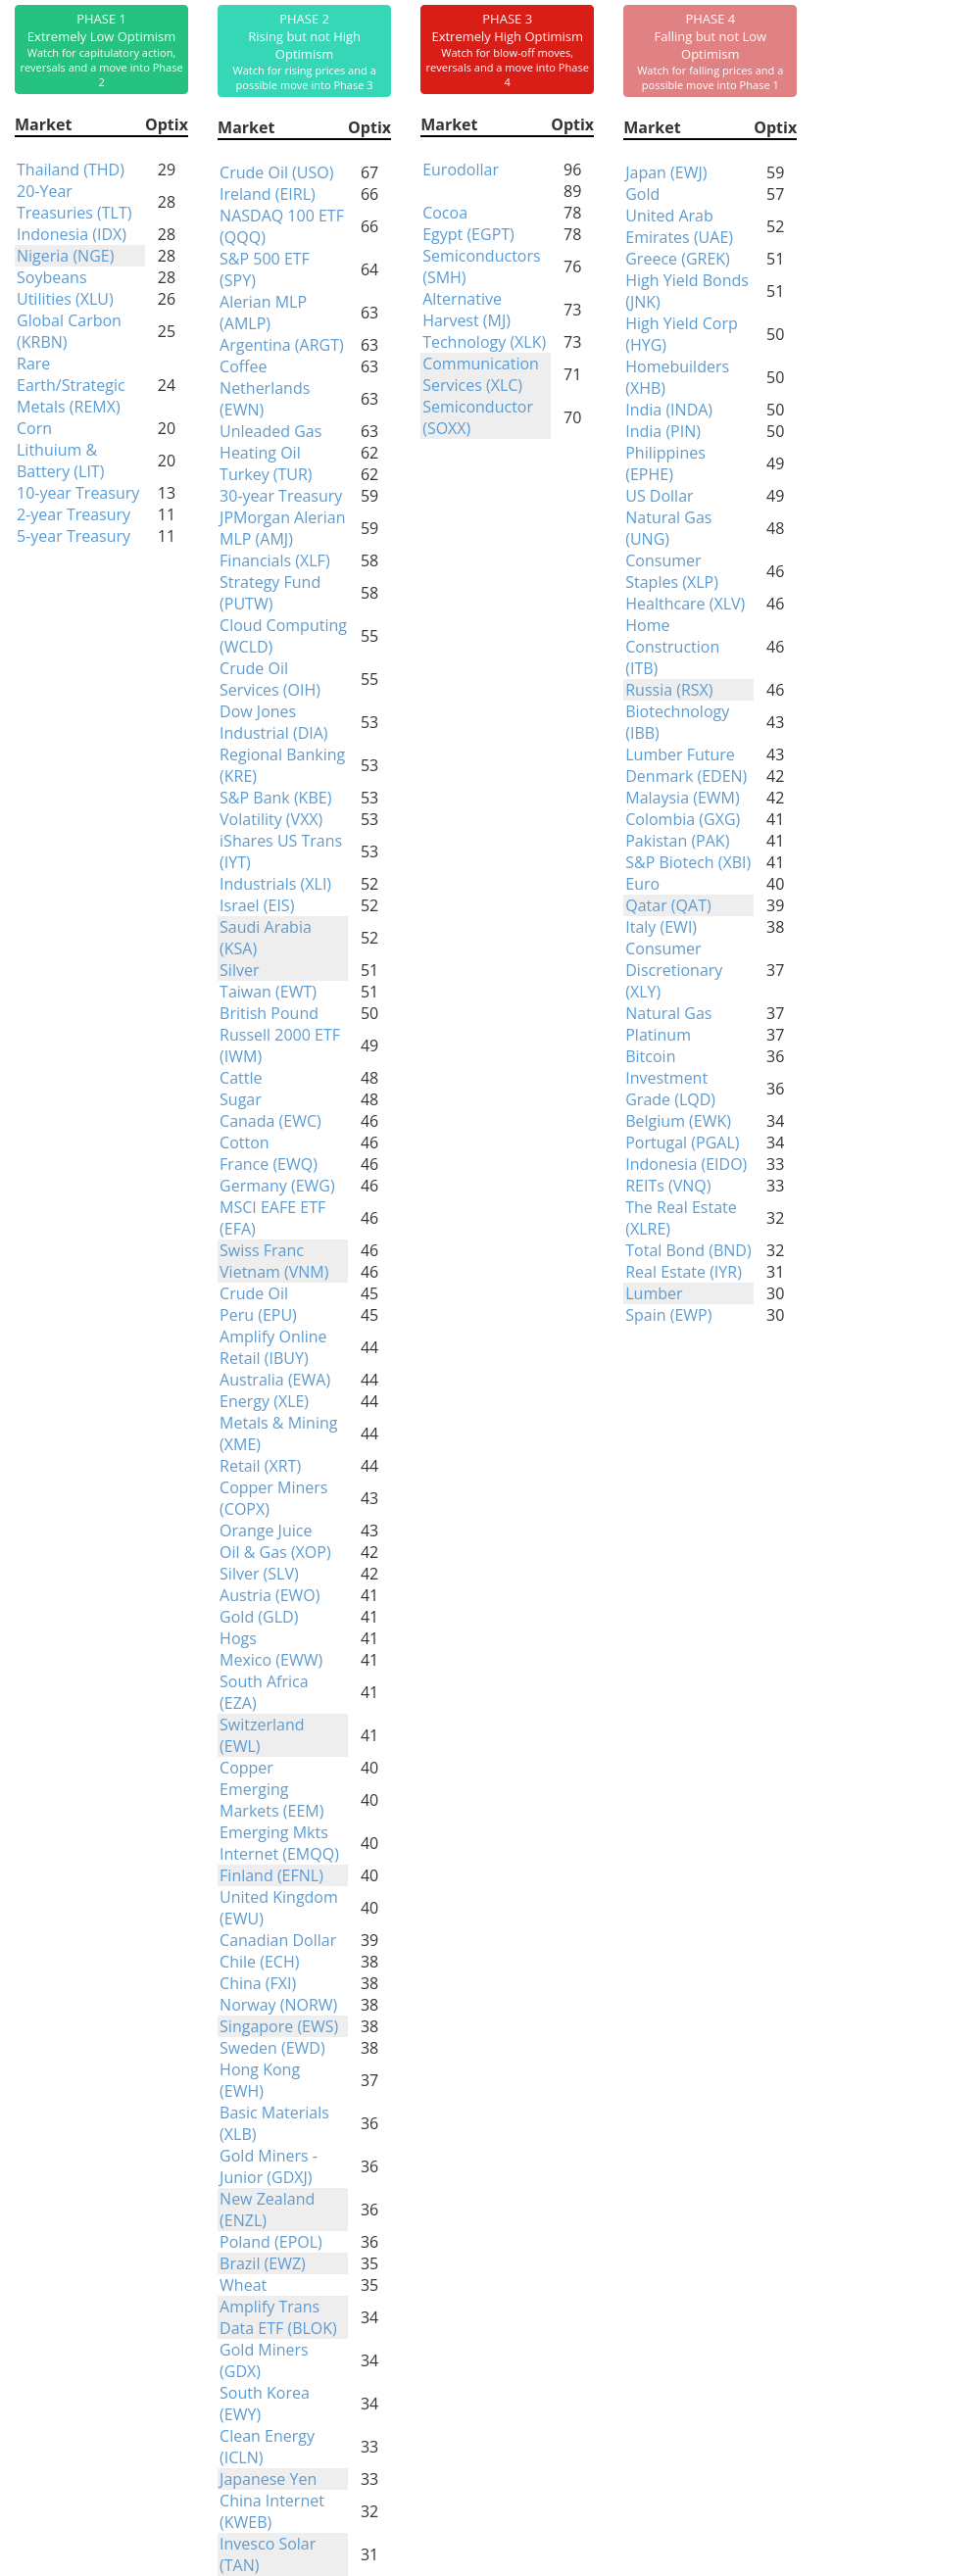
Phase Table
Ranks
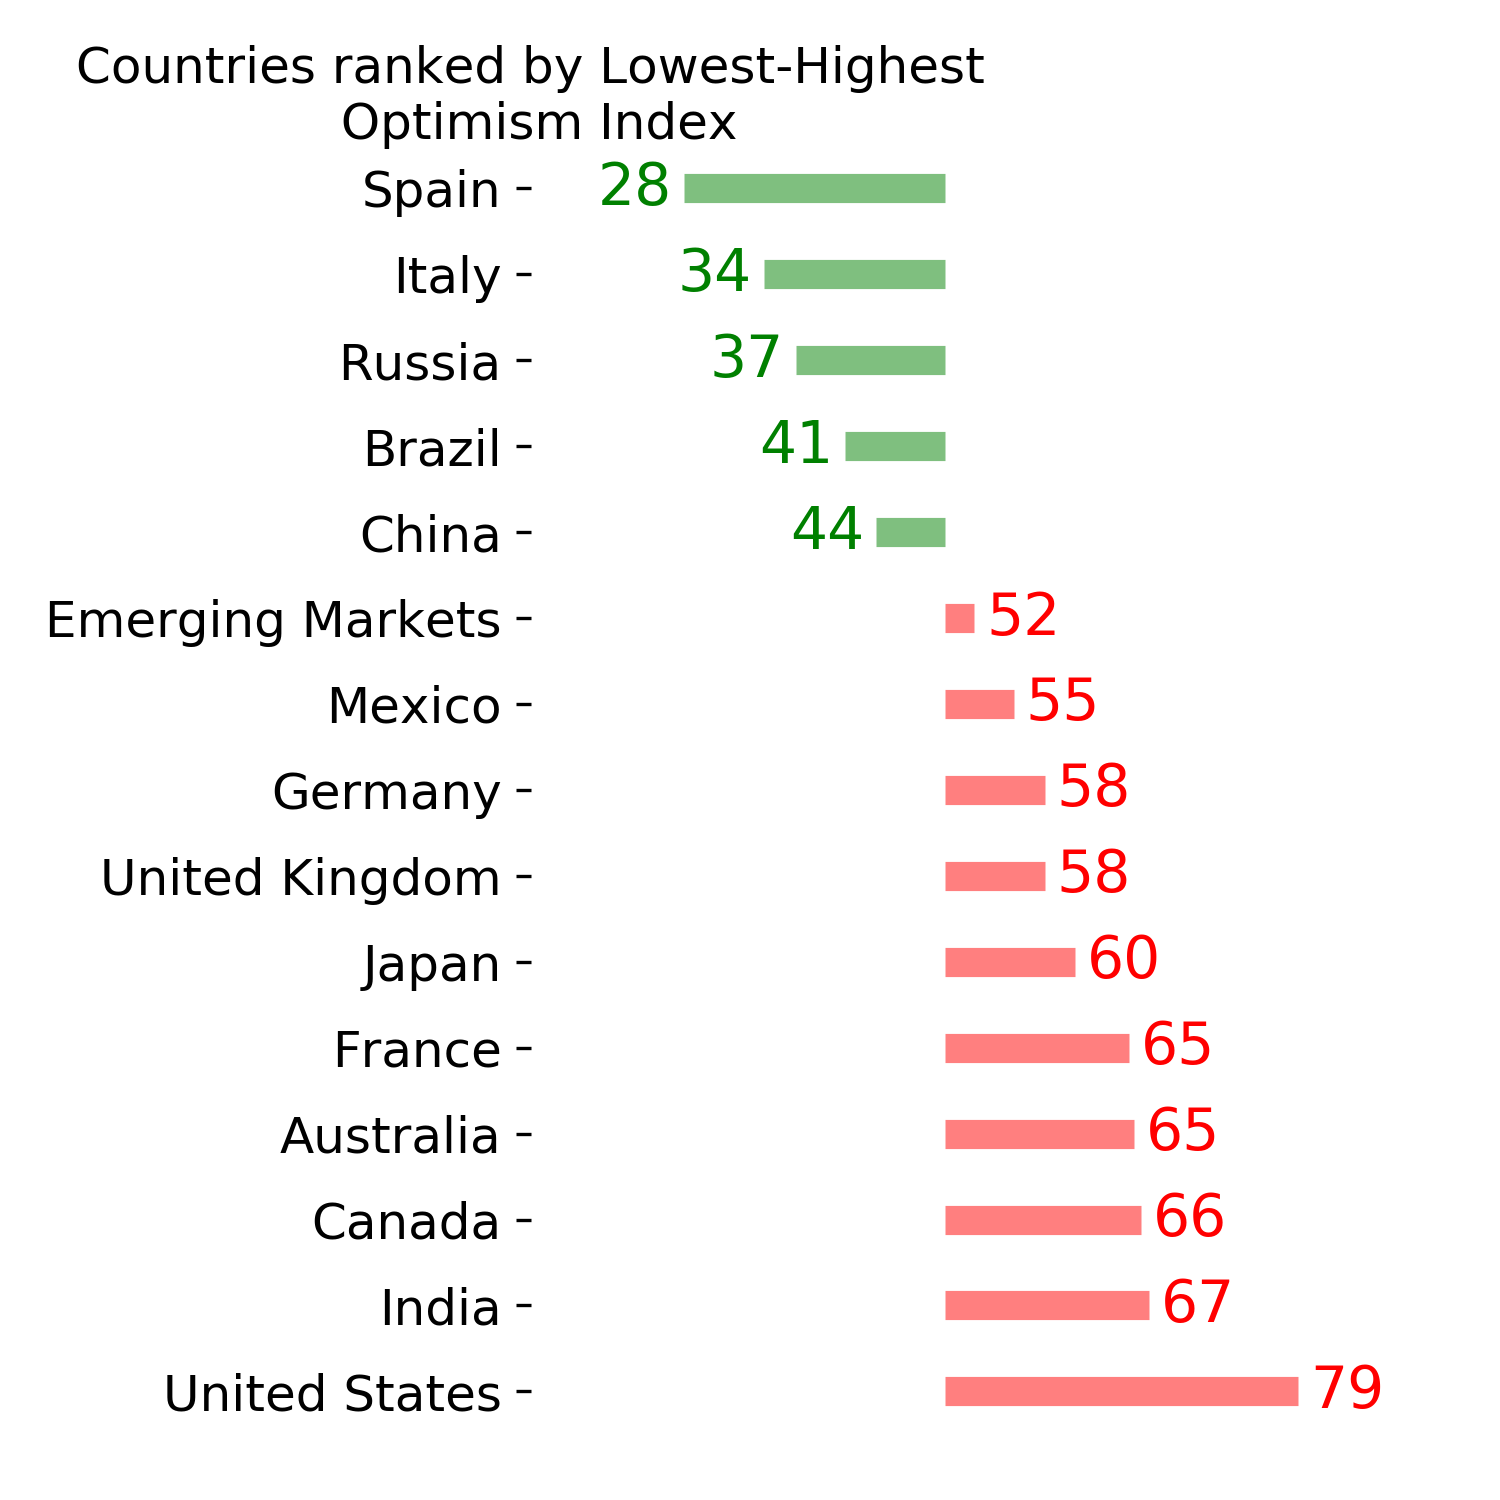
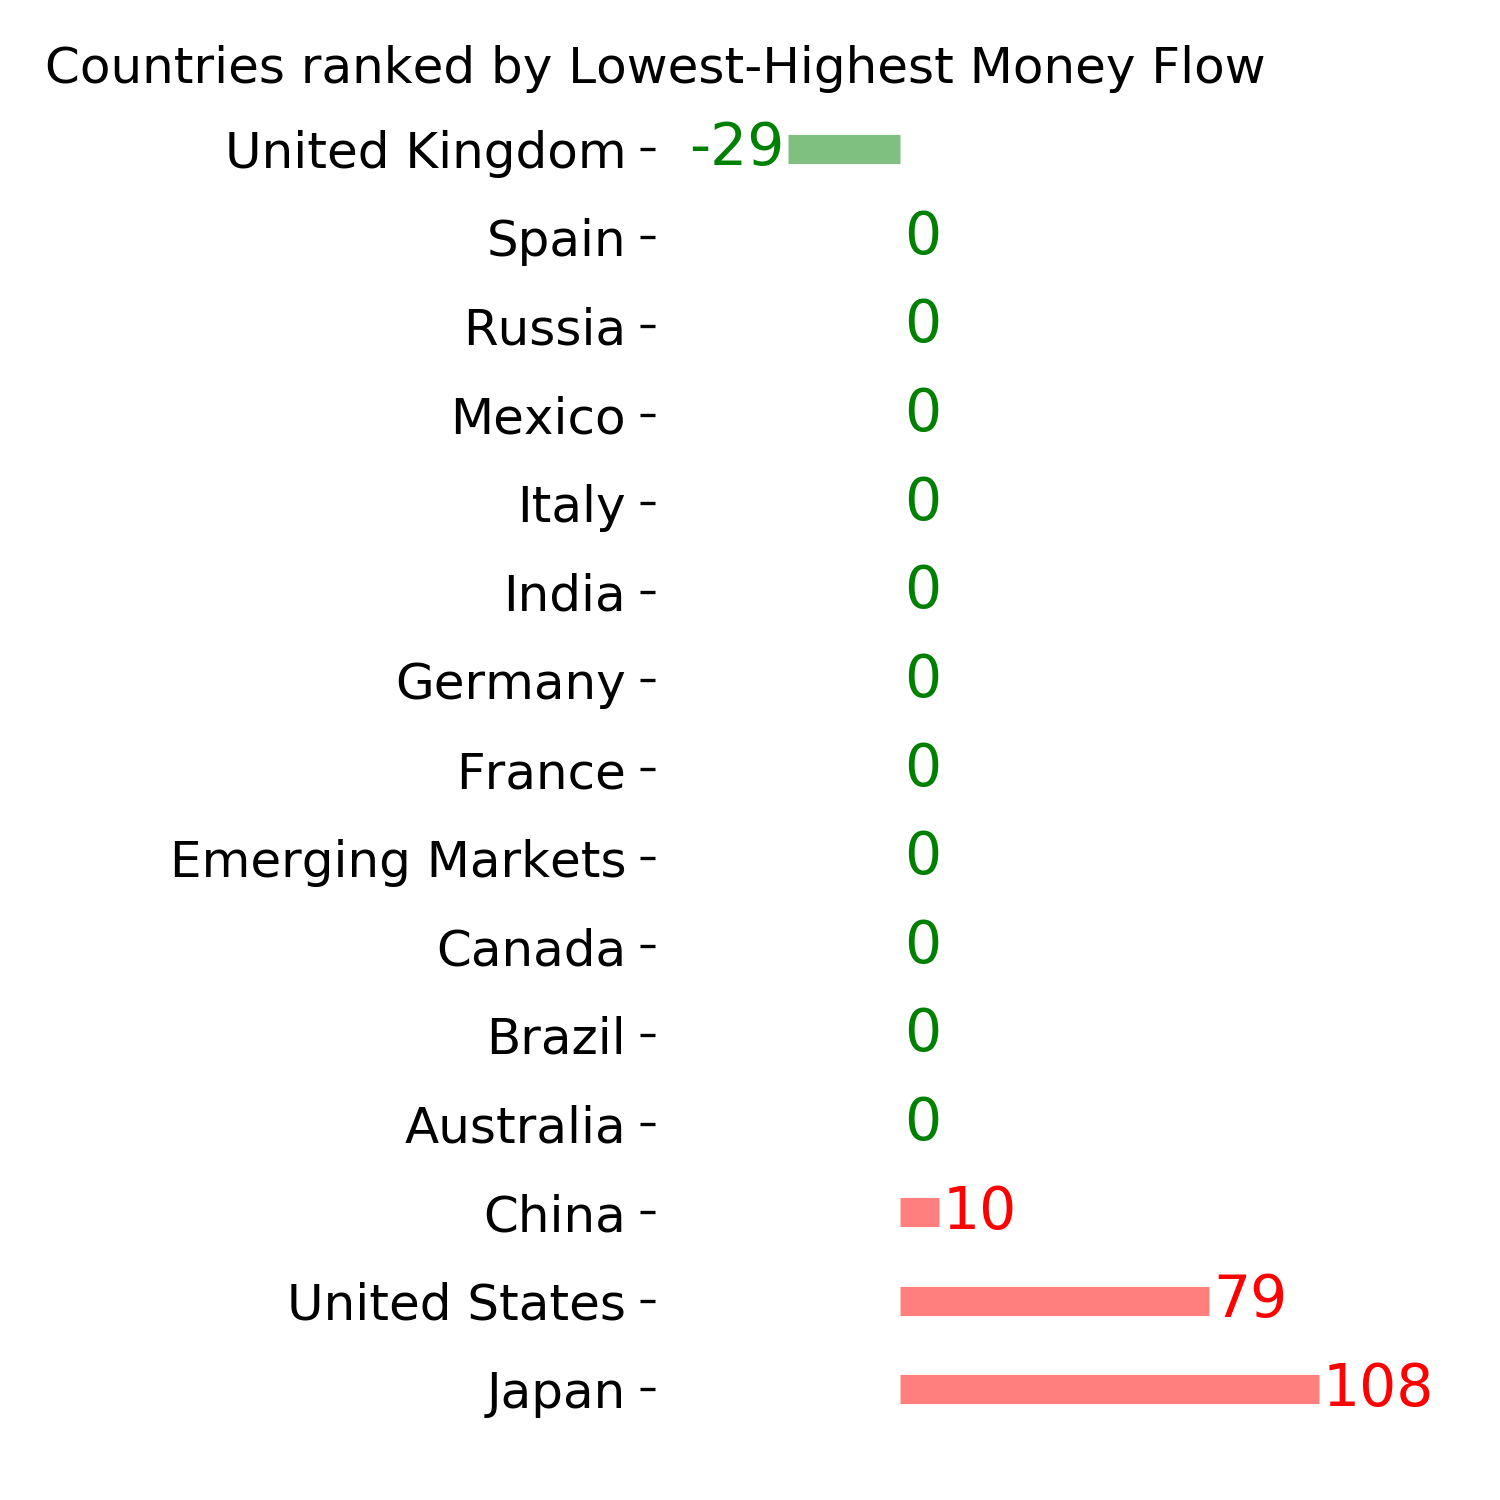
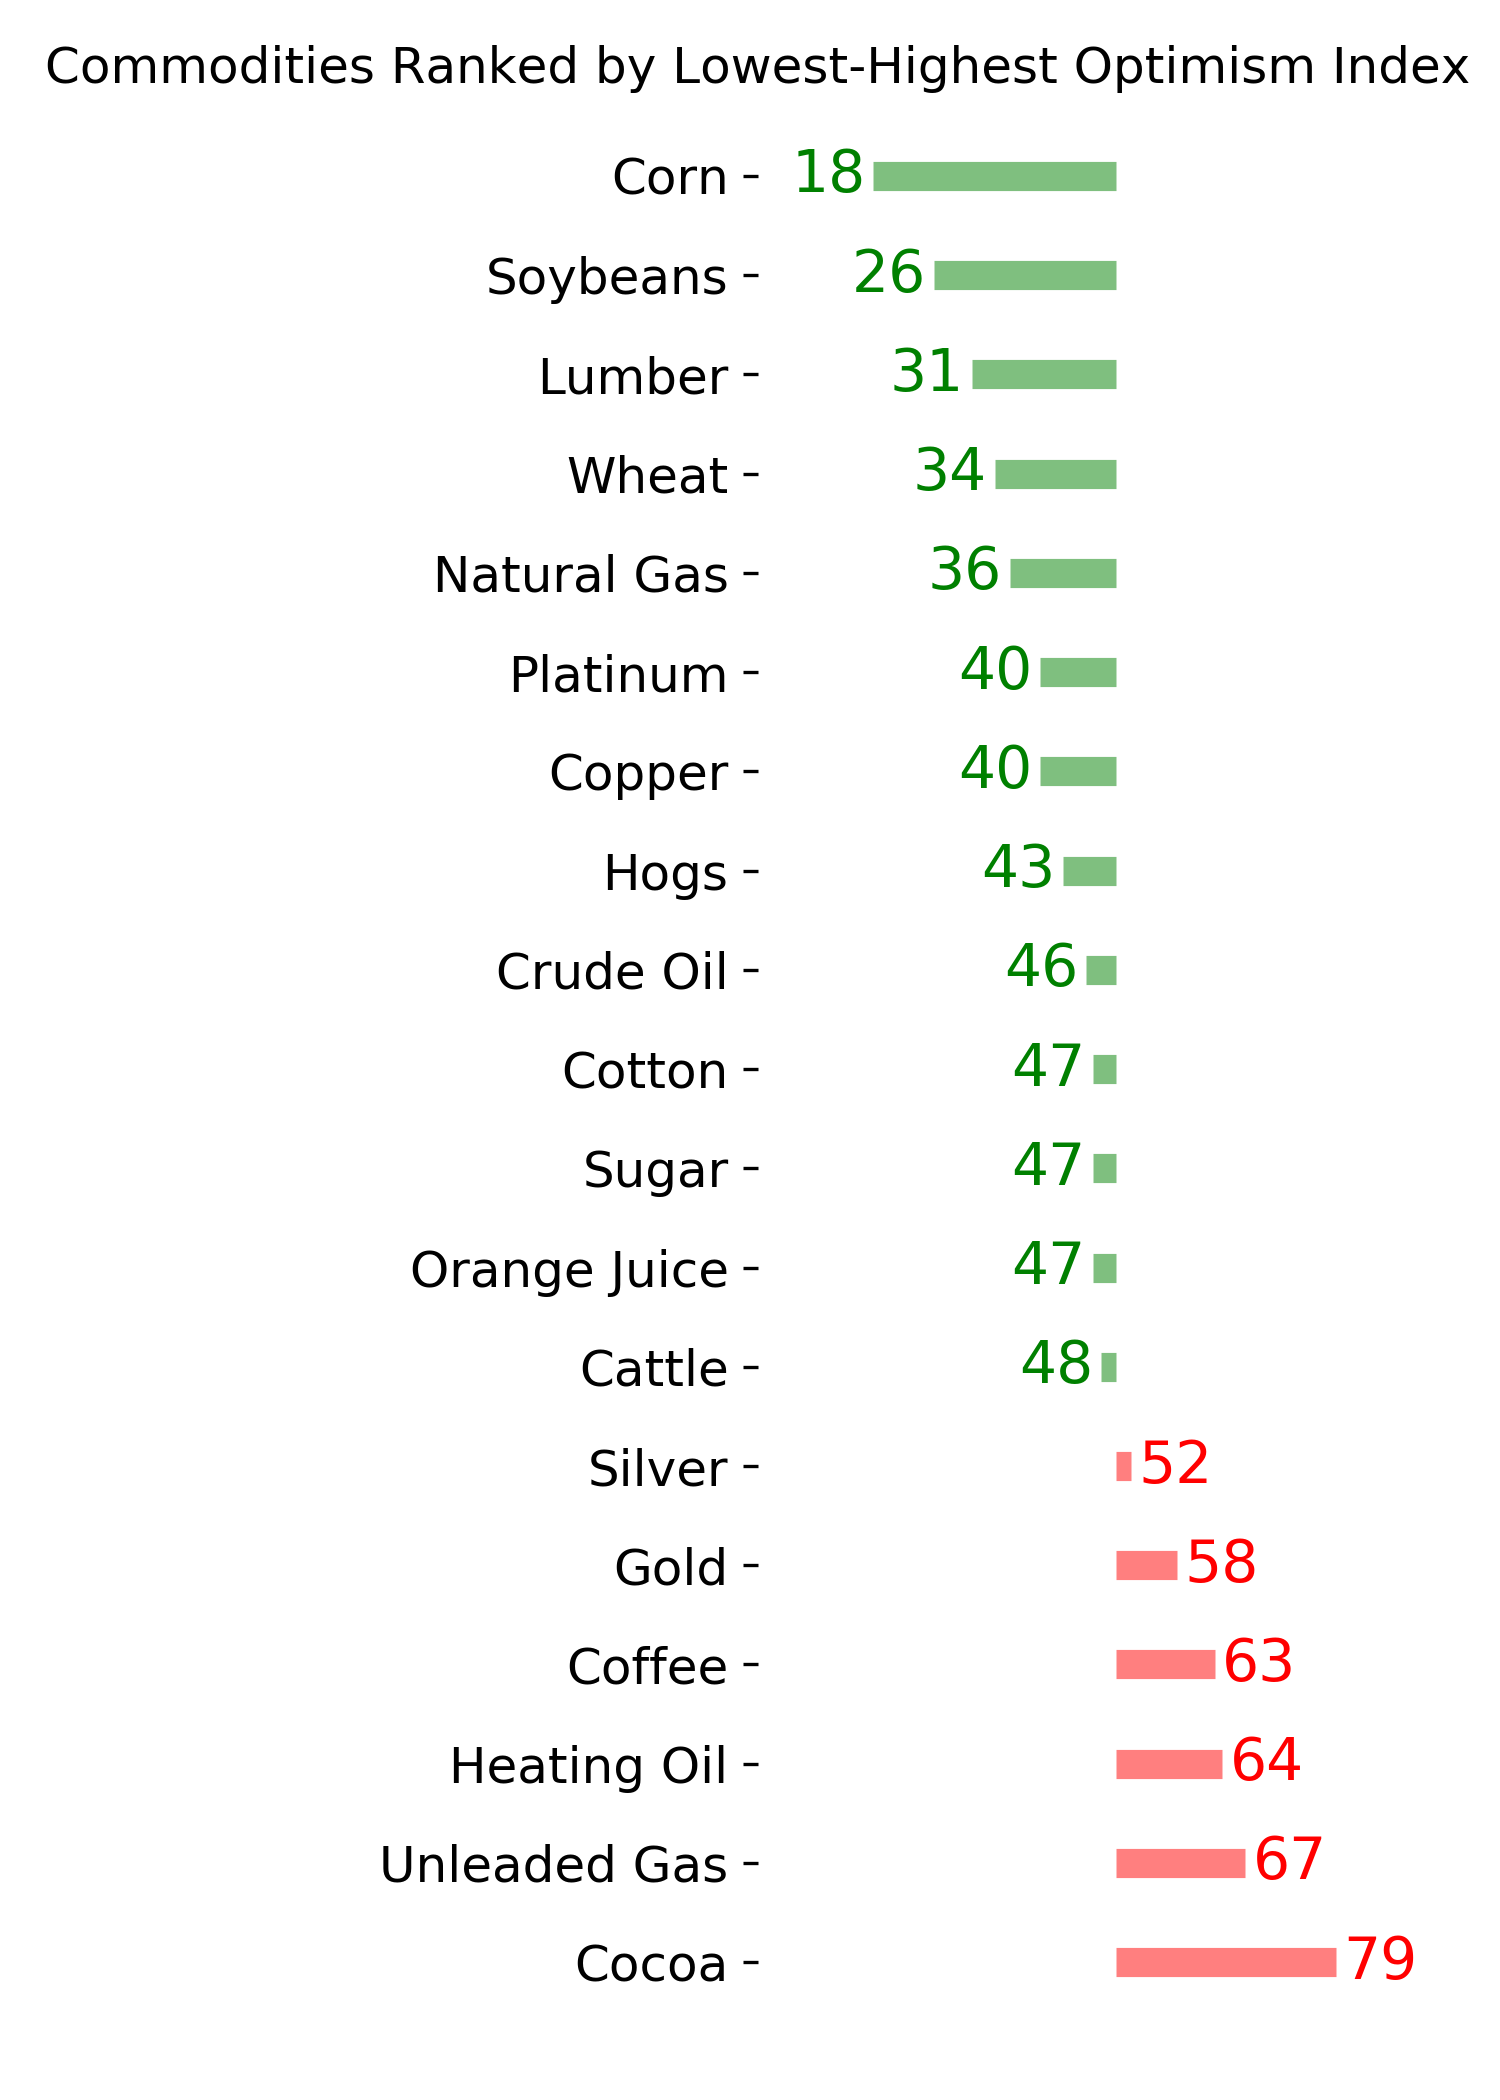
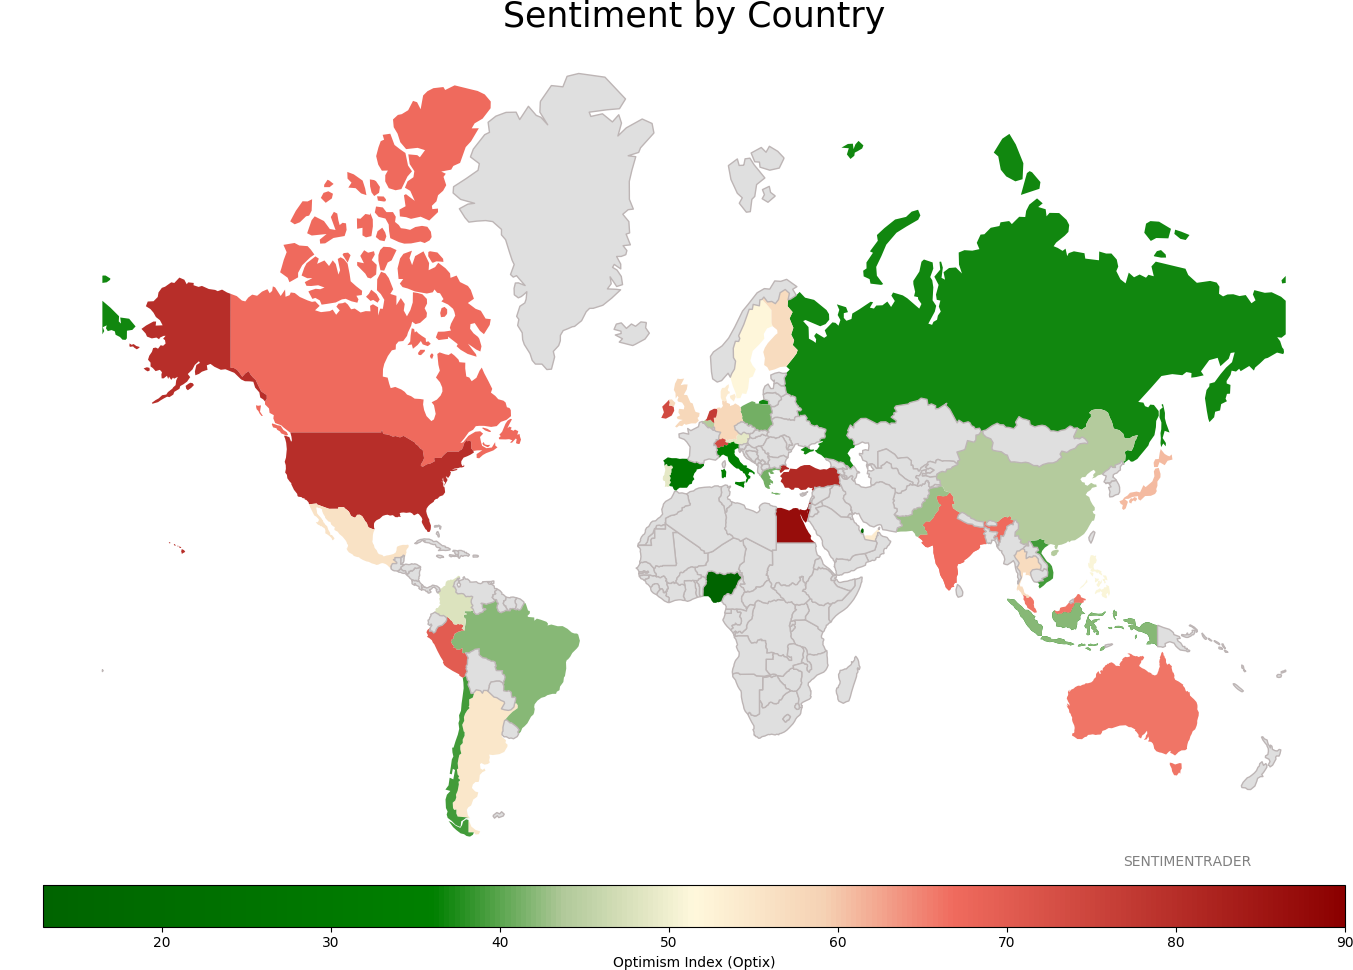
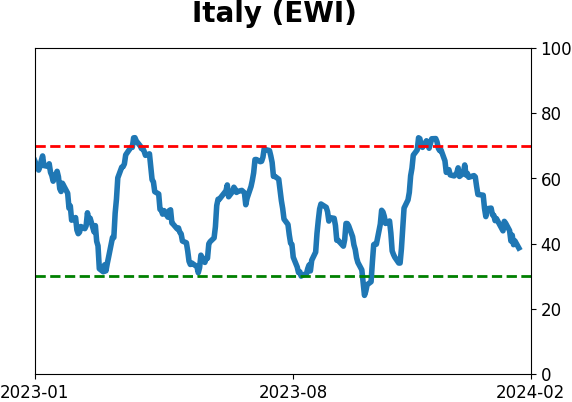
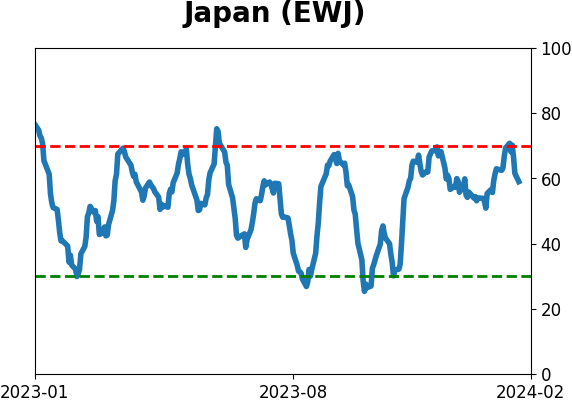
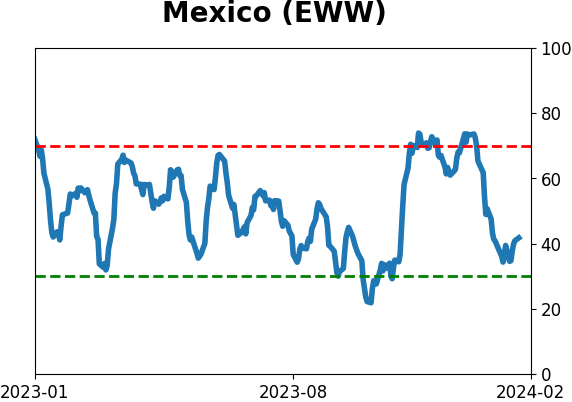
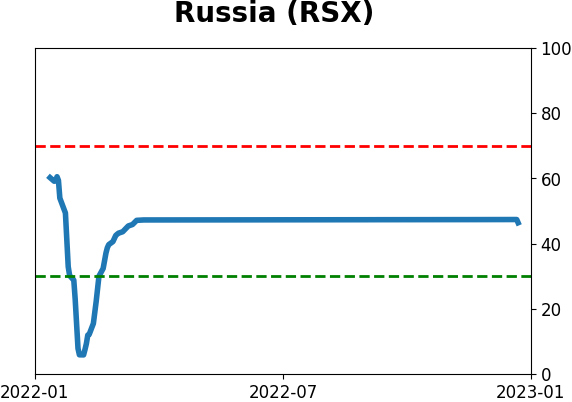
Sentiment Around The World
Optimism Index Thumbnails
|
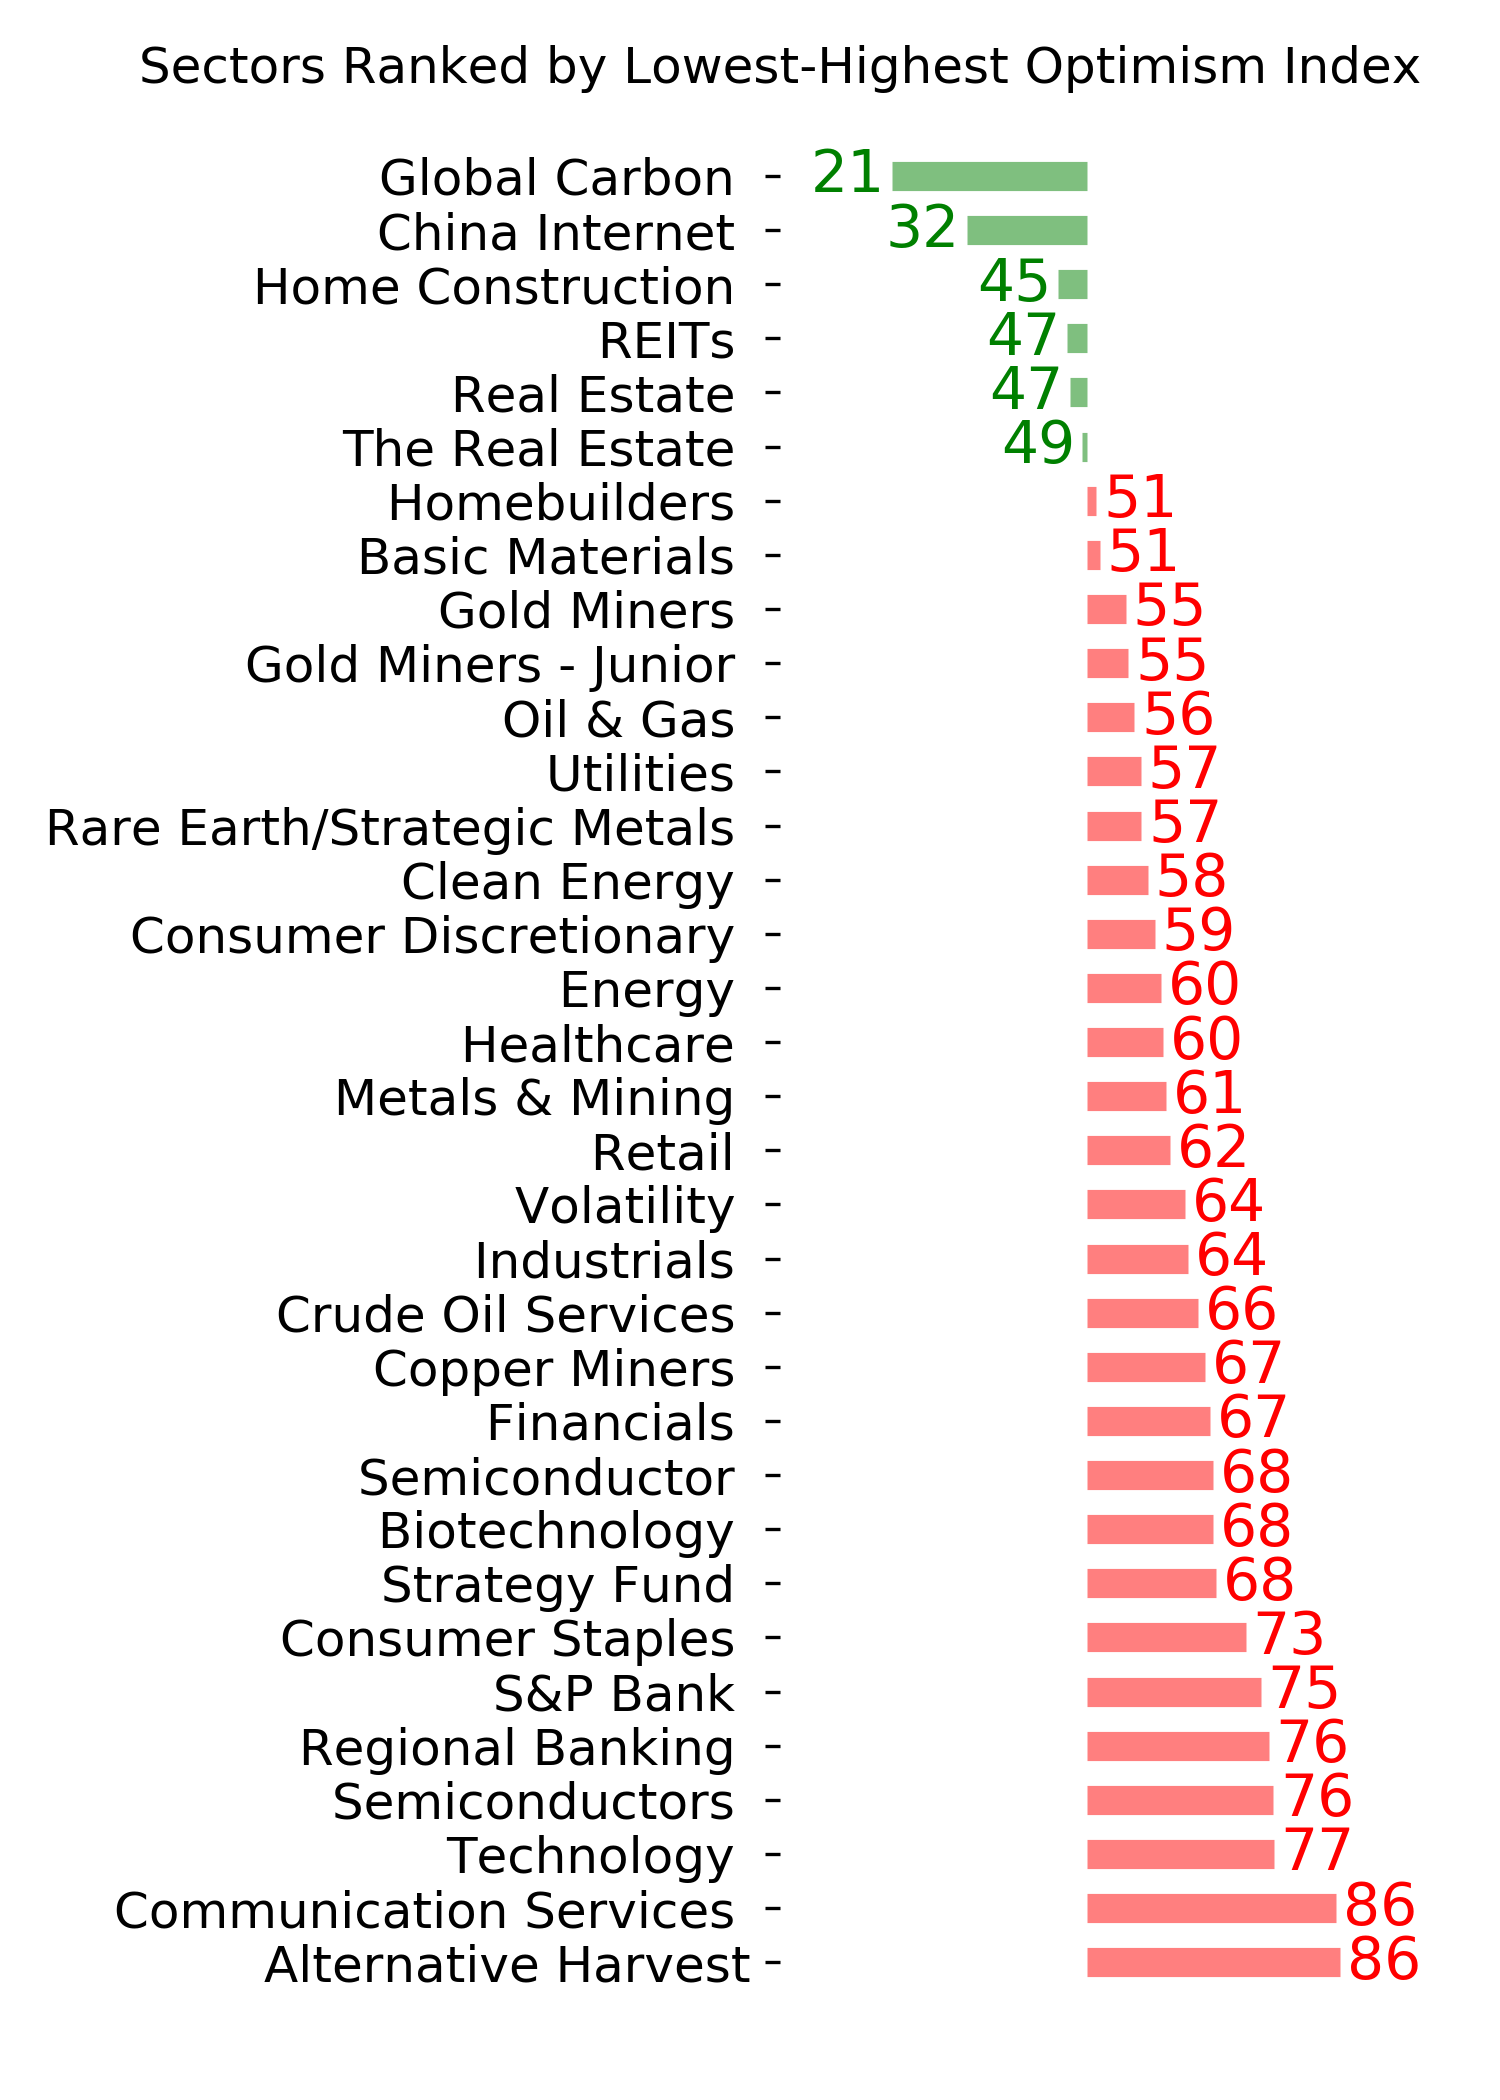
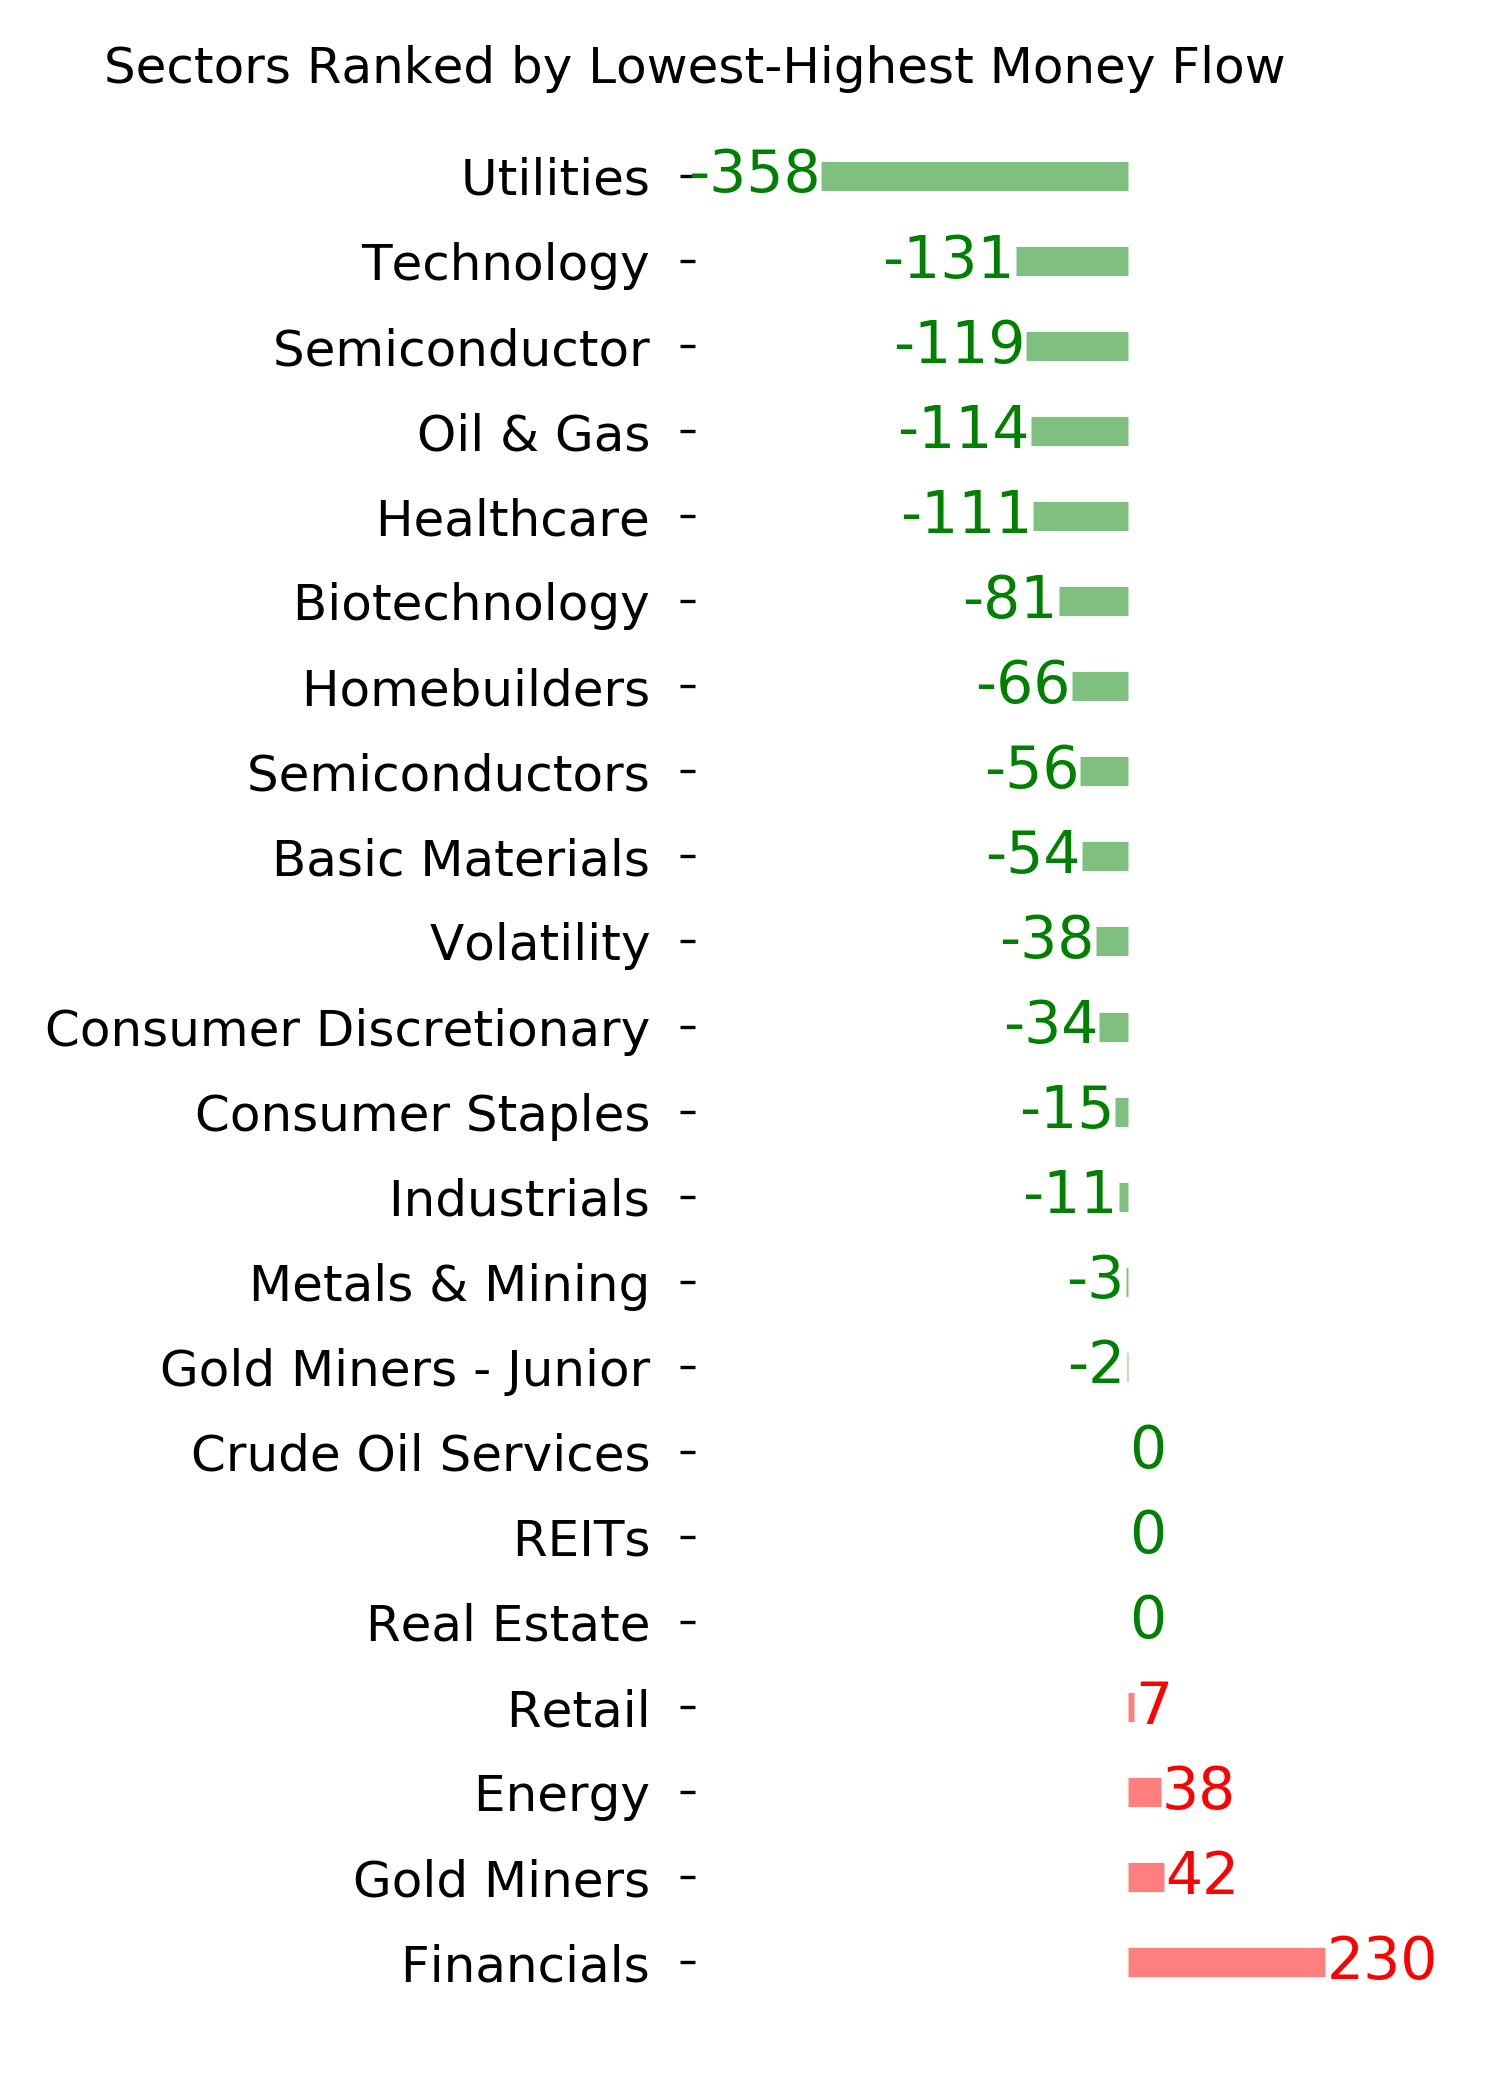
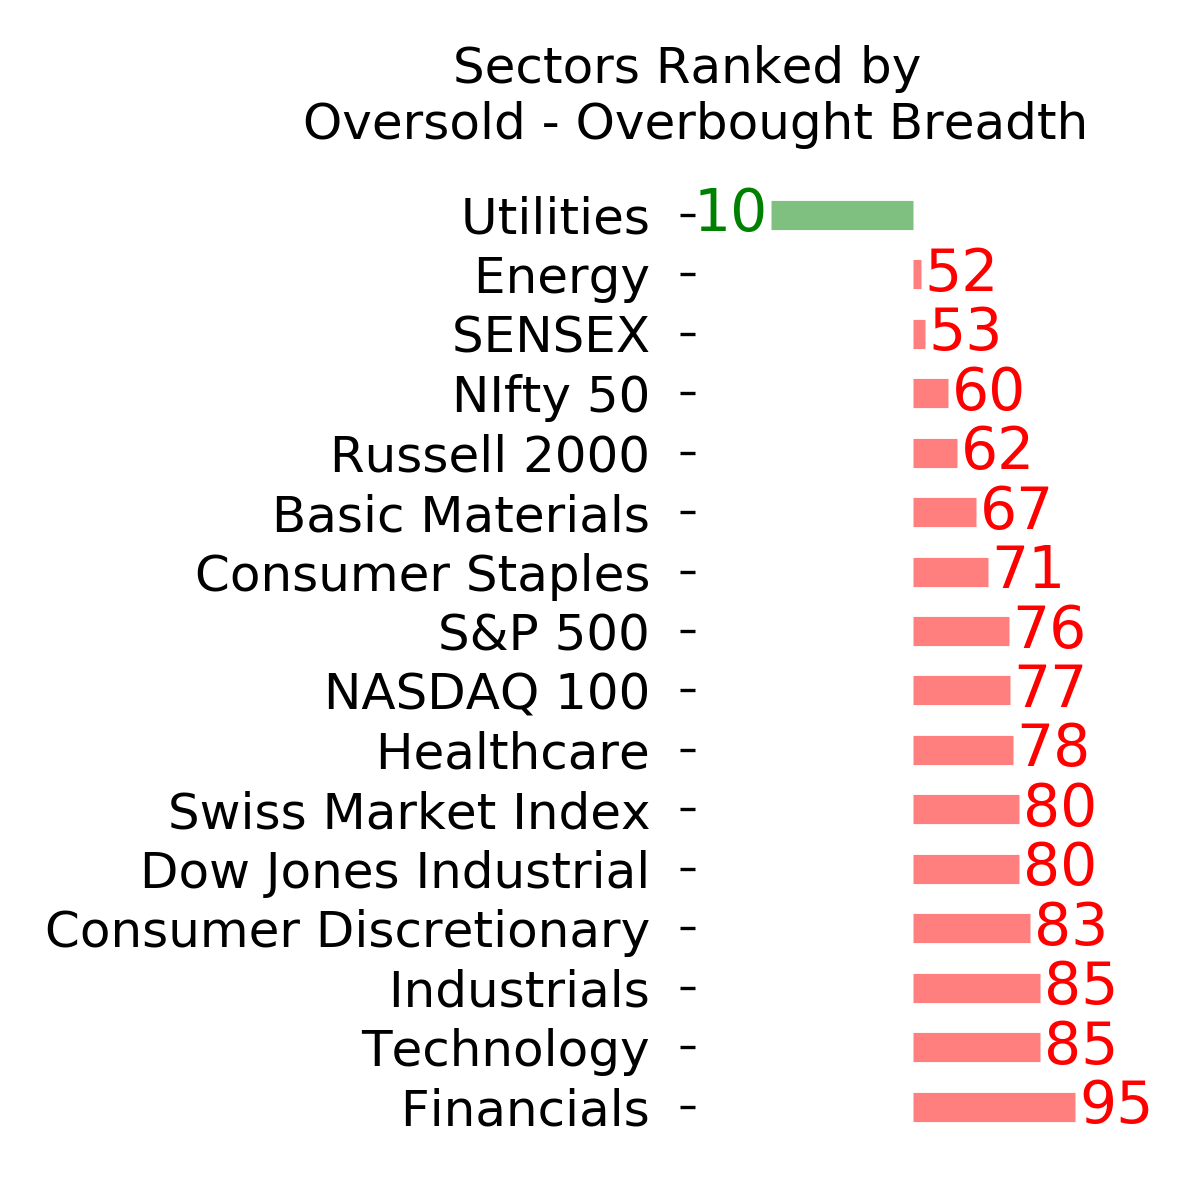
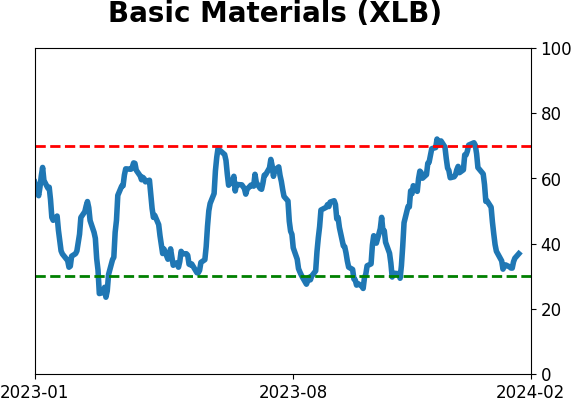
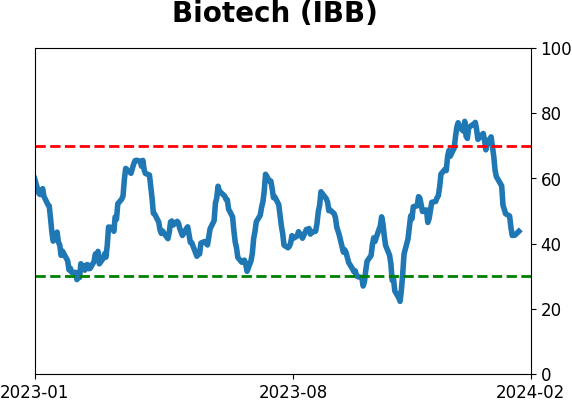
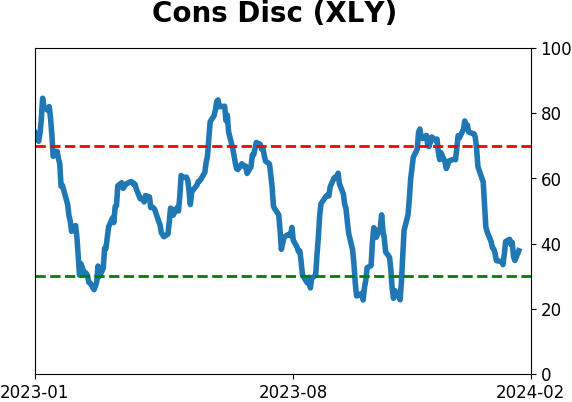
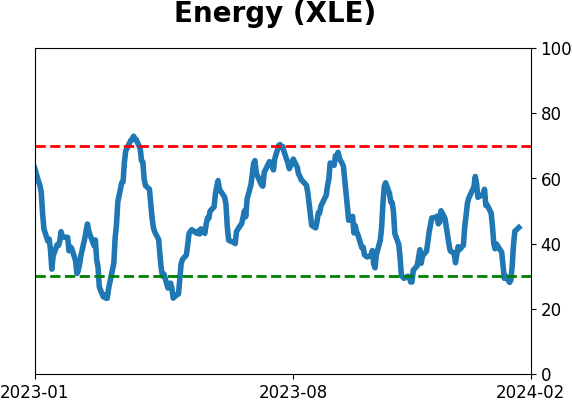
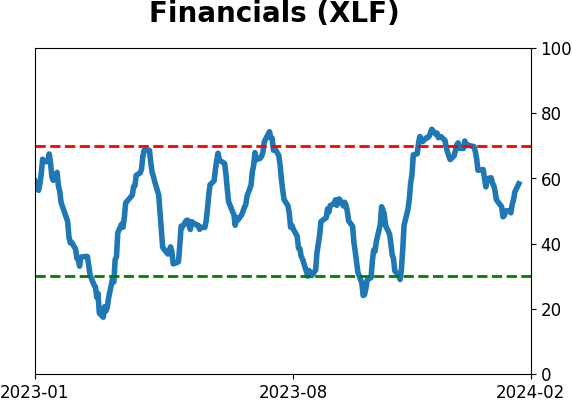
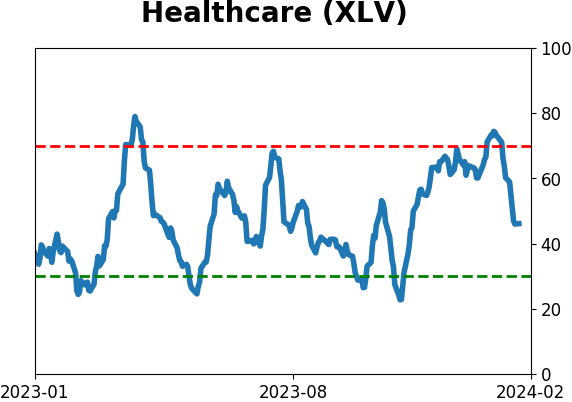
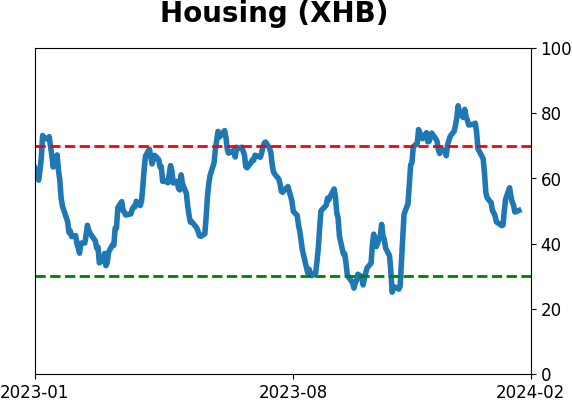
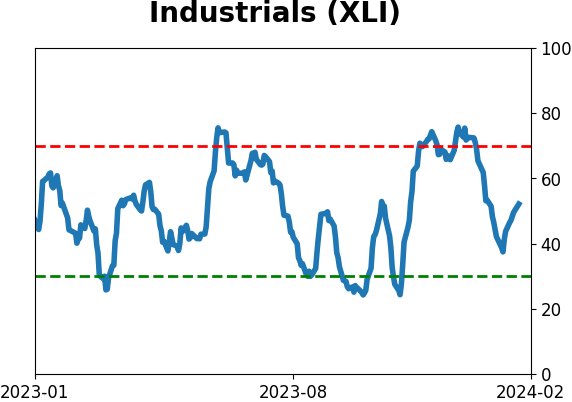
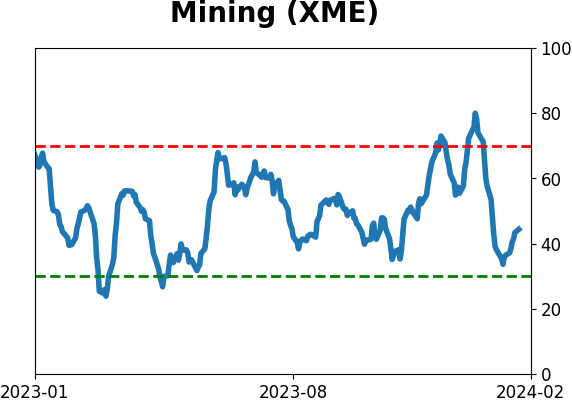
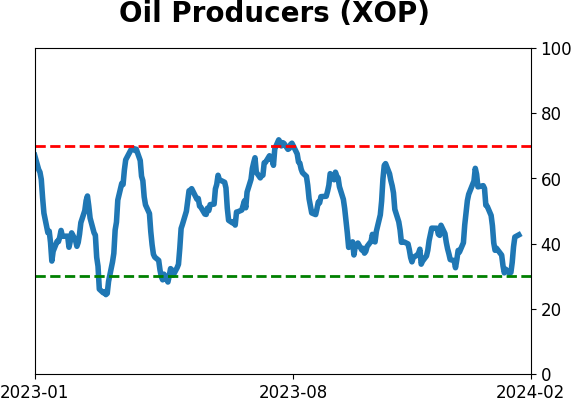
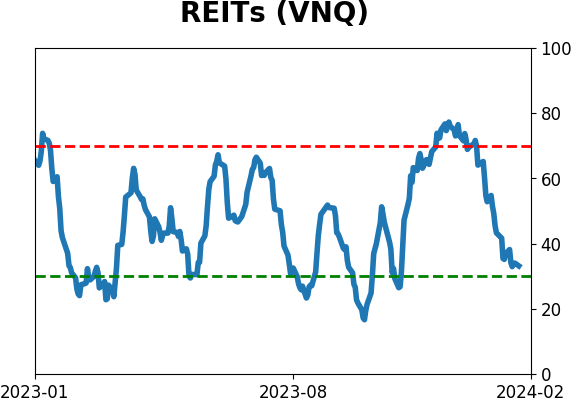
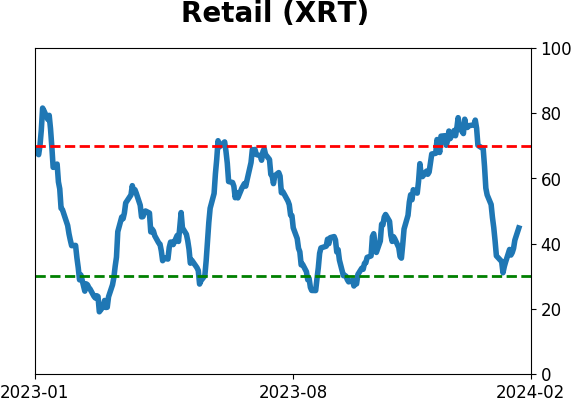
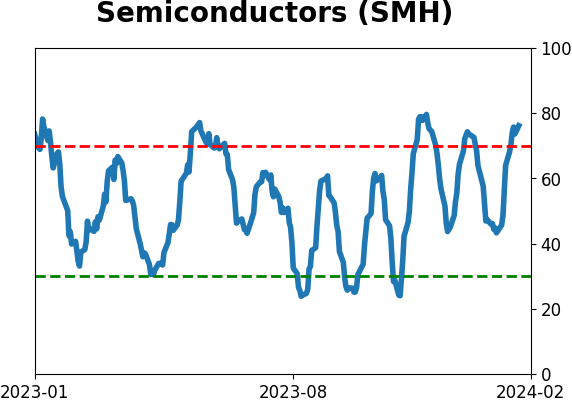
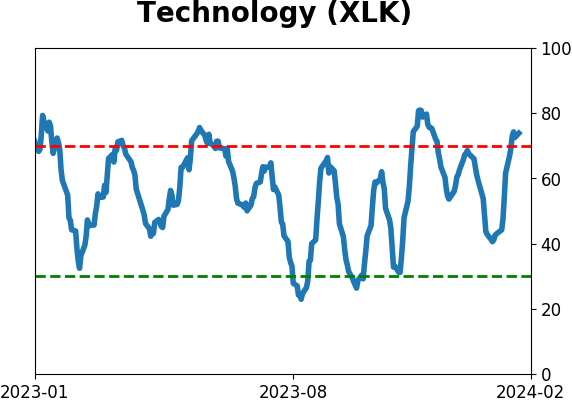
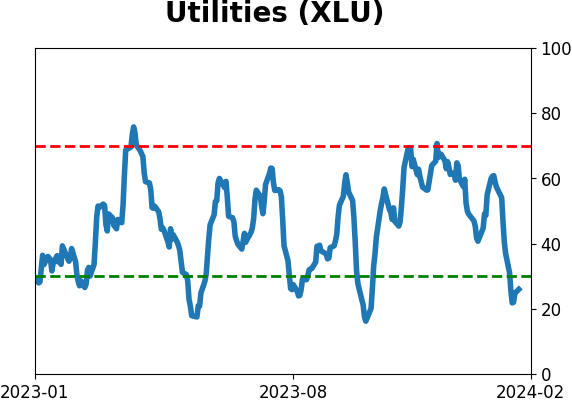
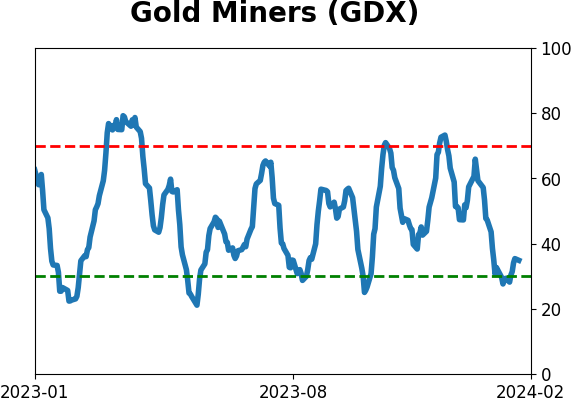
Sector ETF's - 10-Day Moving Average
|
|
|
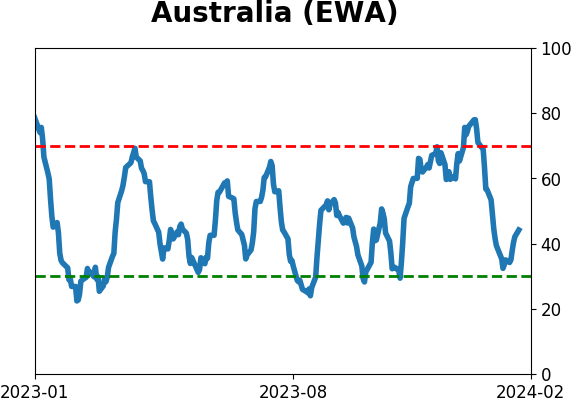
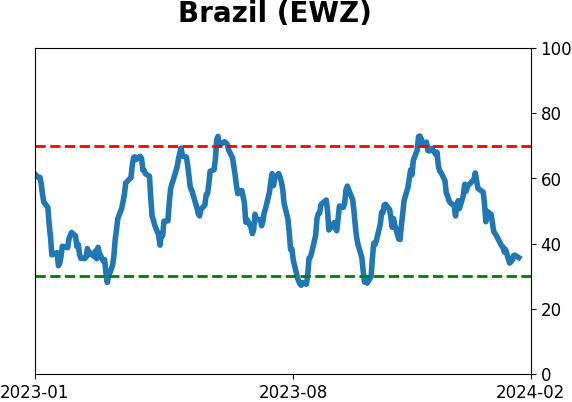
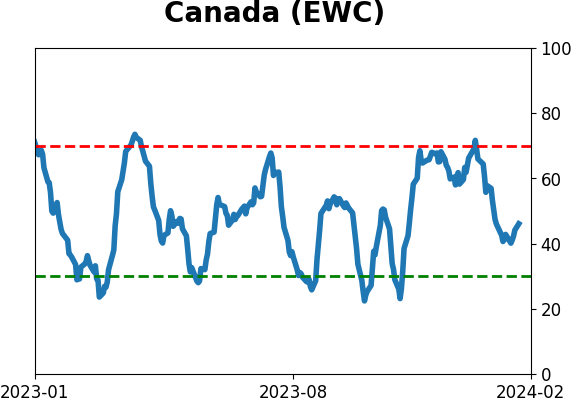
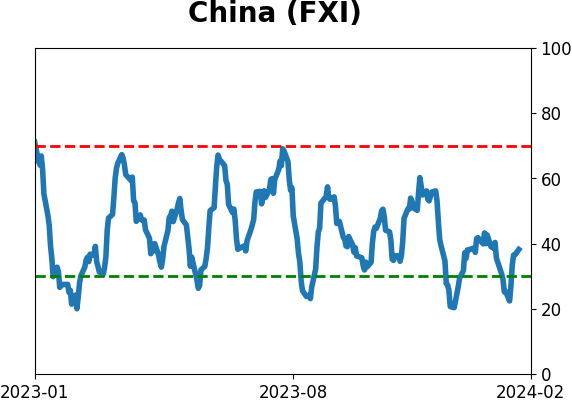
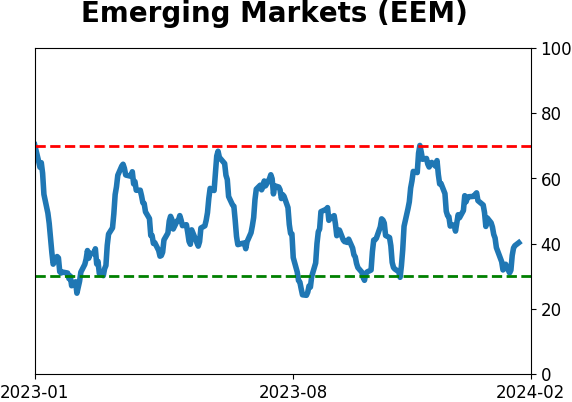
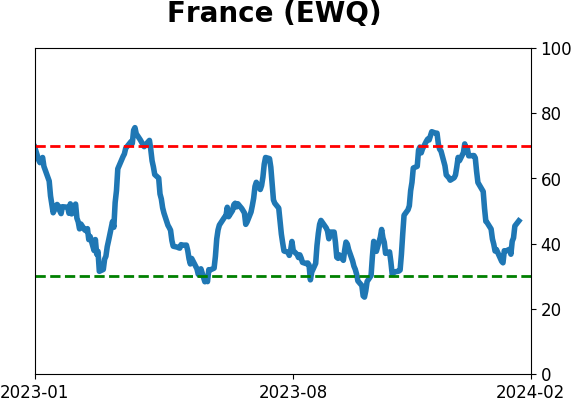
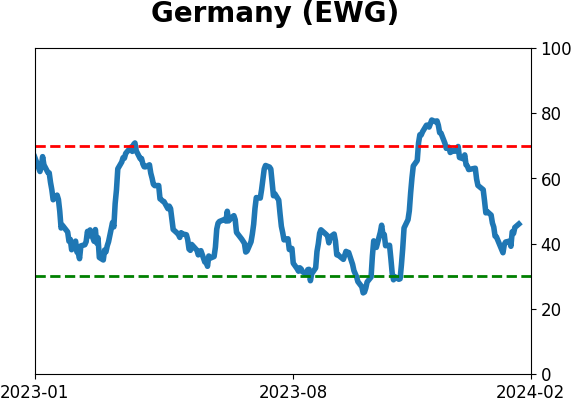
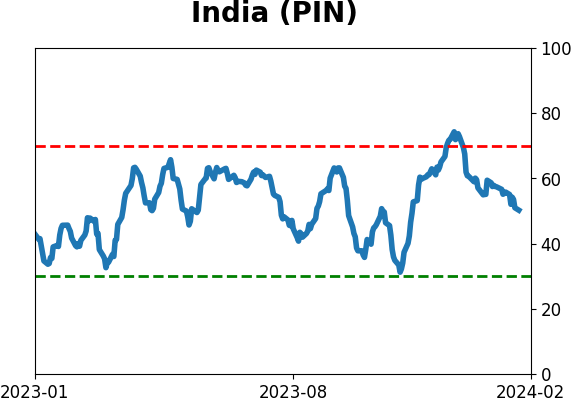
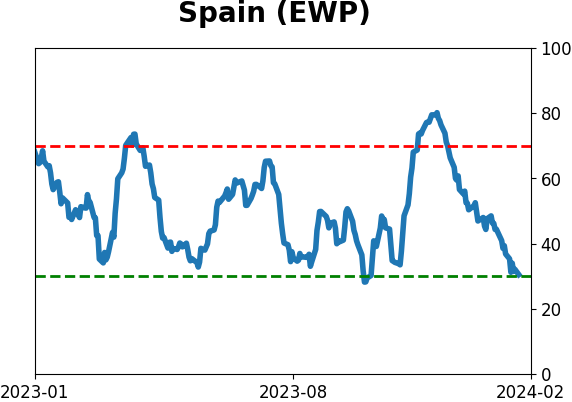
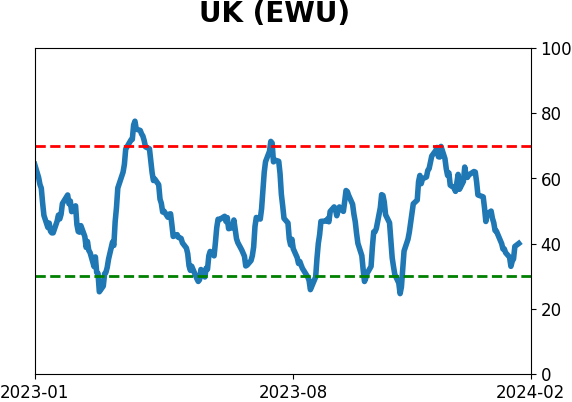
Country ETF's - 10-Day Moving Average
|
|
|
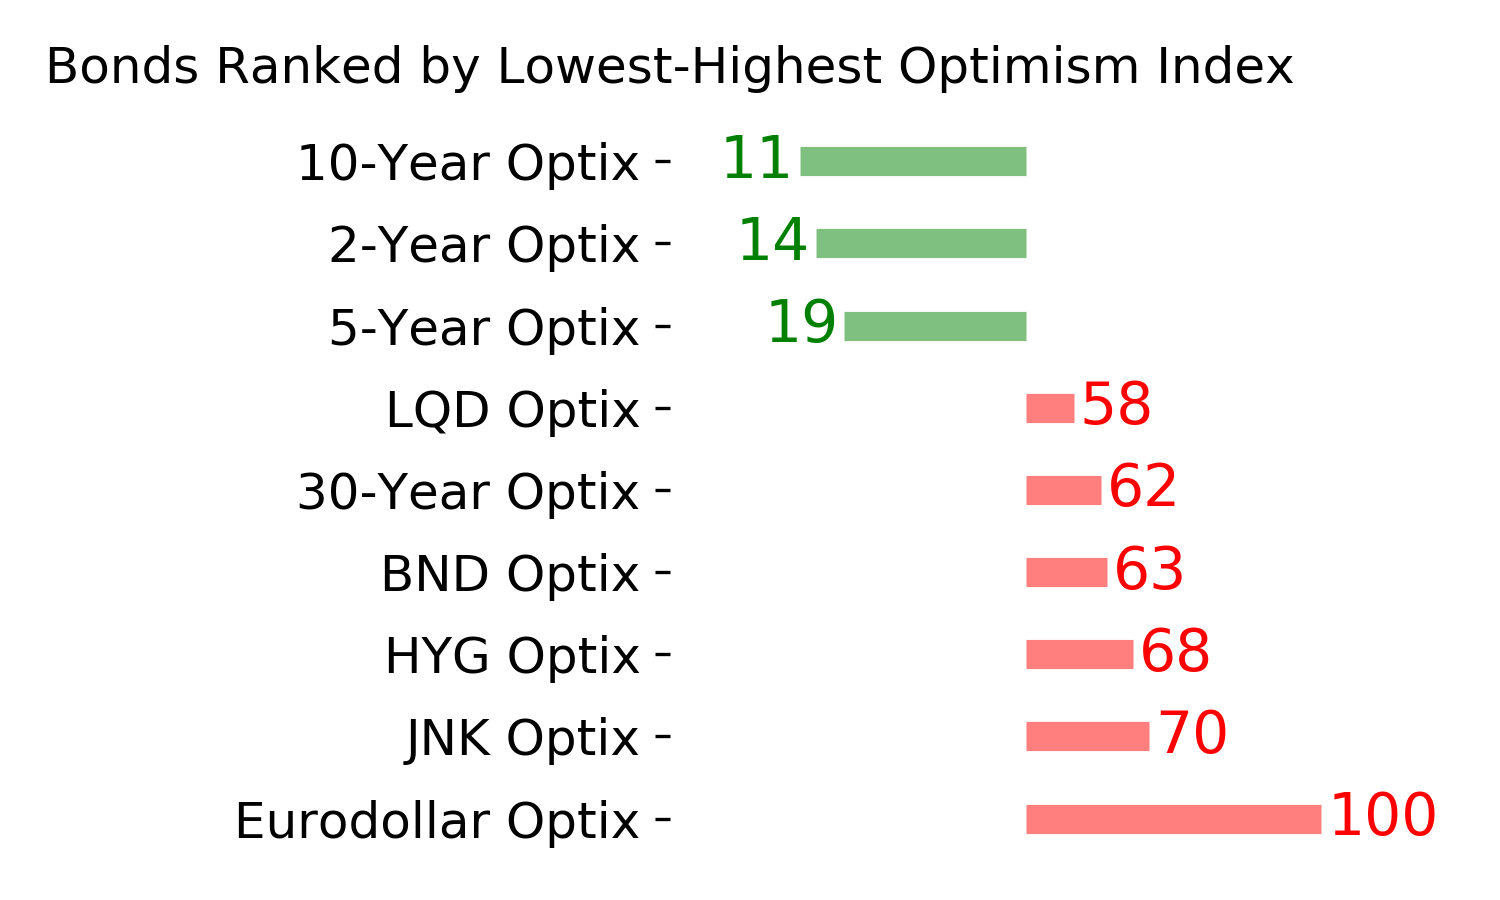
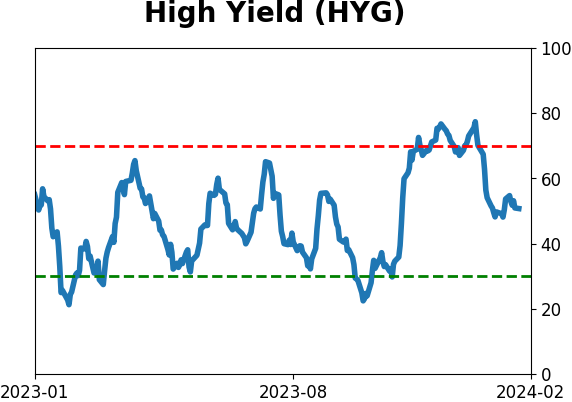
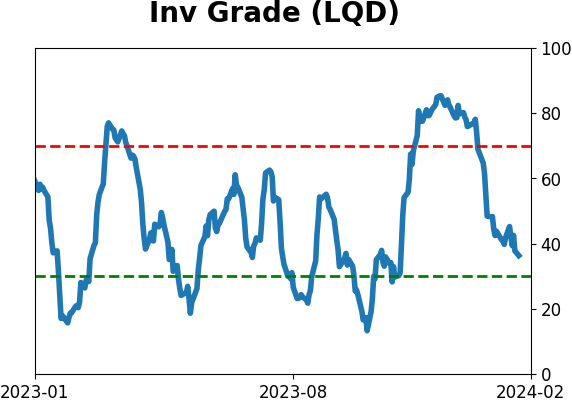
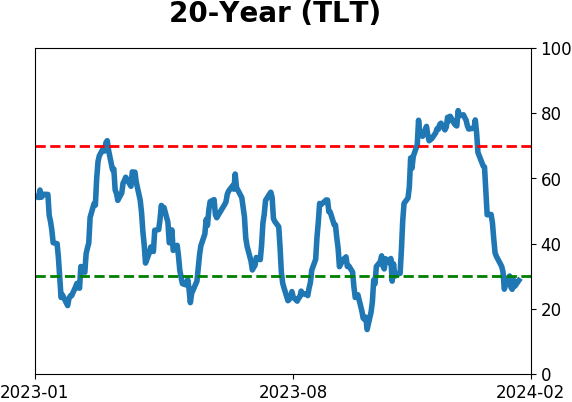
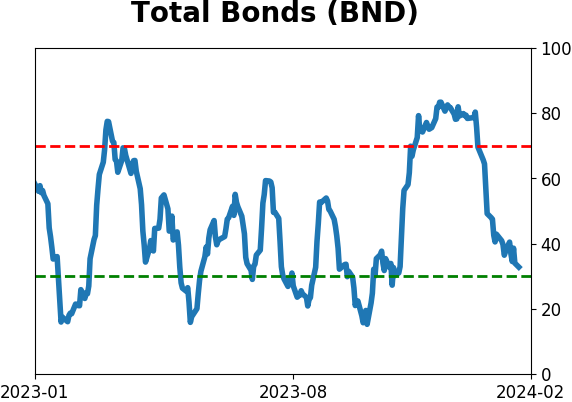
Bond ETF's - 10-Day Moving Average
|
|
|
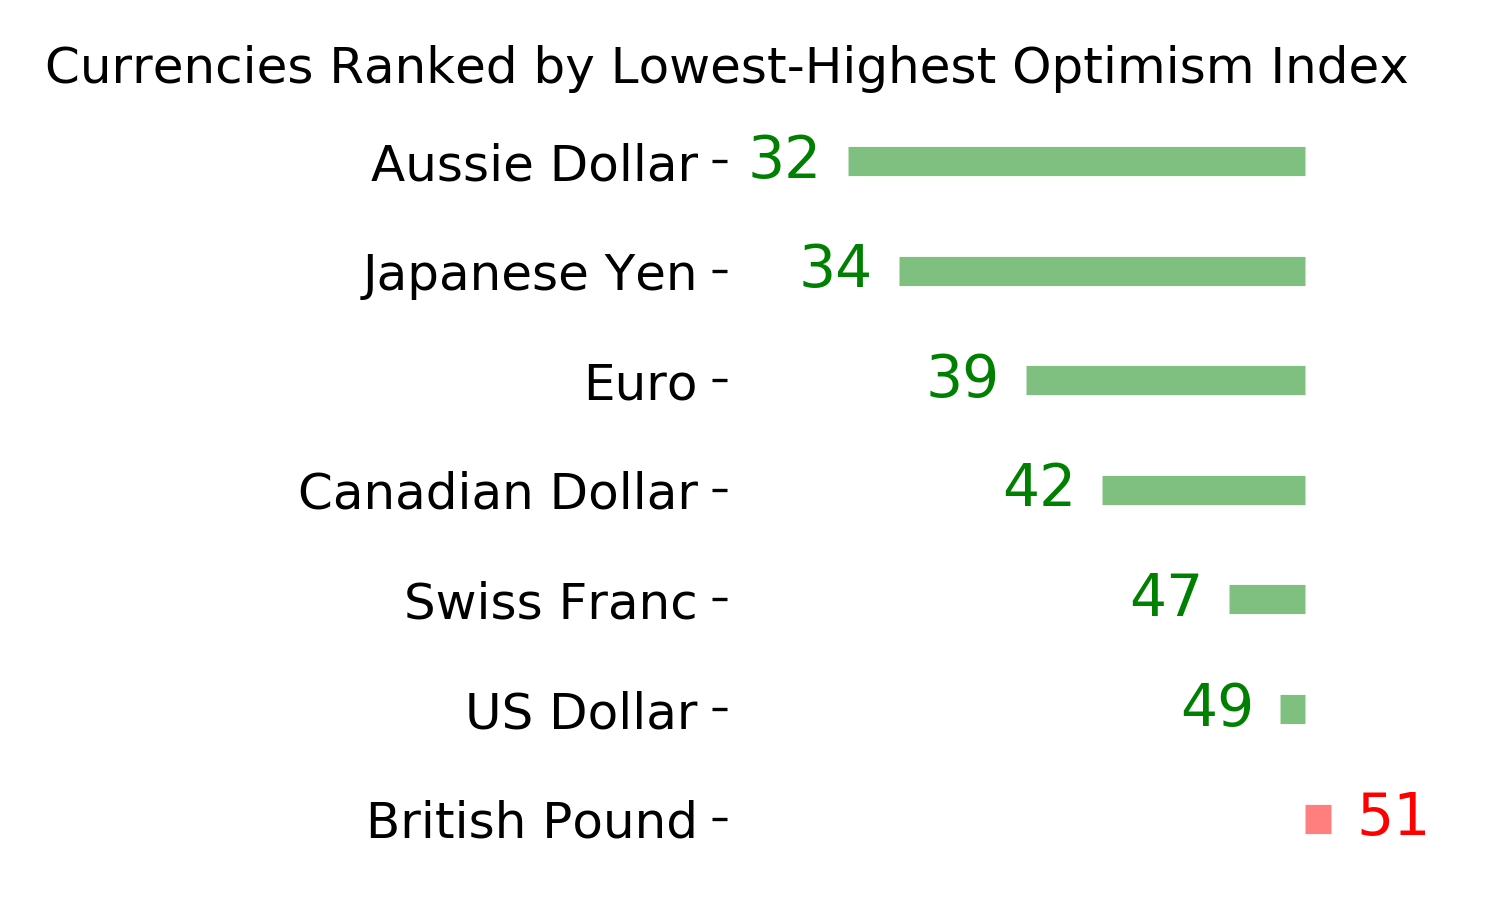
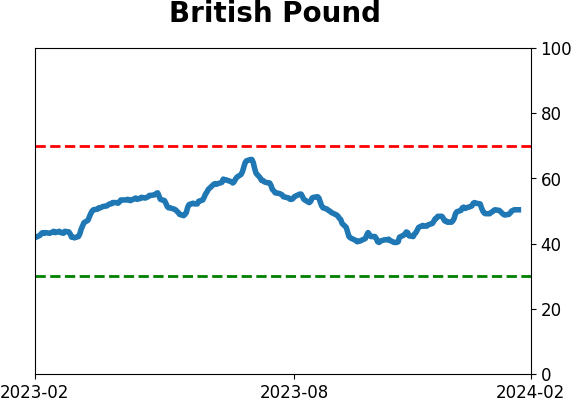
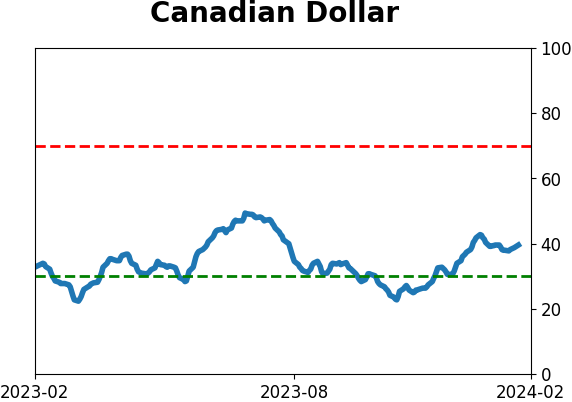
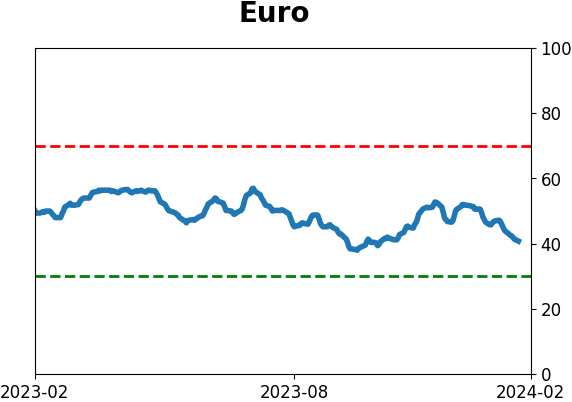
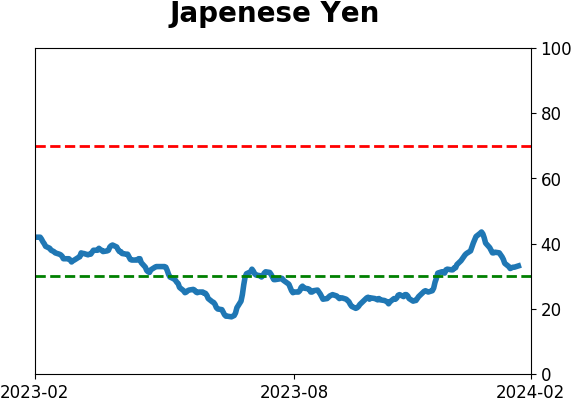
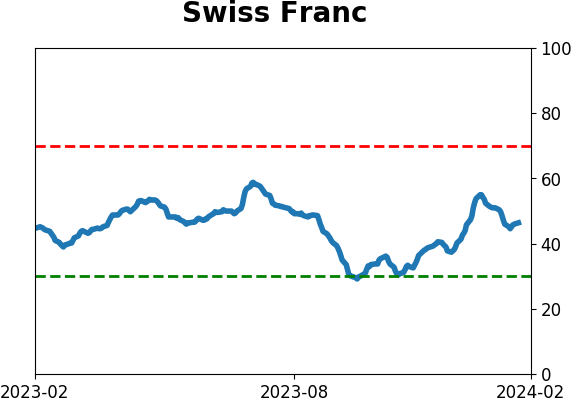
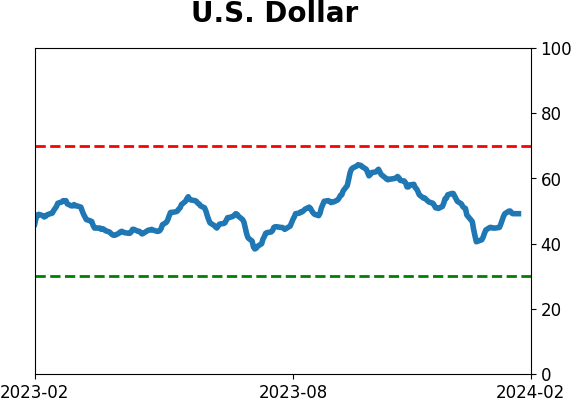
Currency ETF's - 5-Day Moving Average
|
|
|
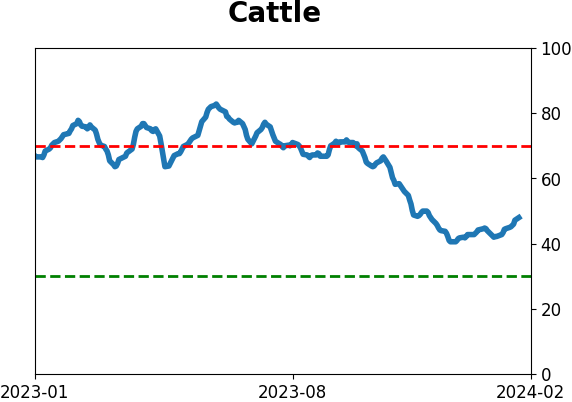
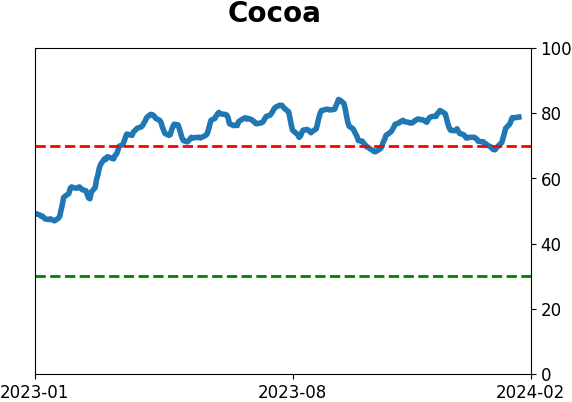
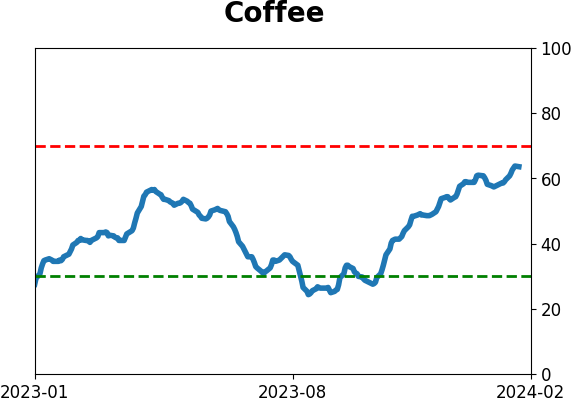
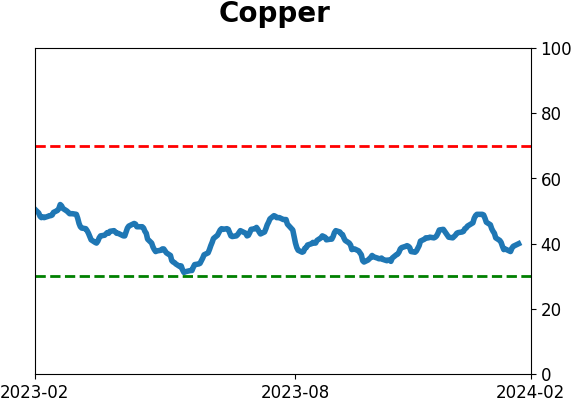
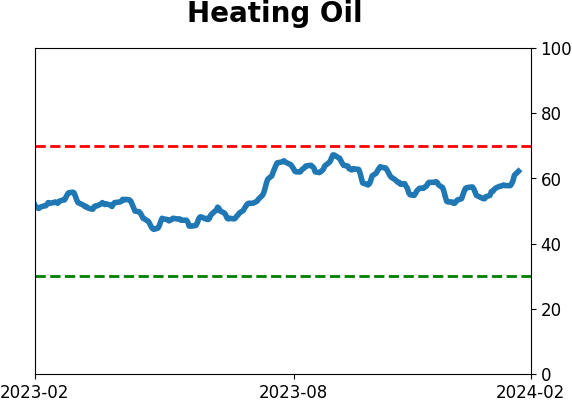
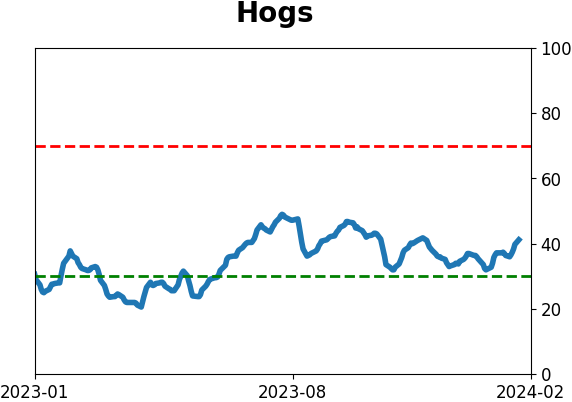
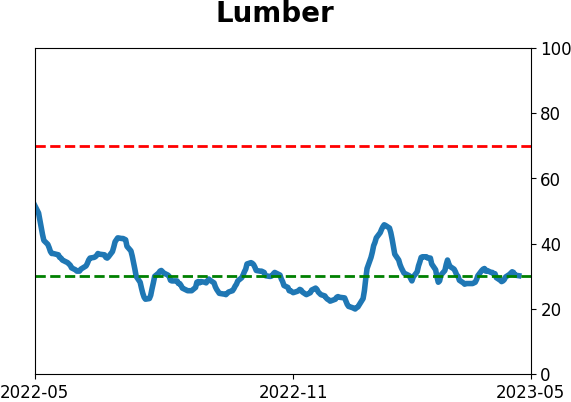
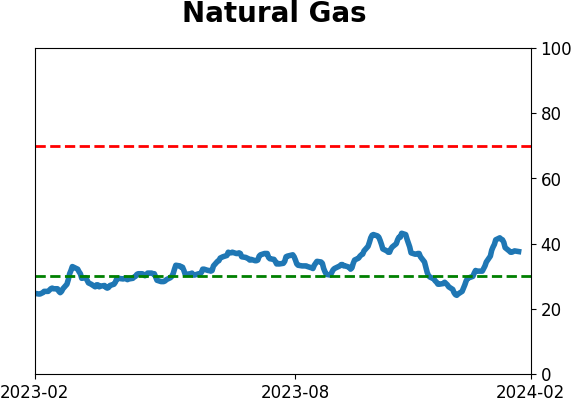
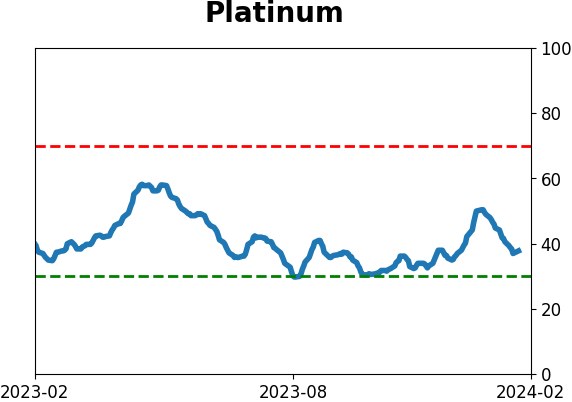
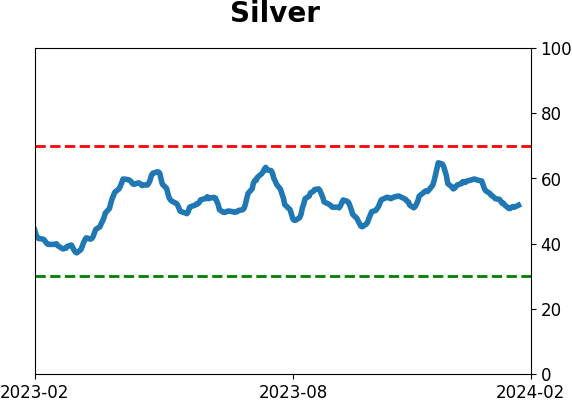
Commodity ETF's - 5-Day Moving Average
|
|