Headlines
|
|
What the Treasury Bear Flattener may mean for stocks and other assets:
The quick rise in Treasury yields, especially on the short end of the curve, has pushed us into a Bear Flattener regime. During those periods, the S&P 500 has showed the weakest growth. Other assets haven't done much better. Real Estate, Financials, and Value stocks have typically performed the best.
|
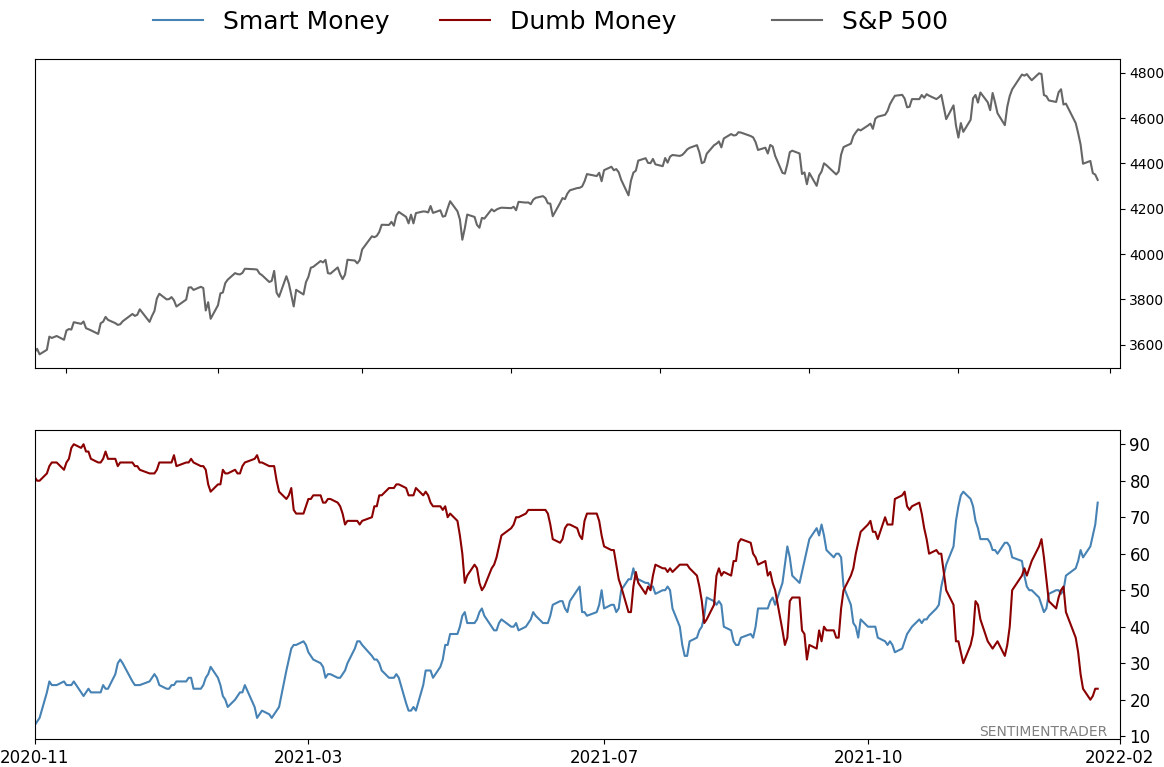
Smart / Dumb Money Confidence
|
Smart Money Confidence: 74%
Dumb Money Confidence: 23%
|
|
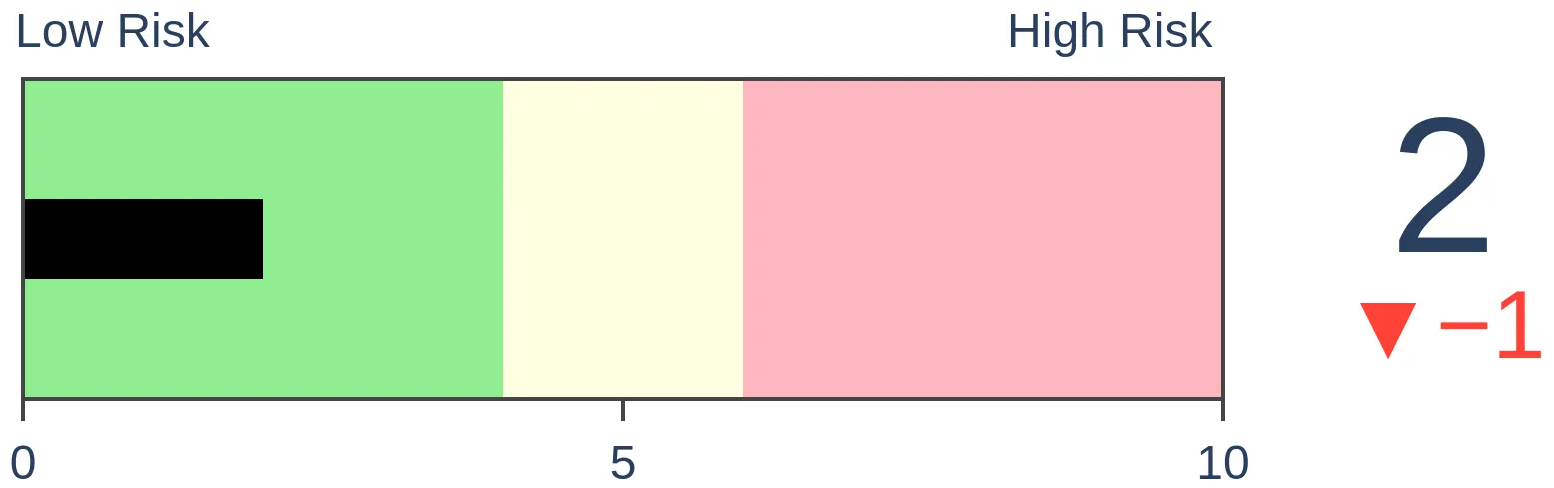
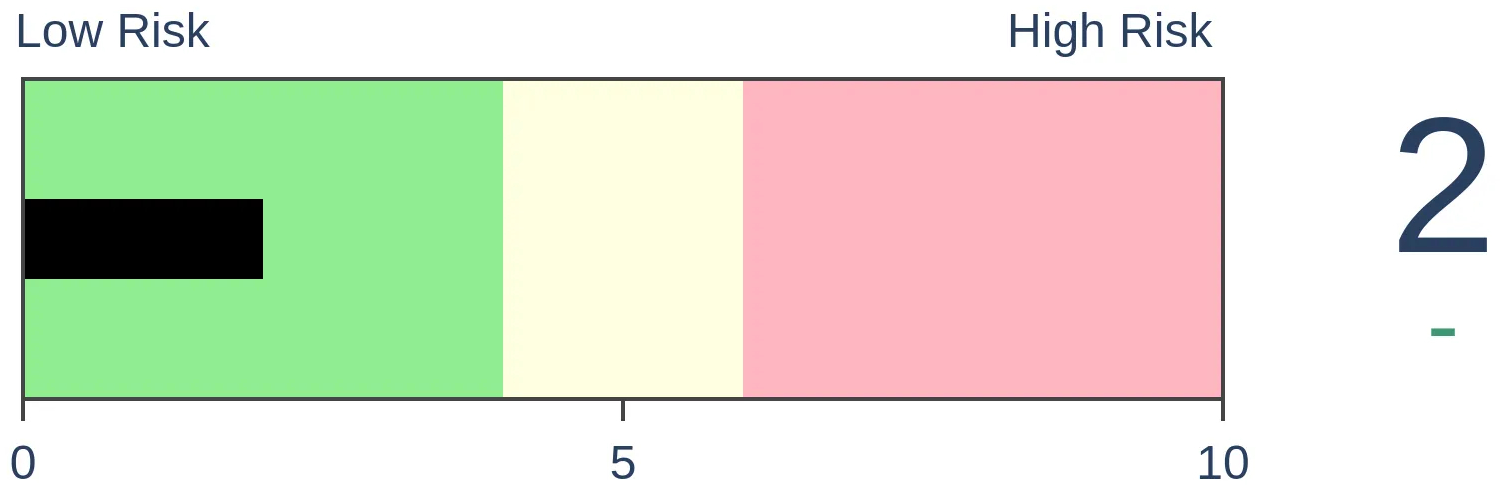
Risk Levels
Stocks Short-Term
|
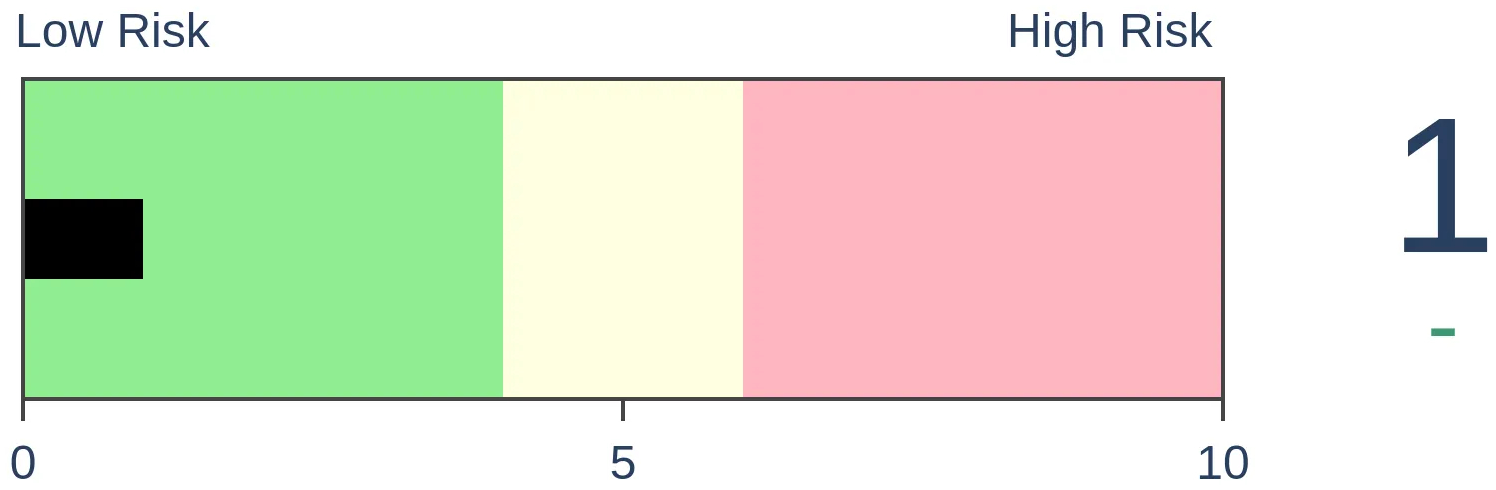
Stocks Medium-Term
|
|
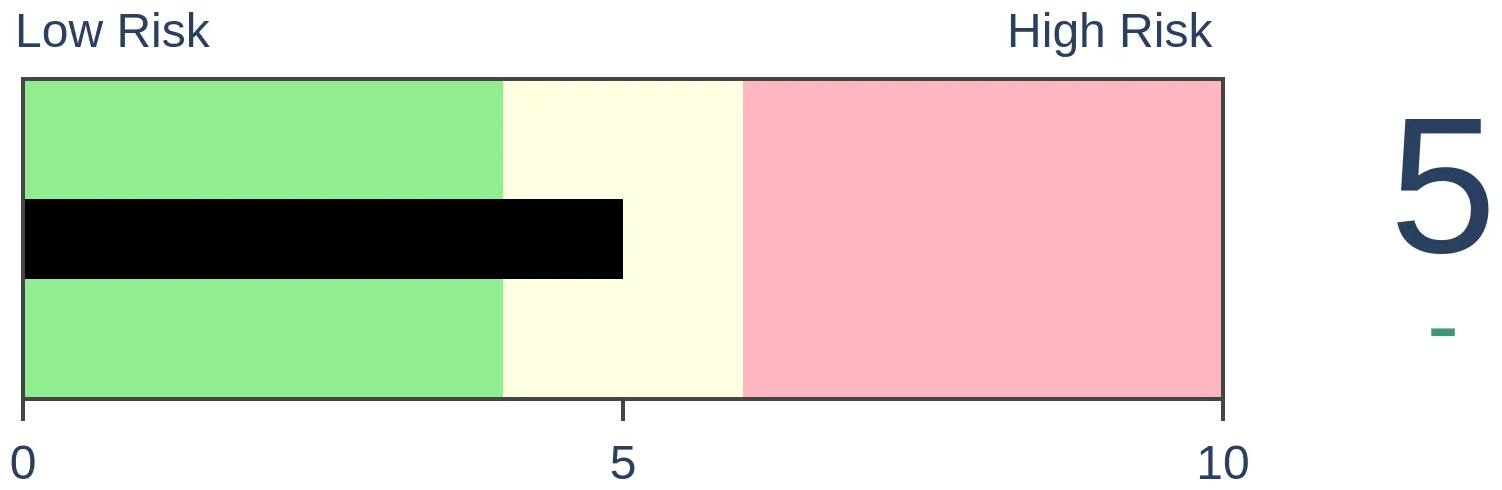
Bonds
|
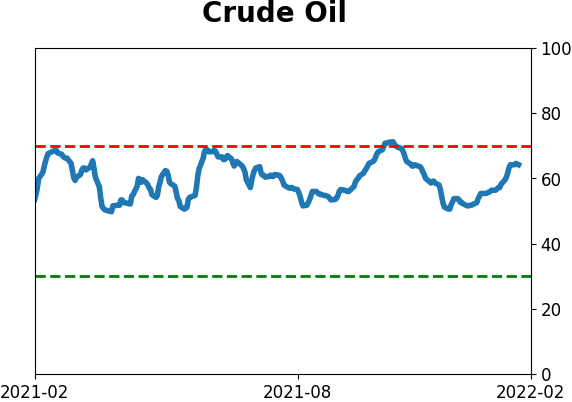
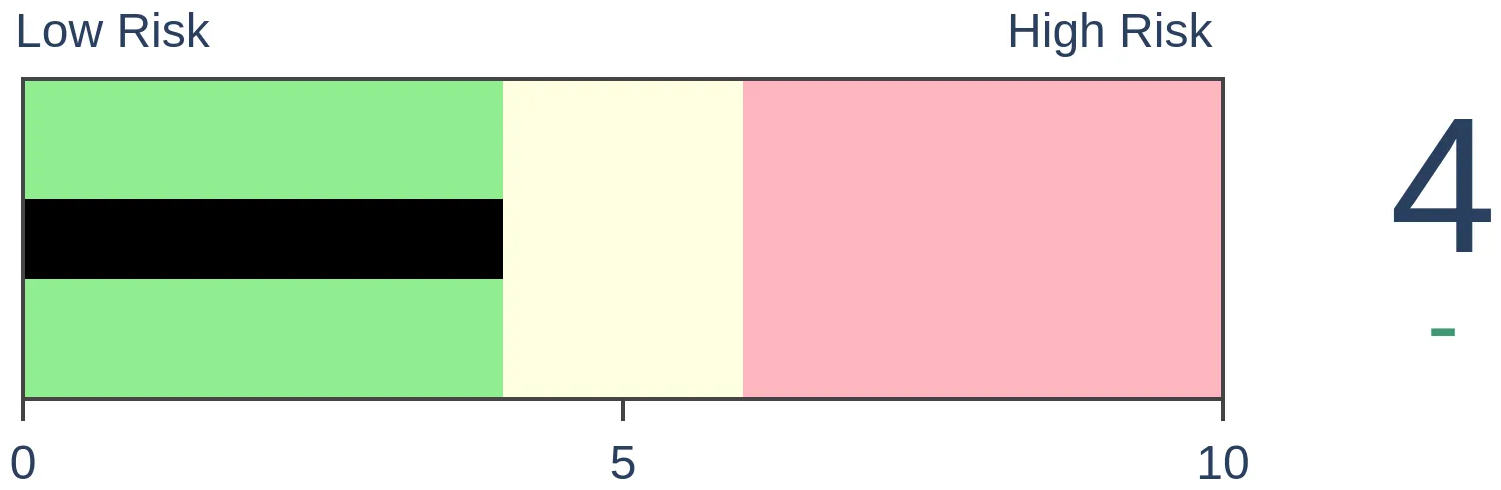
Crude Oil
|
|
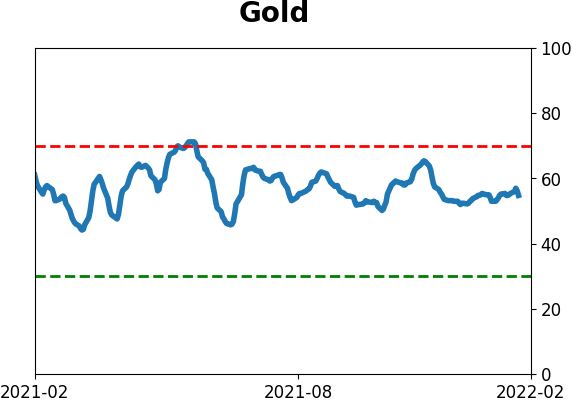
Gold

|
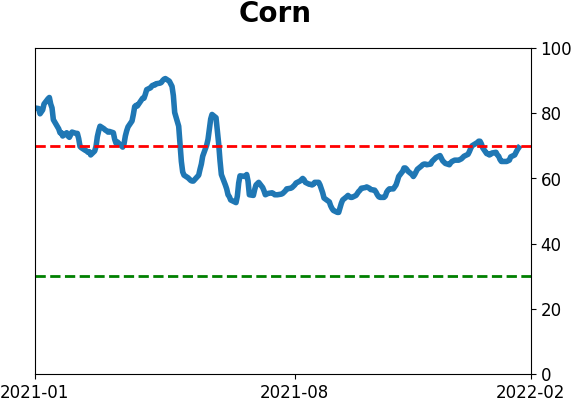
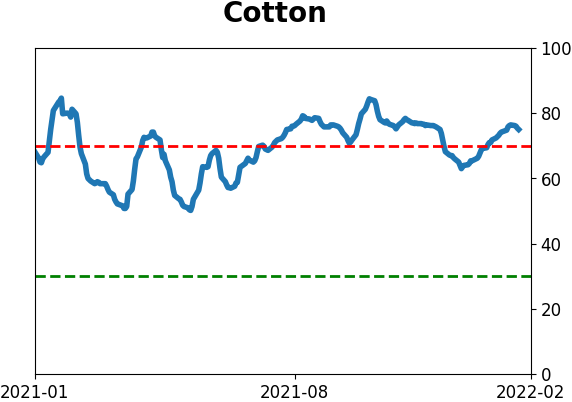
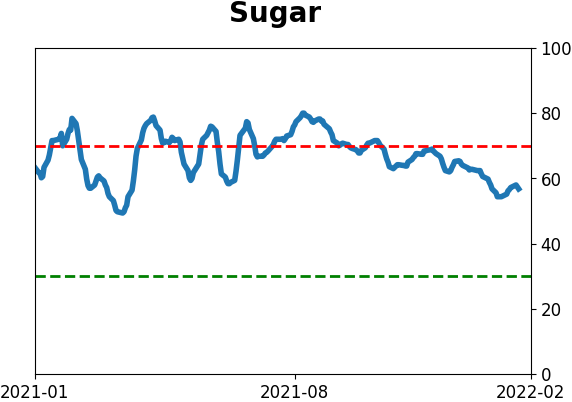
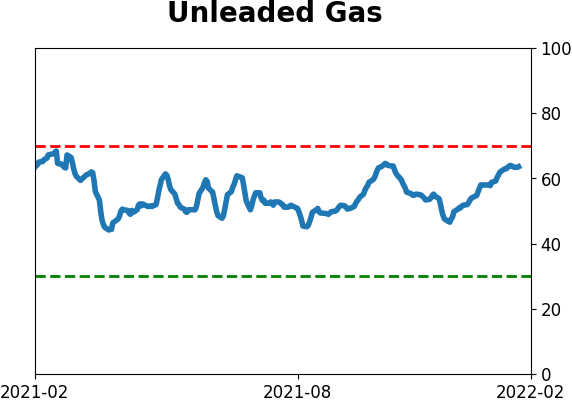
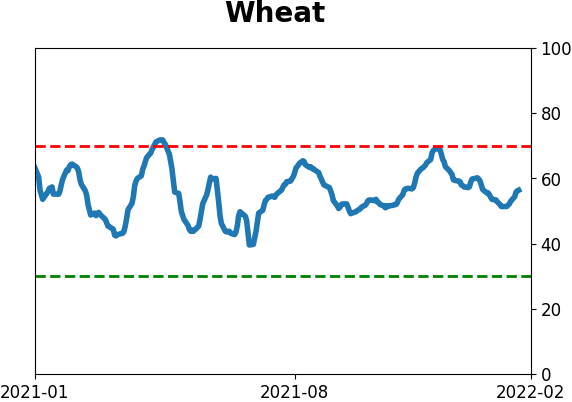
Agriculture
|
|
Research
By Jason Goepfert
BOTTOM LINE
The quick rise in Treasury yields, especially on the short end of the curve, has pushed us into a Bear Flattener regime. During those periods, the S&P 500 has showed the weakest growth. Other assets haven't done much better. Real Estate, Financials, and Value stocks have typically performed the best.
FORECAST / TIMEFRAME
None
|
Key points:
- U.S. Treasury yields are rising, and 2-year maturities more than 10-year
- That points to a Bear Flattener regime
- During those regimes, the S&P 500 has showed the worst performance, as have other assets
Treasury yield regime points to Bear Flattener
This is going to get dangerously close to a macro note, which I try to avoid. There are much better sources out there for data and opinions on Fed moves, economic trends, and potential implications.
But the move in 2-year Treasury notes after the FOMC meeting on Wednesday seemed to significantly dampen investor sentiment in equities. The gyration in Treasuries has been dramatic. Yields have skyrocketed, especially on the short end of maturities, and especially especially on Wednesday, with the biggest jump in 2-year yields in almost a year.
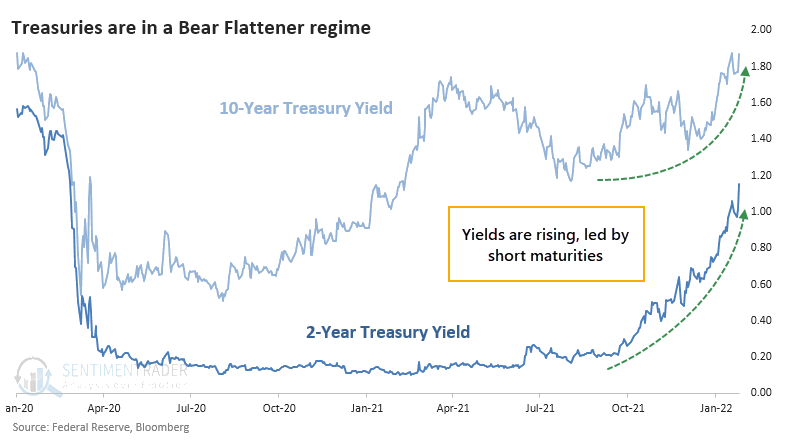
The fact that 2-year yields rose more than 10-year yields means that the yield curve got flatter. When a flattening occurs because the yield short-term maturities rises faster than longer-term maturities, it's considered to be a Bear Flattener. This is usually taken as a negative for stock investors because it means money is getting more expensive for consumers and businesses, and the Federal Reserve may be on the cusp of making it even more expensive, potentially triggering a recession.
There are innumerable ways to measure this, using different parts of the curve and different time frames. For our purposes, we're going to look at 2-year and 10-year Treasury yields and their changes from 3 months ago. That is not optimized at all. We chose those maturities because they are the most commonly referenced ones and a 3-month time frame seemed to be a reasonable compromise between being too sensitive and not sensitive enough to market movements.
| Regime | 2-Year Yield Trend | 10-Year Yield Trend | 2-Year vs. 10-Year | % of Time |
| Bull Flattener | Negative | Negative | Rising More | 24% |
| Bear Flattener | Positive | Positive | Rising More | 31% |
| Bull Steepener | Negative | Negative | Declining More | 26% |
| Bear Steepener | Positive | Positive | Declining More | 19% |
Since late October, 2-year yields have jumped 71 basis points while 10-year yields have risen 24 basis points. Since both are positive, and 2-year yields rose more than 10-year yields, it's in the Bear Flattener regime. This has been the most common regime, occurring on 31% of the days since 1976.
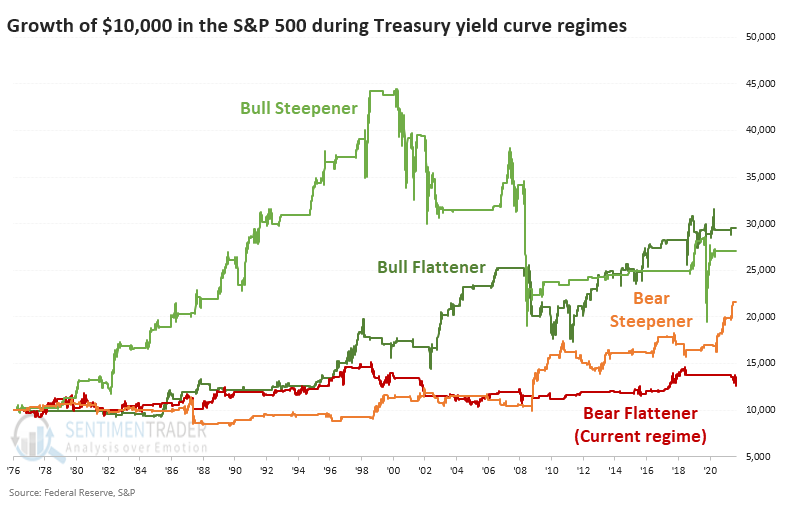
Markets (especially stocks), don't perform well during Bear Flatteners
The chart below shows the growth of $10,000 (using next-day returns) based on which regime the Treasury curve was indicating at the close of each trading day. Through 2000, the S&P 500 showed the best returns, by far, during a Bull Steepener regime, when yields were declining and 2-years more than 10-years.
Since 1976, the worst regime has been a Bear Flattener, which unfortunately is where we find ourselves now. Like we saw with the McClellan Summation Index when it's below zero and declining, this kind of regime has resulted in almost no gains over nearly 50 years. Over the past 20 years, it has produced a net loss.
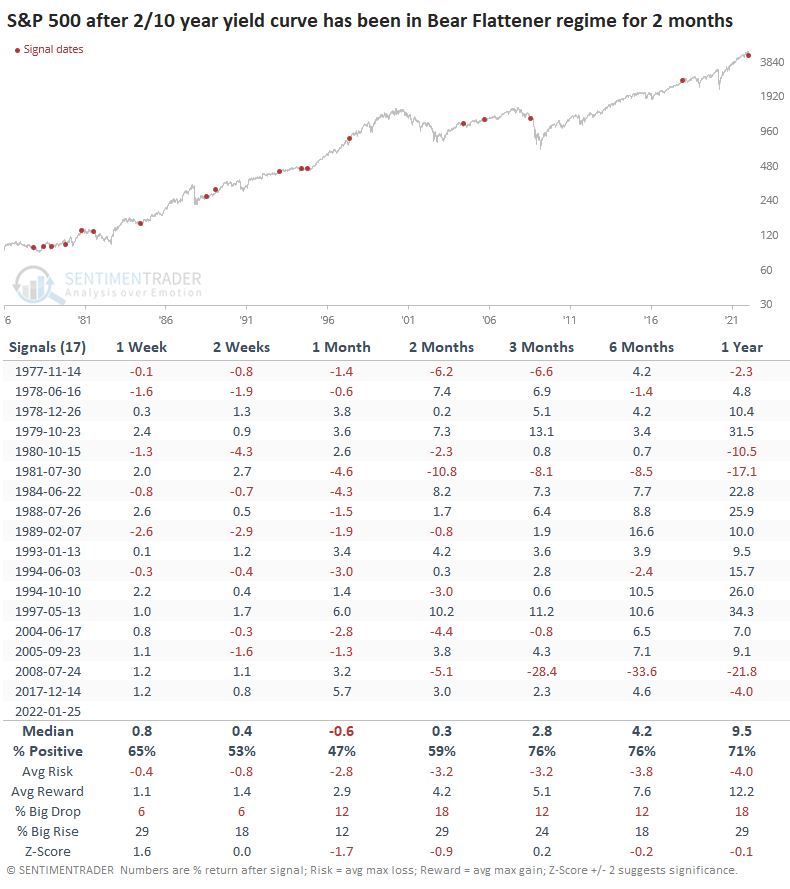
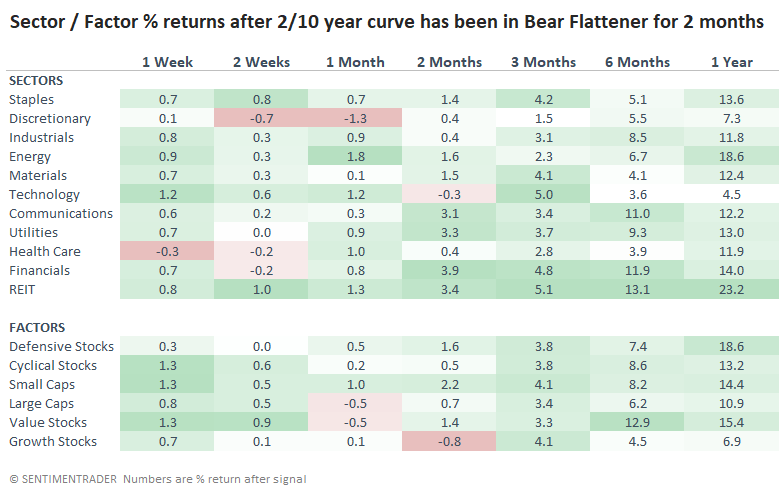
We've been stuck in a Bear Flattener for the past 2 months, or 42 trading days. The table below shows how the S&P 500 performed going forward once we'd gone this long into the regime.
It's not like returns were terrible, they just weren't very good. Over the past 20 years, the S&P's performance was "meh" over a medium- to long-term time frame. Only a few of them ended up preceding imminent, and lengthy, bear markets or extreme volatility.
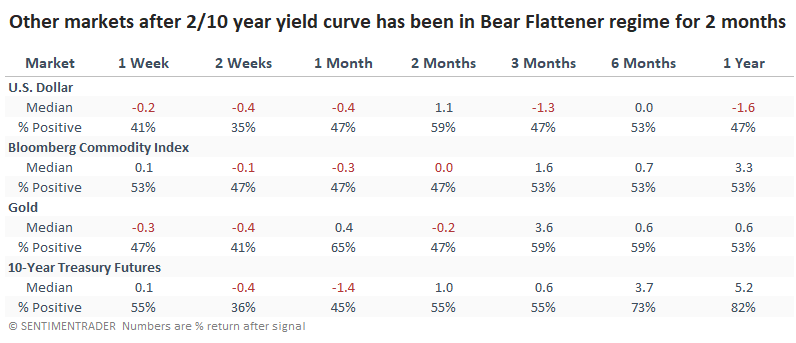
Among other markets, nothing really stood out, with most suffering losses over the short- to medium-term.
Sector and factor performance showed that Discretionary and Growth stocks suffered among the worst returns, with Technology not far behind. Among the winners, Real Estate, Financials, and Value stocks stood out the most.
What the research tells us...
I have no idea how long the current move in Treasuries will last, what impact the Federal Reserve will have on this market, or many of the broader implications. From a pure current price and yield perspective, we're seeing what has been among the least accommodative regimnes for stocks and most other assets. As long as that's the case, stocks may struggle, especially the more speculative ones that have been such a focus over the past year.
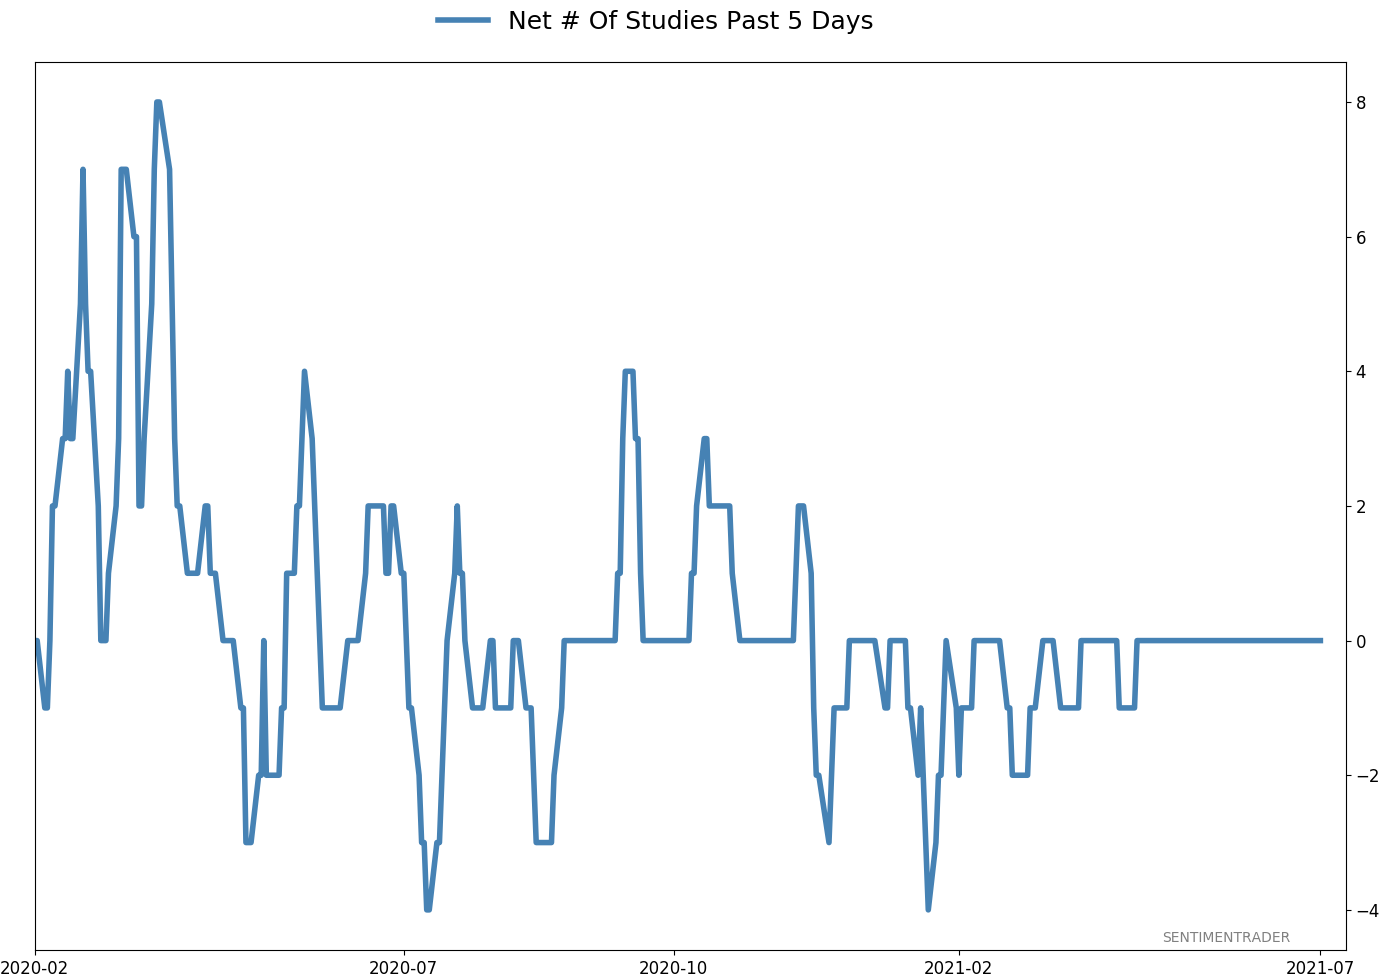
Active Studies
| Time Frame | Bullish | Bearish | | Short-Term | 3 | 0 | | Medium-Term | 13 | 2 | | Long-Term | 14 | 5 |
|
Indicators at Extremes
Portfolio
| Position | Description | Weight % | Added / Reduced | Date | | Stocks | RSP | 10.8 | Reduced 9.1% | 2022-01-20 | | Bonds | 32.7% BND, 7.1% SCHP | 40.1 | Added 8.3% | 2021-10-26 | | Commodities | GCC | 2.4 | Reduced 2.1%
| 2020-09-04 | | Precious Metals | GDX | 4.6 | Reduced 4.2% | 2021-05-19 | | Special Situations | 8.1% KWEB, 3.6% XLE, 1.7% PSCE | 13.4 | Reduced 3.9% | 2022-01-18 | | Cash | | 28.0 | | |
|
Updates (Changes made today are underlined)
Not impressed at all with the market action since there was a breadth thrust at the end of December, with selling pressure hitting consistently since then. The drawdown is beyond what we've typically seen after similar thrusts. More and more indicators are showing risk-off sentiment, and the market environment is sketchy. I've reduced risk because of it. Bond sentiment is trying to recover from a recent bout of pessimism, and gold stocks are doing their thing which is not much at all. They've been flat for six months. Chinese tech stocks were doing exactly what they're supposed to do, then did *not* by plunging to new lows. This is troubling on a shorter-term time frame, but this was never meant for a trade, rather a multi-year investment. Recent behavior is troubling and I will not be adding any exposure as long as that's the case. RETURN YTD: -1.8% 2021: +8.7%, 2020: +8.1%, 2019: +12.6%, 2018: +0.6%, 2017: +3.8%, 2016: +17.1%, 2015: +9.2%, 2014: +14.5%, 2013: +2.2%, 2012: +10.8%, 2011: +16.5%, 2010: +15.3%, 2009: +23.9%, 2008: +16.2%, 2007: +7.8%
|
|
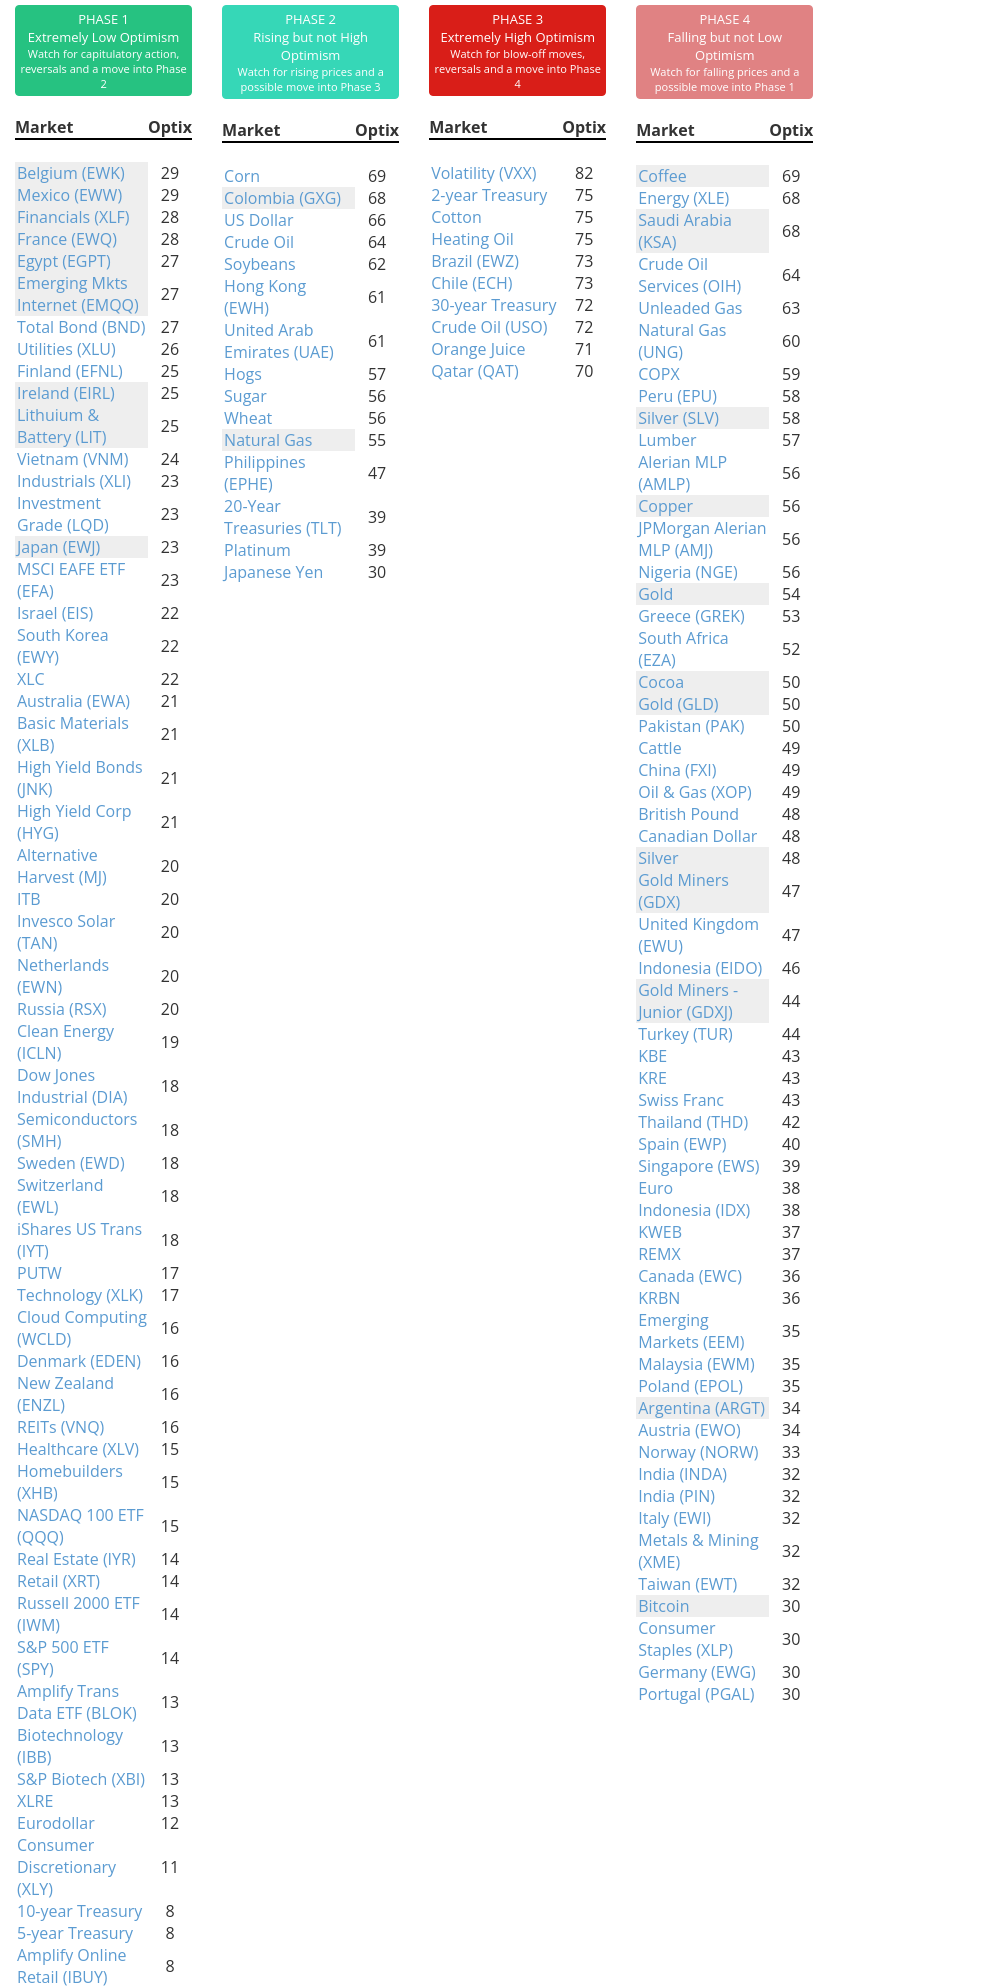
Phase Table
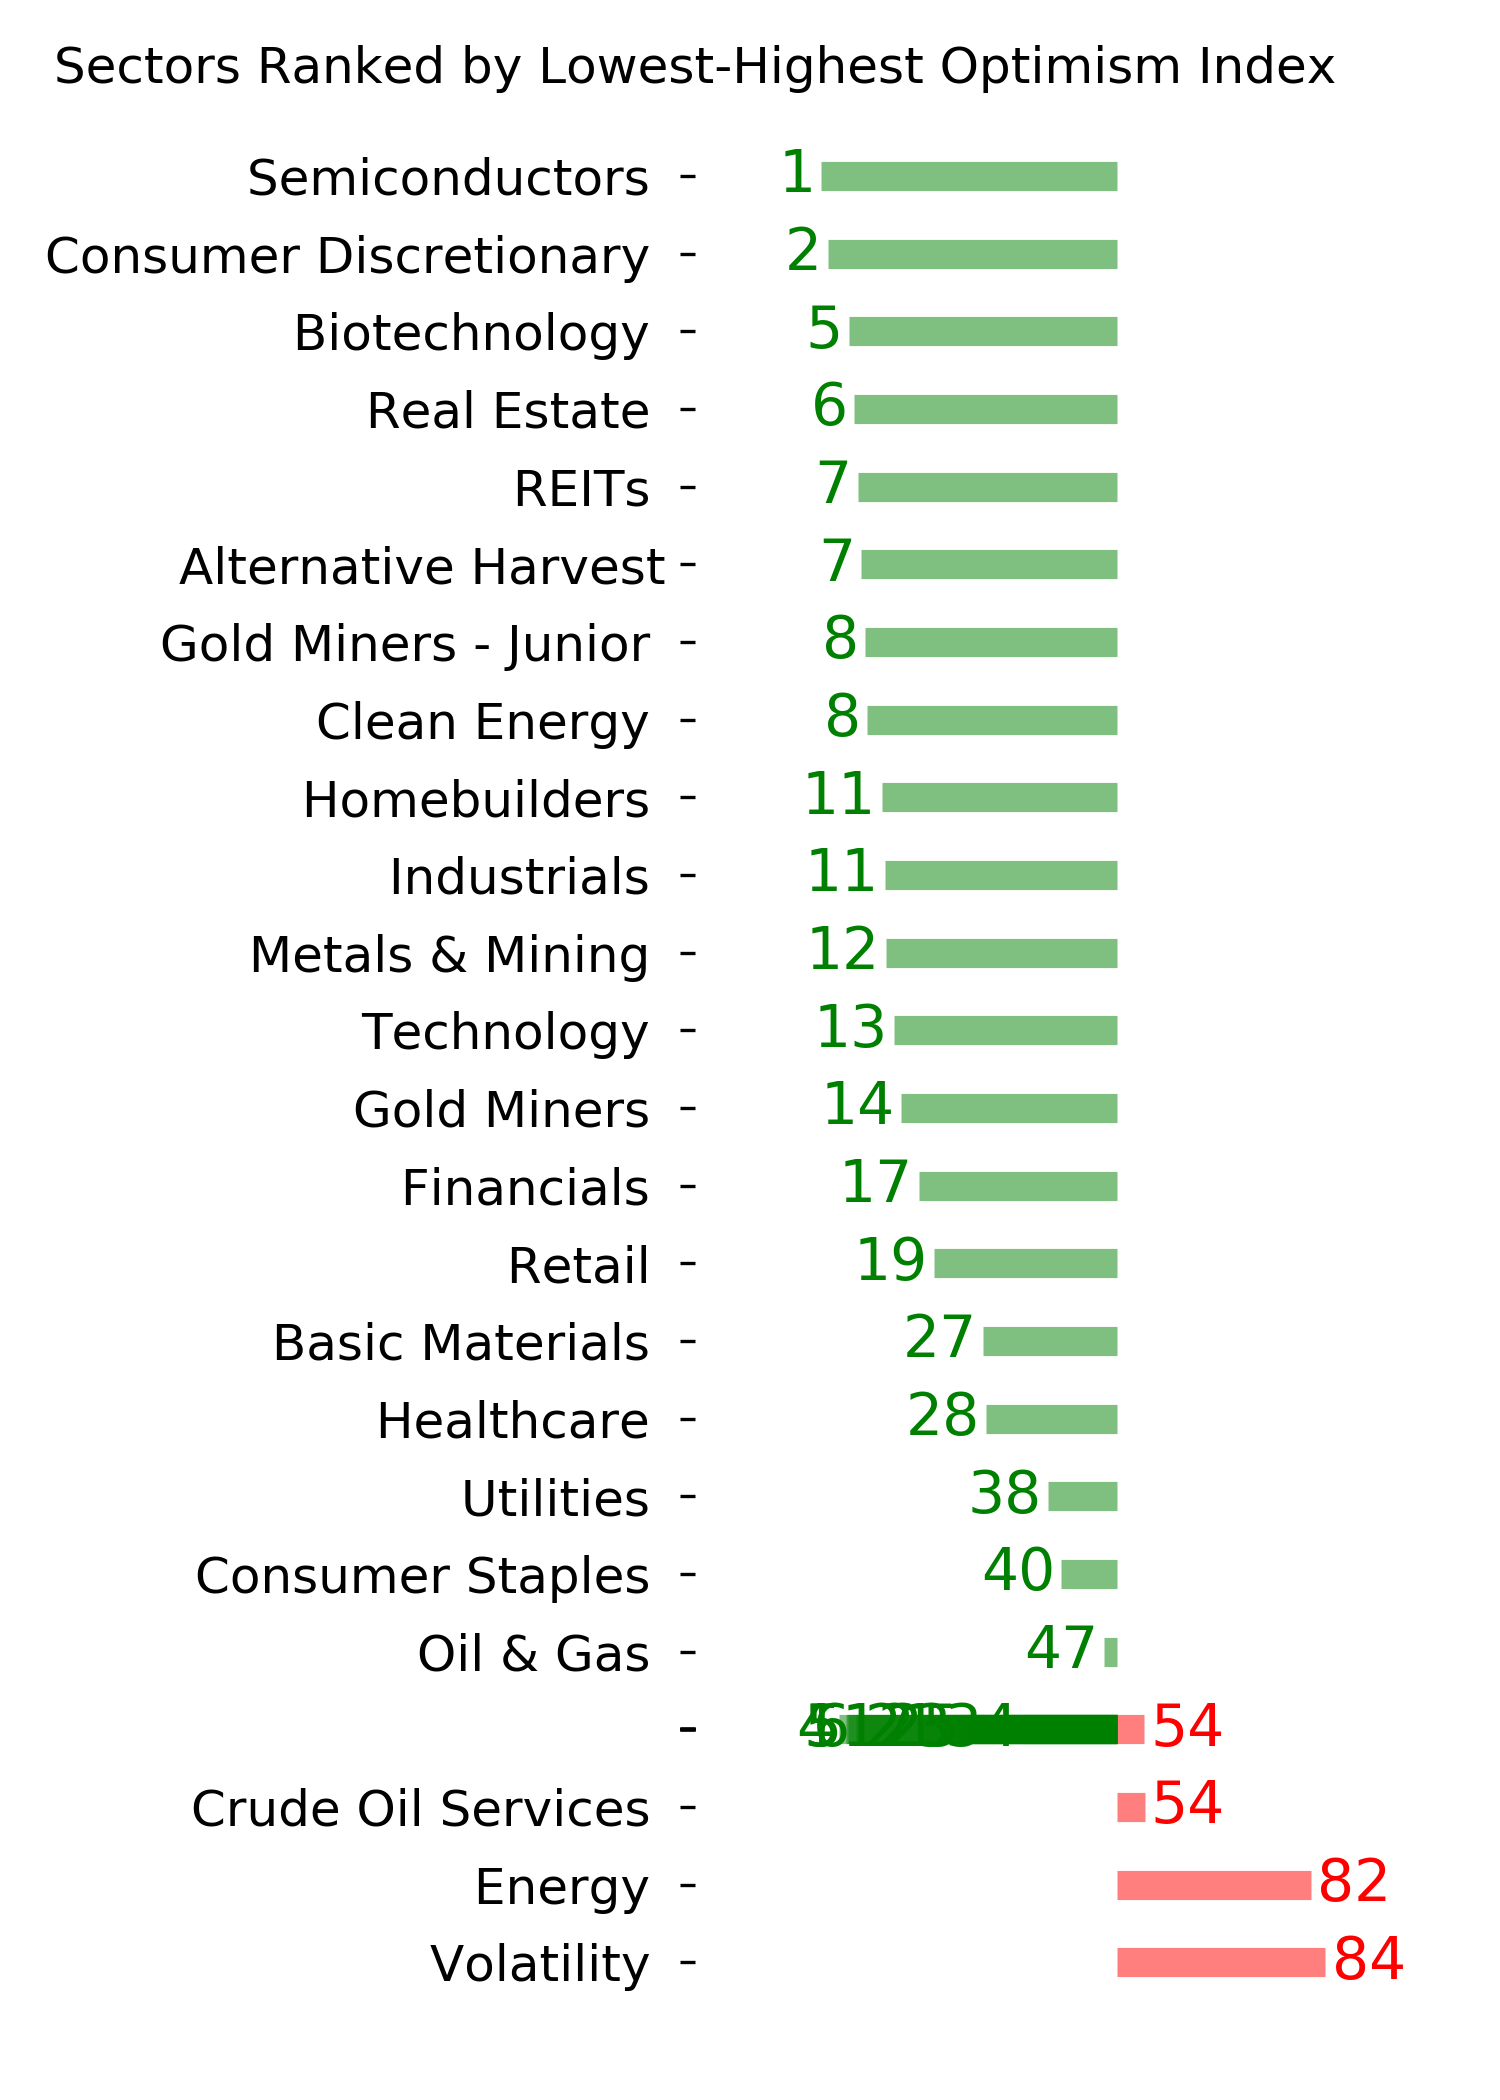
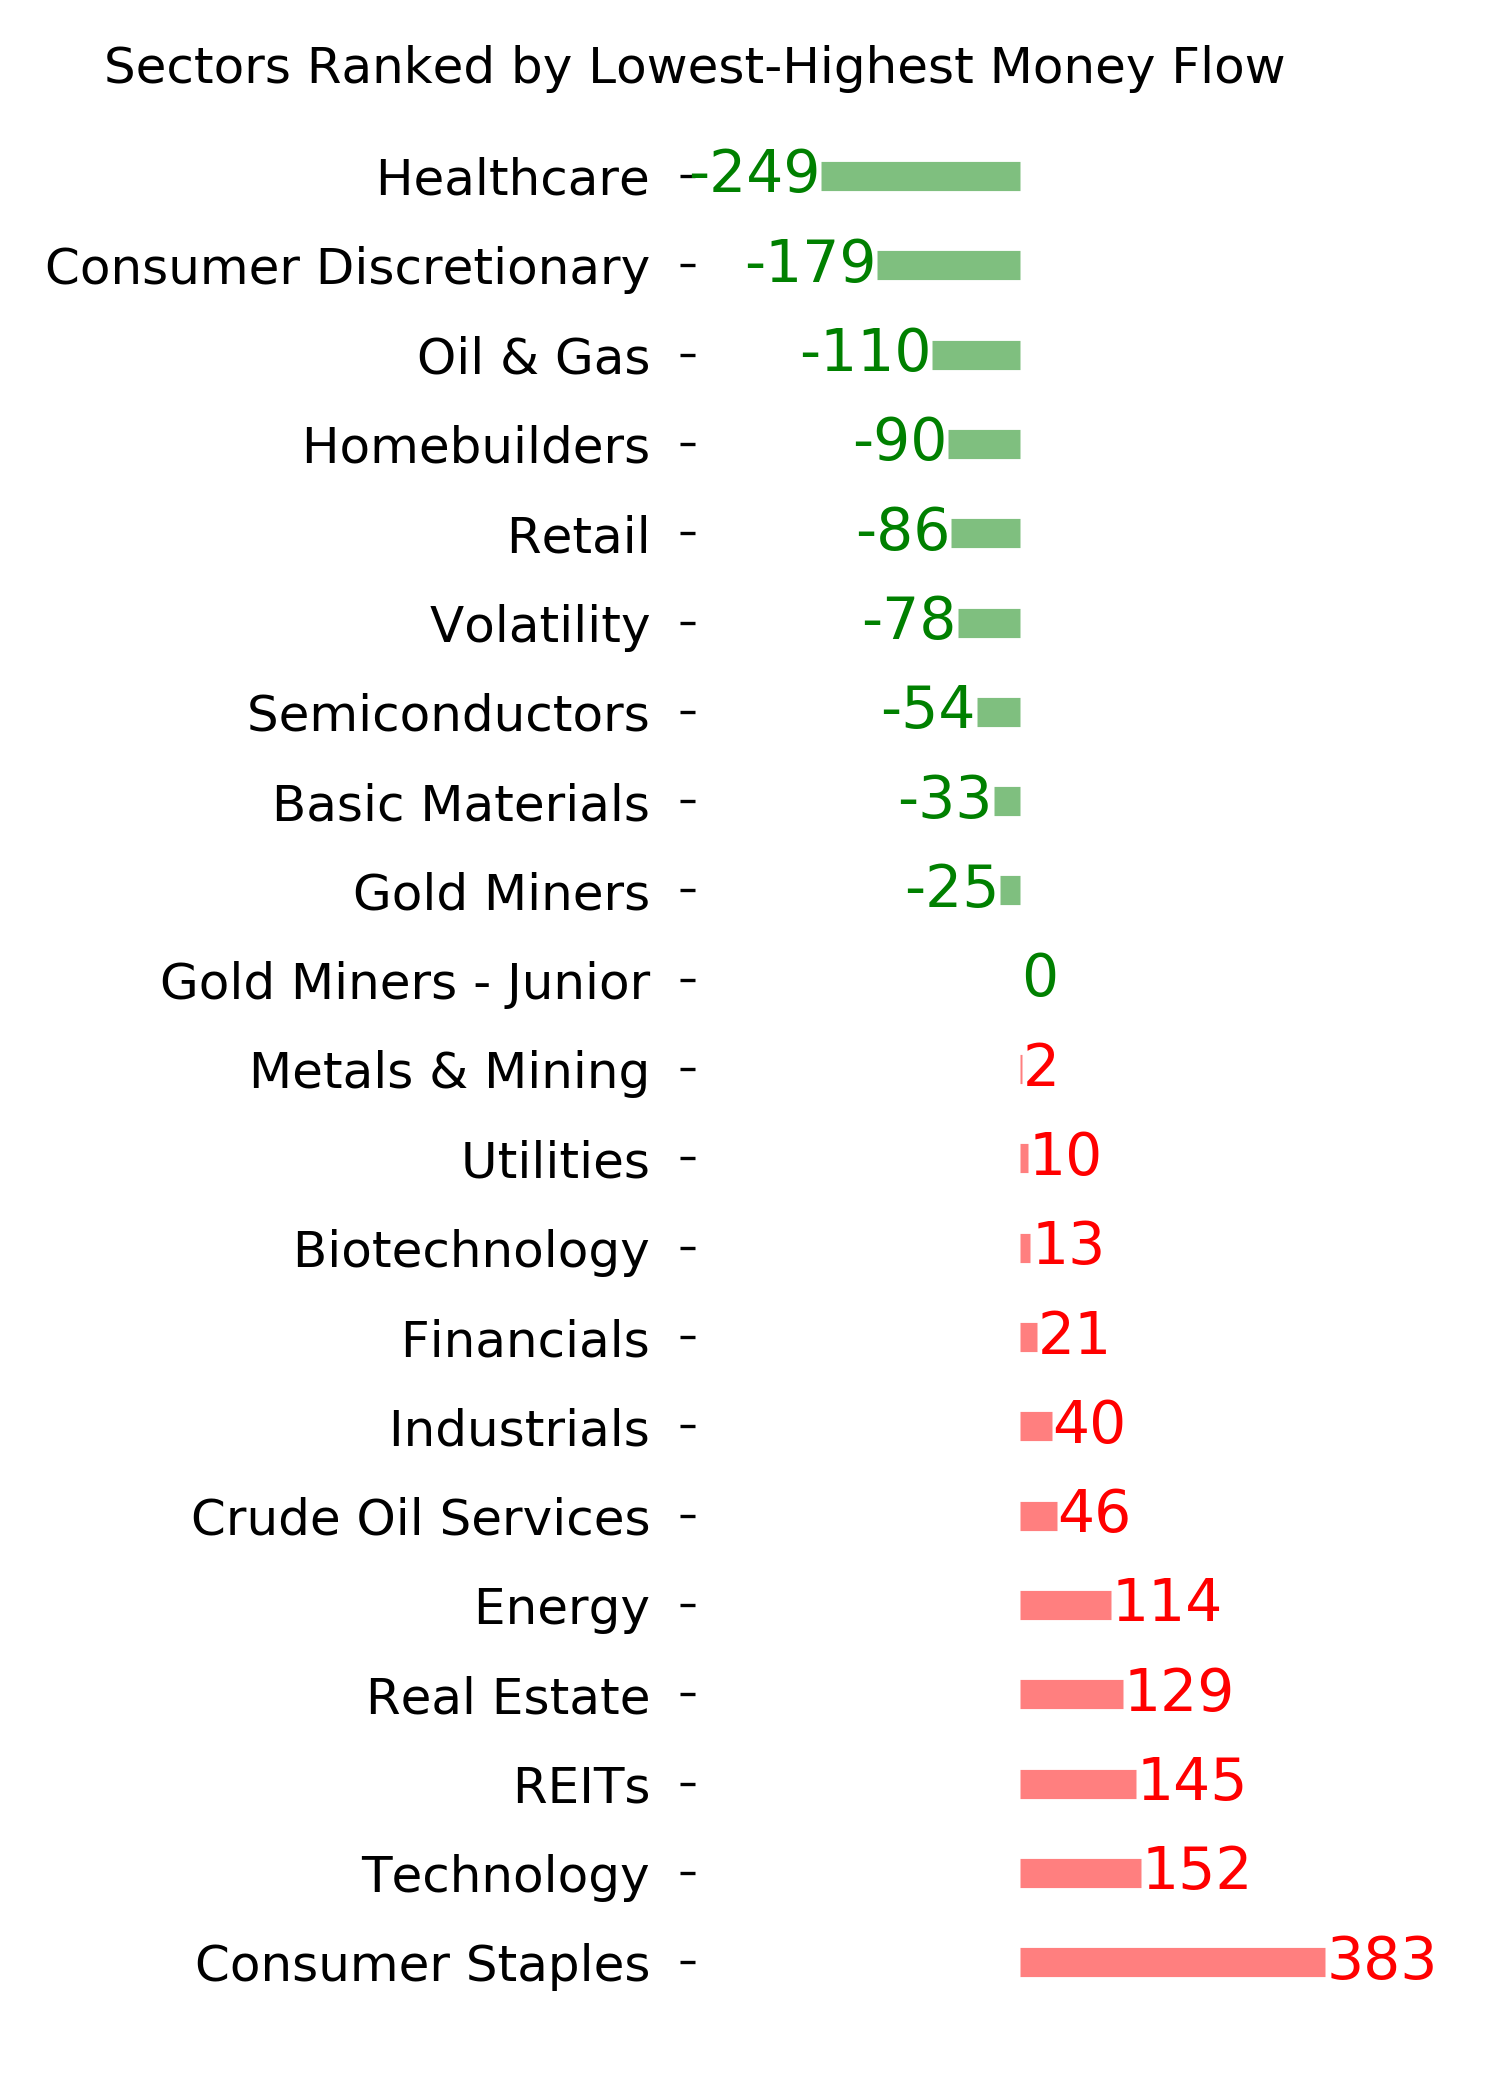
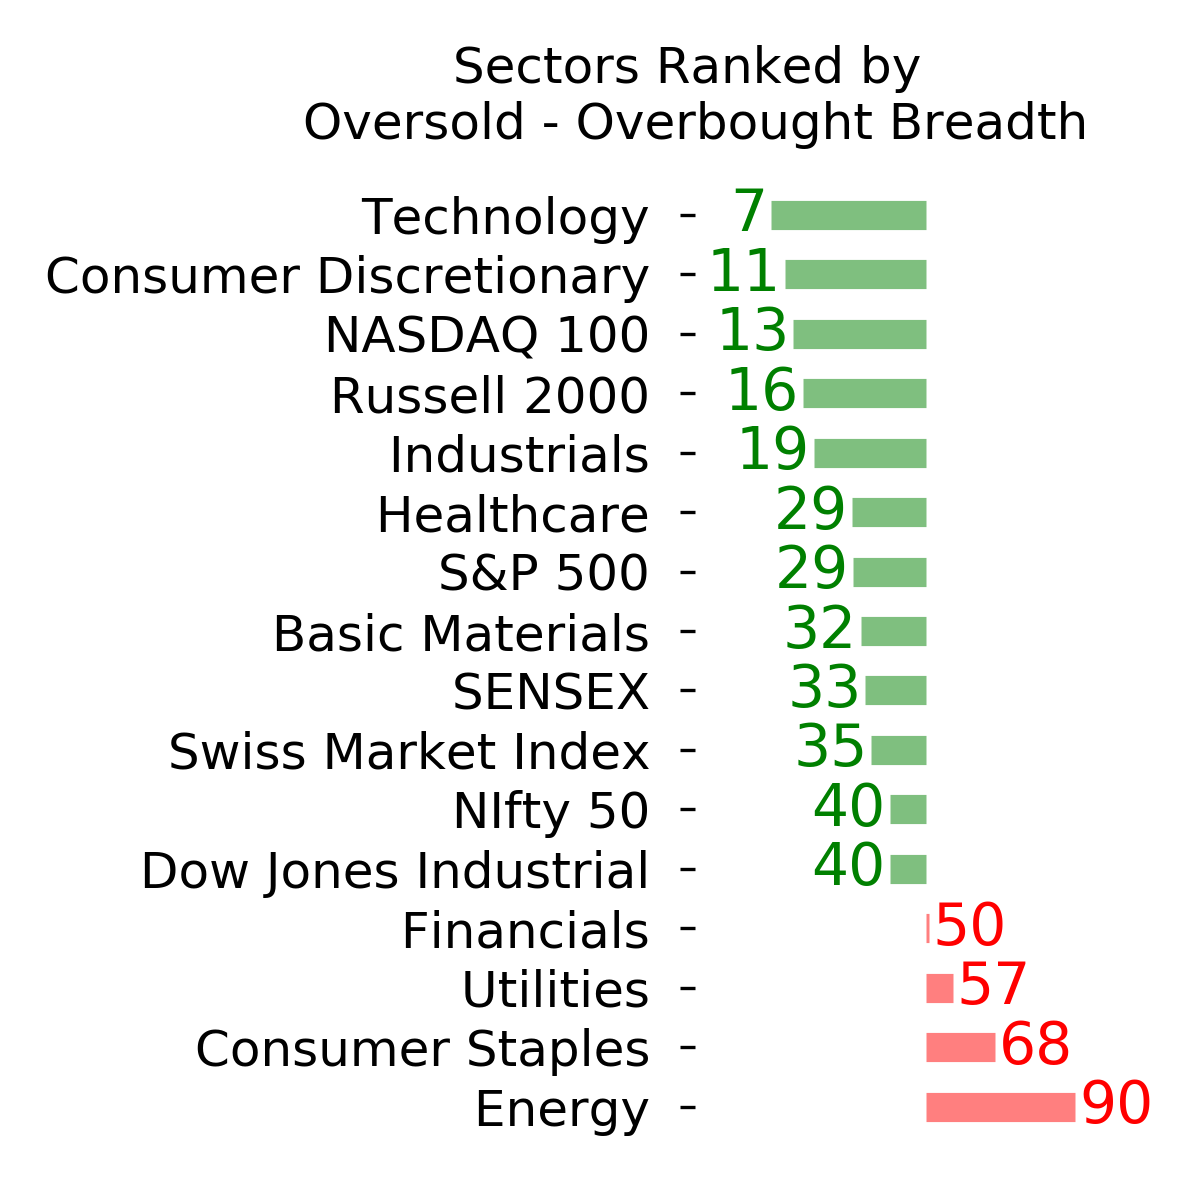
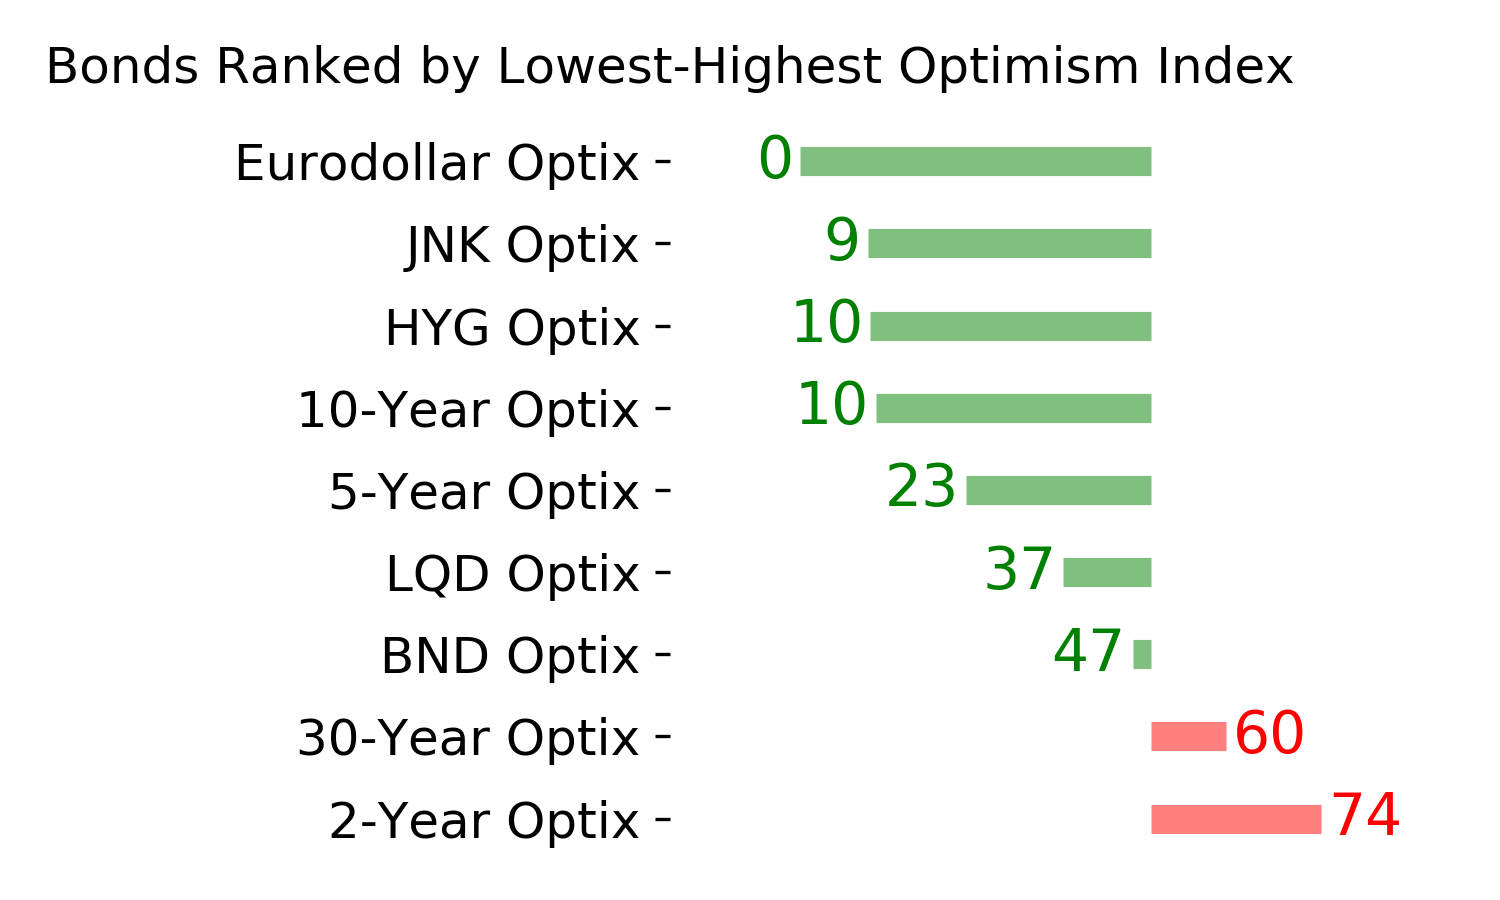
Ranks
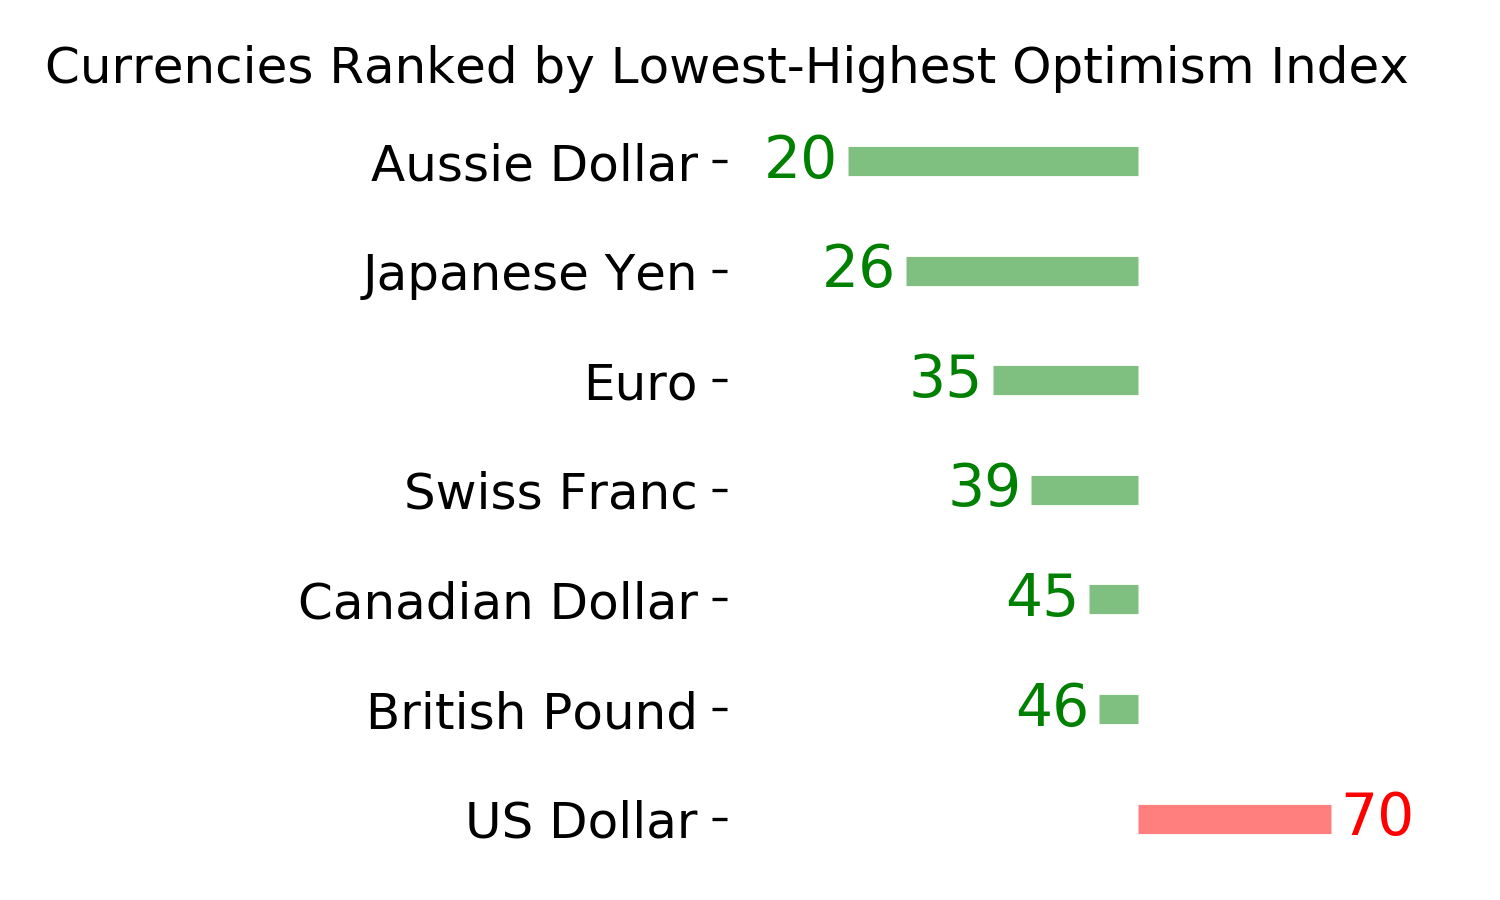
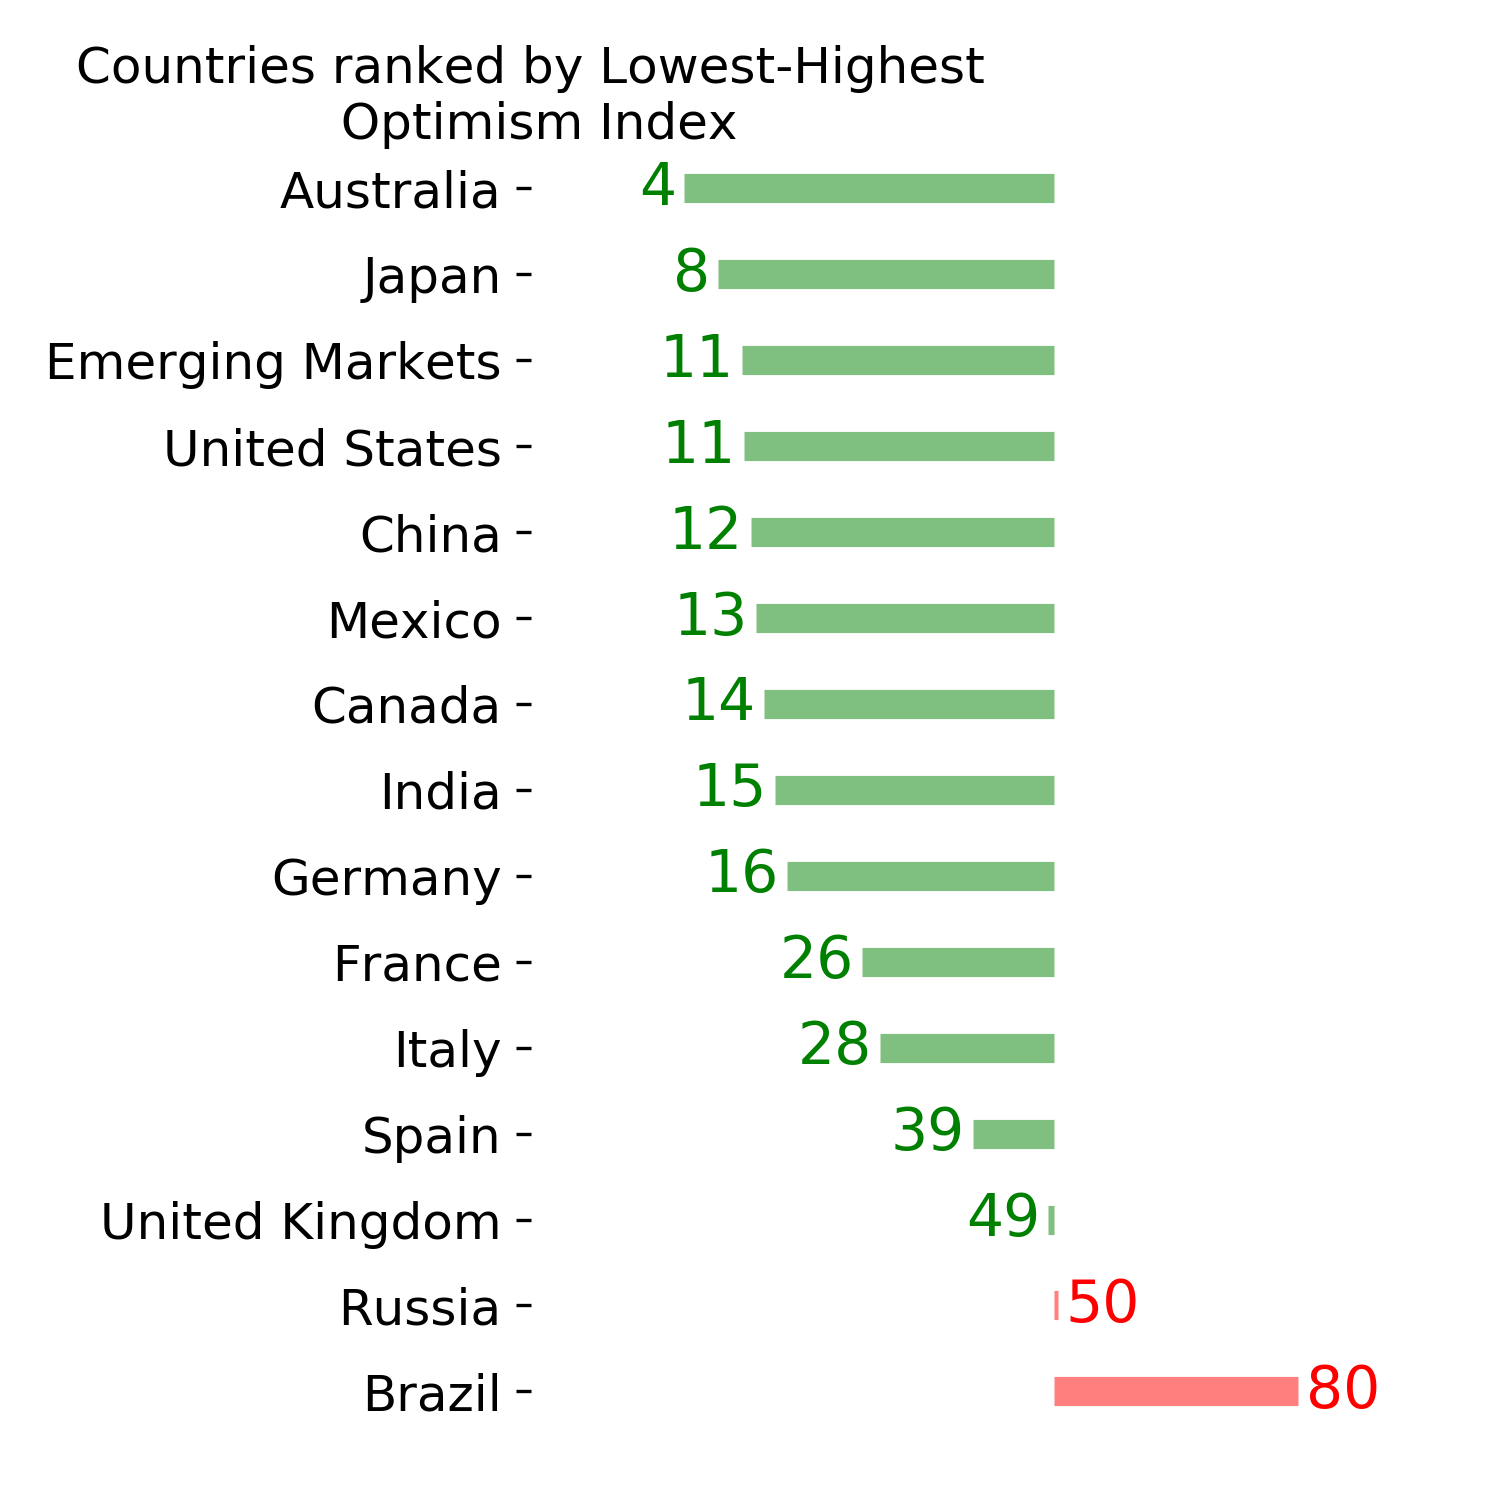
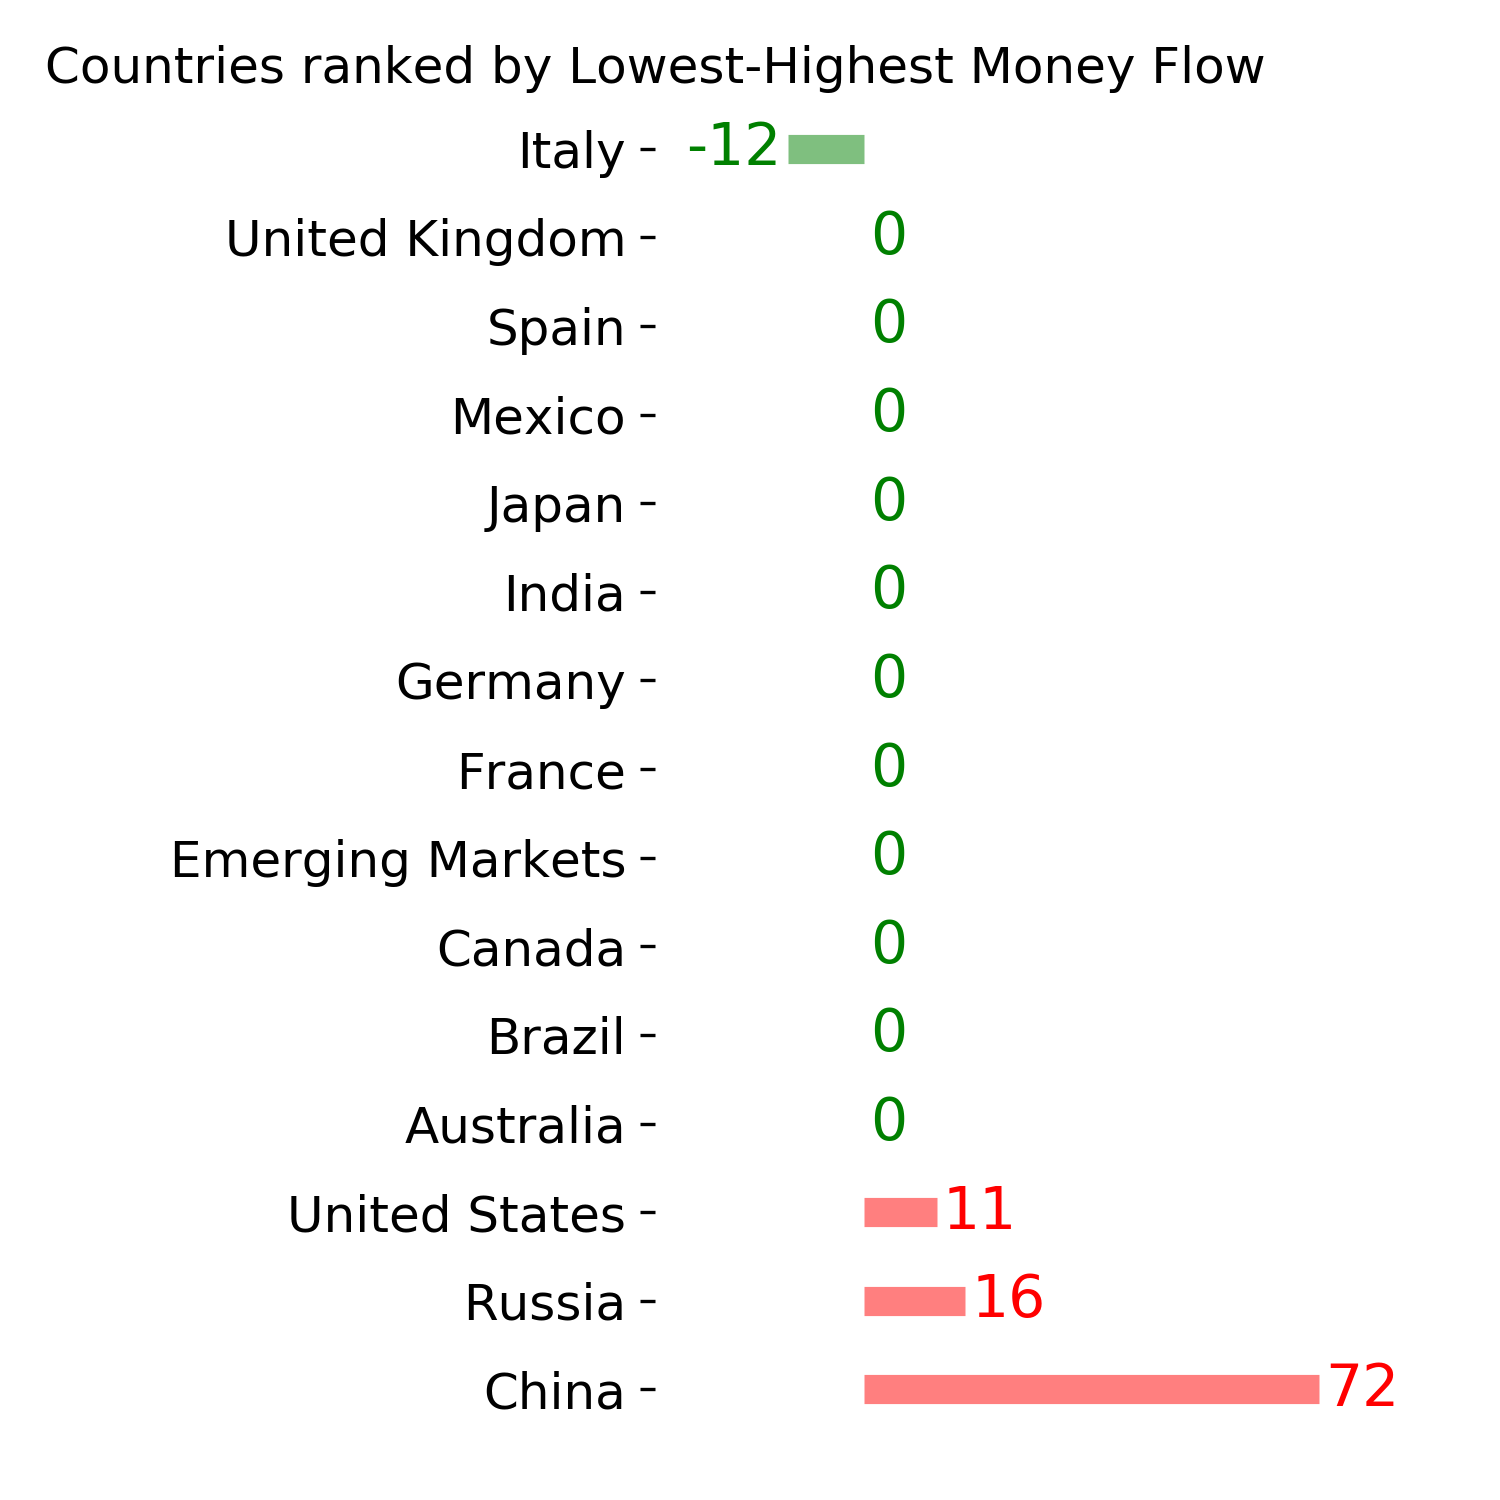
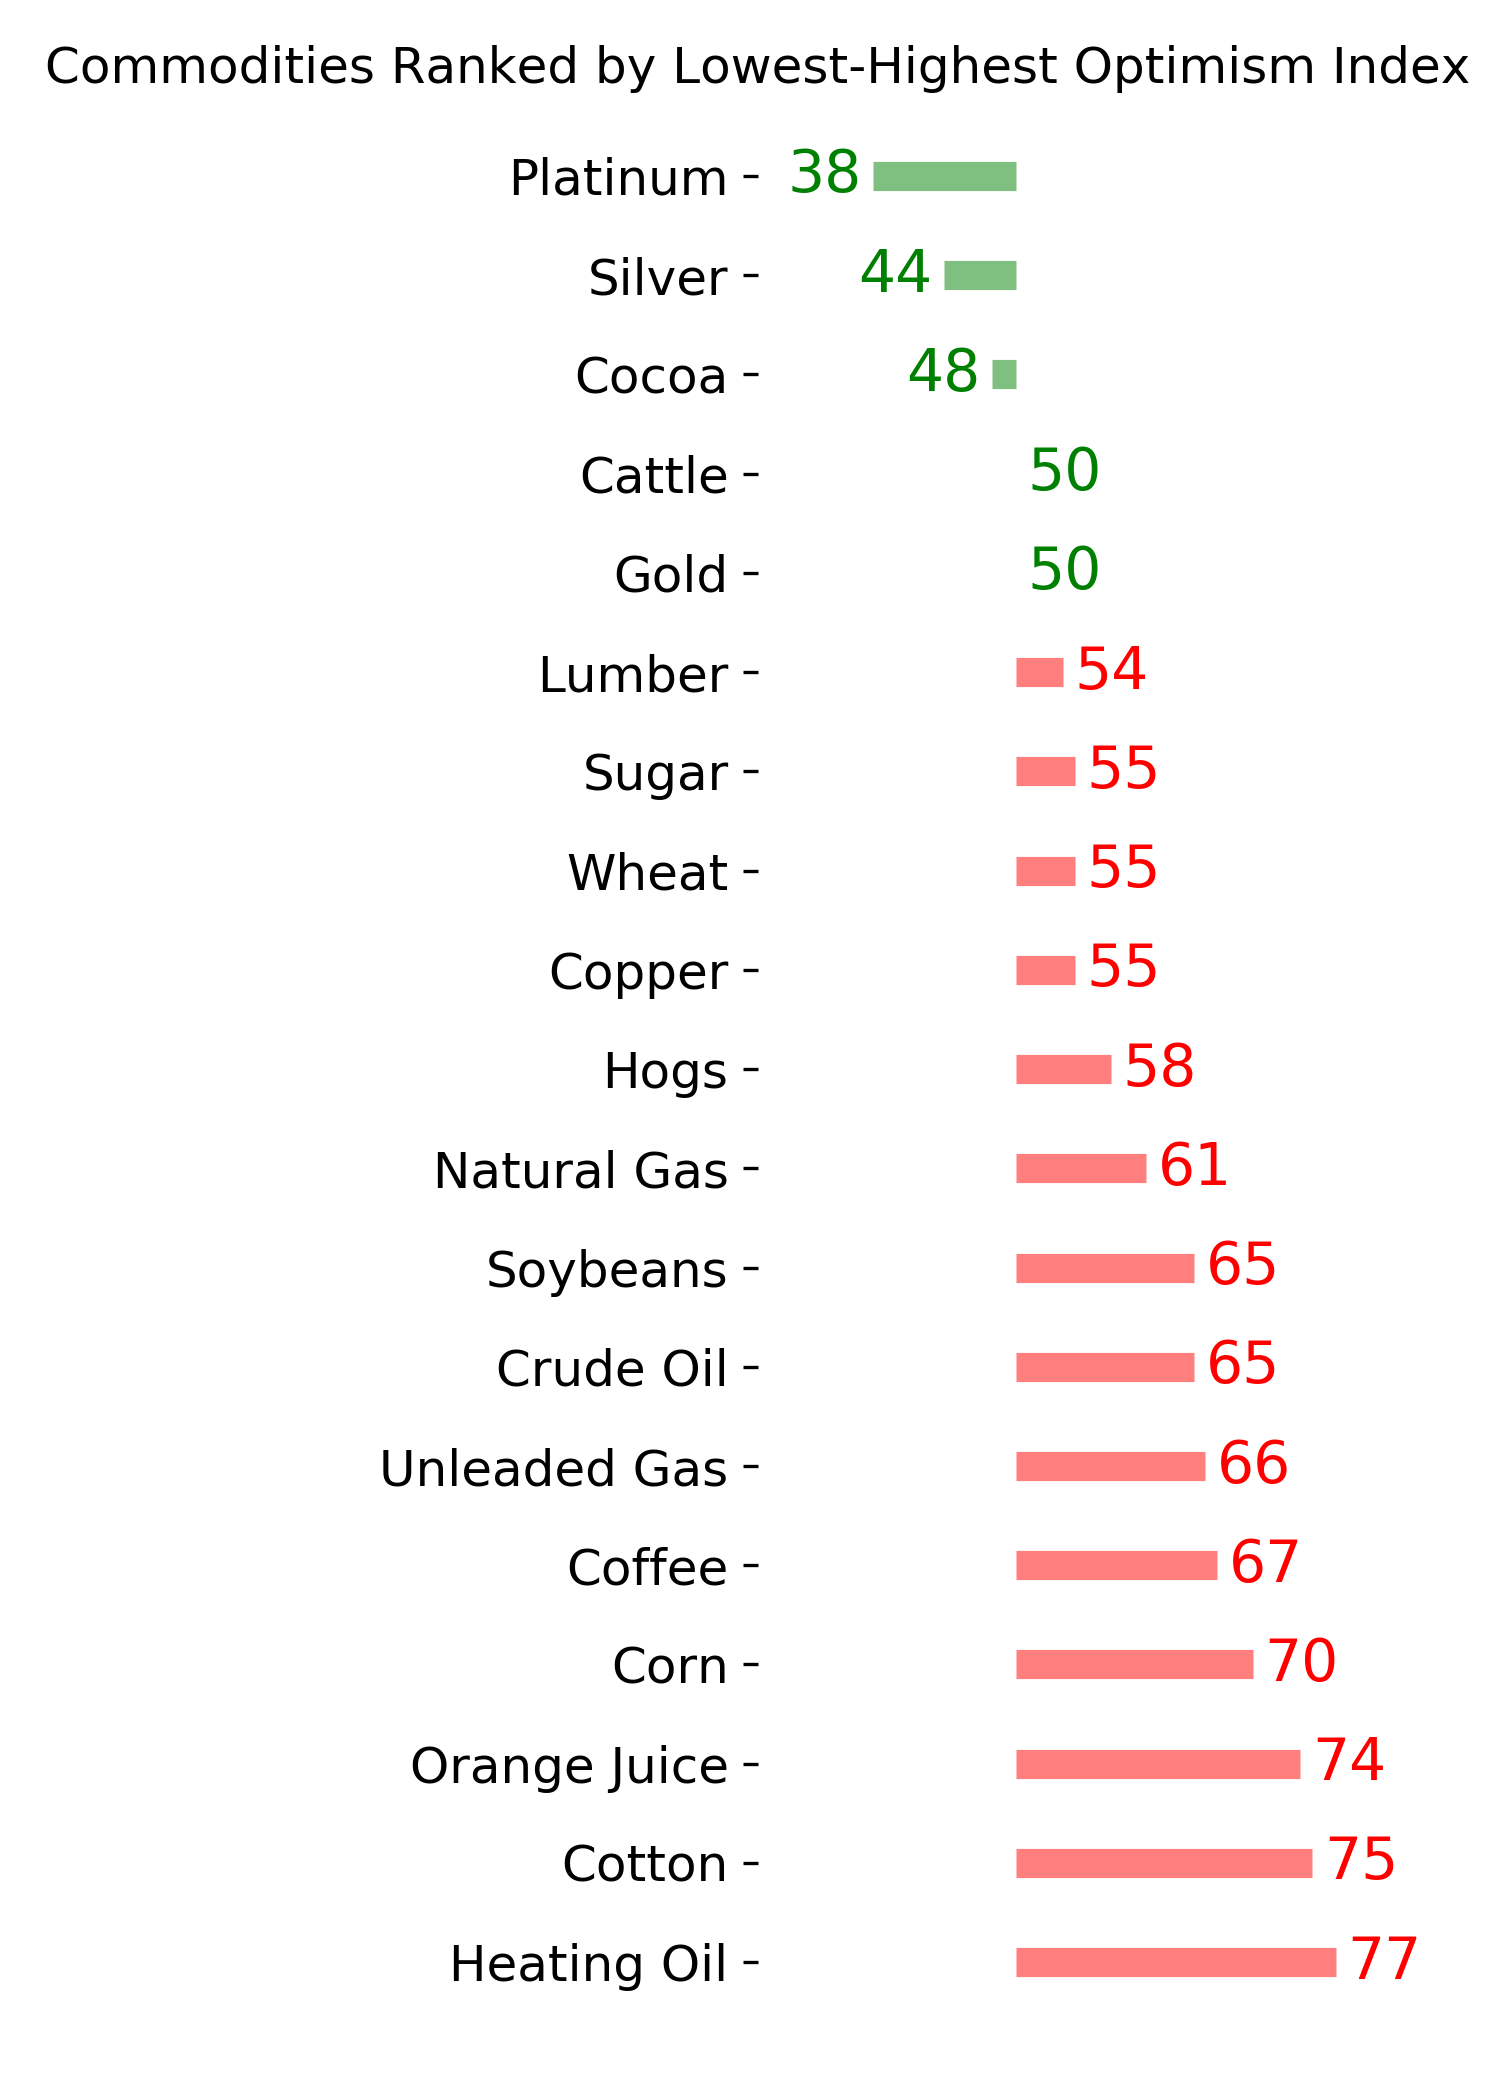
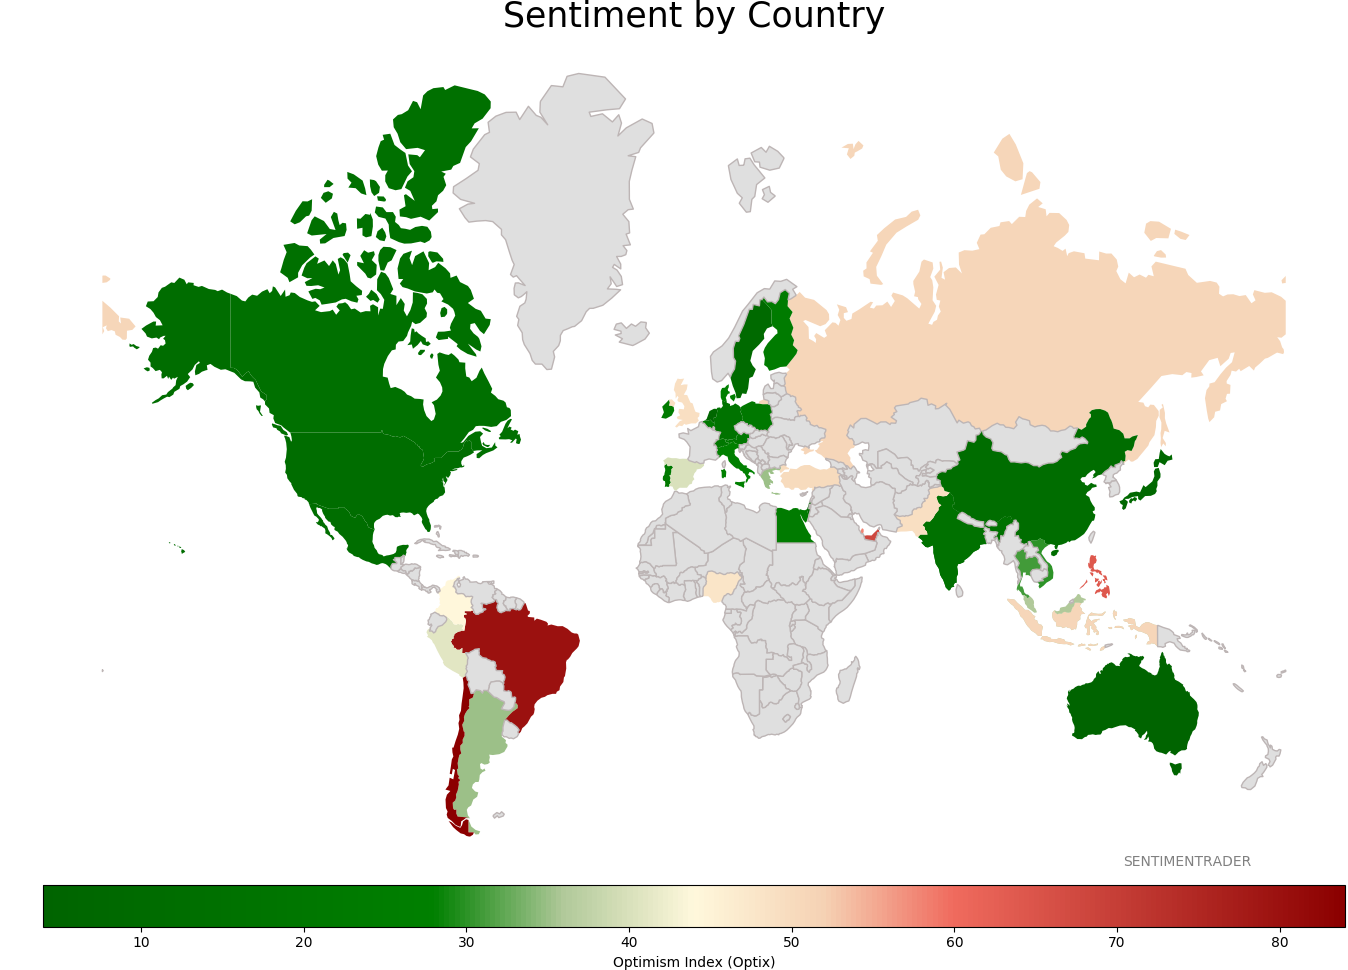
Sentiment Around The World
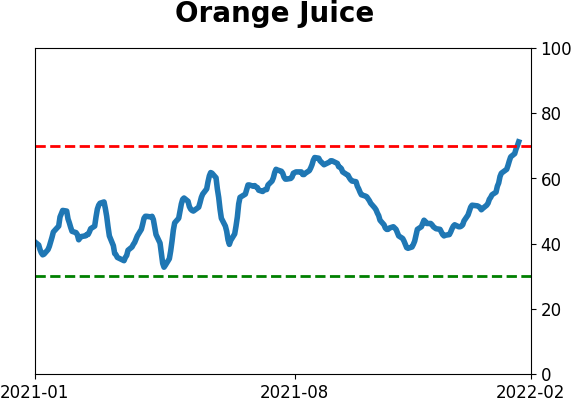
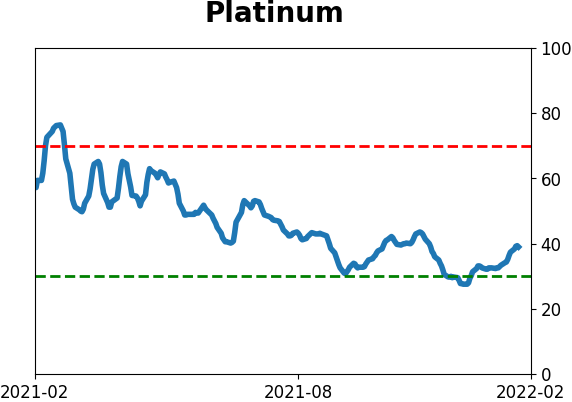
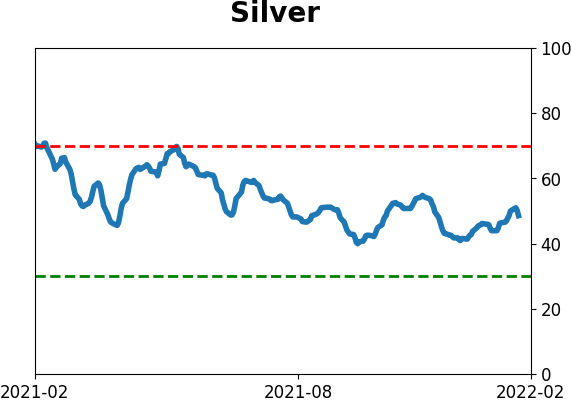
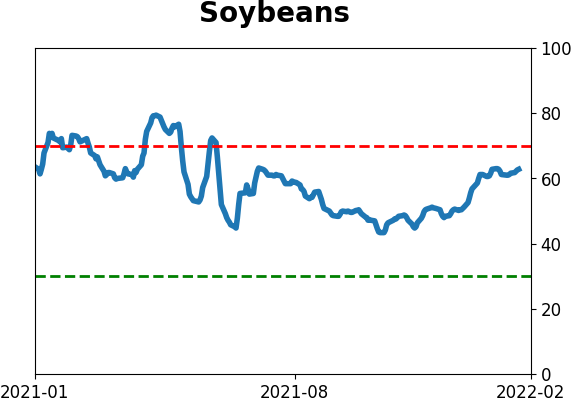
Optimism Index Thumbnails
|
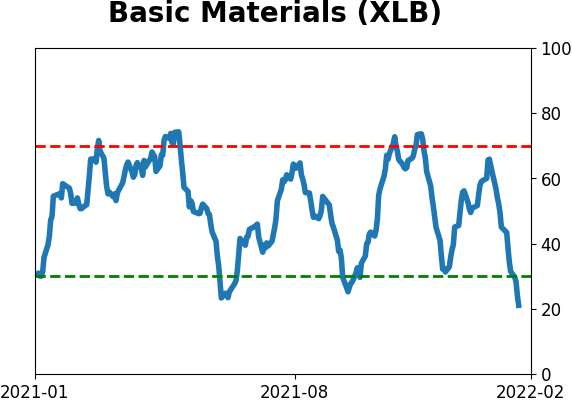
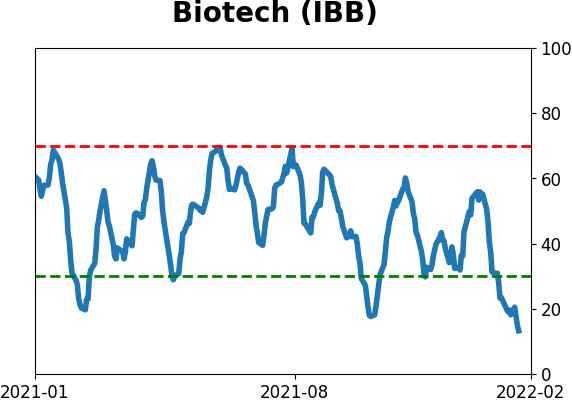
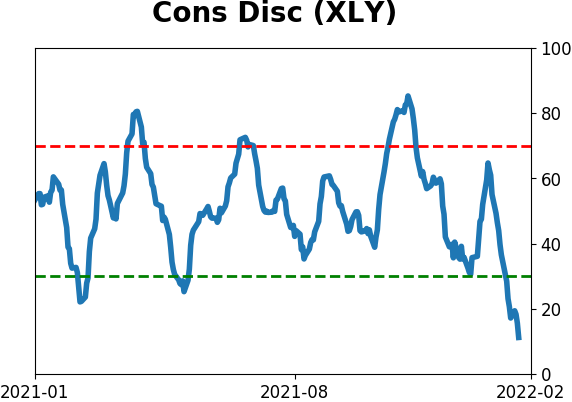
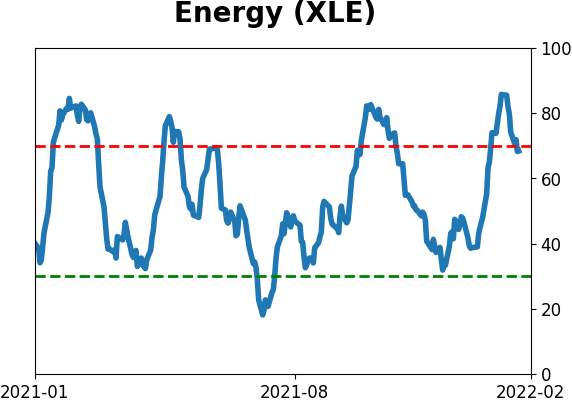
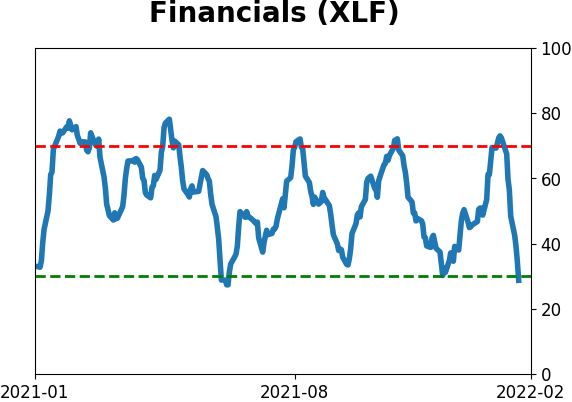
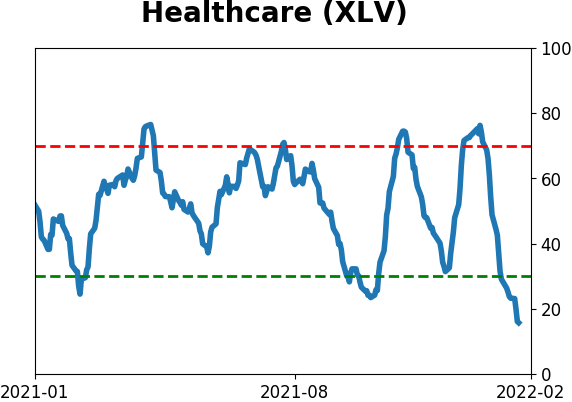
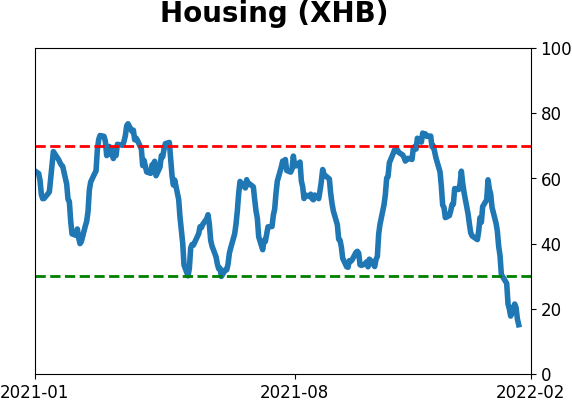
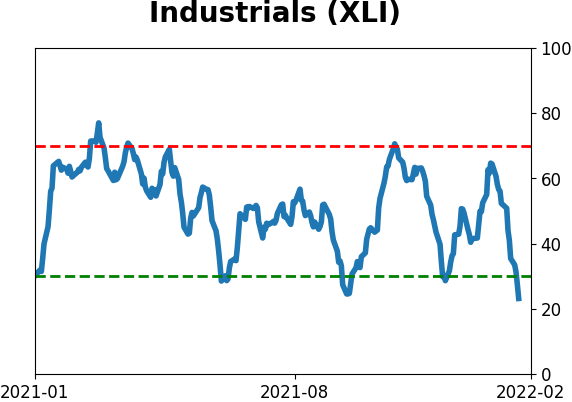
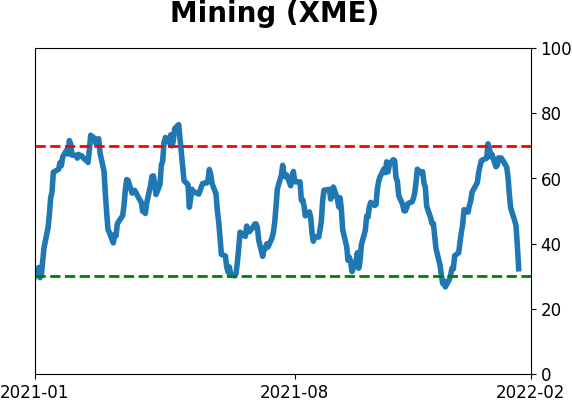
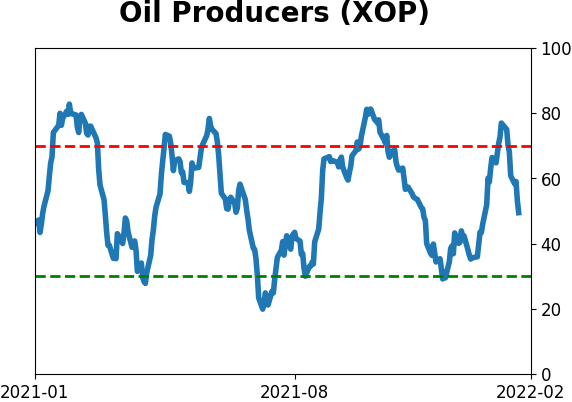
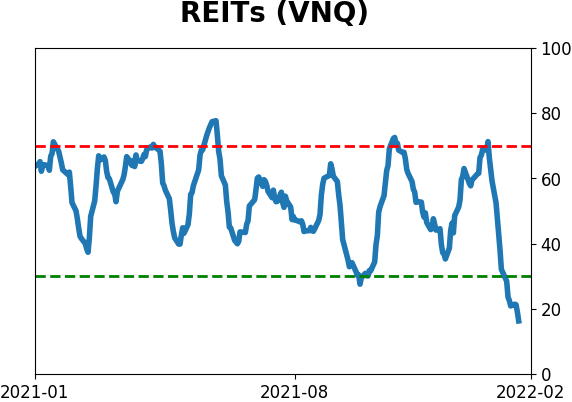
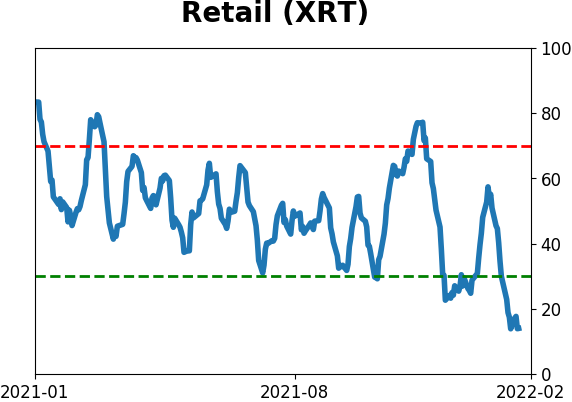
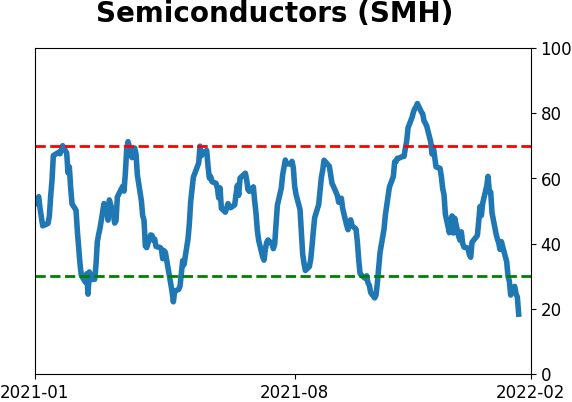
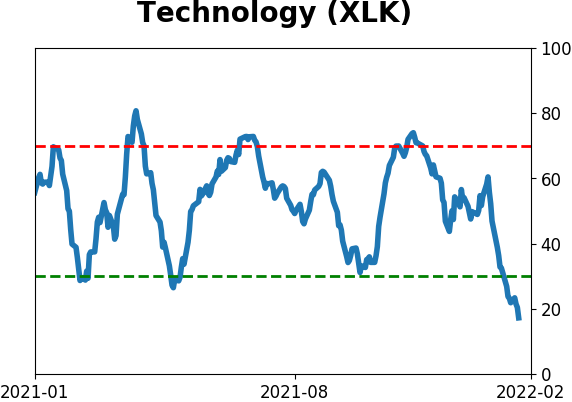
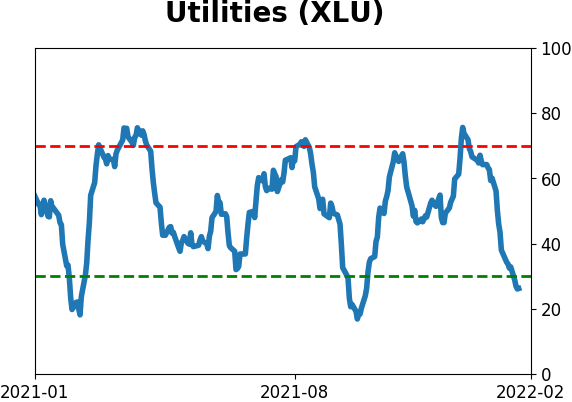
Sector ETF's - 10-Day Moving Average
|
|
|
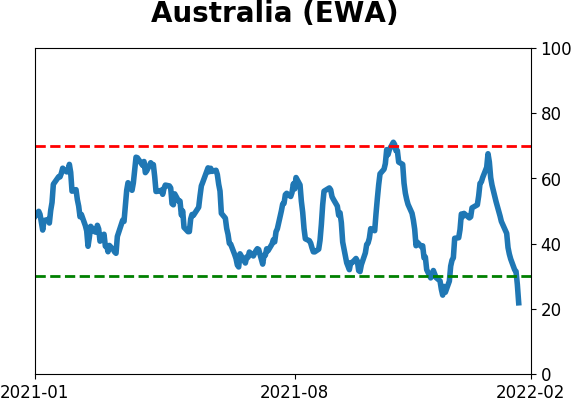
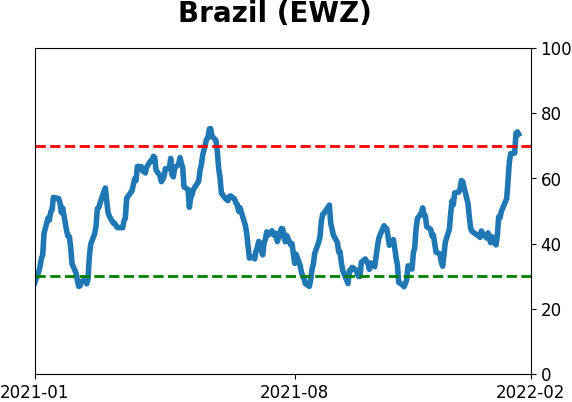
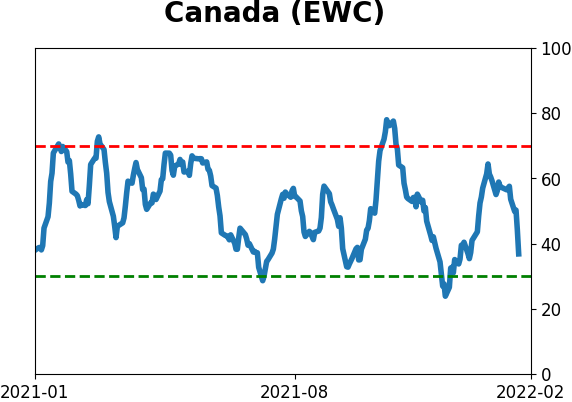
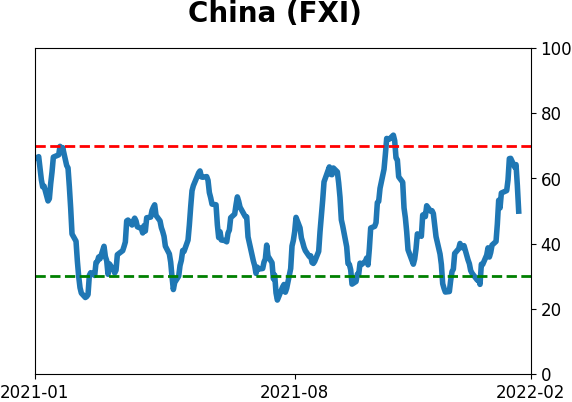
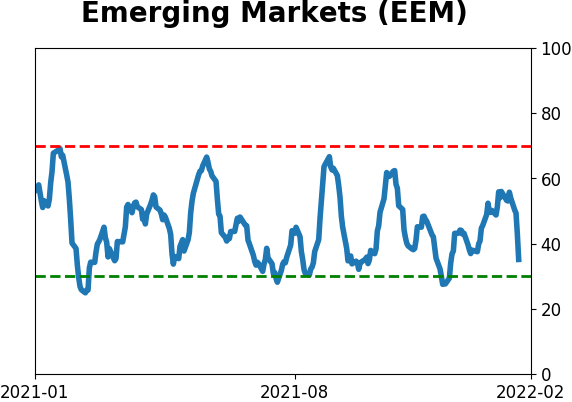
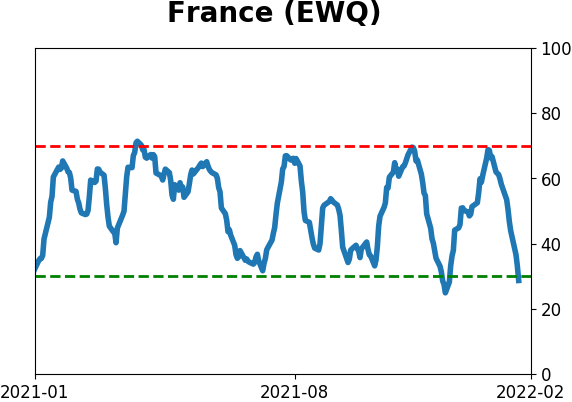
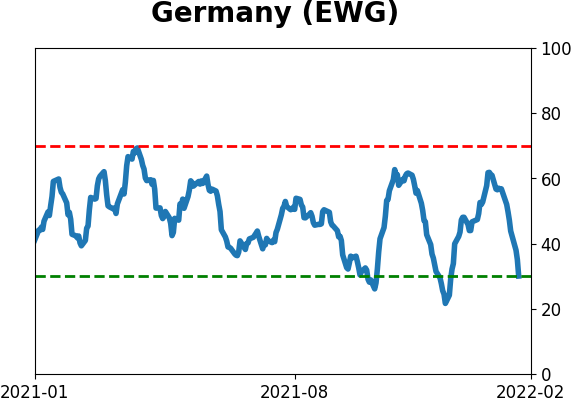
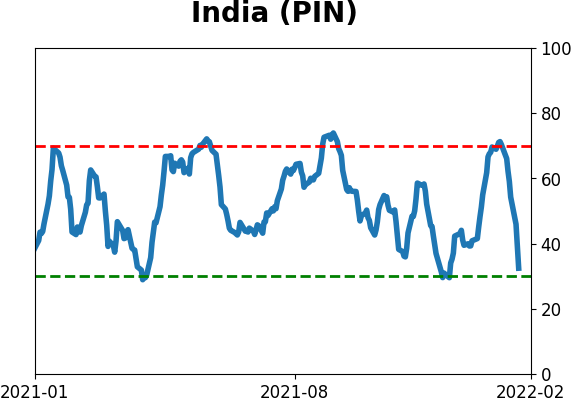
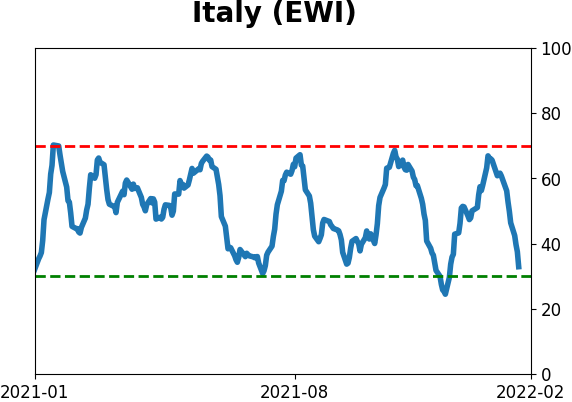
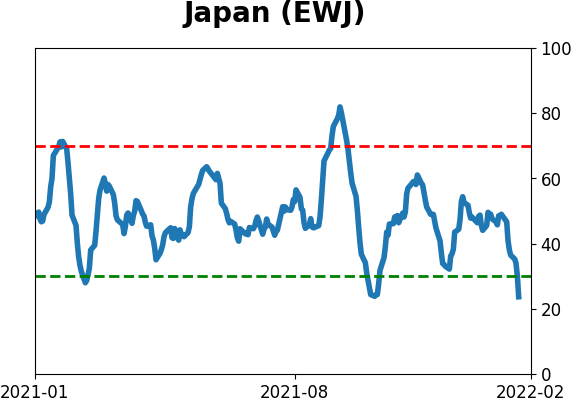
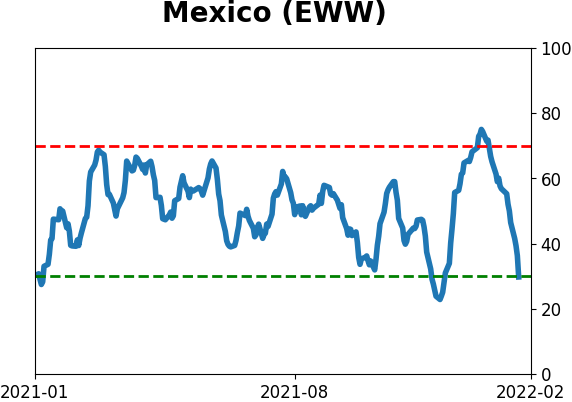
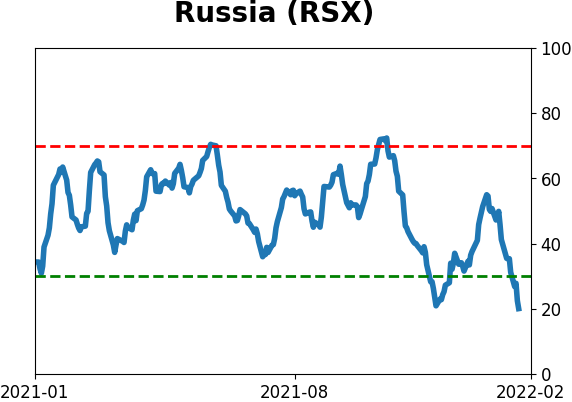
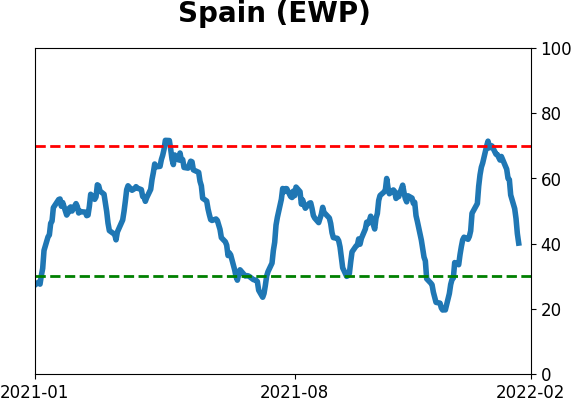
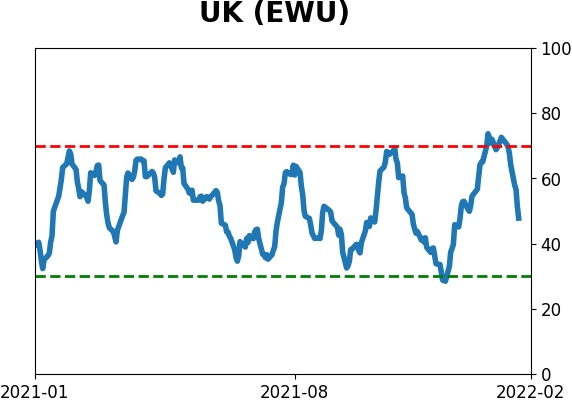
Country ETF's - 10-Day Moving Average
|
|
|
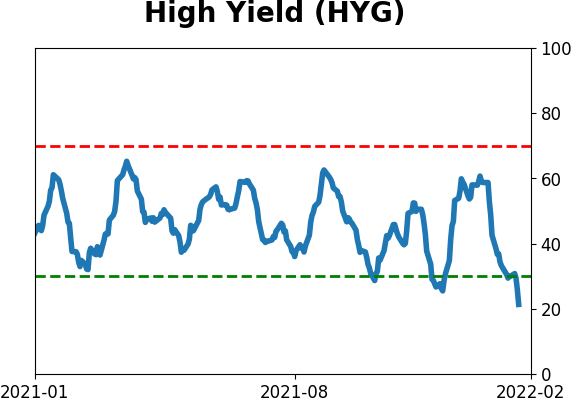
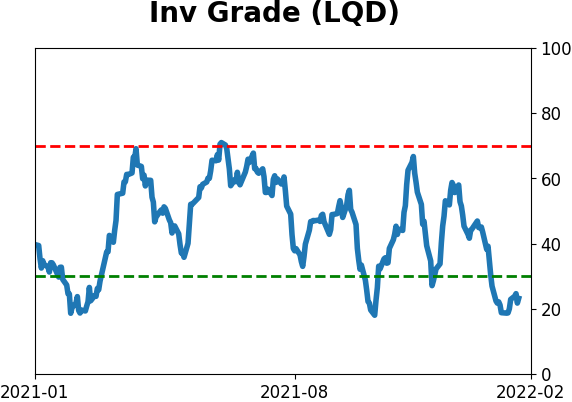
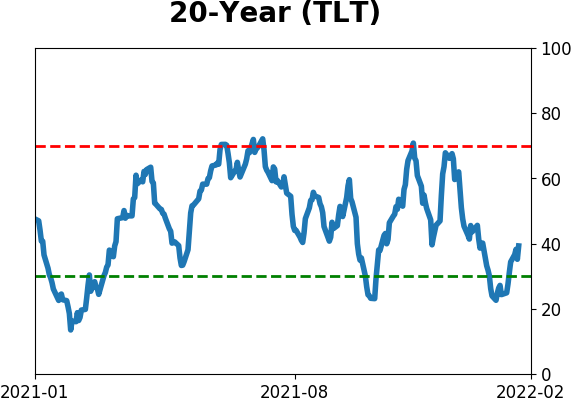
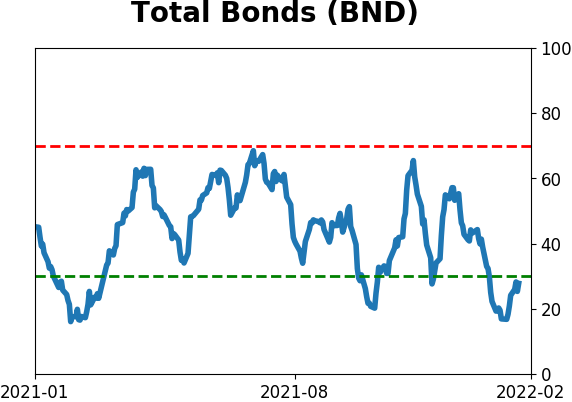
Bond ETF's - 10-Day Moving Average
|
|
|
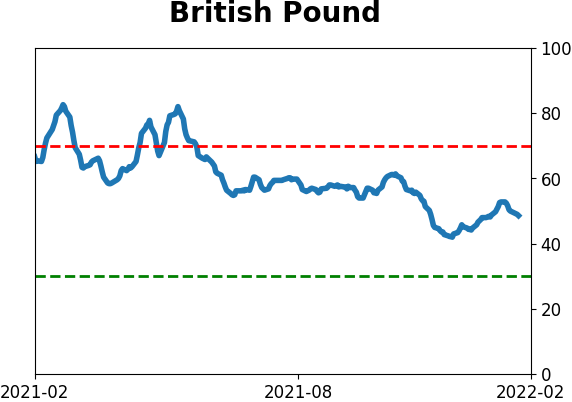
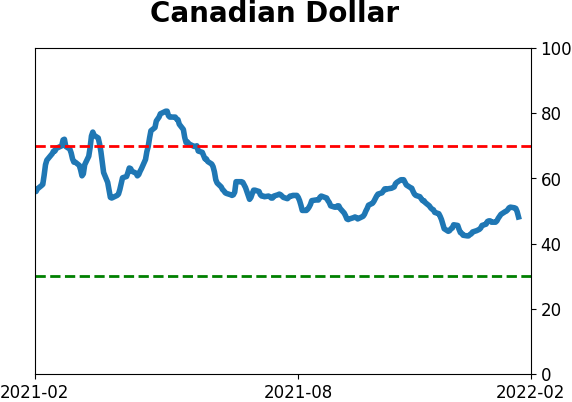
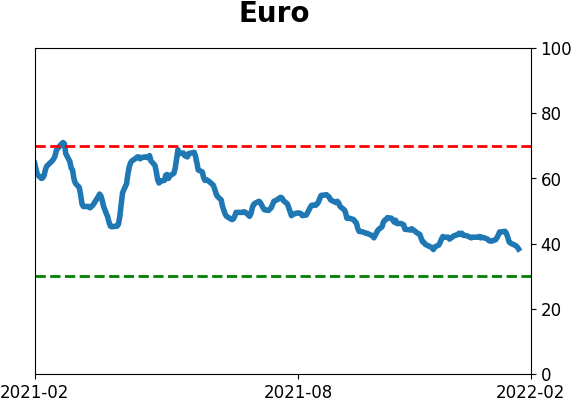
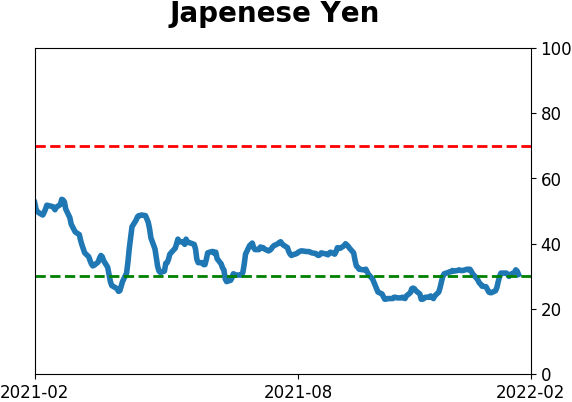
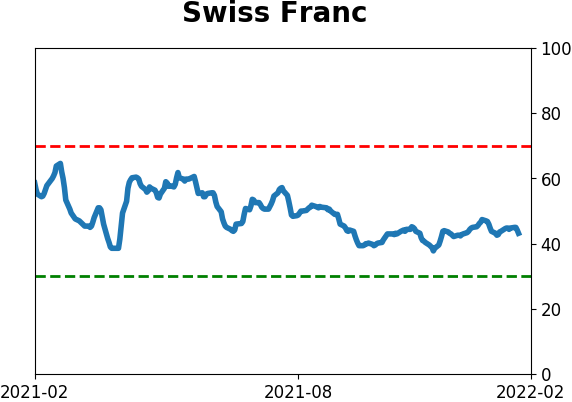
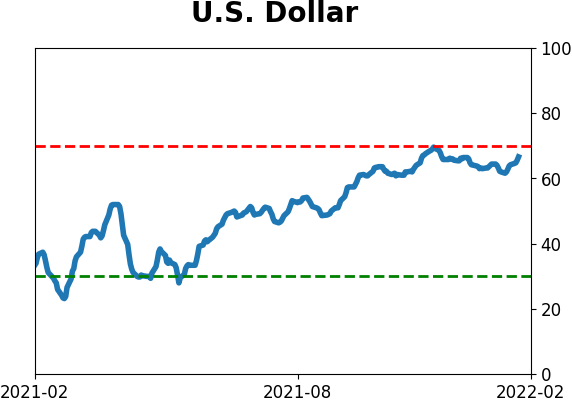
Currency ETF's - 5-Day Moving Average
|
|
|
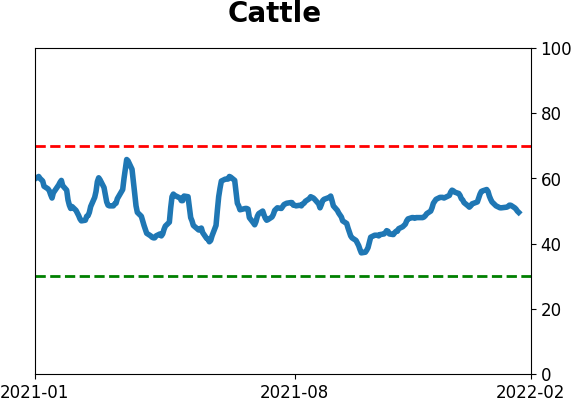
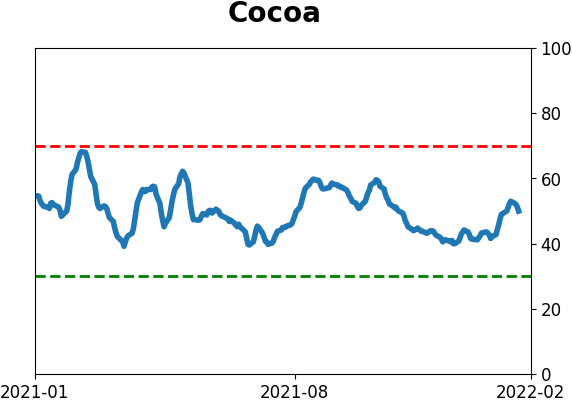
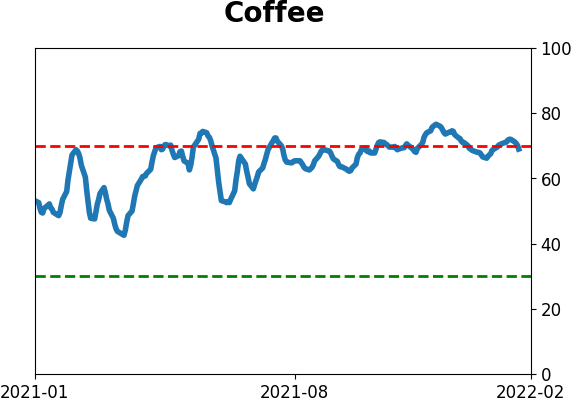
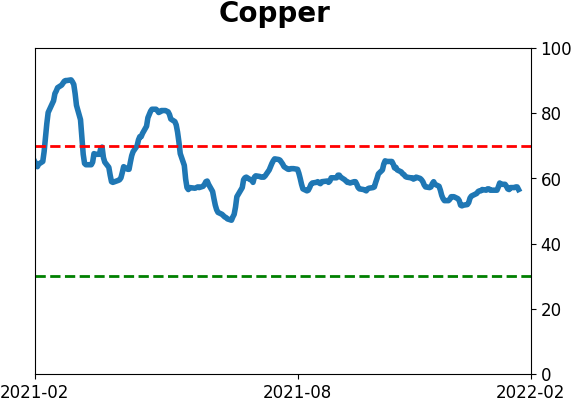
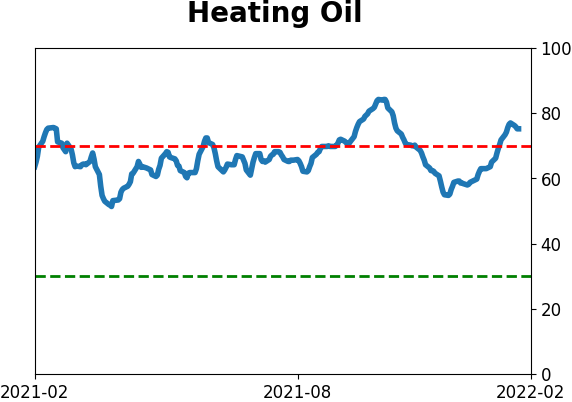
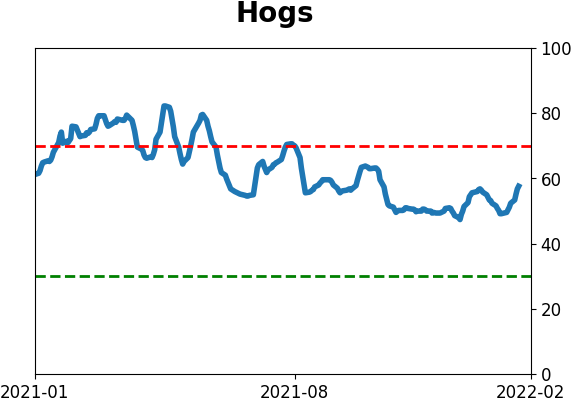
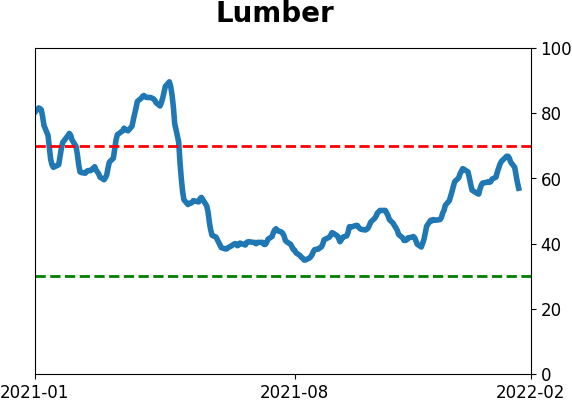
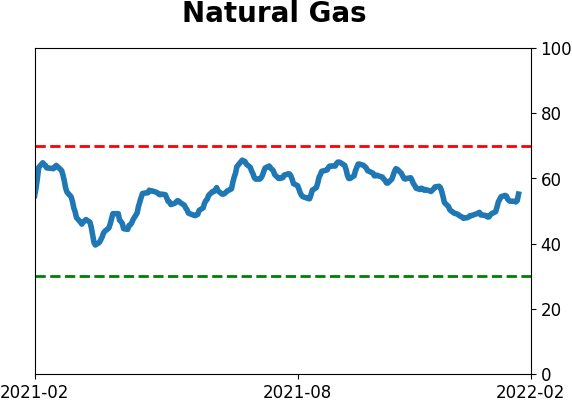
Commodity ETF's - 5-Day Moving Average
|
|