Headlines
|
|
Employment Trends Index as a stock market indicator:
Employment is a critical factor for the overall economy and the stock market. In this piece, we look at stock market performance based on the trend of the Conference Board Employment Trends Index.
|
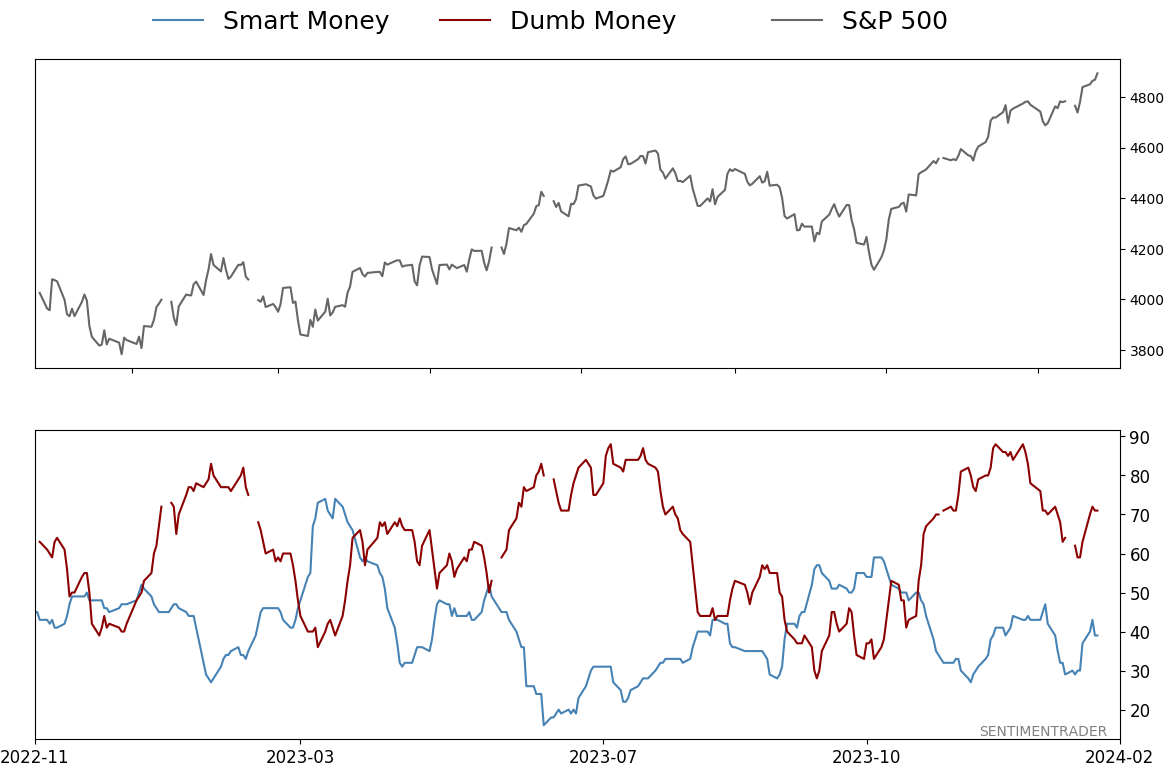
Smart / Dumb Money Confidence
|
Smart Money Confidence: 39%
Dumb Money Confidence: 71%
|
|
Risk Levels
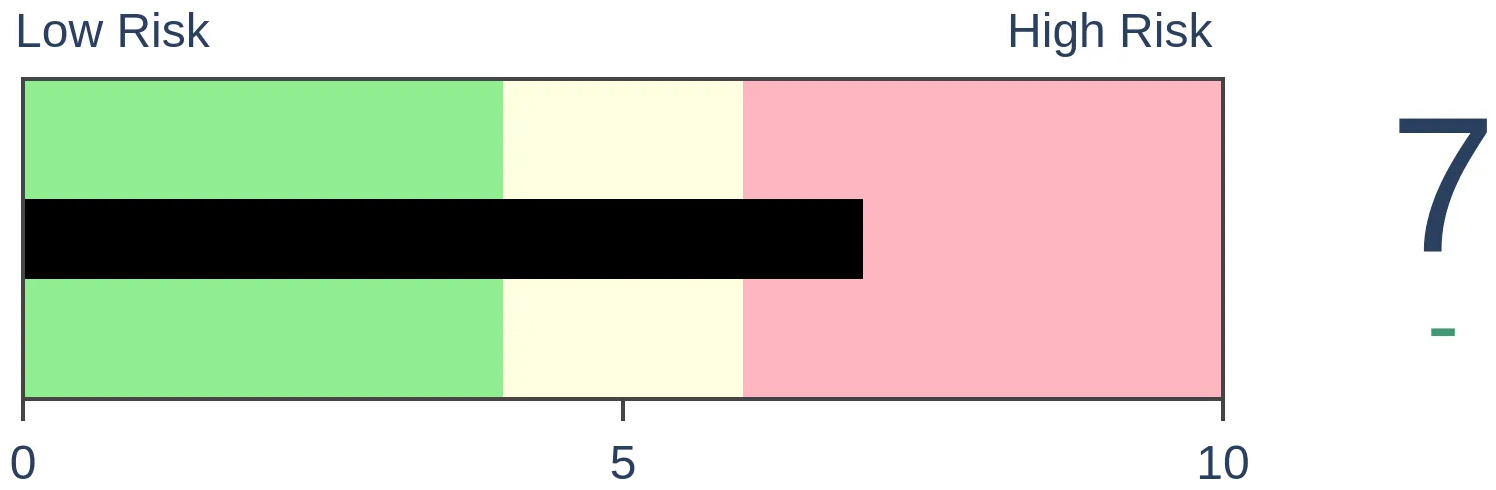
Stocks Short-Term
|
Stocks Medium-Term
|
|
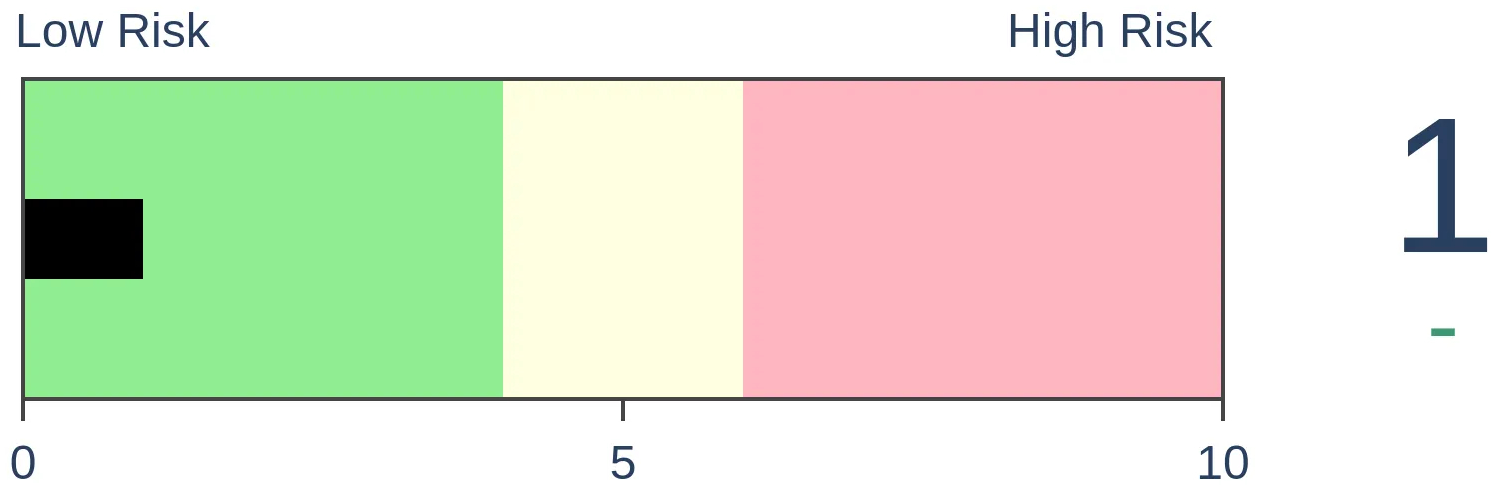
Bonds
|
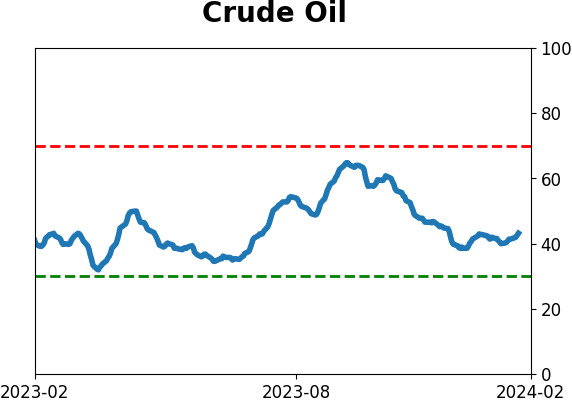
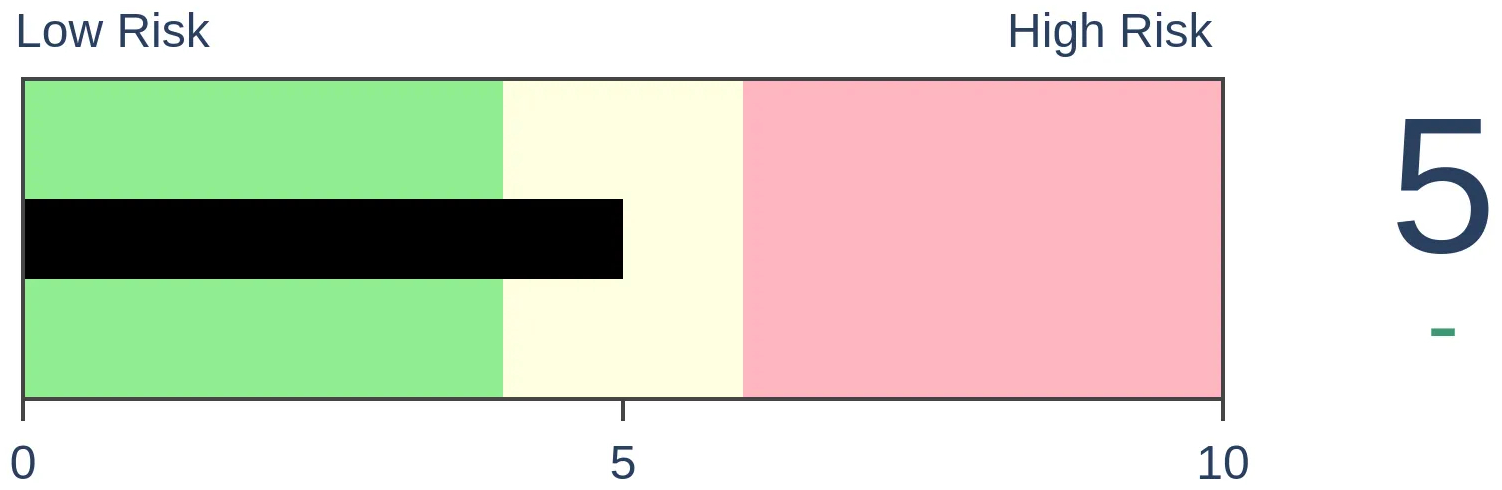
Crude Oil
|
|
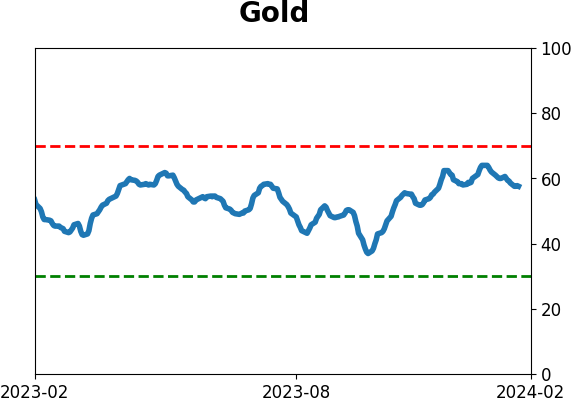
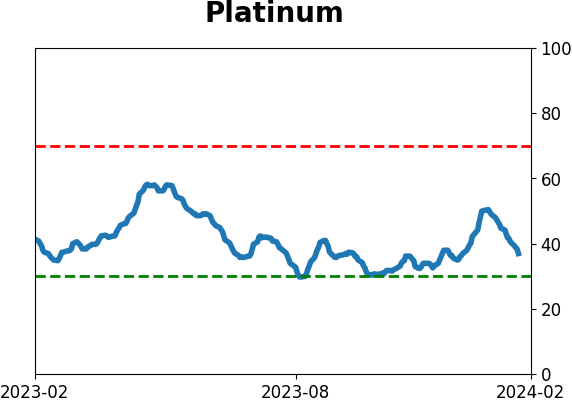
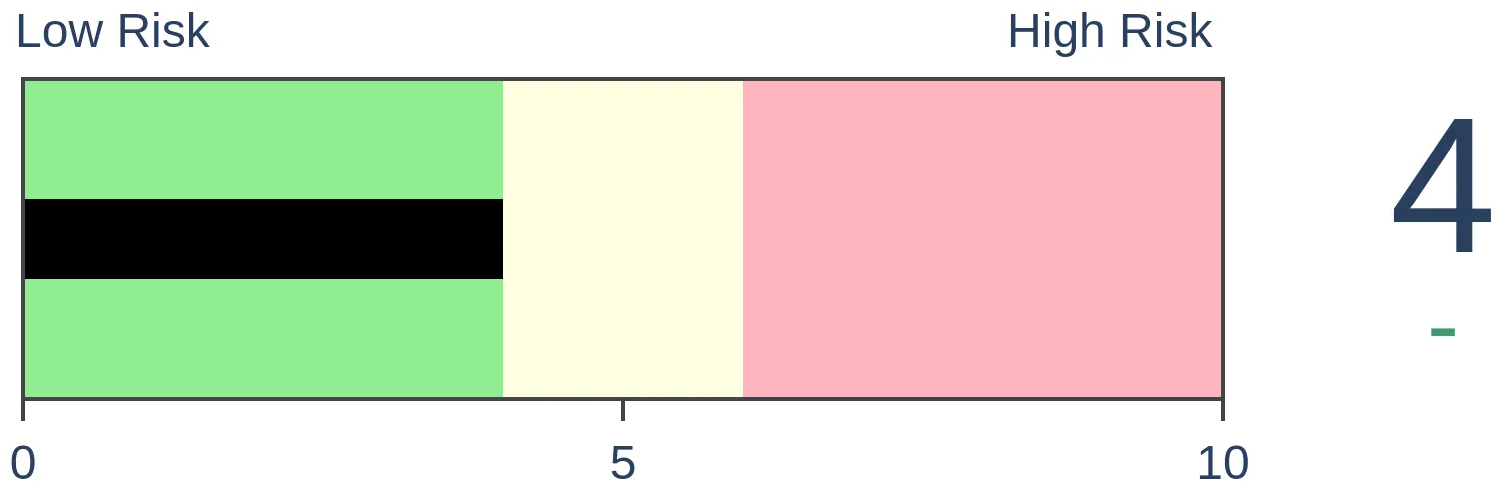
Gold
|
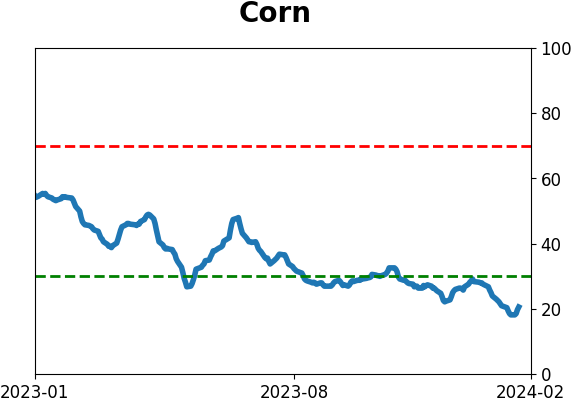
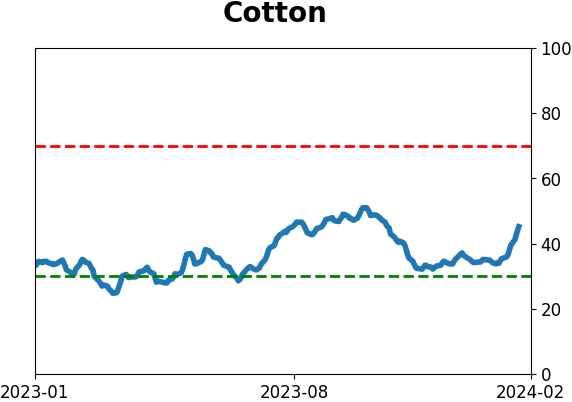
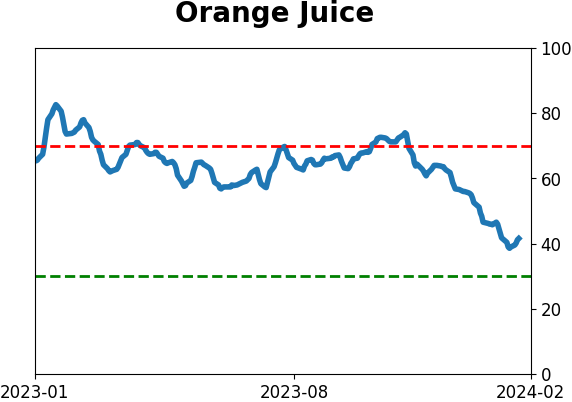
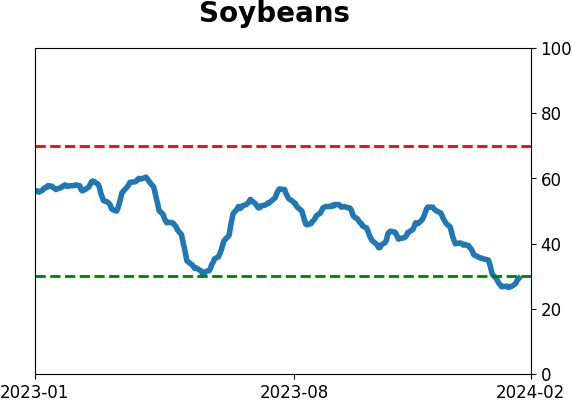
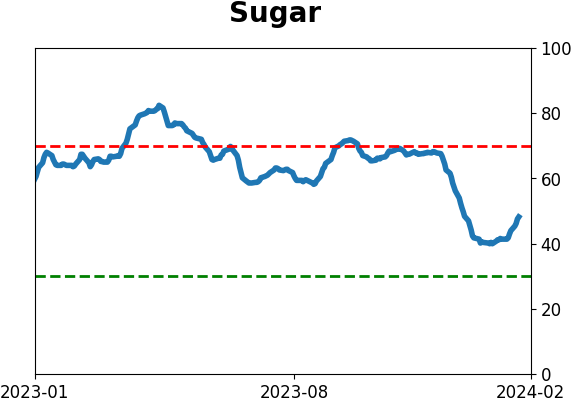
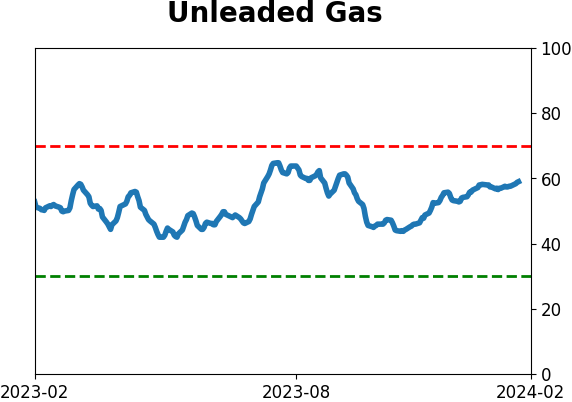
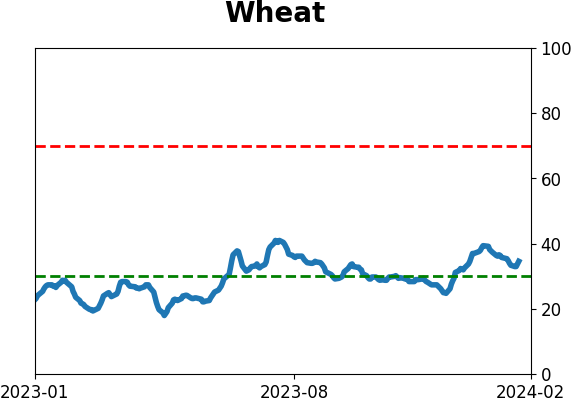
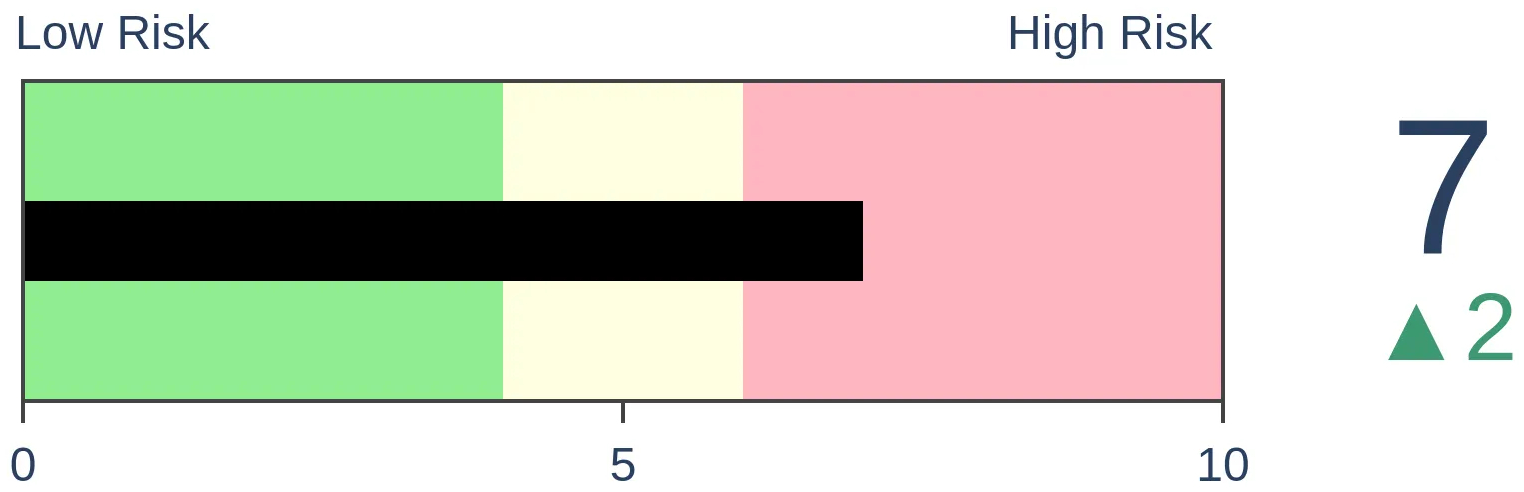
Agriculture

|
|
Research
By Jay Kaeppel
BOTTOM LINE
Employment is a critical factor for the overall economy and the stock market. In this piece, we look at stock market performance based on the trend of the Conference Board Employment Trends Index.
FORECAST / TIMEFRAME
None
|
Key Points
- Employment is critical for the health of the economy; The more people earning an income to spend on goods and services, the better - and vice versa
- The Conference Board Employment Trends Index provides a broad measure of employment conditions
- This piece details a newly constructed model that appears to do a reasonably good job of highlighting favorable - and unfavorable - periods for the stock market
- Part II will look at model performance versus the overall economy
Never stop finding new ideas
The Conference Board Employment Trends Index (ETI) is an aggregate of eight labor-market indicators that is intended to measure underlying trends in employment conditions. While I follow several employment indicators, I had never heard of this one in all candor until an alert Sentimentrader subscriber suggested it.
In crunching some numbers, I have concluded that it can help identify favorable and unfavorable periods for stocks and also the potential for economic recessions. In this piece, we will focus on stock market performance.
The indicator I detail below is something I just came up with in the last several days, so no real-world testing is involved. If someone wanted to argue that it merely curves fit the past, there is likely some truth to it. That said, the parameters and application are pretty straightforward and not very complicated. The model involves simply the ETI versus its 14-month exponential moving average.
The Model Components
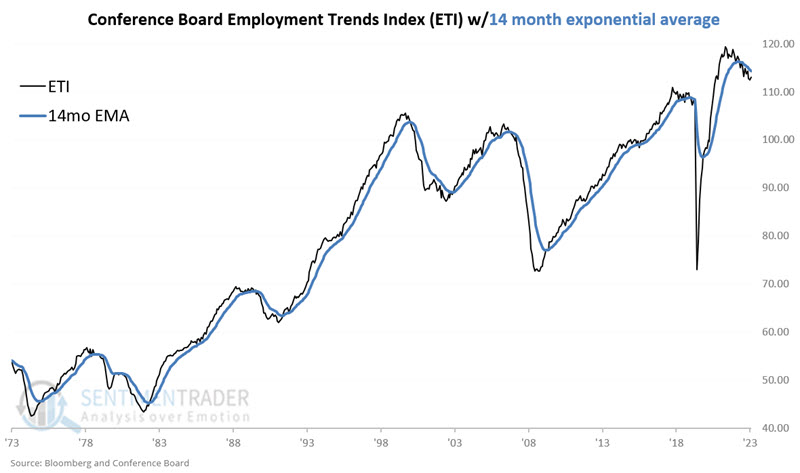
The latest reading for the Employment Trends Index is evaluated once a month after the close of trading on the last day of the month. The measurements are:
A = Most recent available Employment Trends Index value as of the last day of the month
B = 14-month exponential moving average of A
C = A - B (latest monthly reading minus 14-month EMA)
Variable C is simply the difference between the latest monthly ETI reading and its 14-month EMA.
NOTE: The ETI for one month is reported in the following month. So the December 2023 ETI value would be evaluated after the last trading day of January 2024.
The chart below displays variables A and B
The chart below displays Variable C, i.e., the difference between the two line in the chart above.
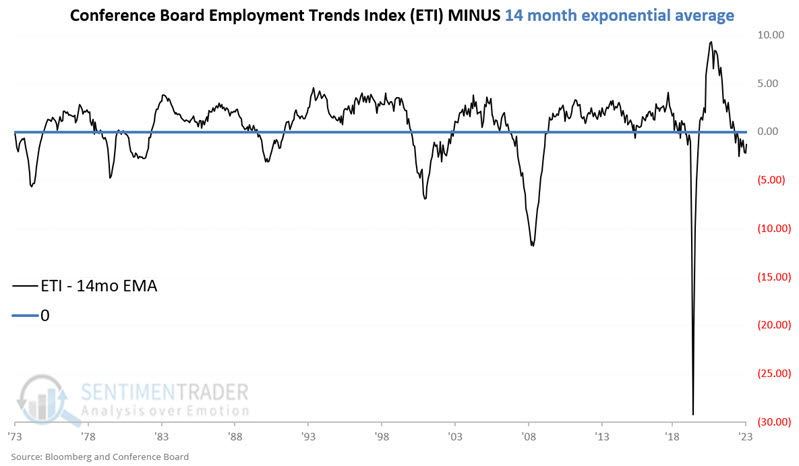
Let's evaluate how the stock market and the economy perform based on positive or negative readings for Variable C, as shown in the chart above.
ETI versus the stock market
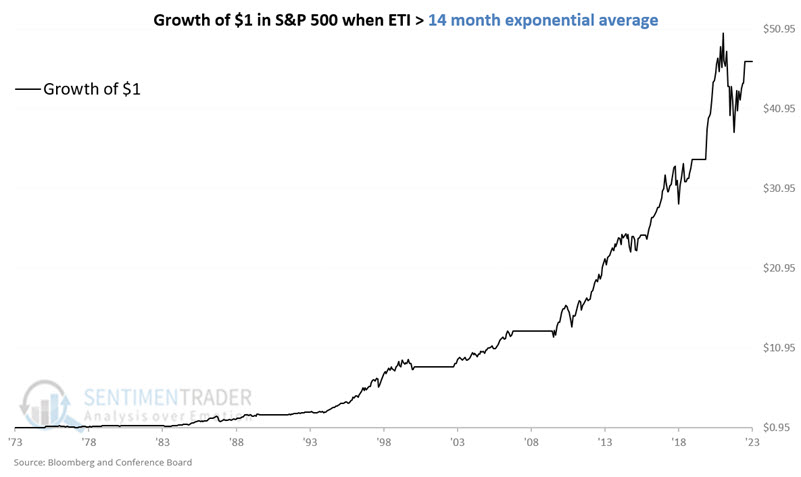
We will use the monthly price change for the S&P 500 Index to measure stock market performance from 1973-12-31 through 2023-12-31. The chart below displays the growth of $1 invested in the S&P 500 only during those months when the ETI closed the previous month above its 14-month EMA. The cumulative return is +4,587%.
The chart below displays the same results on a logarithmic scale.
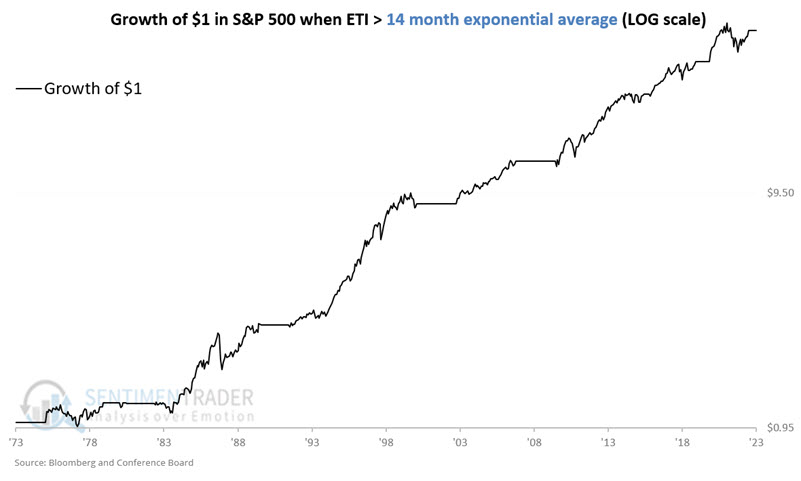
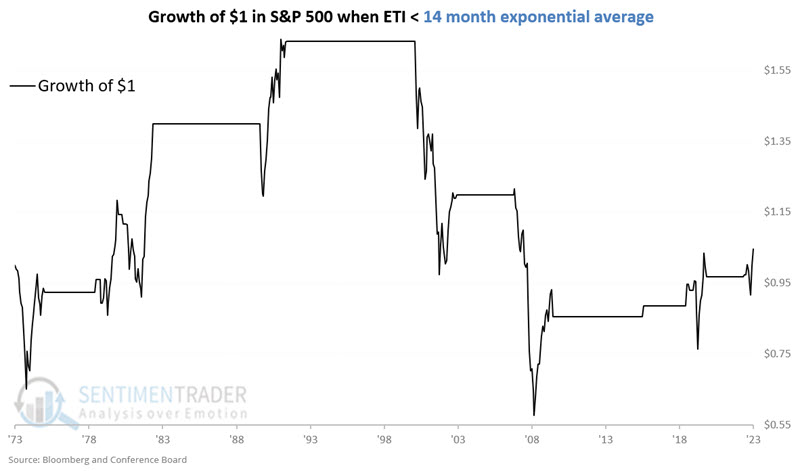
Conversely, the chart below displays the growth of $1 invested in the S&P 500 only during those months when the ETI closed the previous month below its 14-month EMA. The cumulative return is +4.8%. In other words, 95% of the total gain for the stock market in the past 50 years occurred when the ETI was in an uptrend.
The table below summarizes S&P 500 performance for:
- All Months
- Favorable months (ETI>14mo EMA)
- Unfavorable months (ETI<14mo EMA)
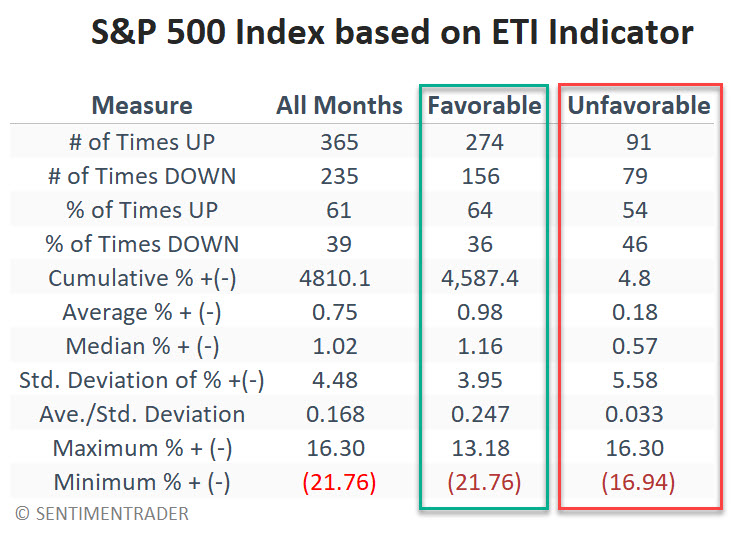
The stock market has performed much better when Variable C is positive.
Key metrics to note:
- Monthly Win Rate: Favorable mos. 64%, Unfavorable mos. 54%
- Average Mo. % +(-): Favorable mos. 0.98%, Unfavorable mos. 0.18%
- Average/Std. Deviation: Favorable mos. 0.247, Unfavorable mos. 0.033
What the research tells us…
There is good news and bad news. The good news is that over the past 50 years, the stock market has shown a solid tendency to perform better when the Conference Board Economic Trends Index is above its 14-month EMA than below. As such, this model may have value as a weight of the evidence tool. However, it is probably best not to use it as a standalone trading model.
The unfavorable periods showed only a minuscule gain of +4.8% over 50 years. Nevertheless, a gain is a gain. Likewise, recent results have been less impressive as the model has been somewhat out of sync with the stock market. After missing significant portions of the 2000-2003 and 2007-2009 bear markets, the model was favorable throughout the 2022 decline. The model has also been unfavorable since the end of May 2023, when the stock market has generated strong results.
We will look at economic performance based on ETI readings in Part II.
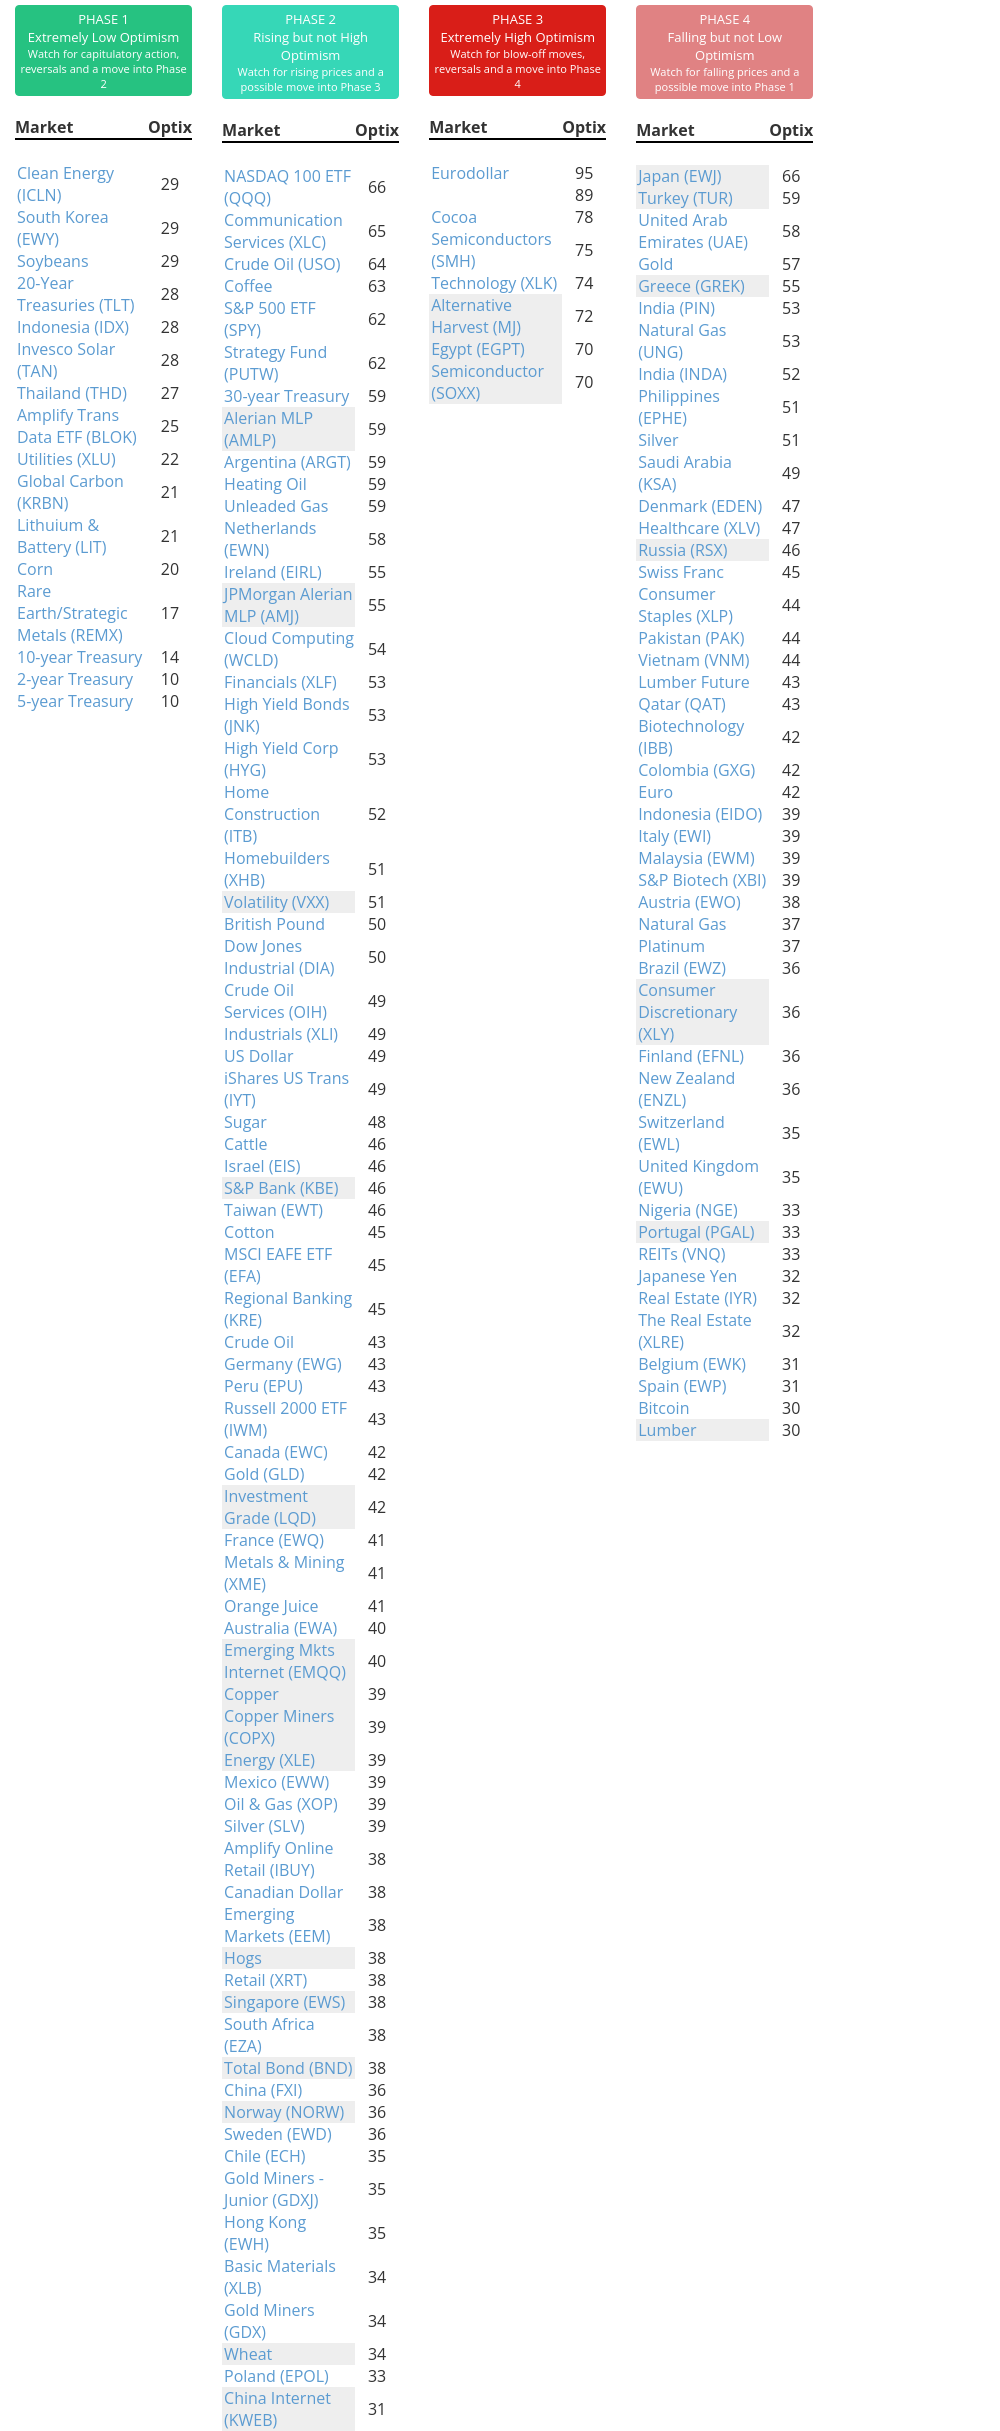
Indicators at Extremes
Phase Table
Ranks
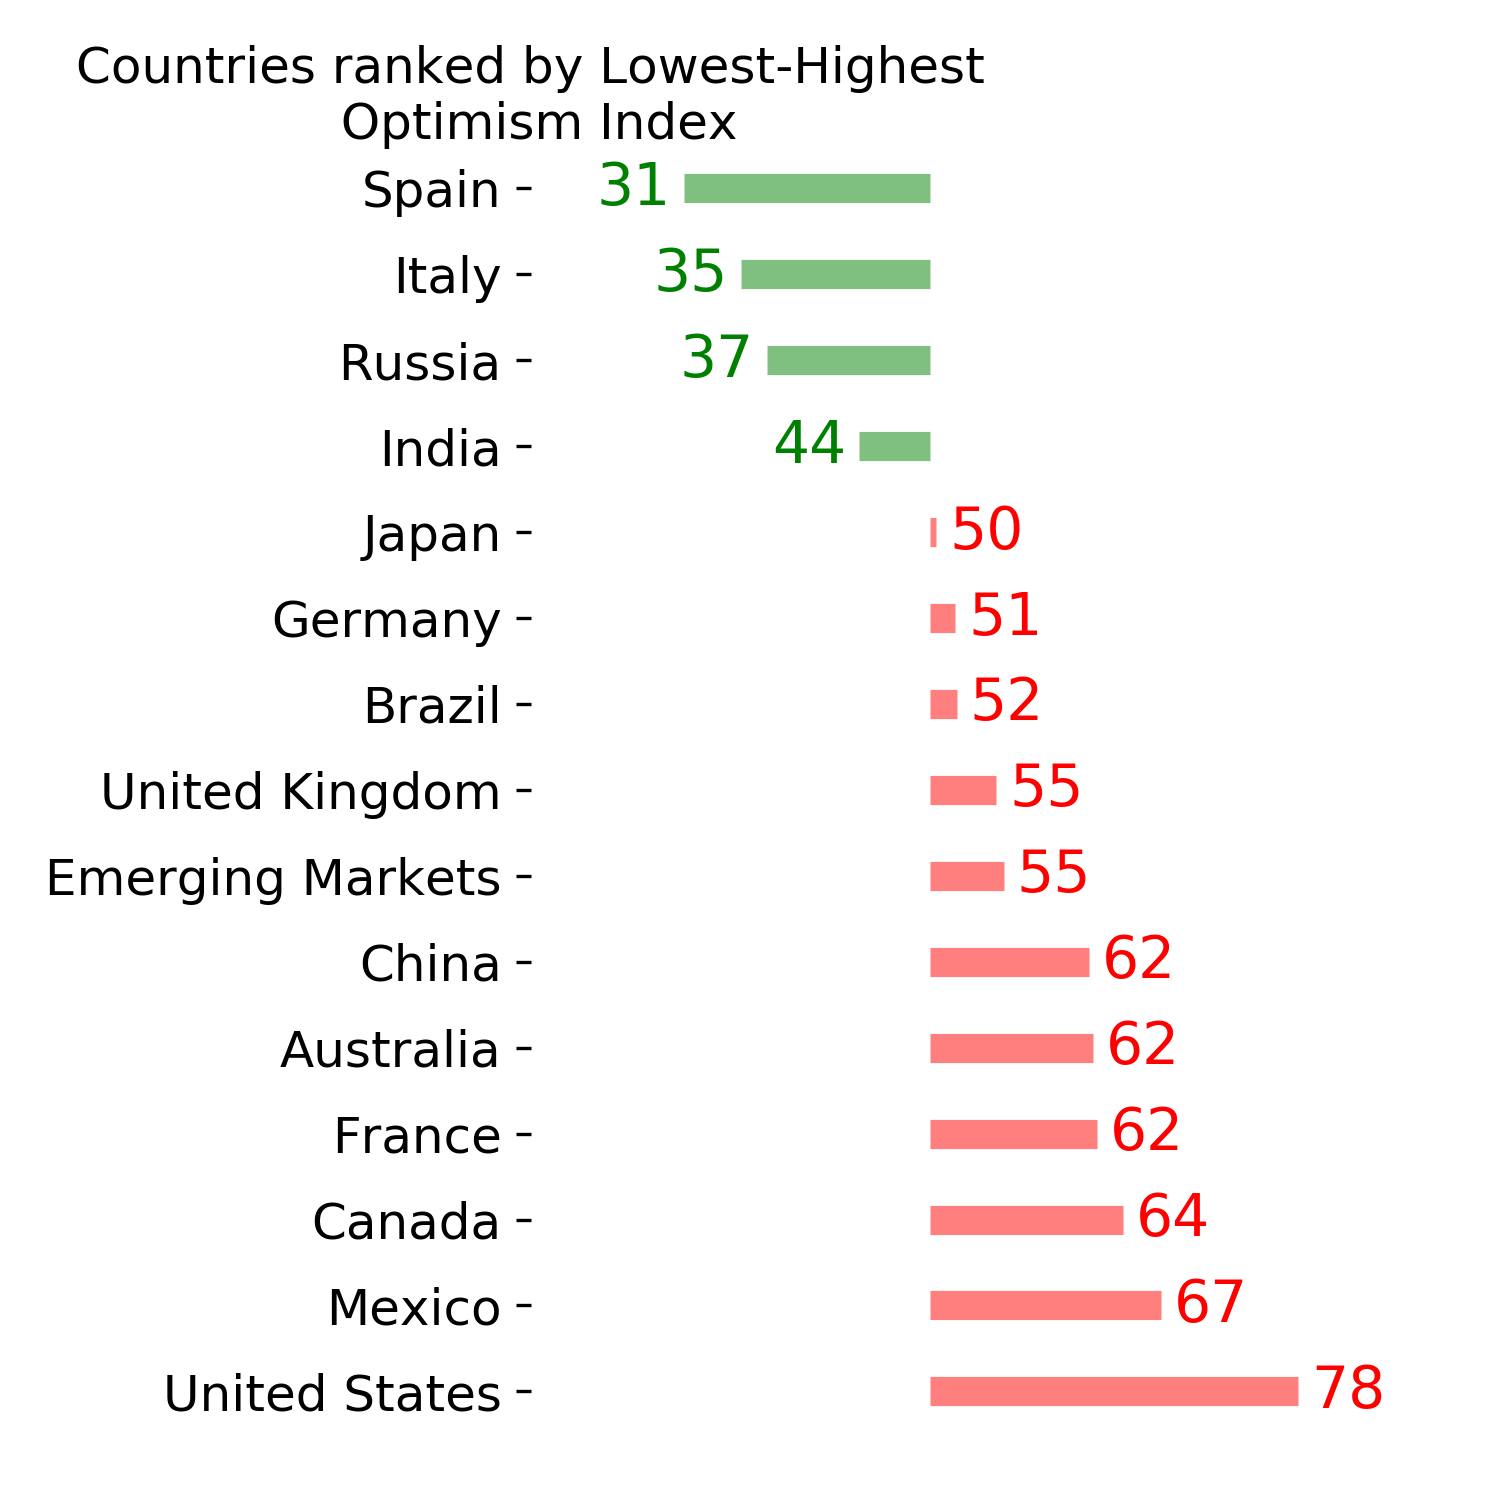
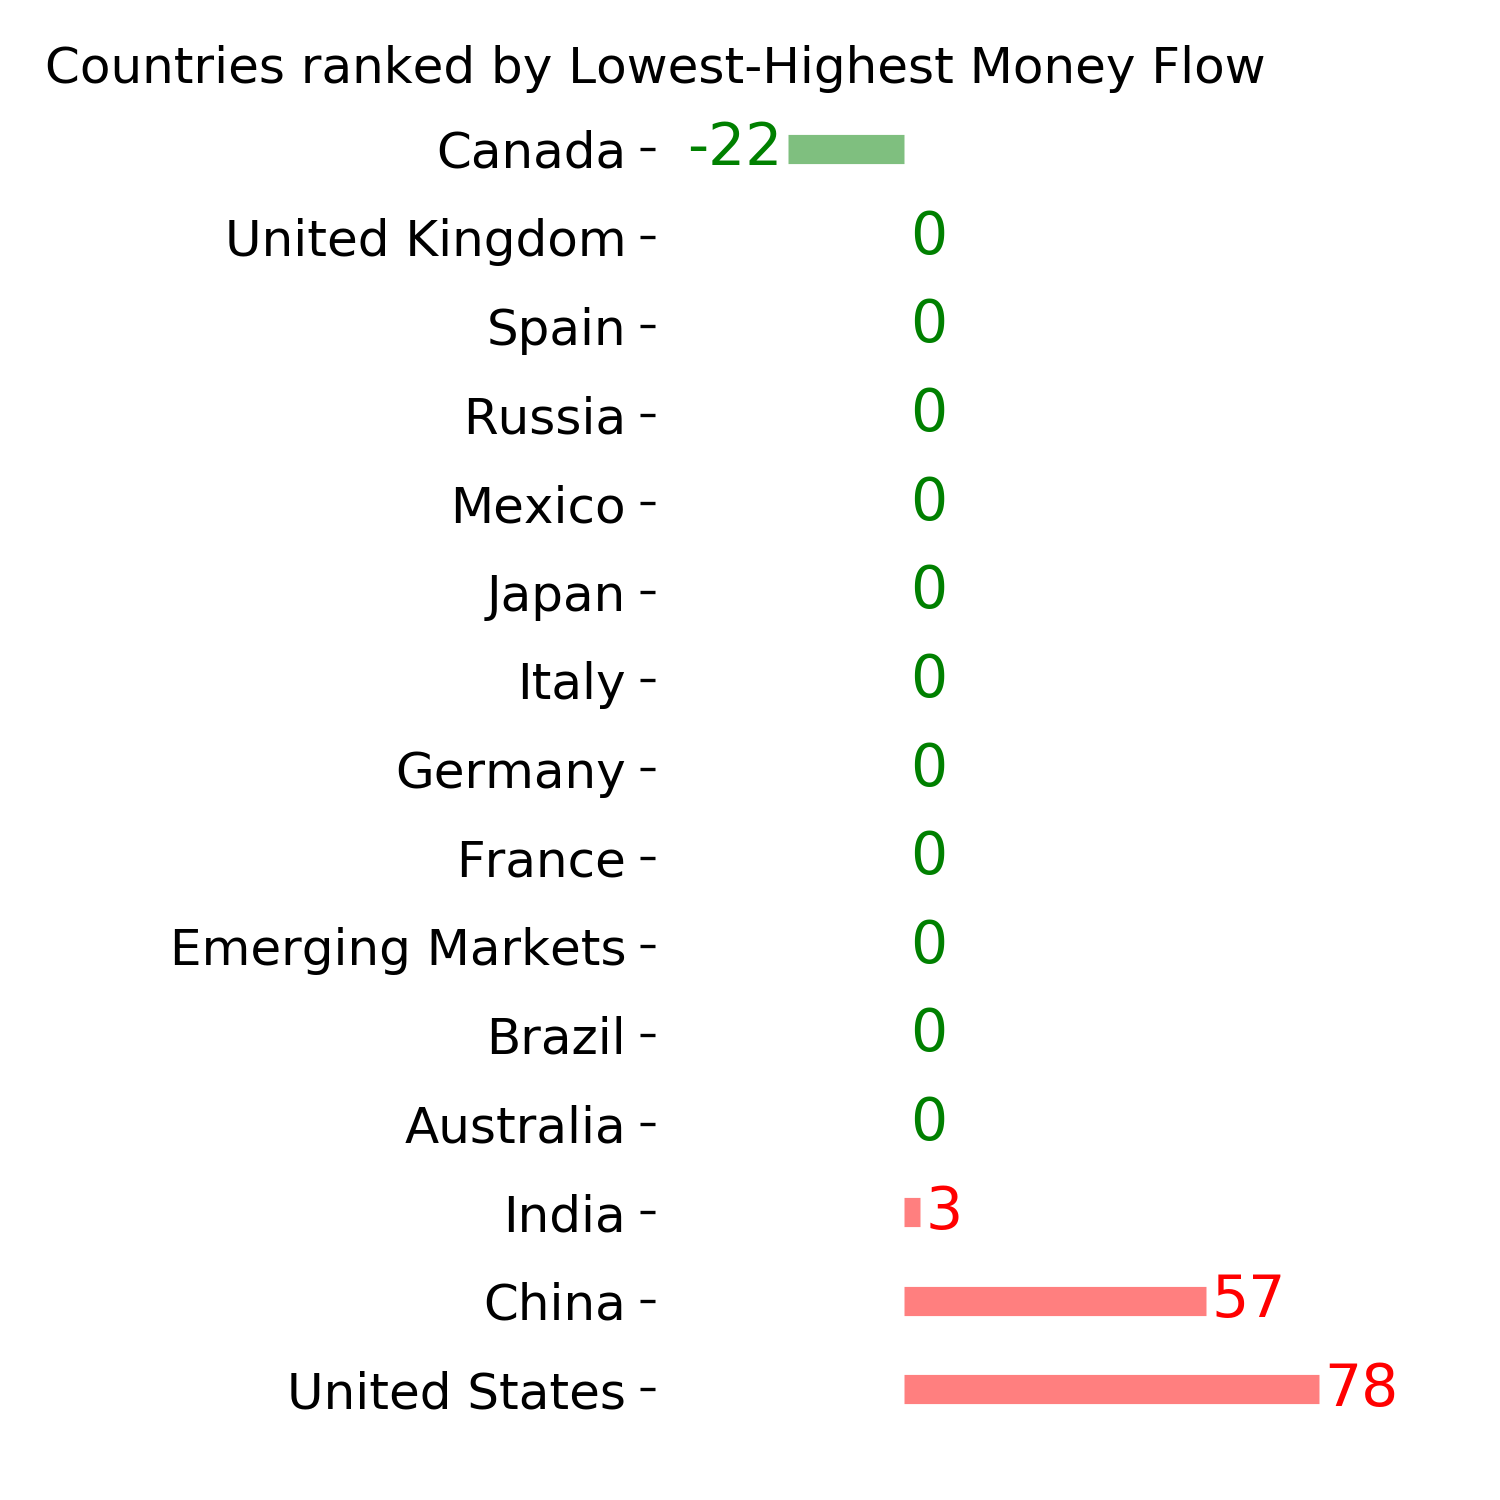
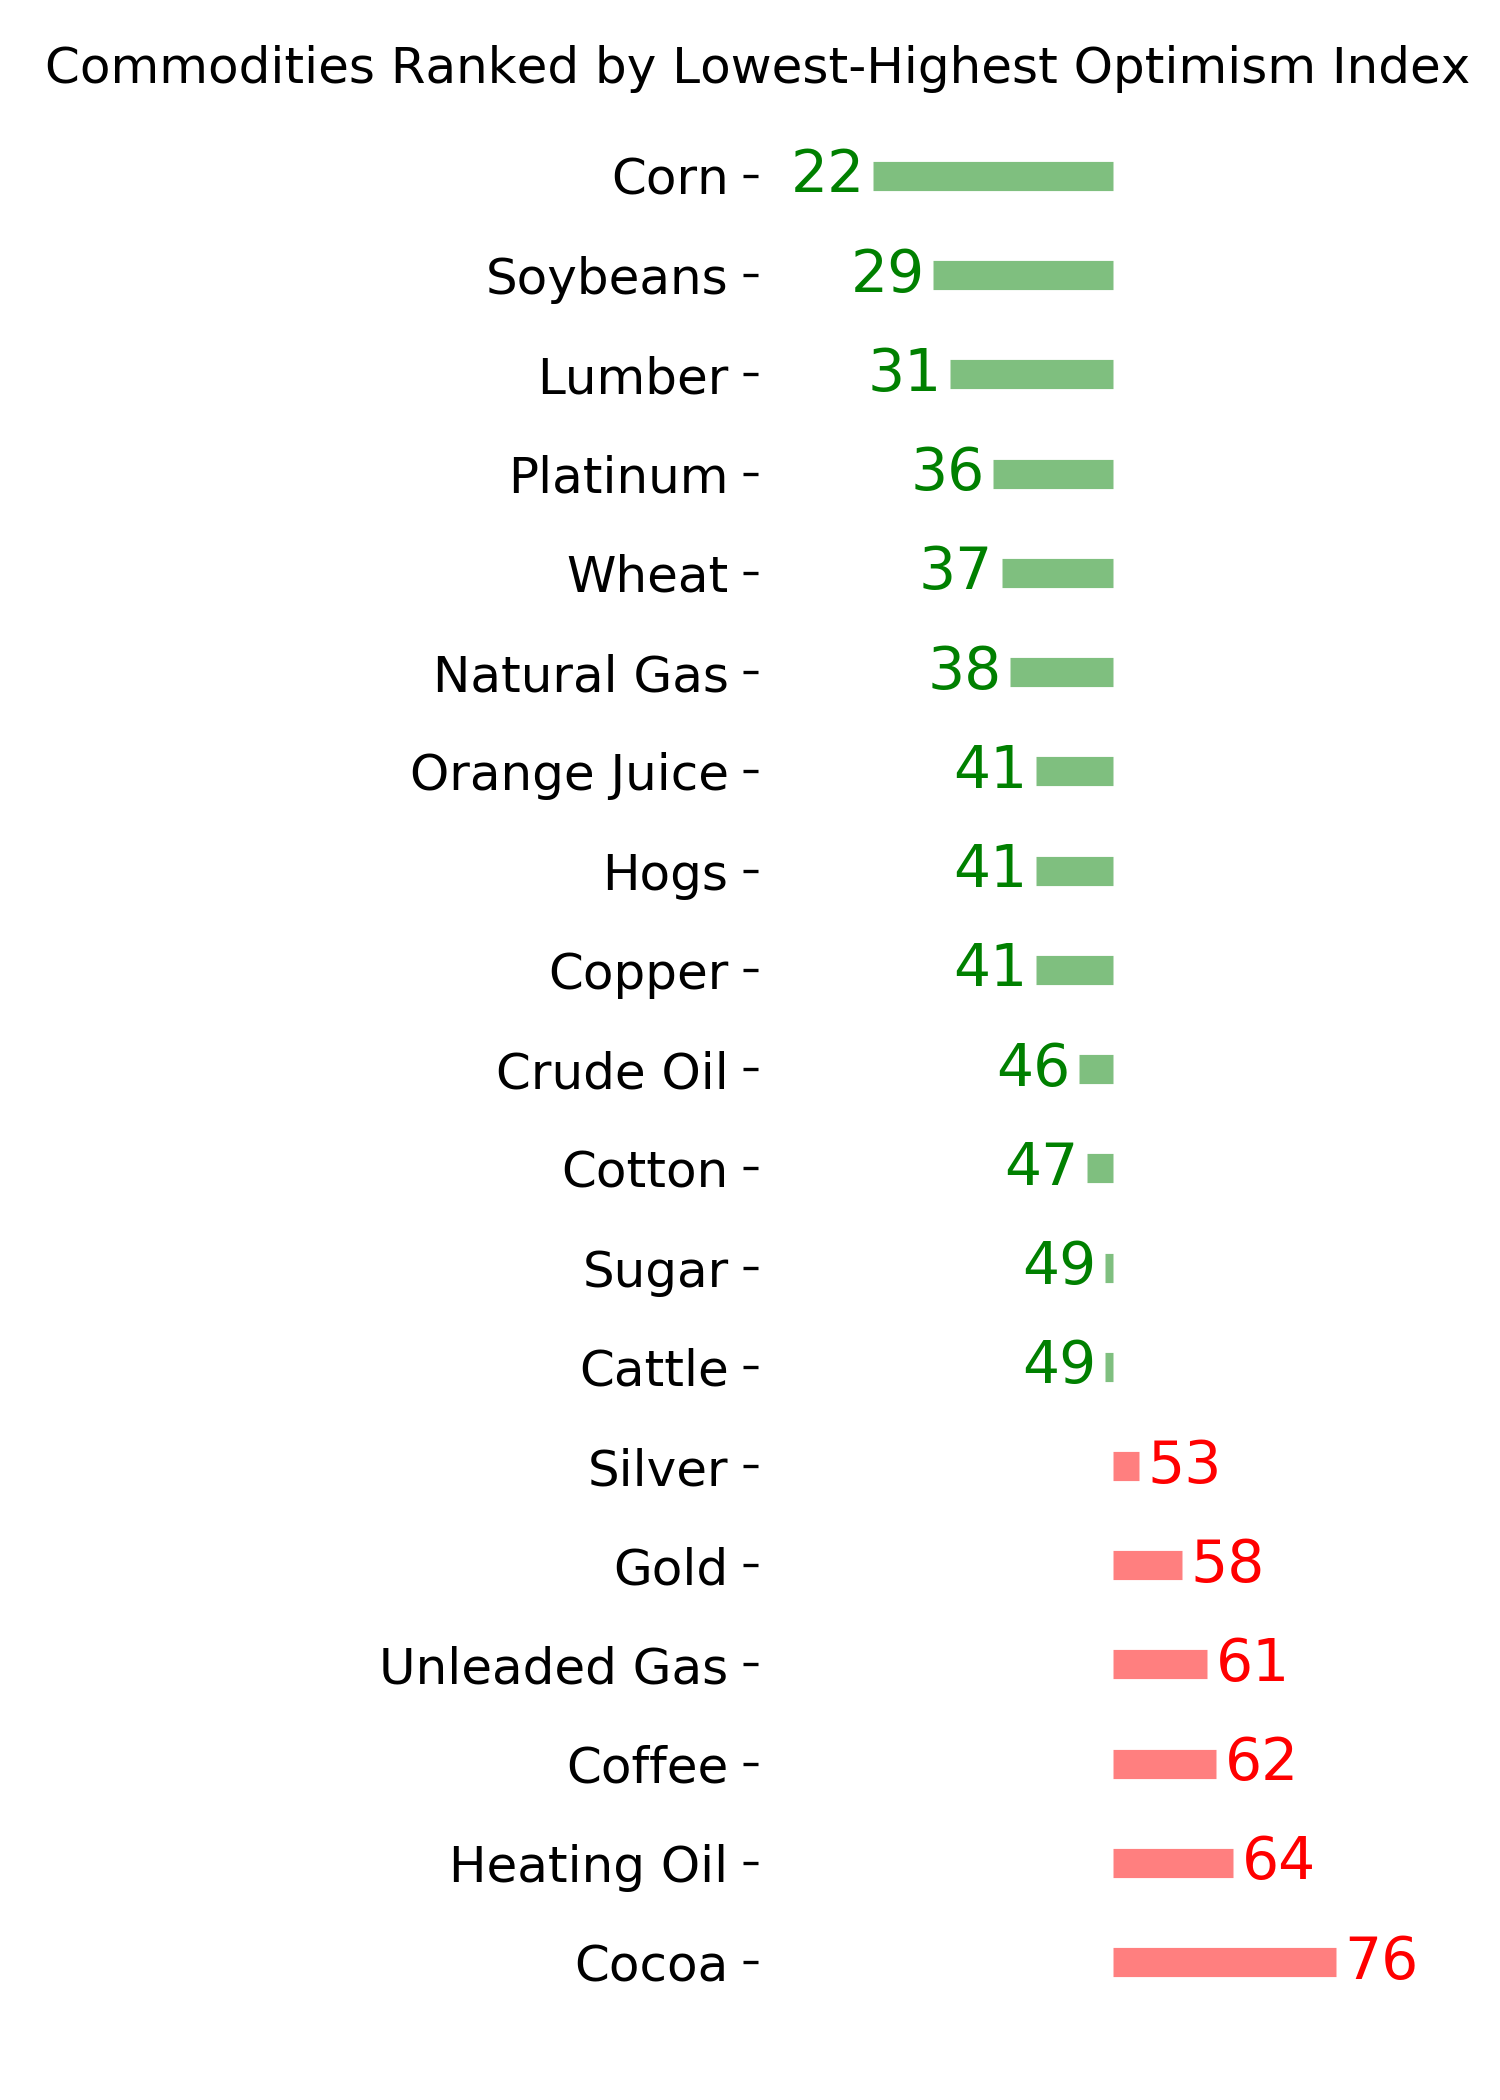
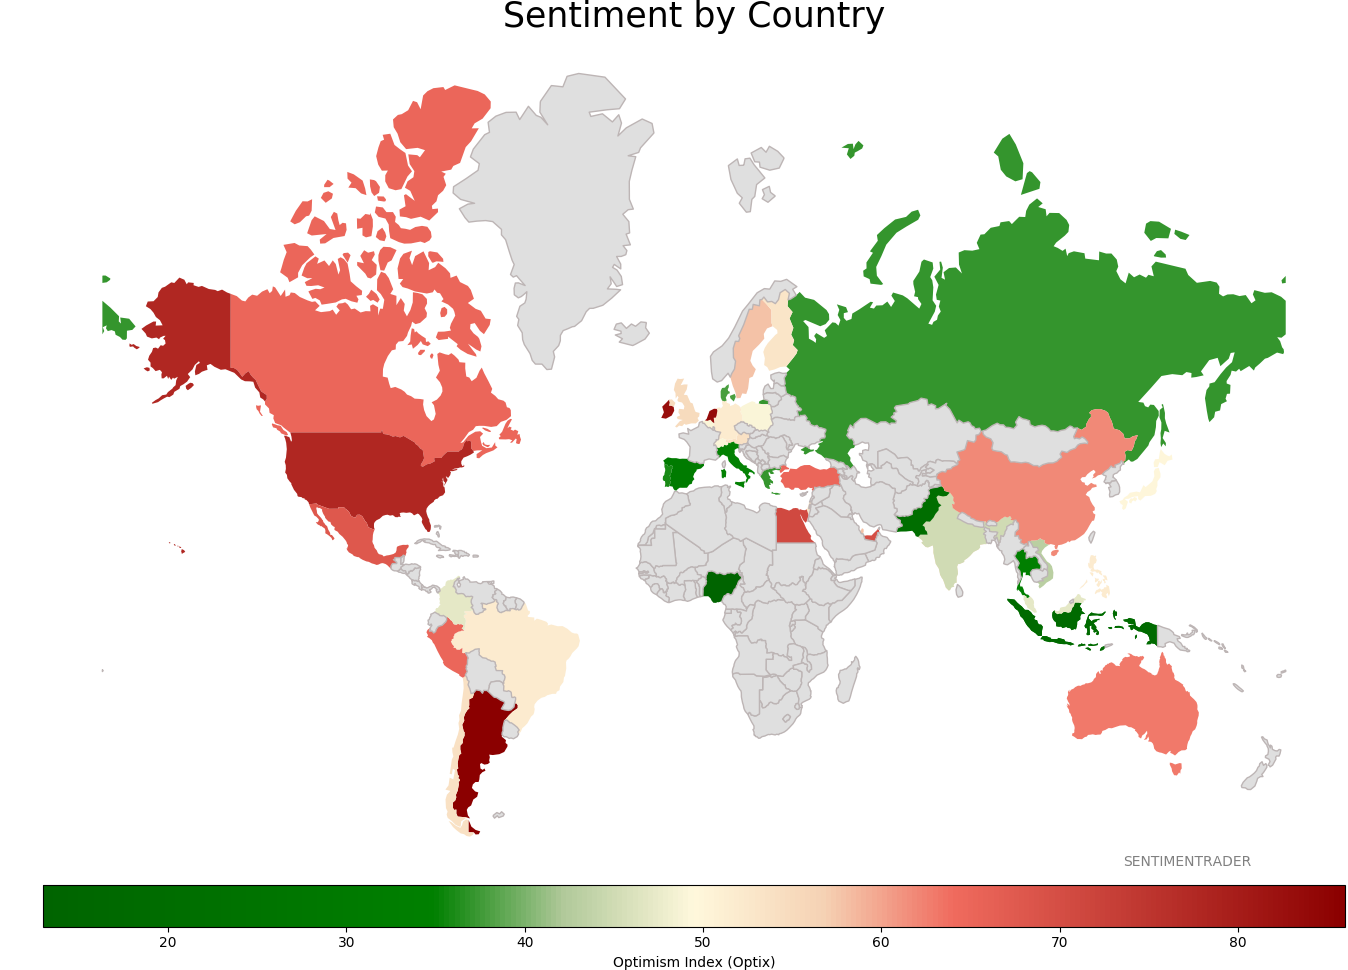
Sentiment Around The World
Optimism Index Thumbnails
|
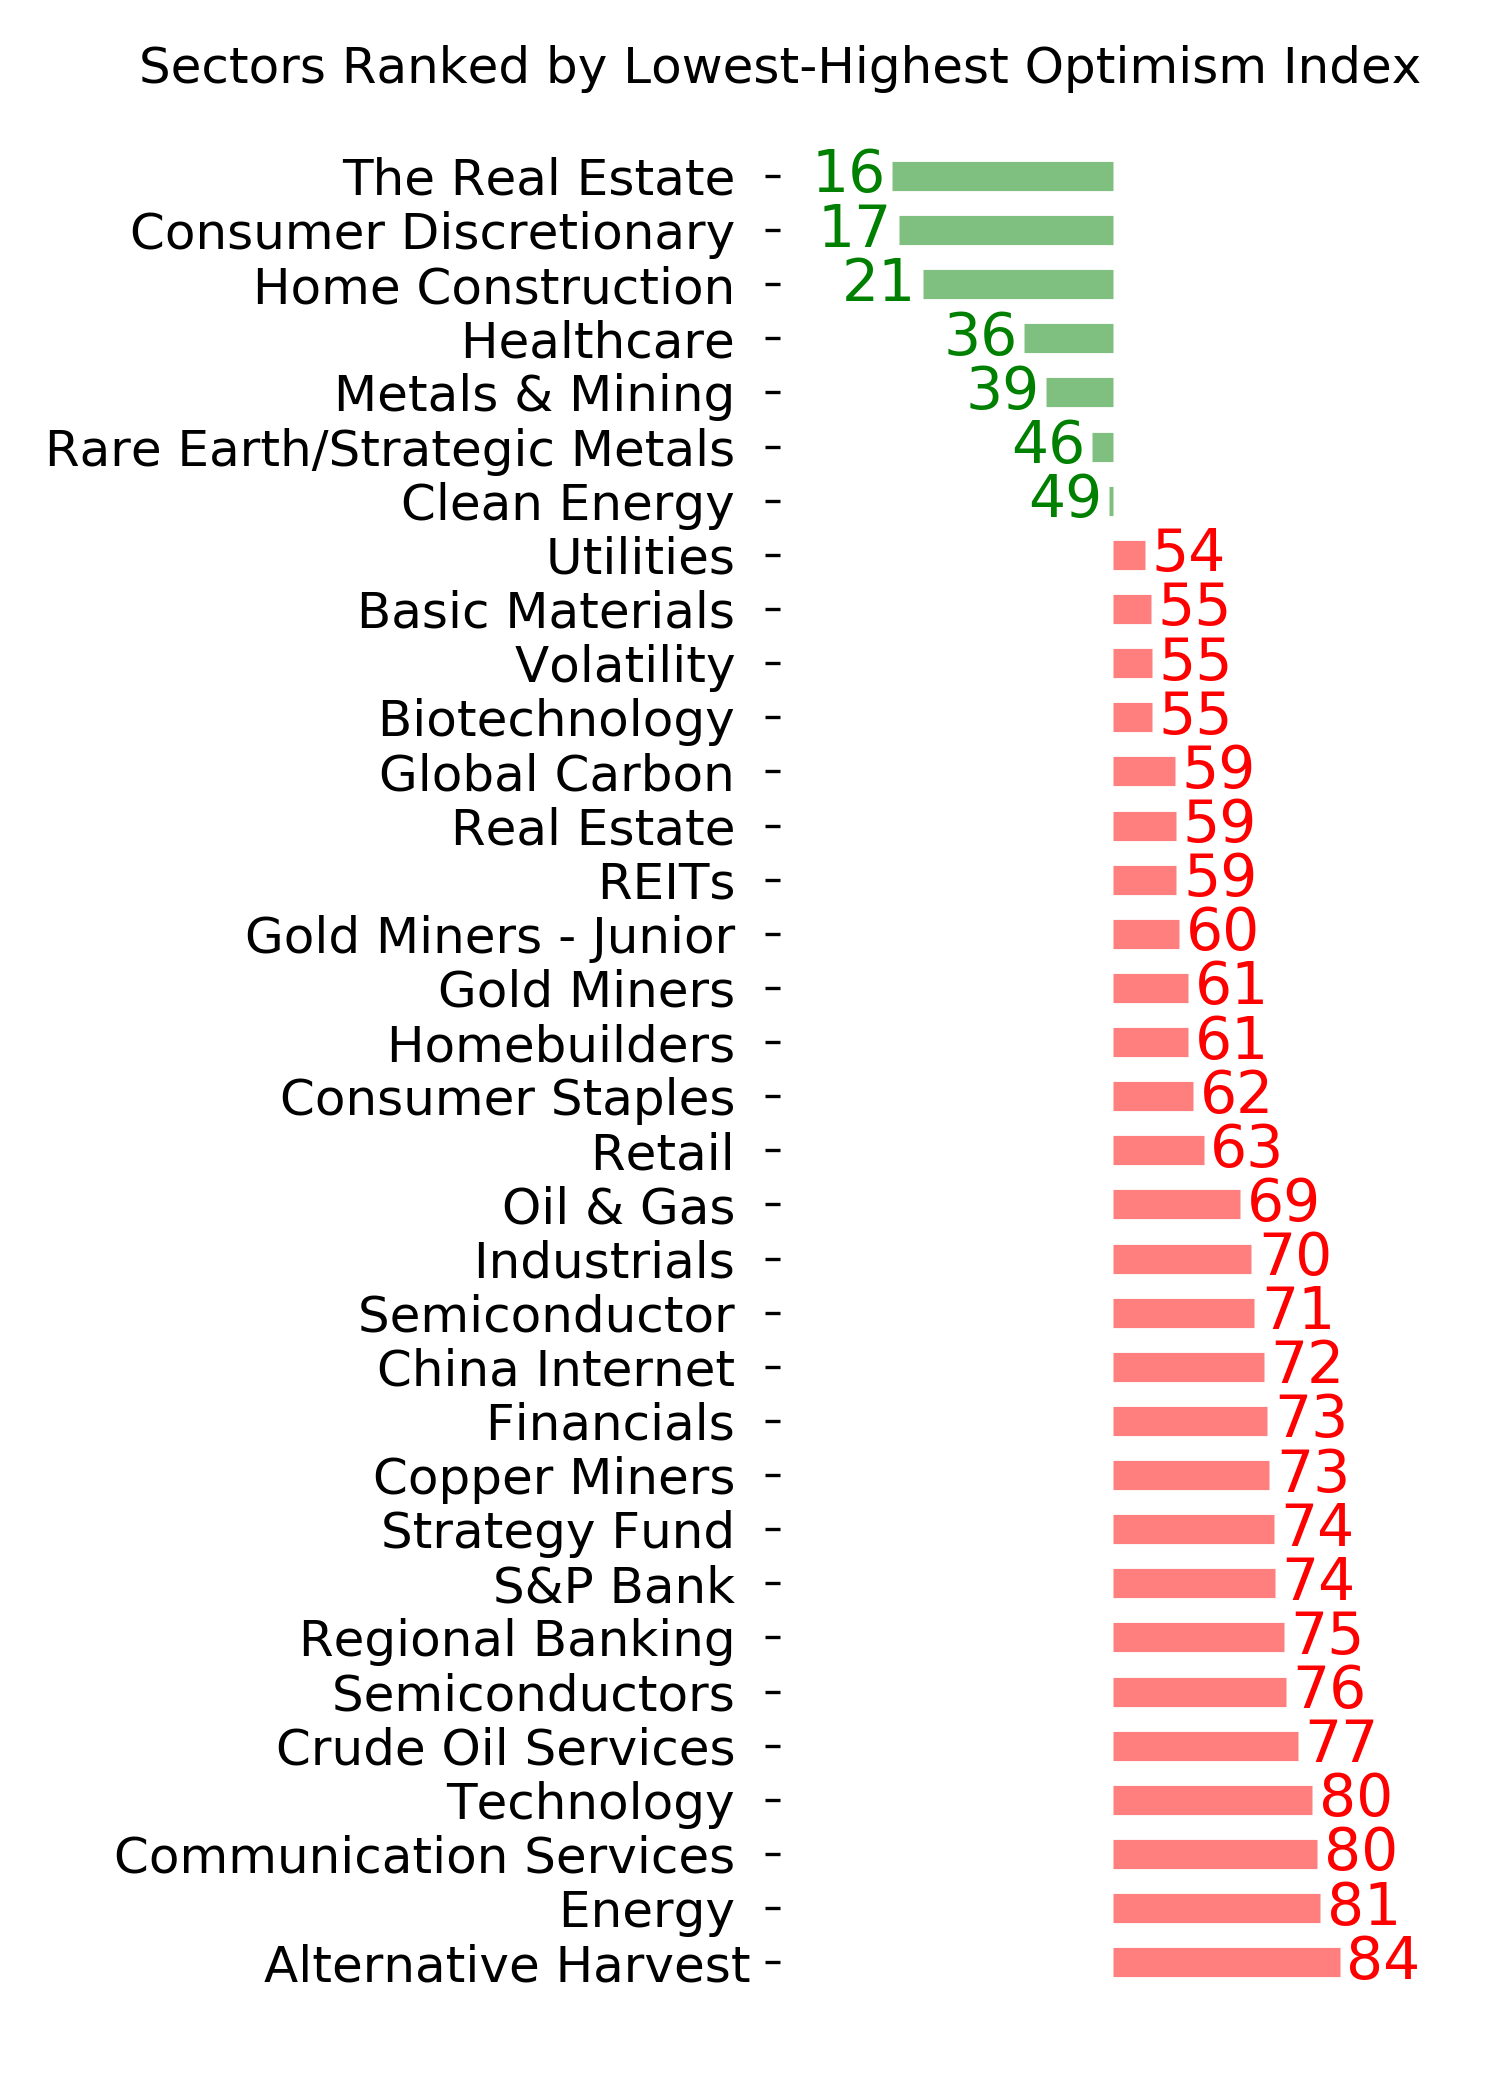
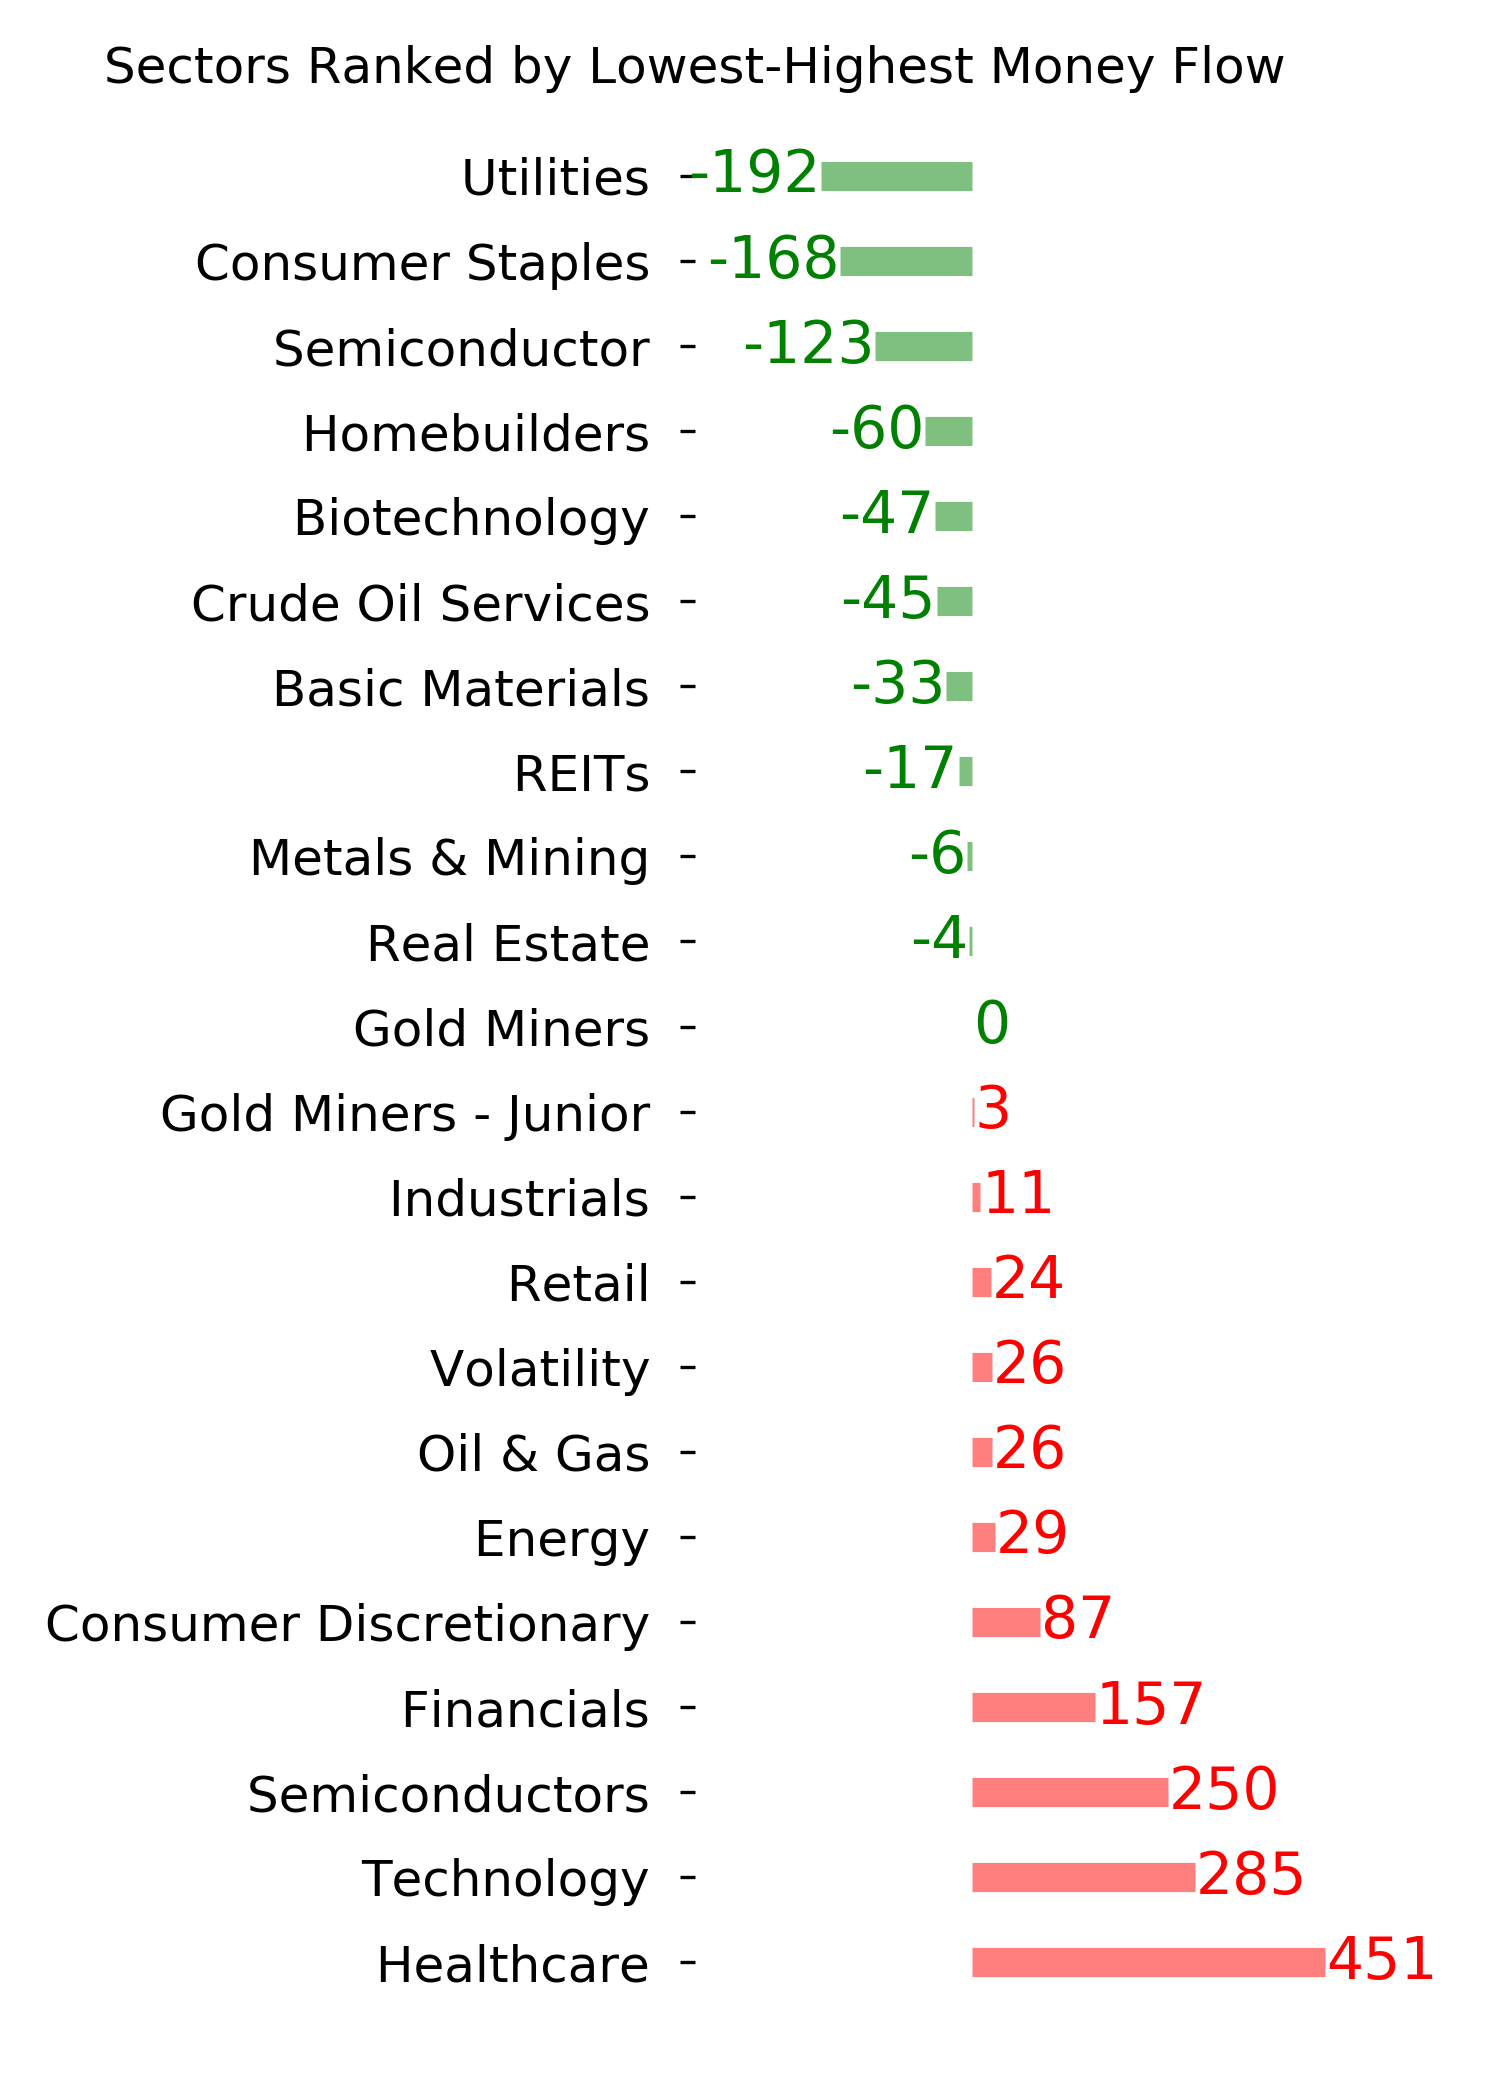
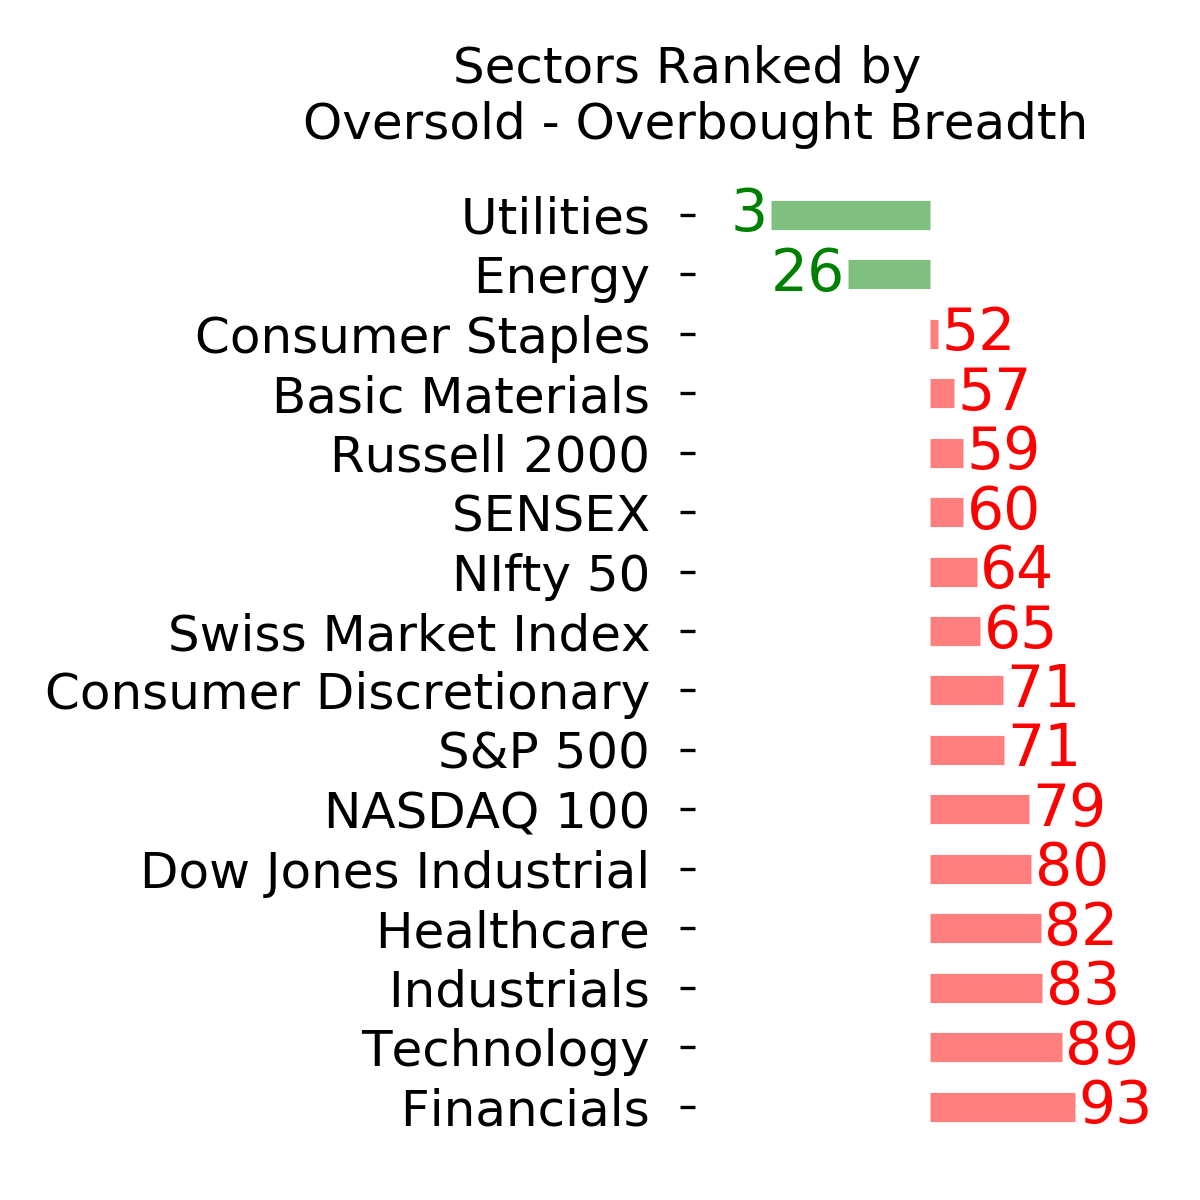
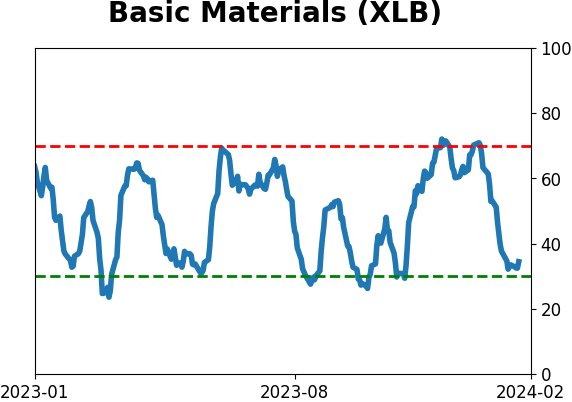
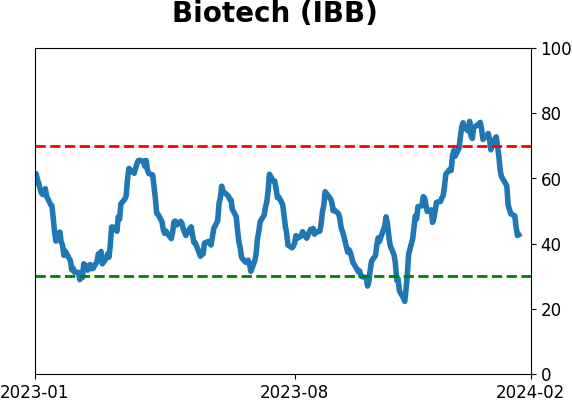
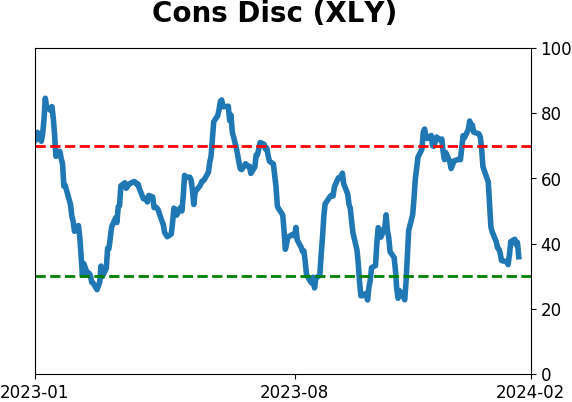
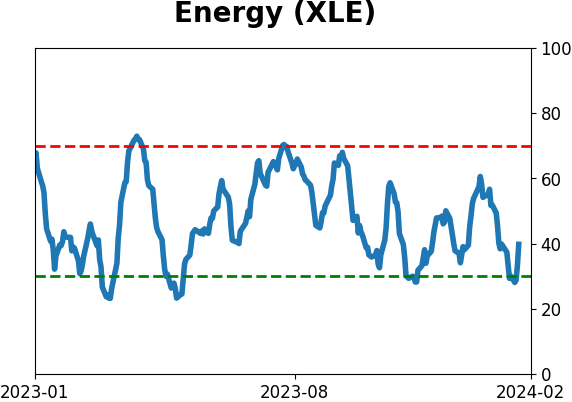
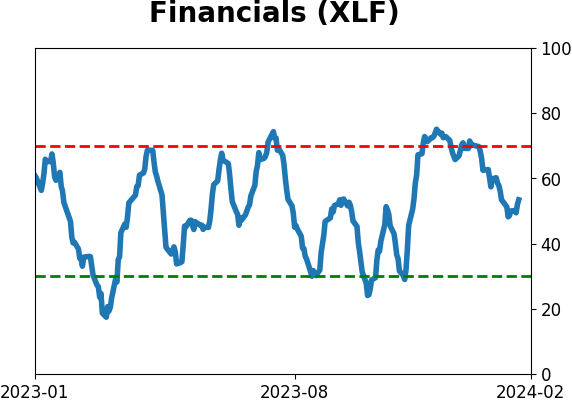
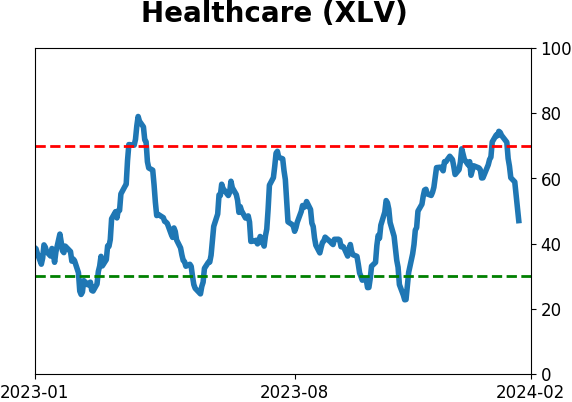
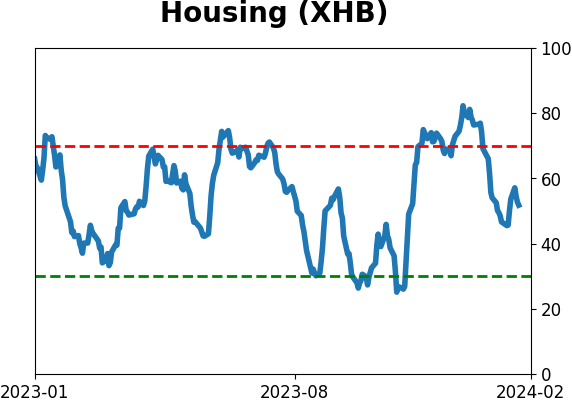
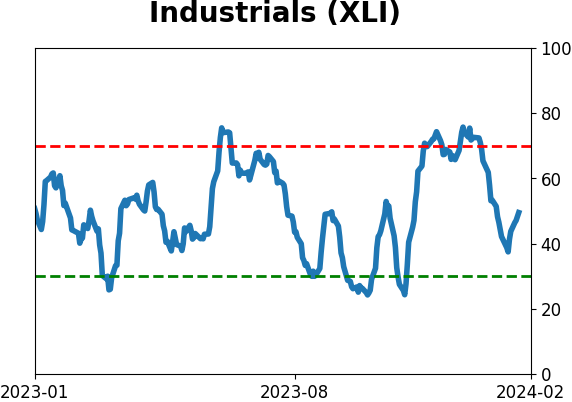
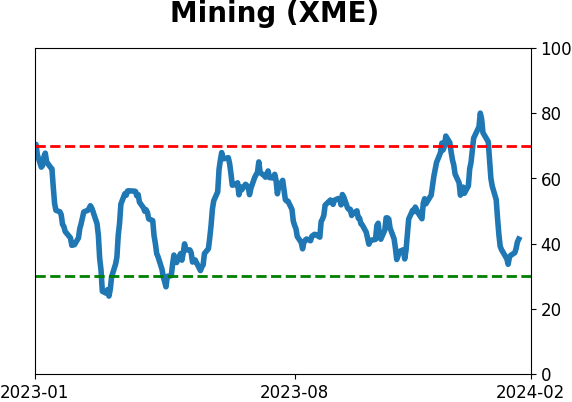
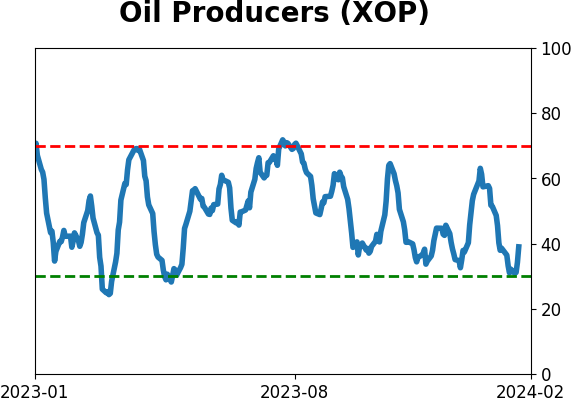
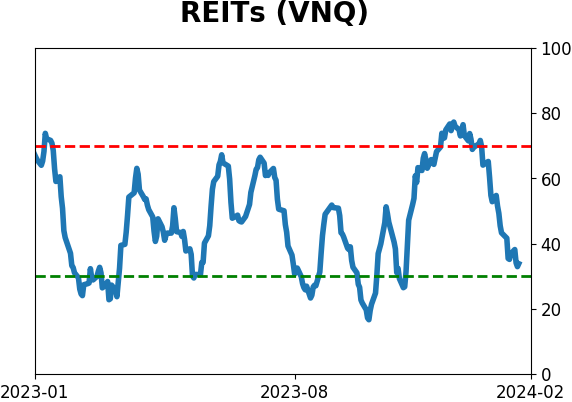
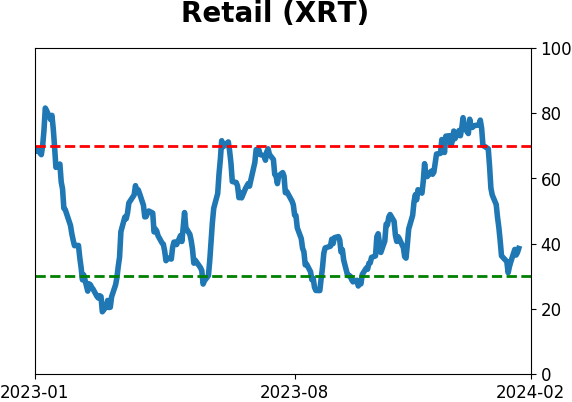
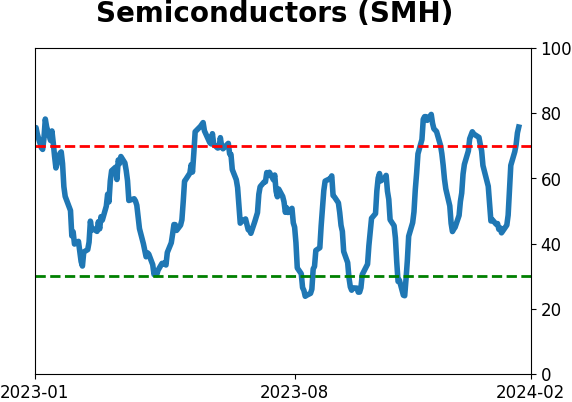
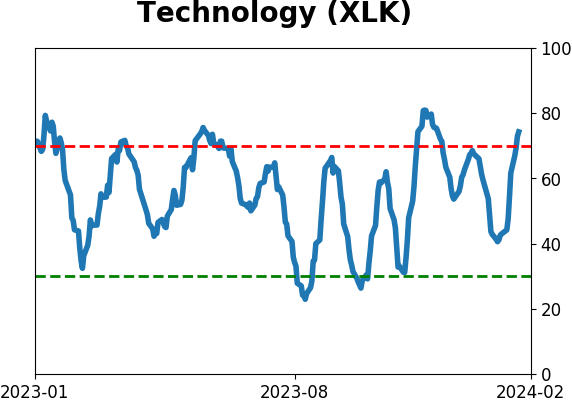
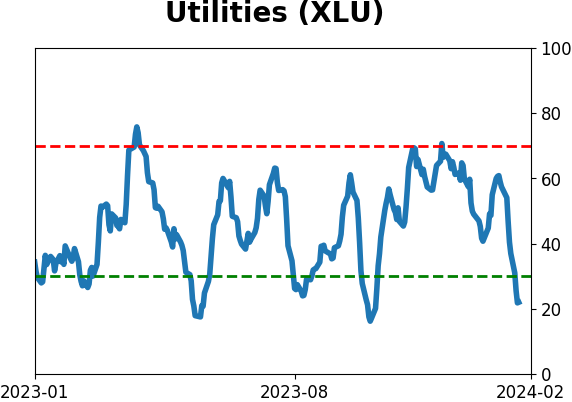
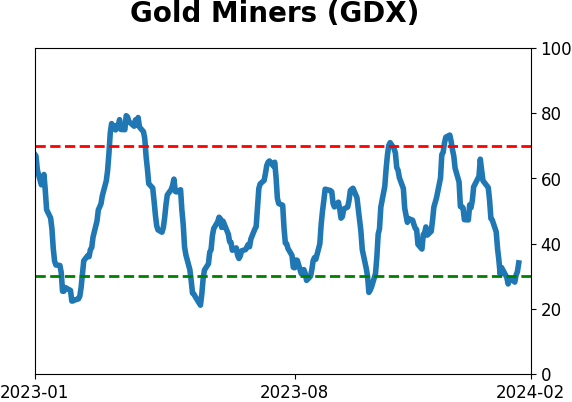
Sector ETF's - 10-Day Moving Average
|
|
|
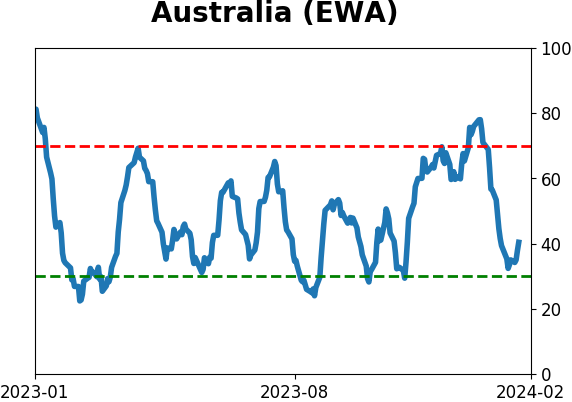
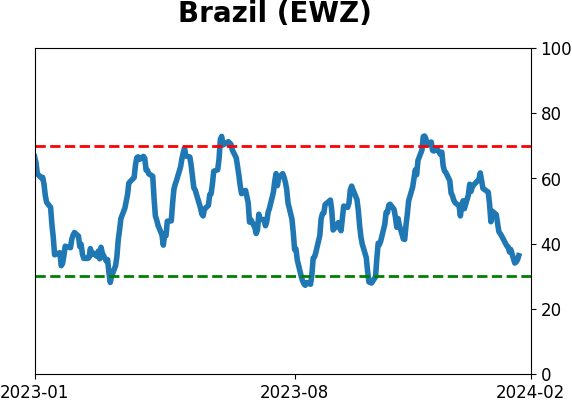
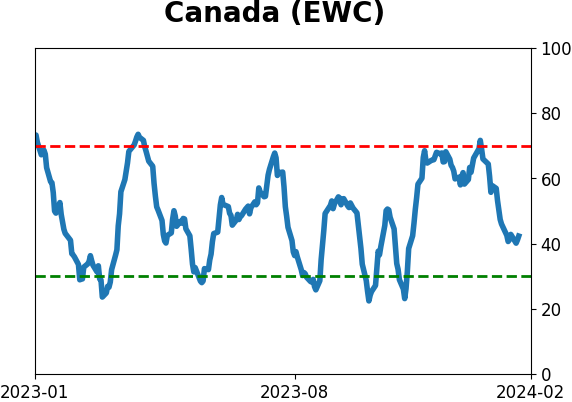
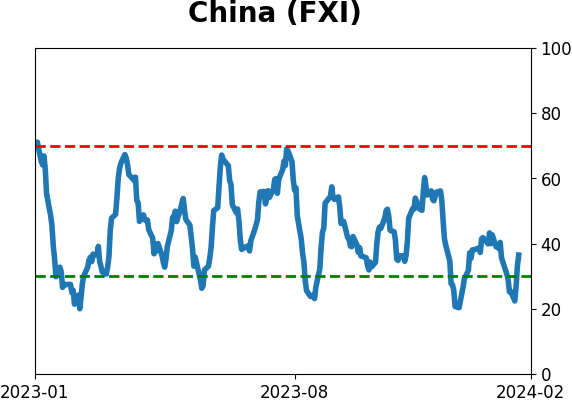
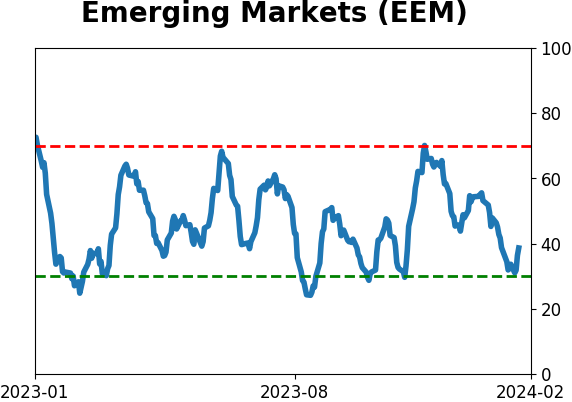
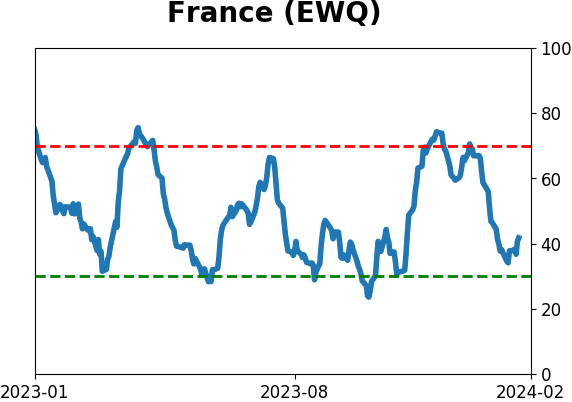
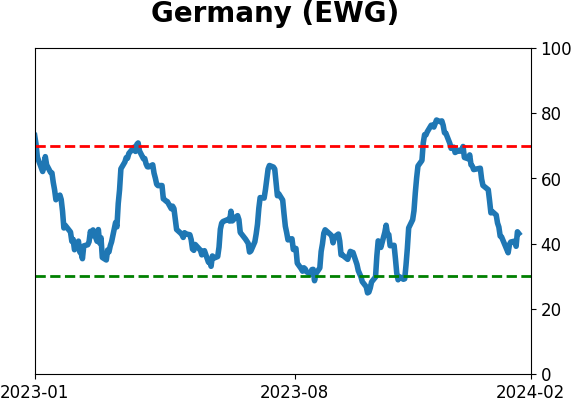
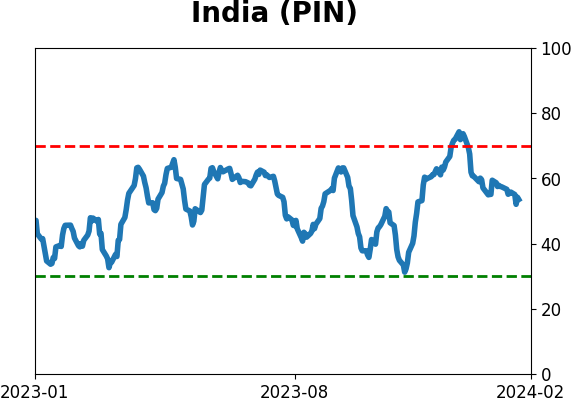
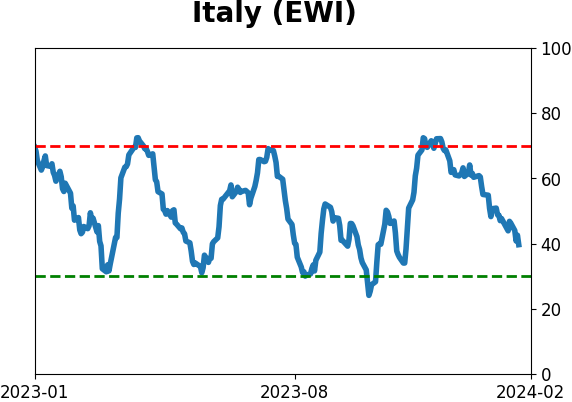
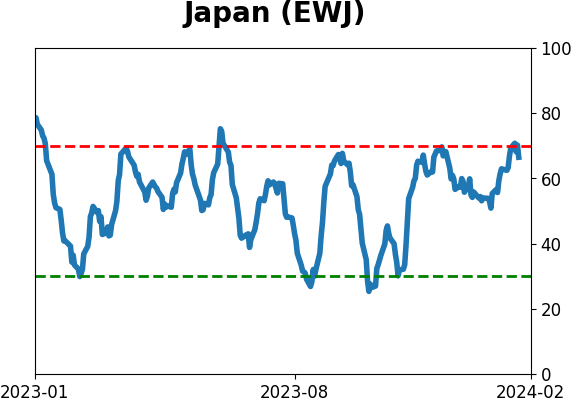
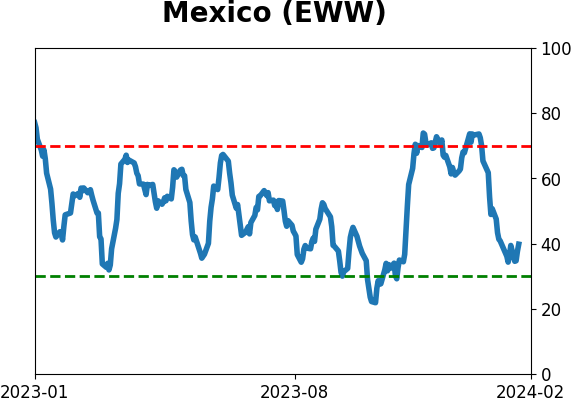
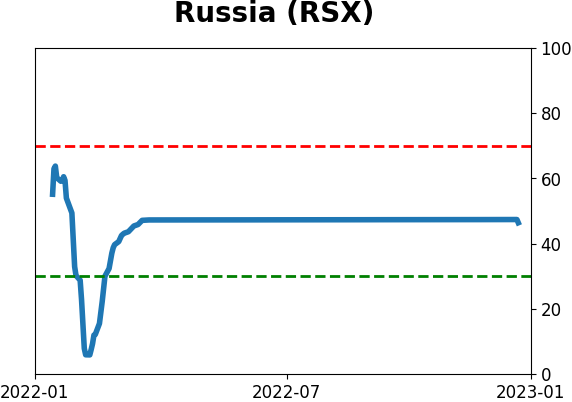
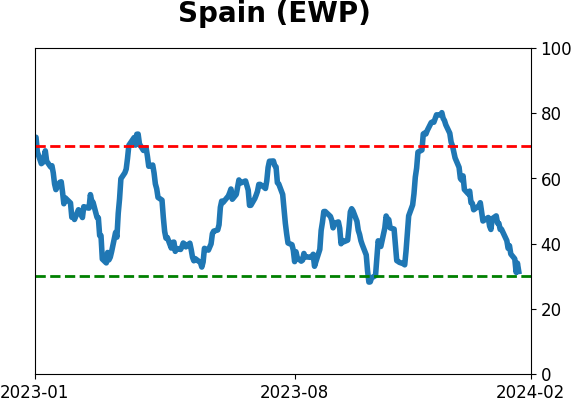
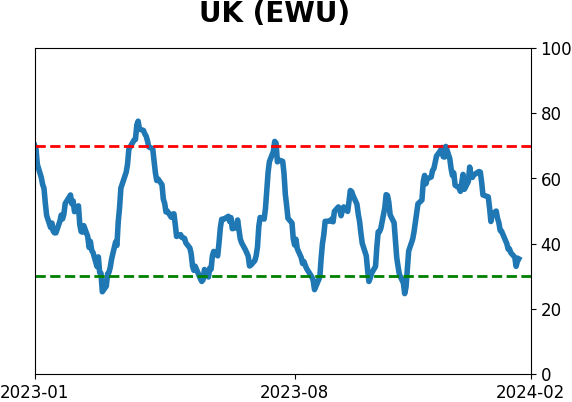
Country ETF's - 10-Day Moving Average
|
|
|
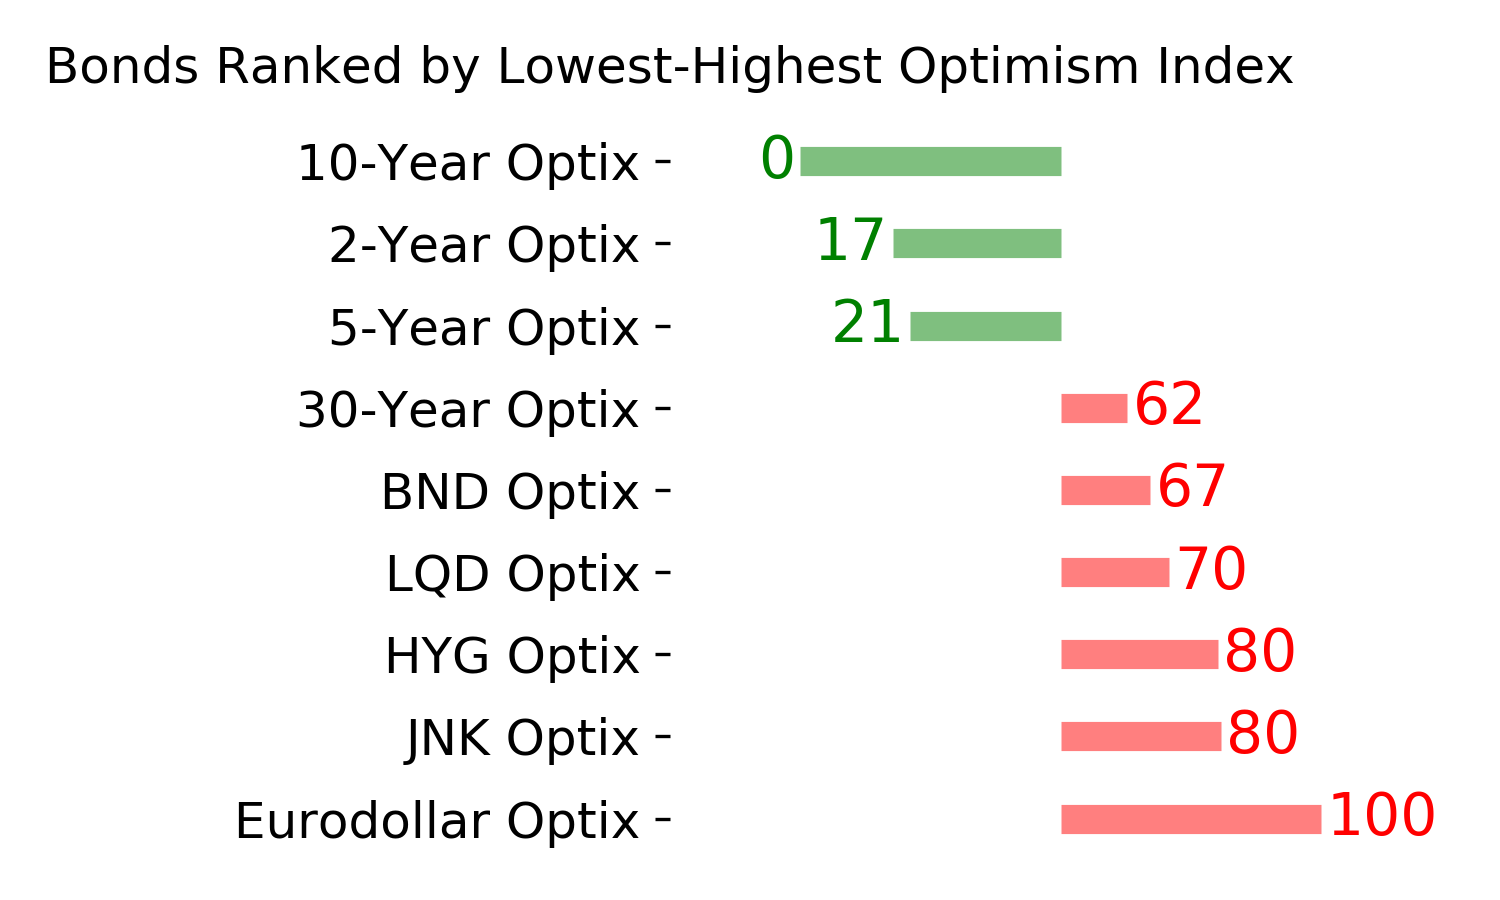
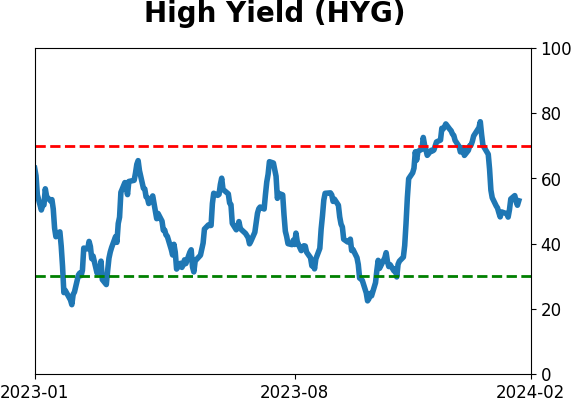
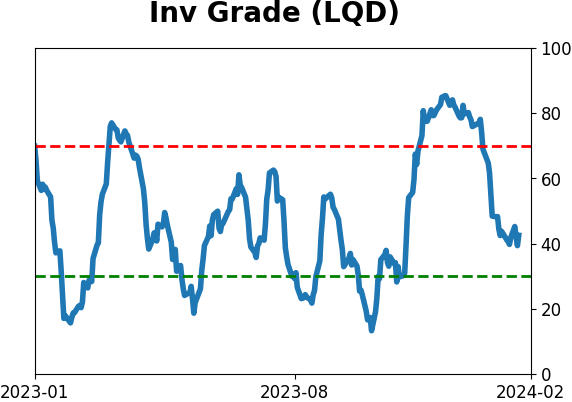
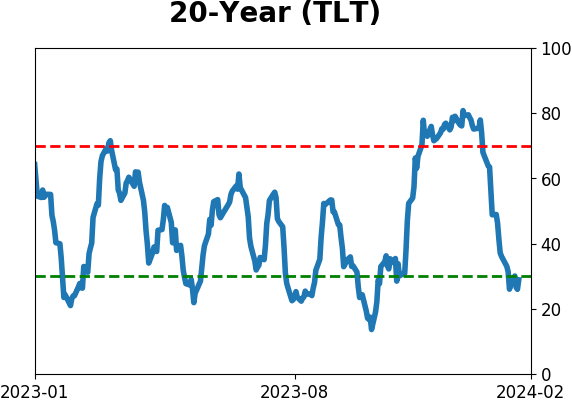
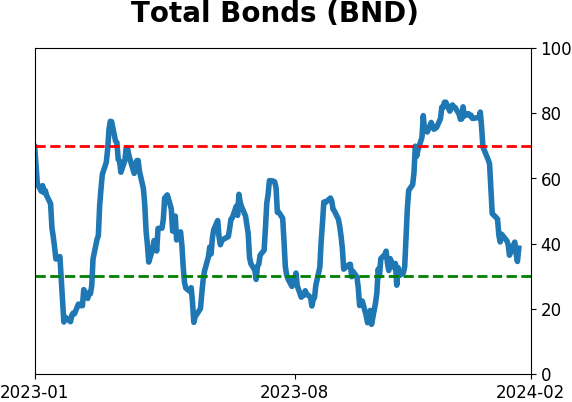
Bond ETF's - 10-Day Moving Average
|
|
|
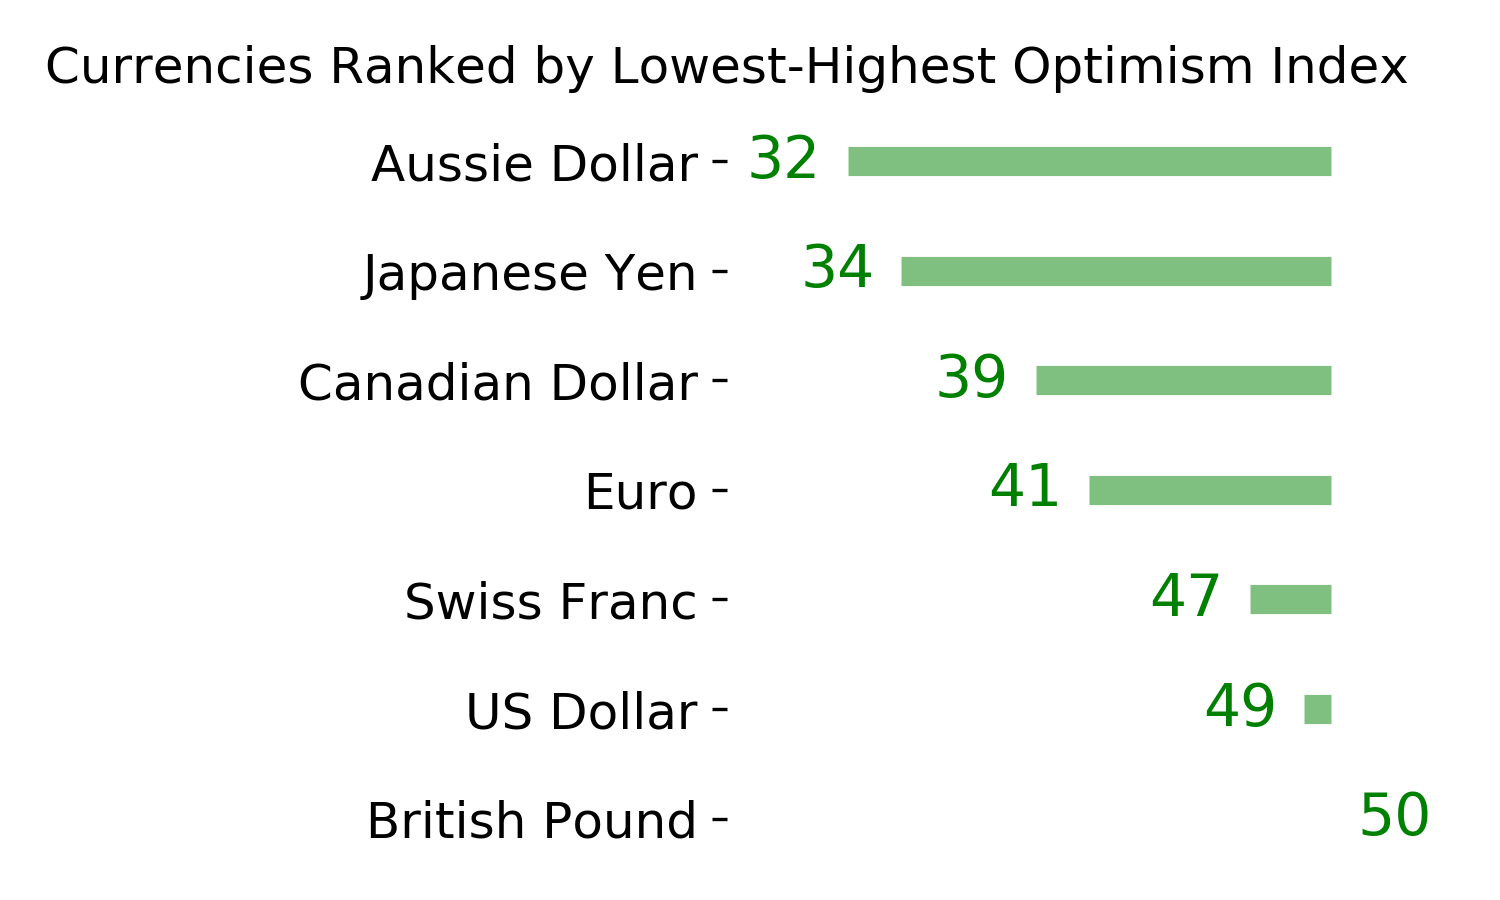
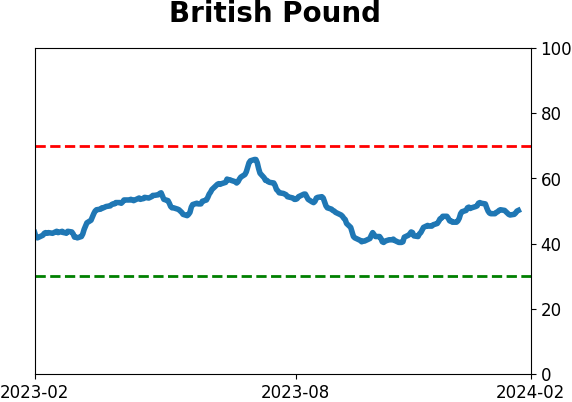
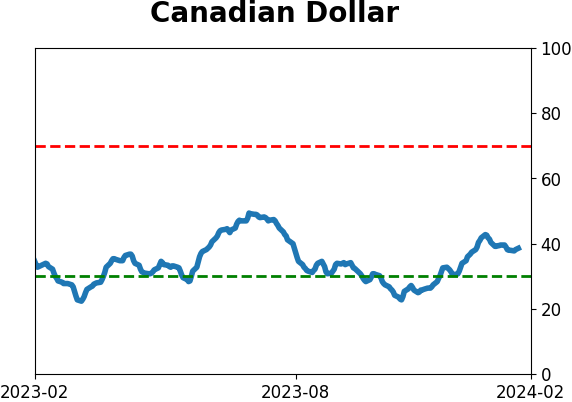
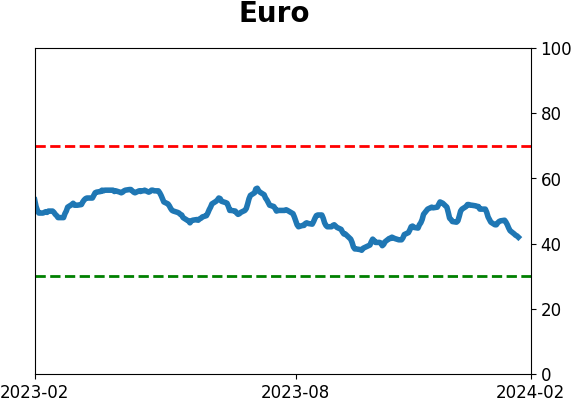
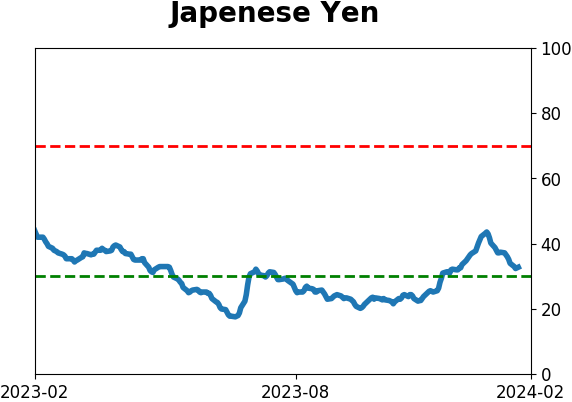
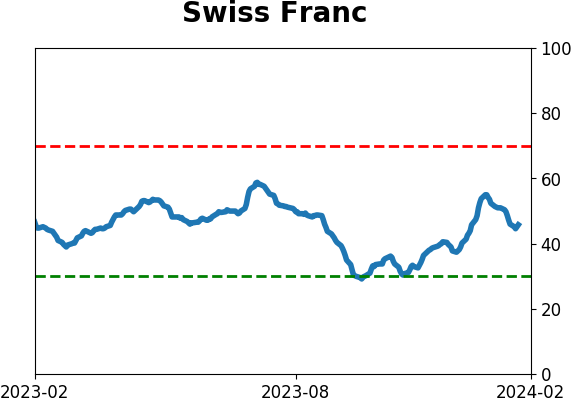
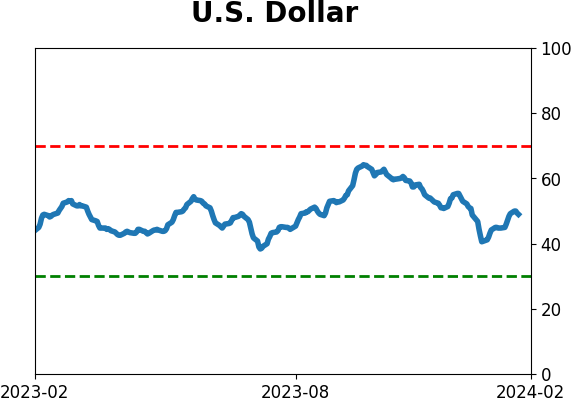
Currency ETF's - 5-Day Moving Average
|
|
|
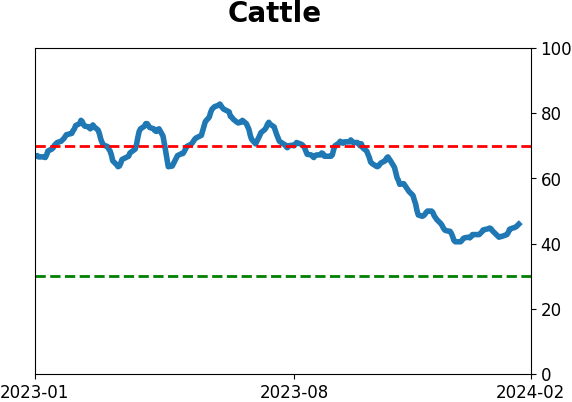
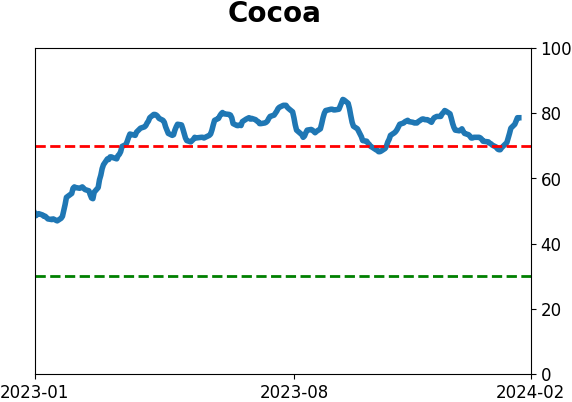
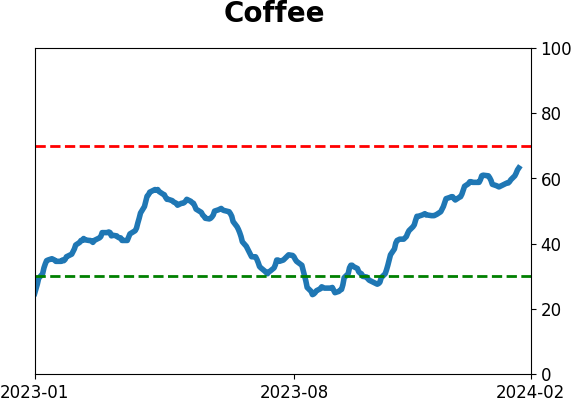
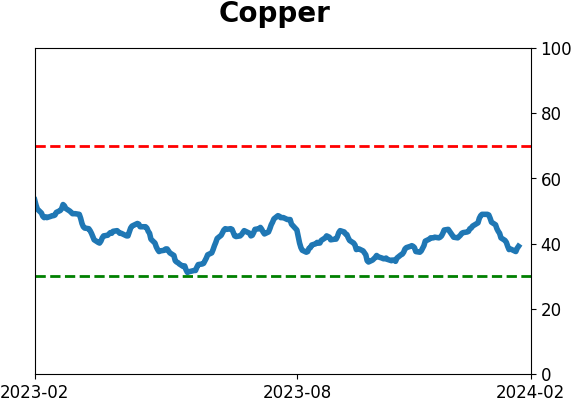
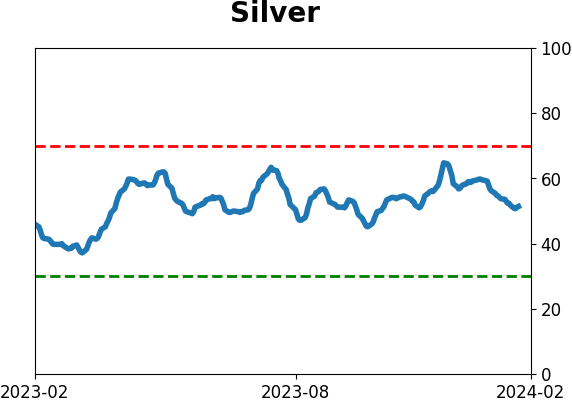
Commodity ETF's - 5-Day Moving Average
|
|