Headlines
|
|
Traders are pricing in much lower volatility across assets:
In September and October of 2022, traders were pricing in heavy volatility across major assets like stocks, bonds, foreign currencies, and some commodities. Those fears have ebbed, and cross-asset implied volatility has declined to the lower end of its one-year range. Similar behavior typically led to modest rising prices across assets.
|
Smart / Dumb Money Confidence
|
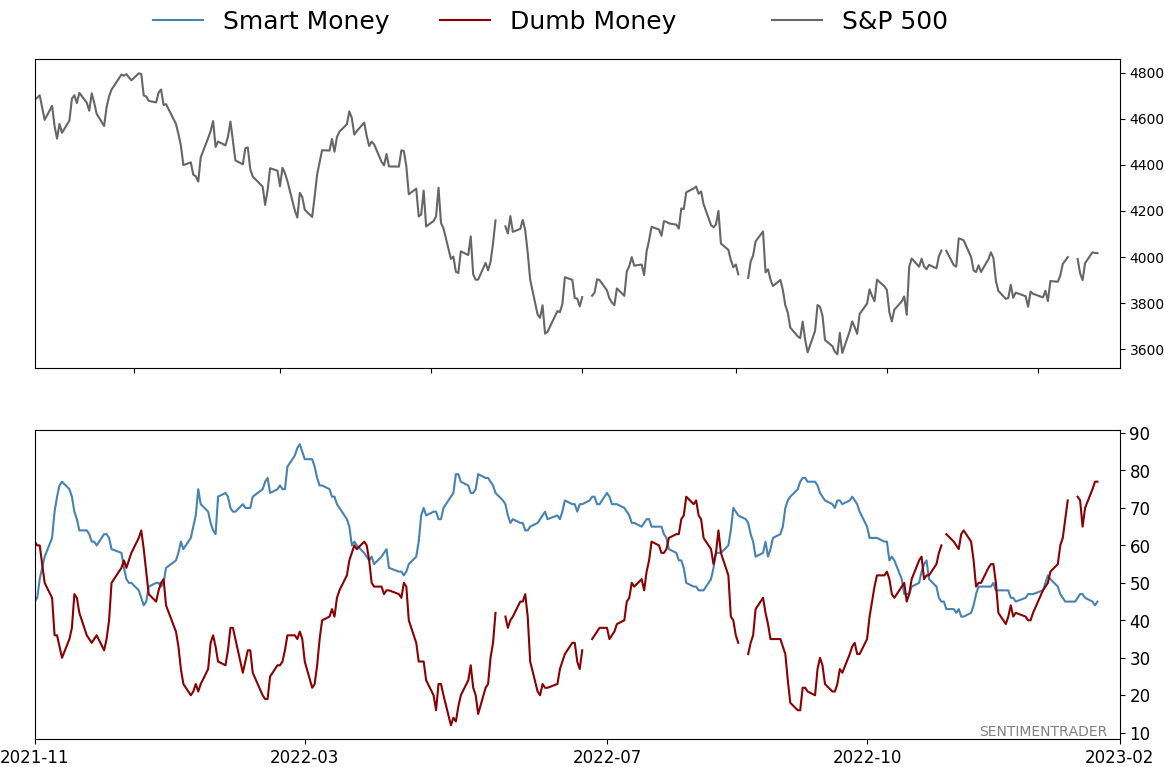
Smart Money Confidence: 45%
Dumb Money Confidence: 77%
|
|
Risk Levels
Stocks Short-Term
|
Stocks Medium-Term
|
|
Bonds

|
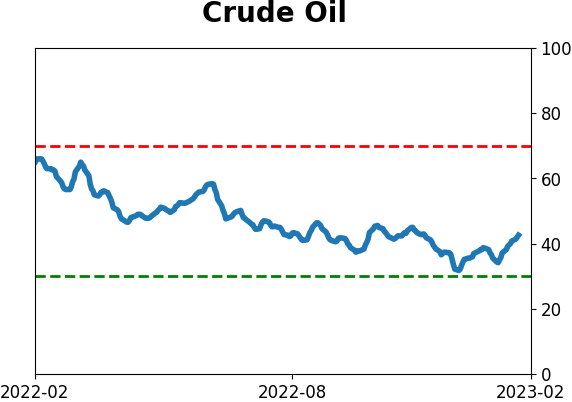
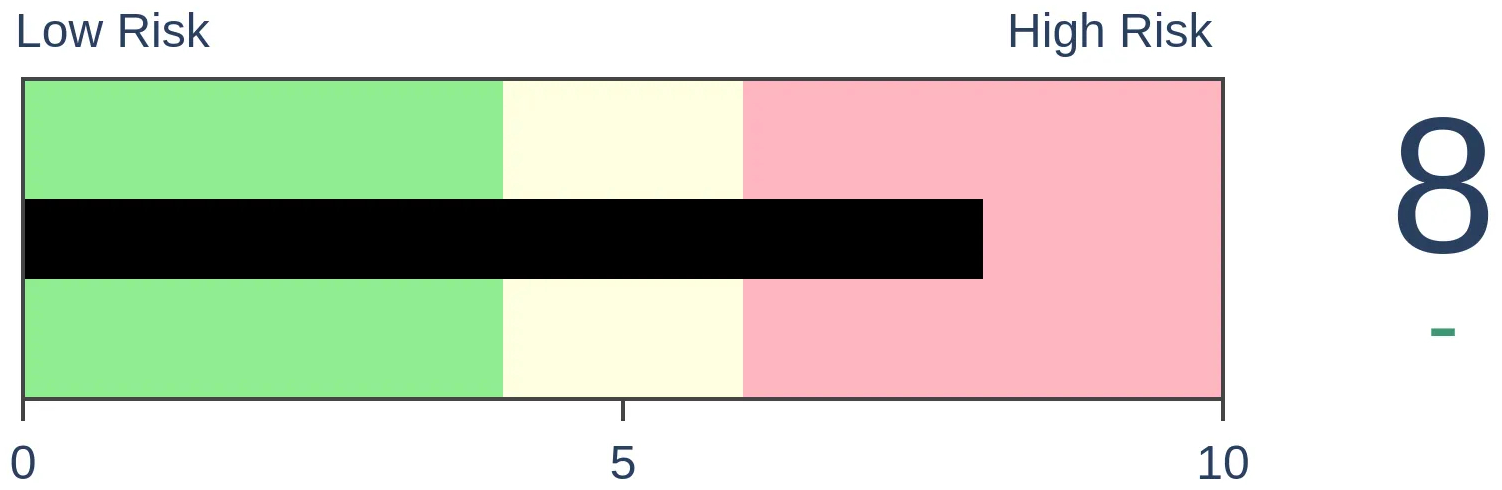
Crude Oil
|
|
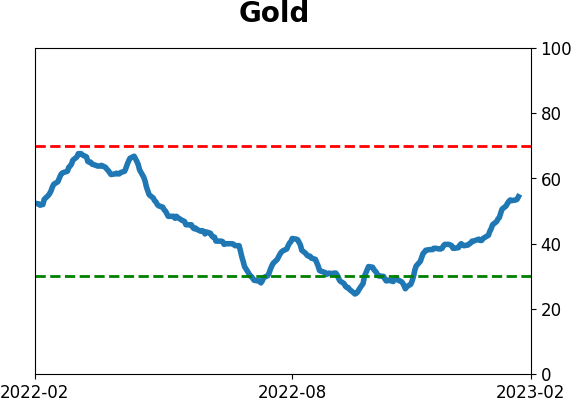
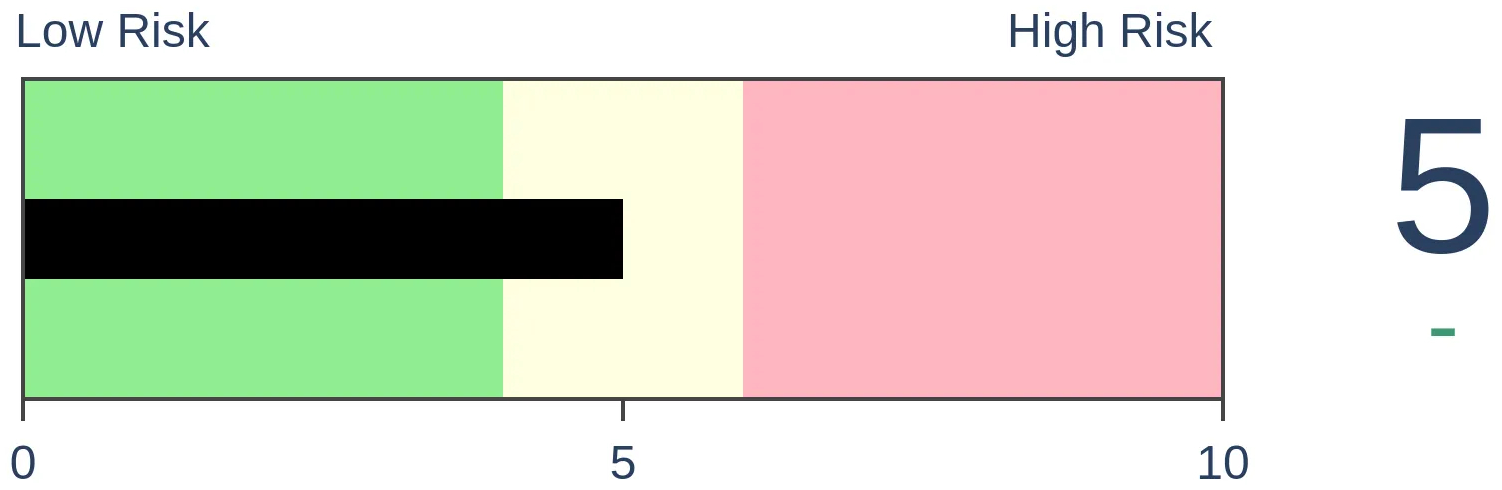
Gold
|
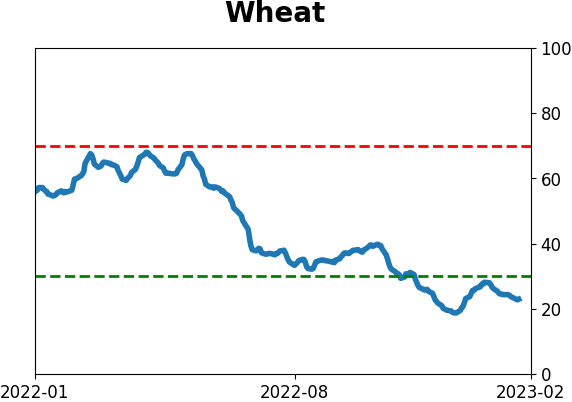
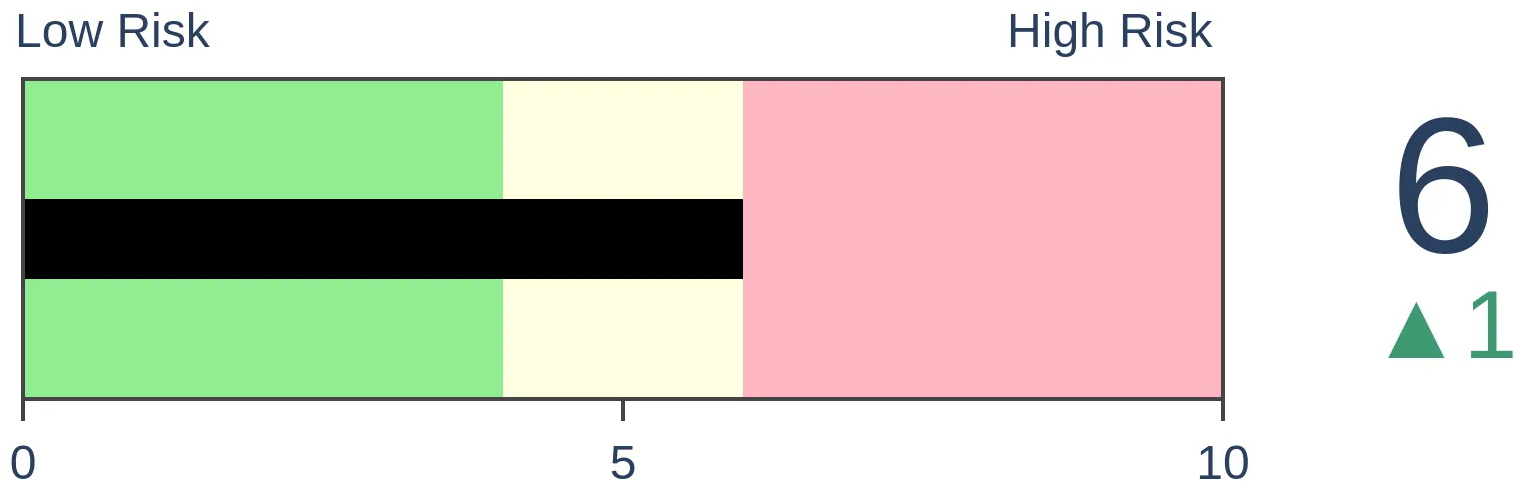
Agriculture

|
|
Research
By Jason Goepfert
BOTTOM LINE
In September and October of 2022, traders were pricing in heavy volatility across major assets like stocks, bonds, foreign currencies, and some commodities. Those fears have ebbed, and cross-asset implied volatility has declined to the lower end of its one-year range. Similar behavior typically led to modest rising prices across assets.
FORECAST / TIMEFRAME
None
|
Key points:
- Across major assets, implied volatility has declined to the bottom of its one-year range
- This is a significant change from last fall when cross-asset volatility was spiking
- Similar cycles from high to low implied volatility have typically meant modestly rising prices across assets
Volatility expectations across assets have eased
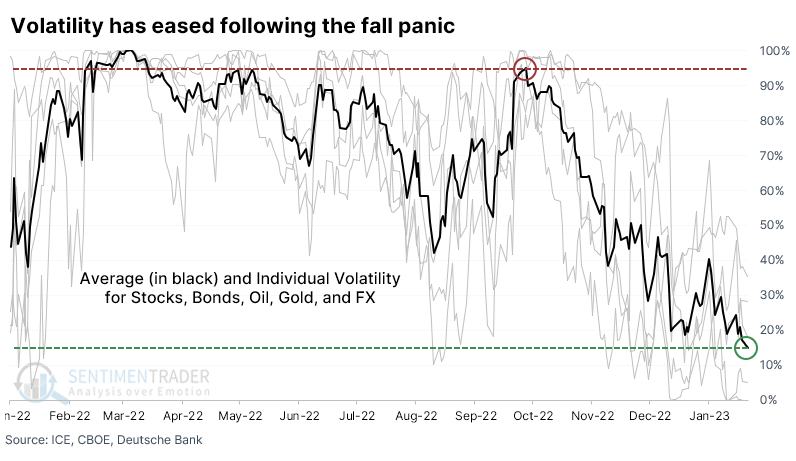
Last October, we saw that volatility was spiking everywhere. Panic spread from stocks to bonds to foreign currencies to commodities to even supposed safe havens.
Investors have since calmed down, and volatility across asset classes has dropped significantly. During late September and early October last year, traders were pricing in the highest implied volatility in a year across virtually almost every major asset class. Thanks to broad rallies in November and so far in January, the average implied volatility across assets has plunged to within 15% of its one-year low.
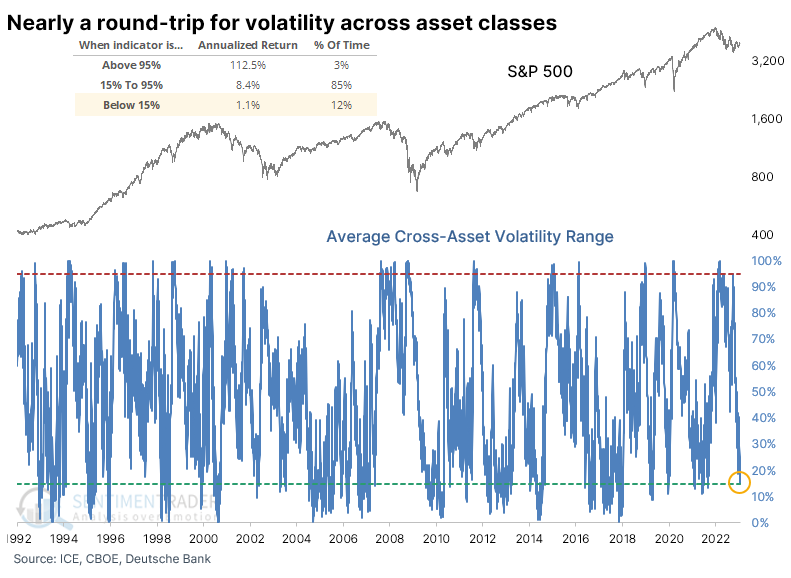
When implied volatility across assets is very high, the S&P 500's annualized return has been exceptionally high, in the triple digits. That's thanks to some powerful rallies in the initial stages from panic bottoms. At the other extreme, where we are now, the S&P's annualized return is only +1.1%. But that ignores consistency - during calm conditions, stocks tend to rise more often but show lower average returns.
Easing volatility typically leads to modest gains
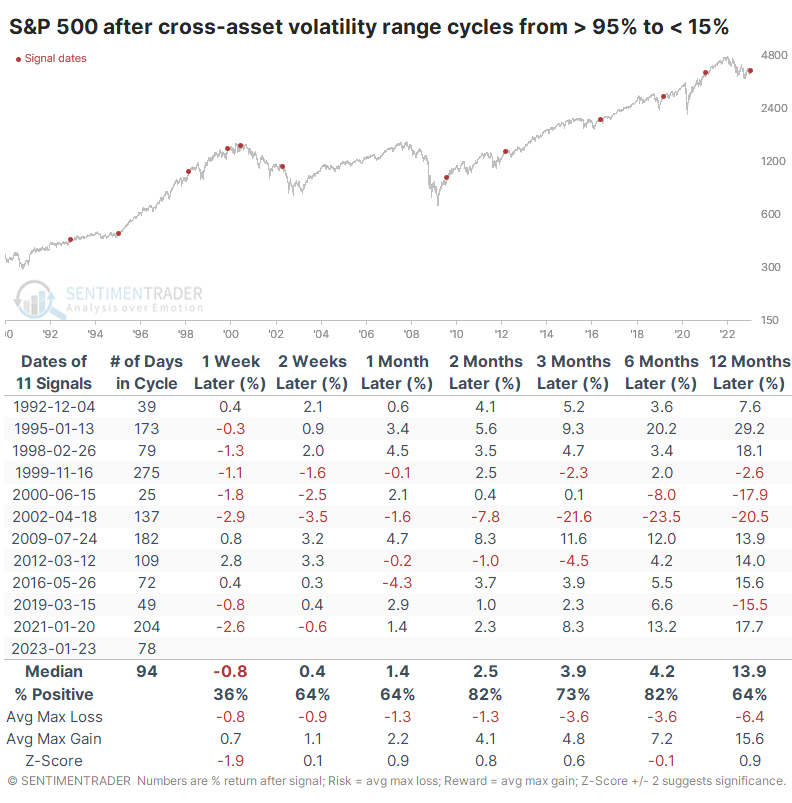
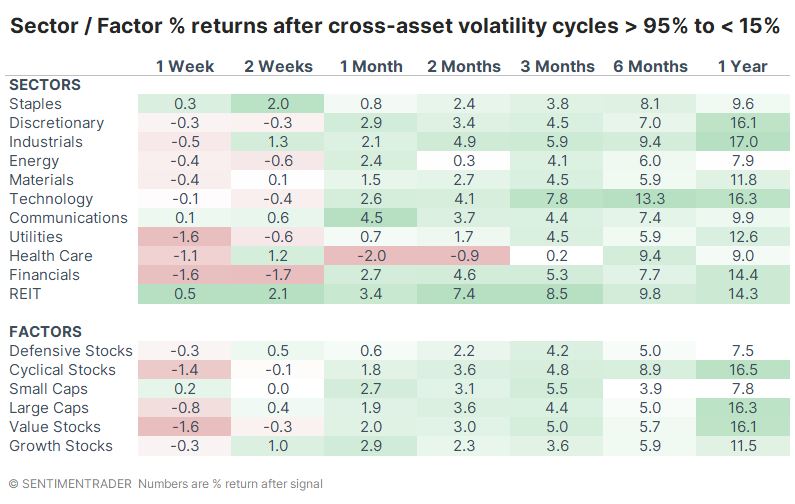
The table below shows every time since 1990 when average cross-asset implied volatility cycled from the top 5% of its range to the bottom 15%. It was a decent sign for medium-term returns, as investors welcomed the easing of their worst fears. It was a false dawn in 2002, as stocks still had another leg lower, but that was the only significant loss over the next two months.
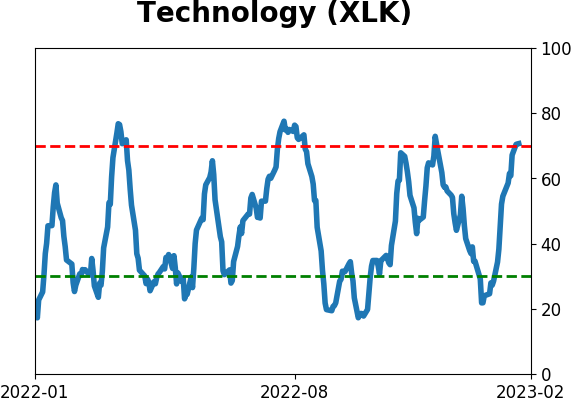
Cyclical sectors, especially Technology, Industrials, and Financials, enjoyed some of the largest average returns following these signals. There was a modest bias toward Large-Caps and Value stocks, as well.
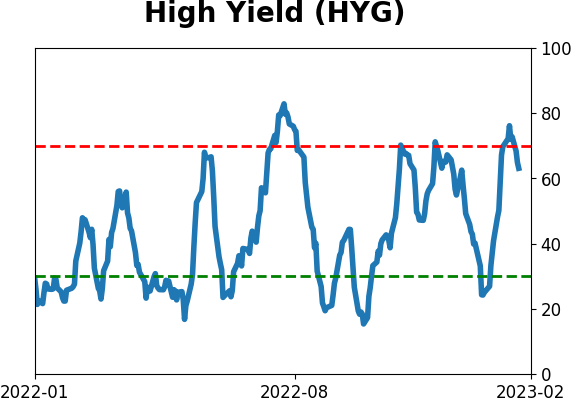
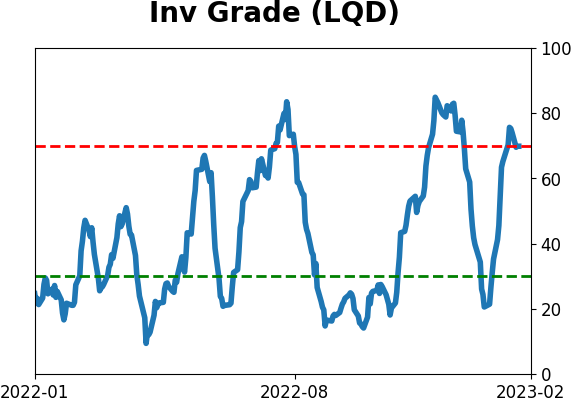
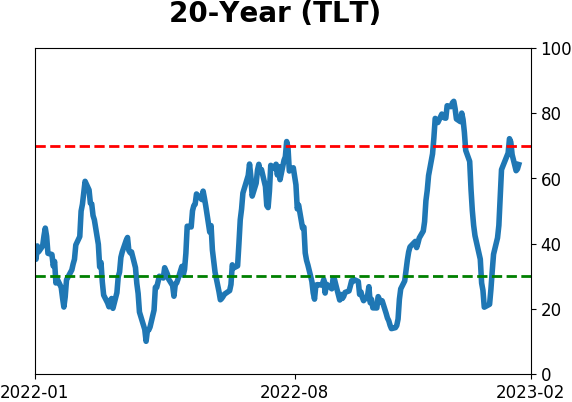
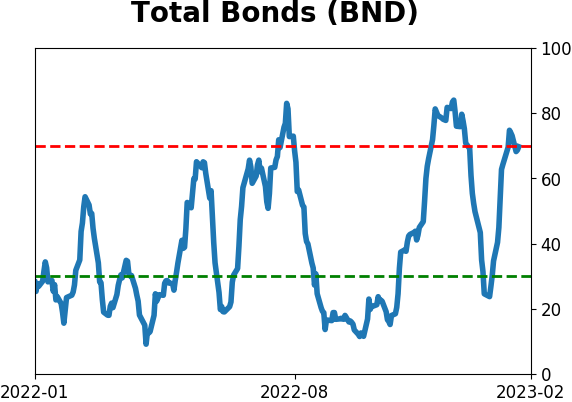
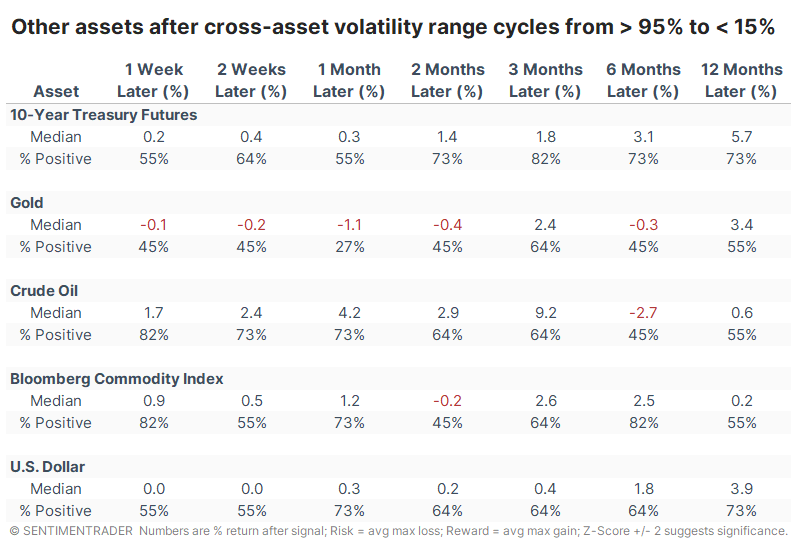
For other assets, these cycles tended to be good for the next few months in Treasury bond prices, in particular. While gold showed the least consistently positive returns, they all showed a decent ability to rebound over the next three months.
What the research tells us...
It's always challenging to purchase financial assets when they are falling in value almost daily. It almost always coincides with heavy volatility and uncertainty, investors' worst enemies. And while those types of conditions can occur right before heavy losses, it's much more common to see those fears unrealized and assets rally.
Last fall, analysts complained that, despite everything, the standard "fear gauge," the VIX, didn't rise high enough. Then they complained that it declined too far, too fast. Regardless, stocks and other assets have rallied, anyway, and traders are pricing in much less volatility going forward. That's not always a good sign for high returns, but it does typically signal that the worst is behind us, and while stocks (and other assets) may not rise as much or as quickly, they tend to rise more consistently.
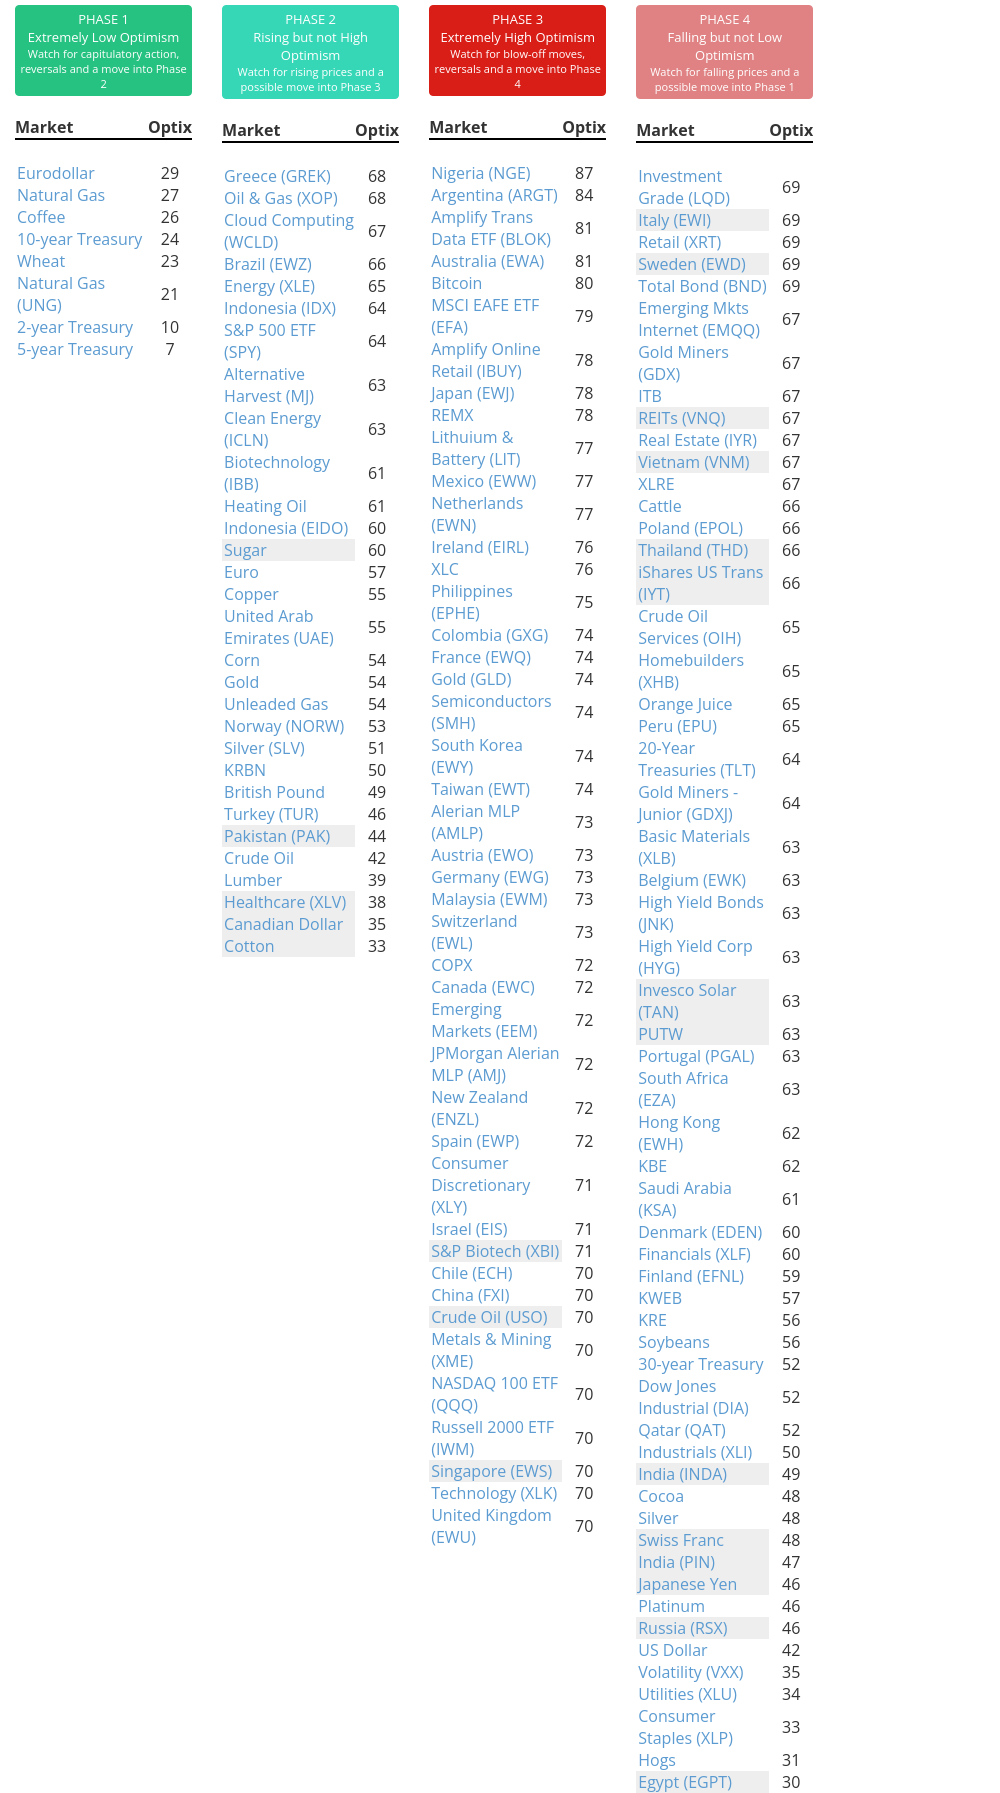
Indicators at Extremes
Phase Table
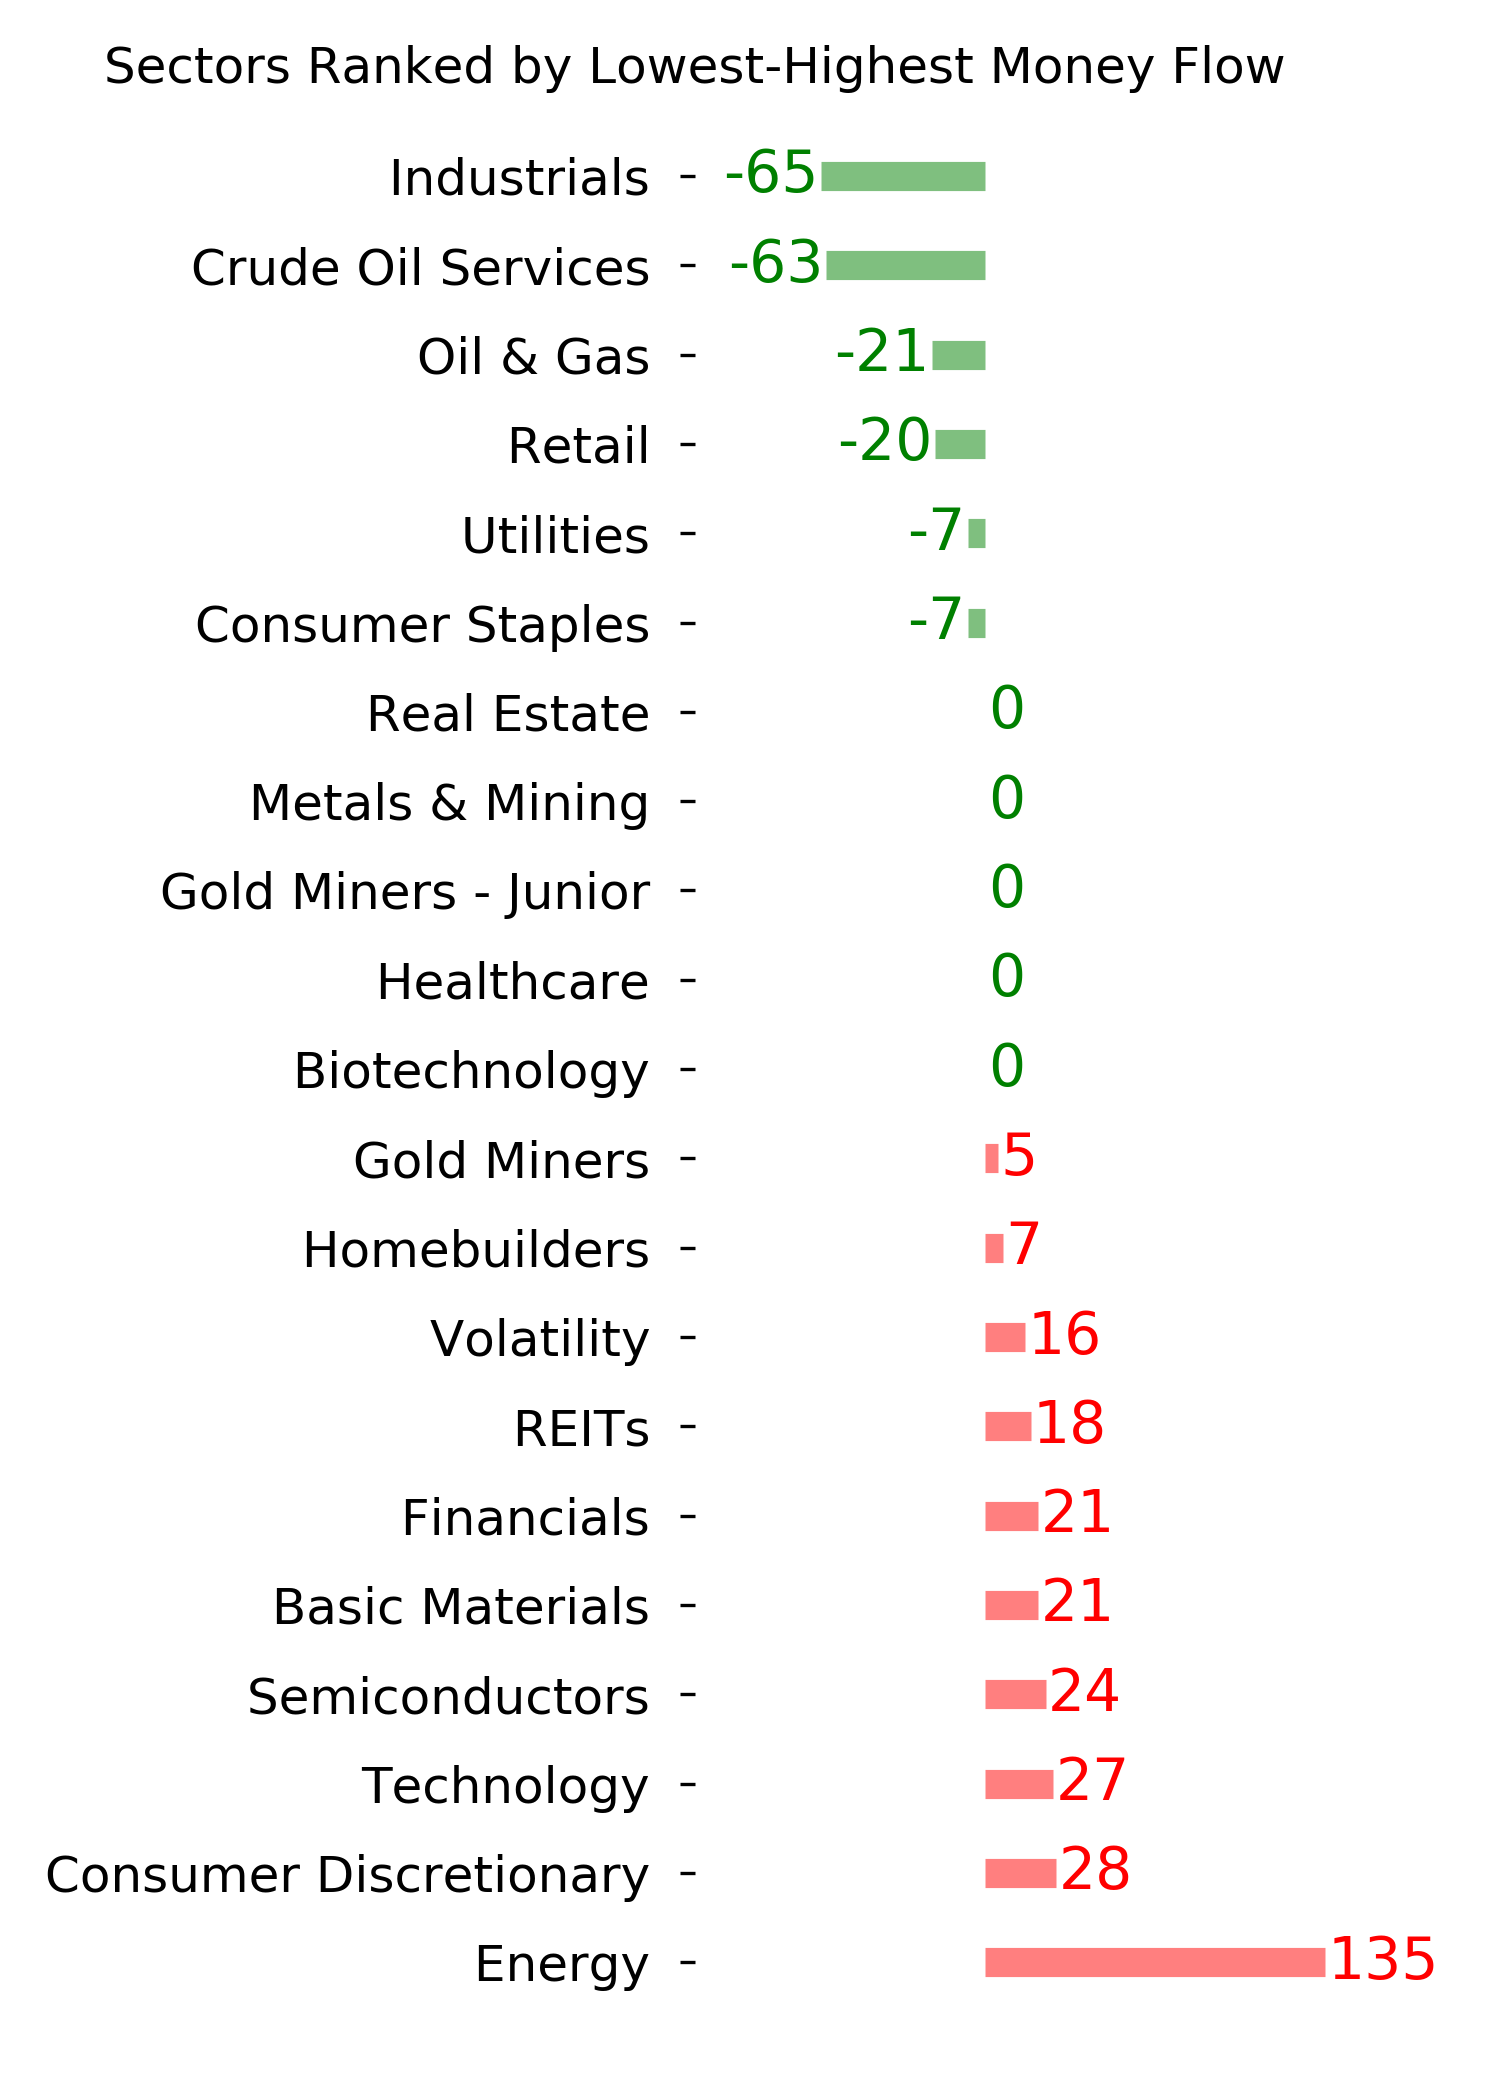
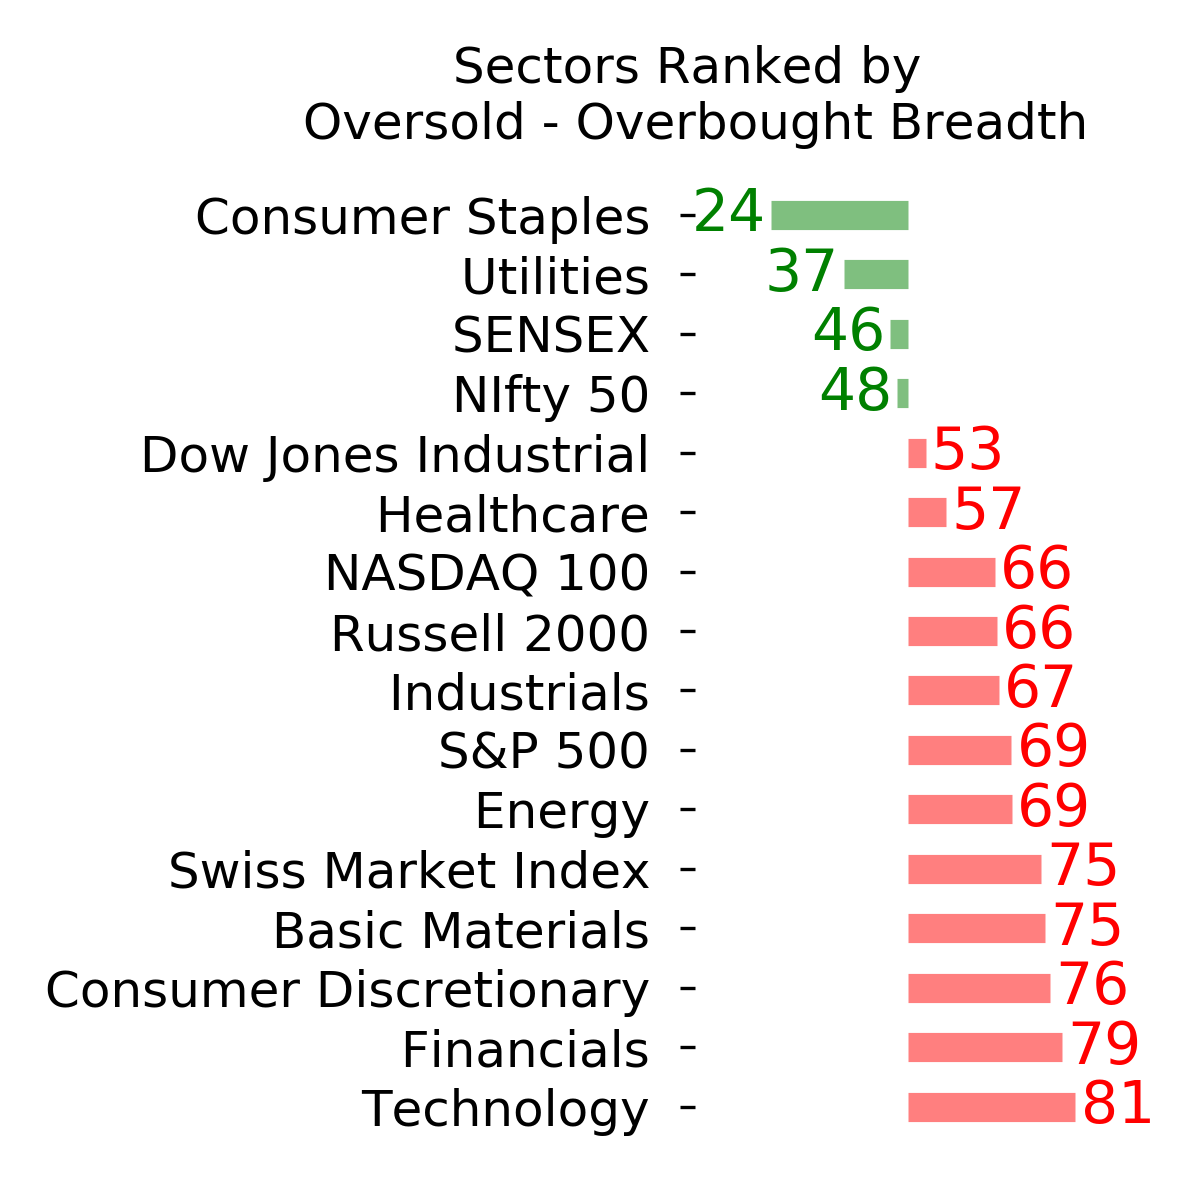
Ranks
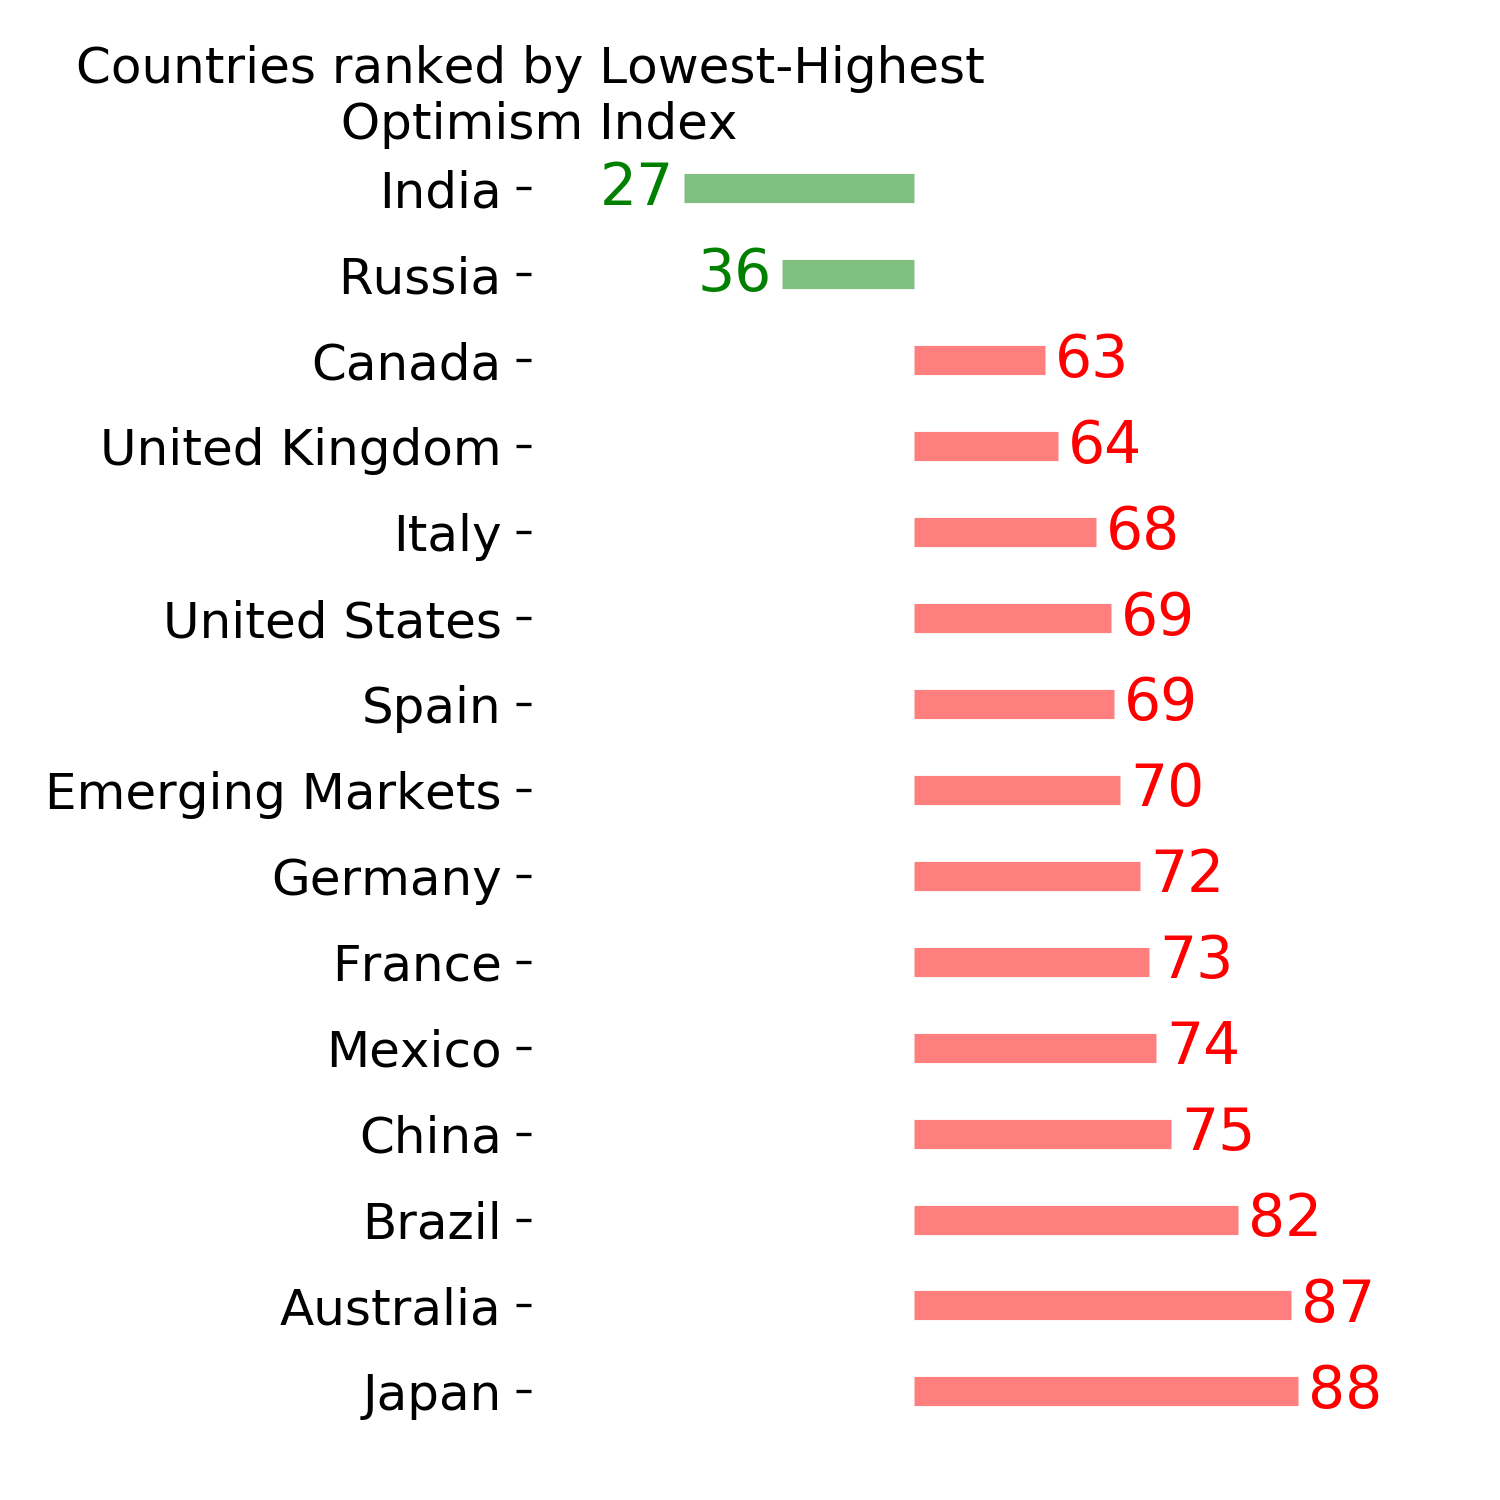
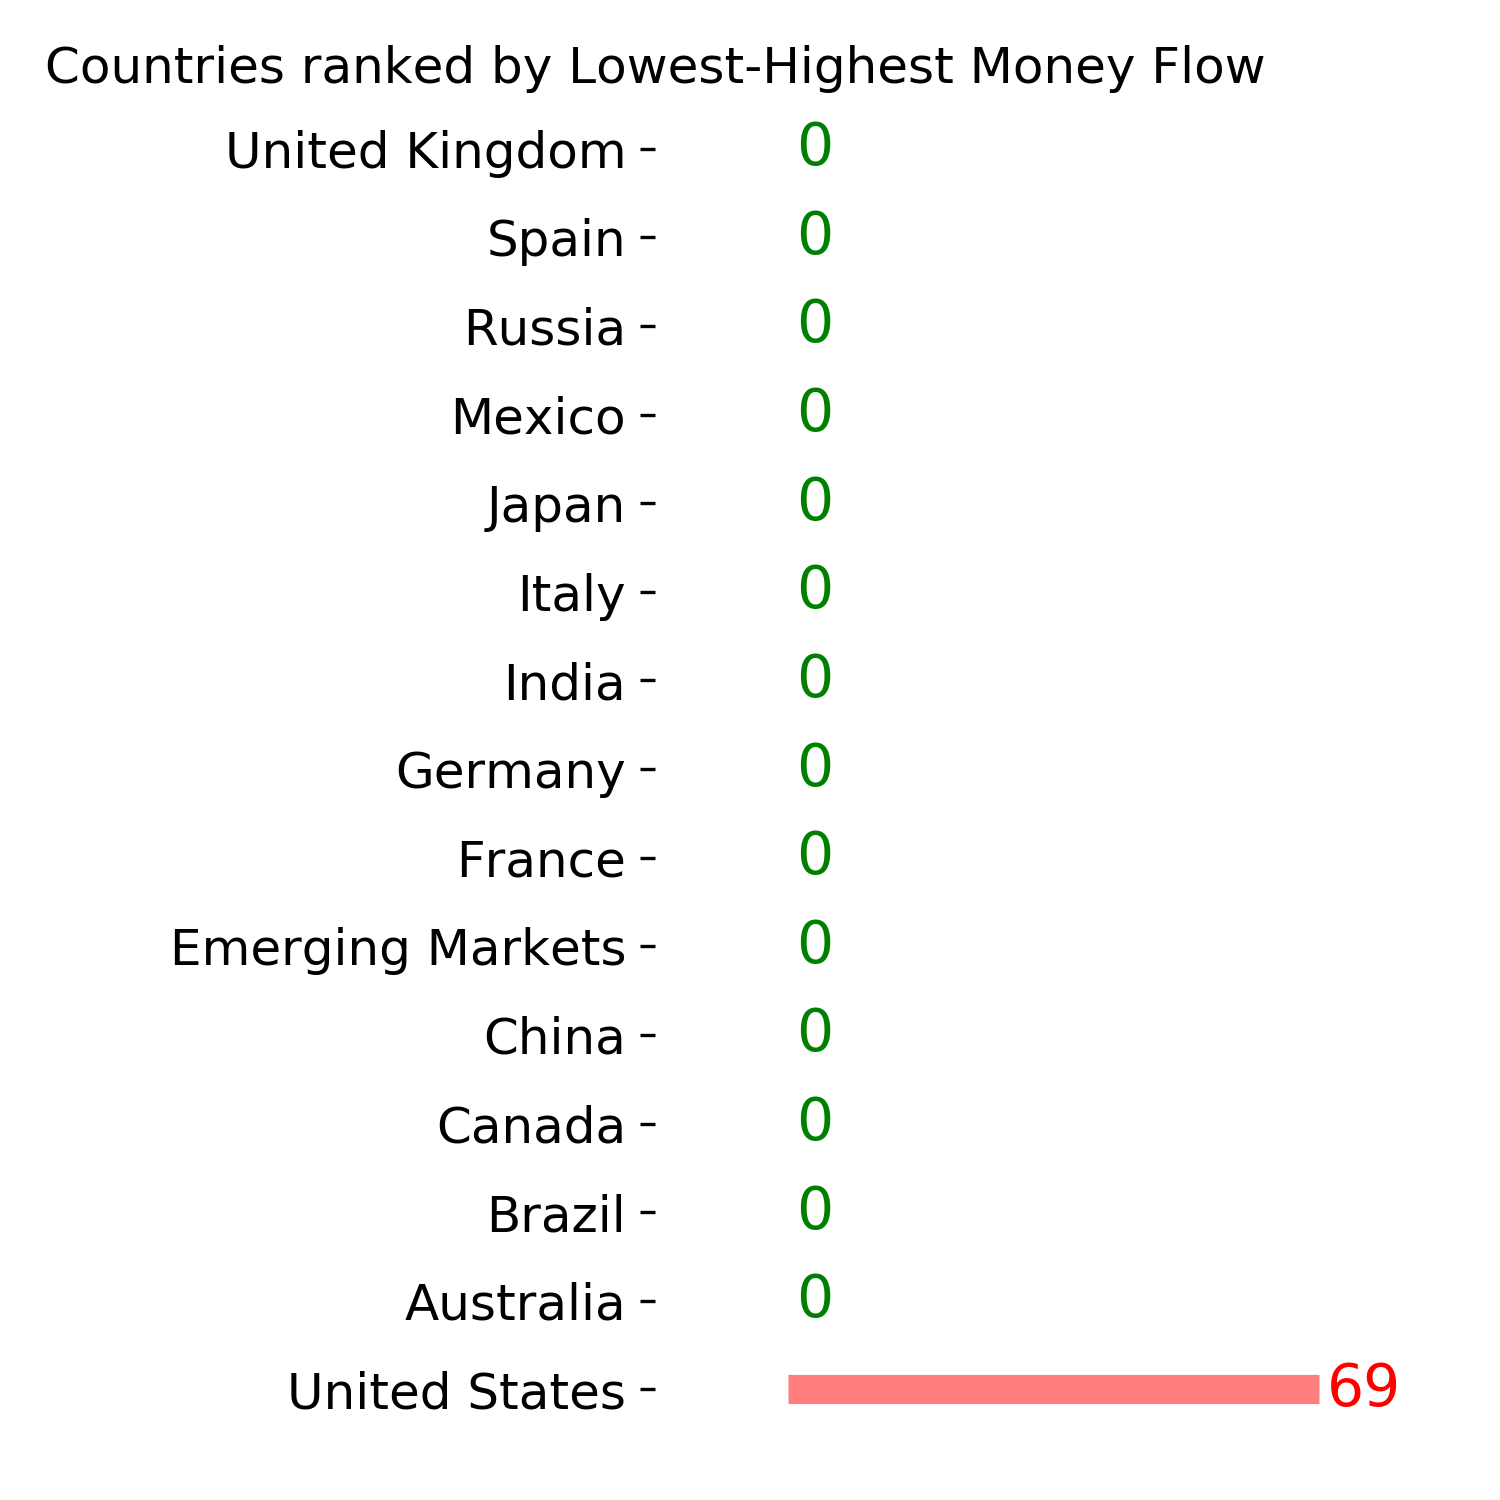
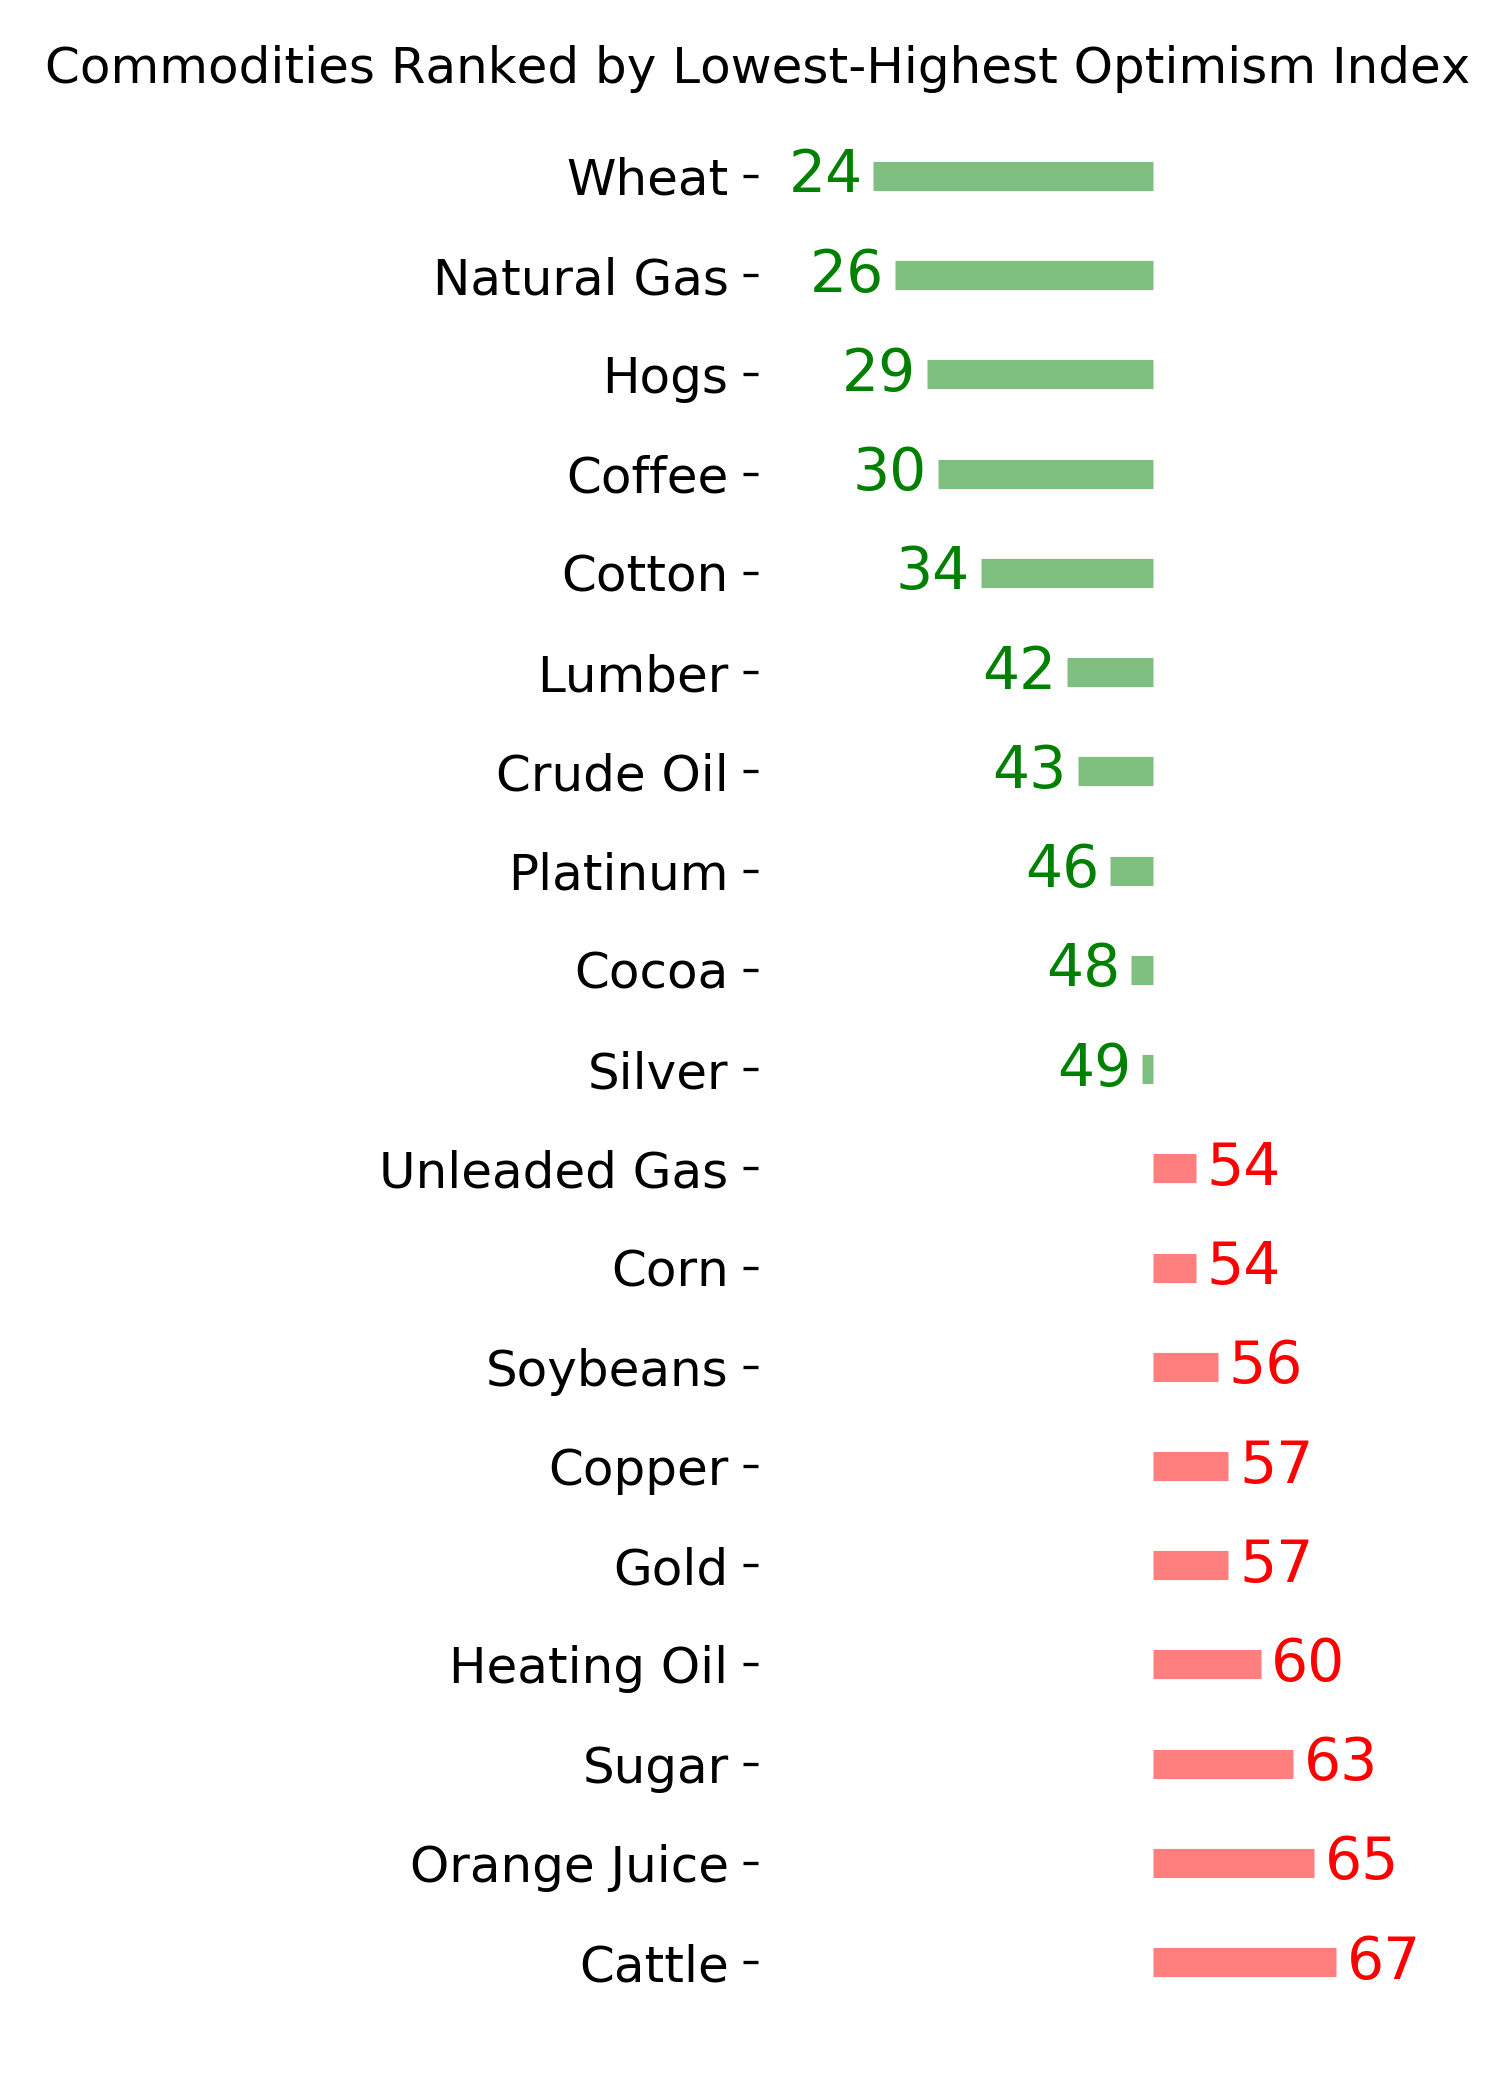
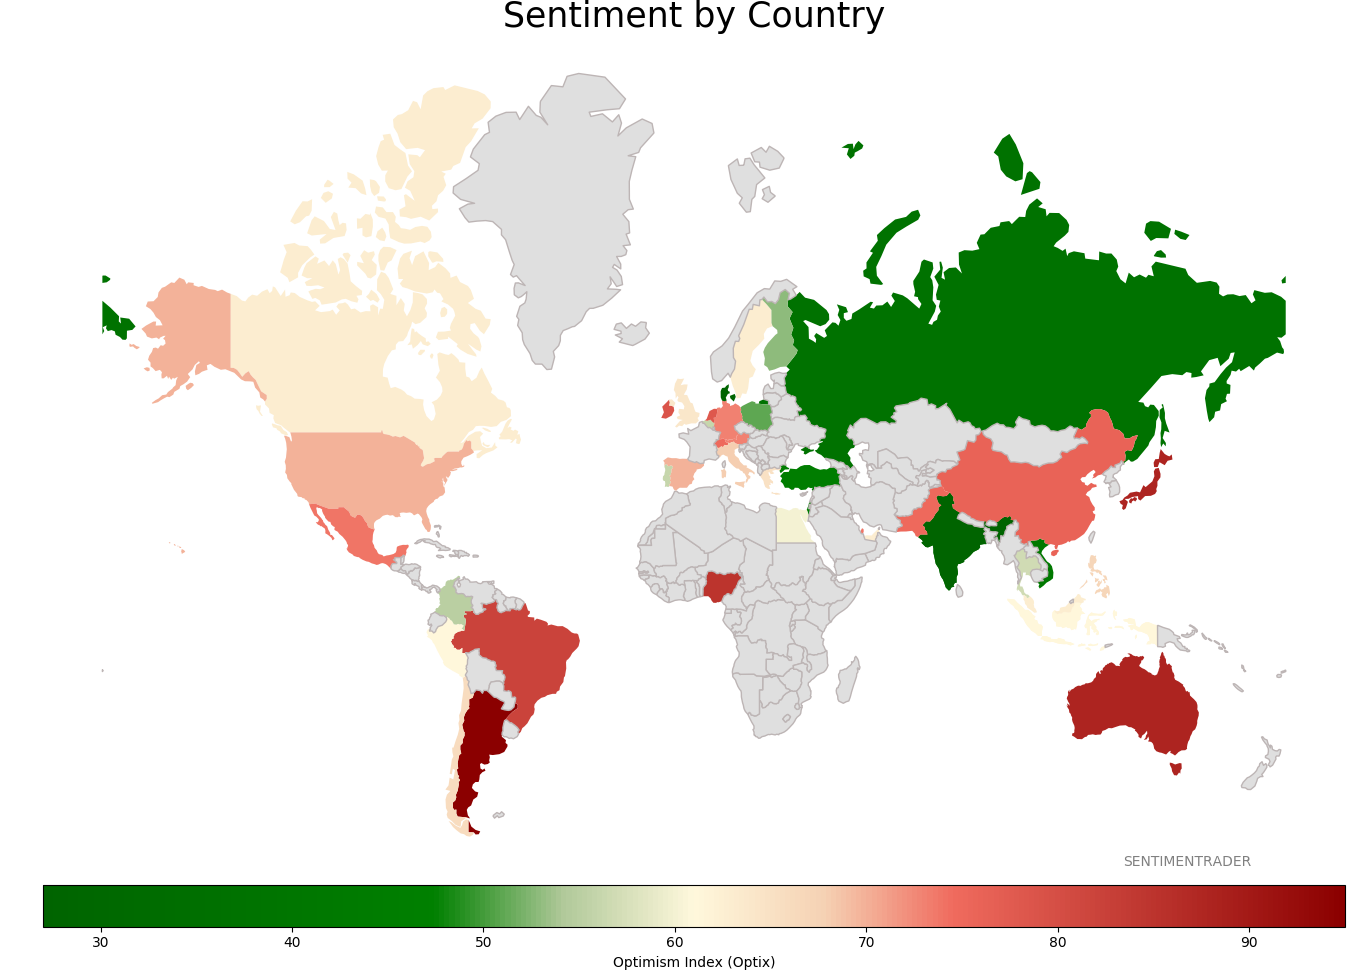
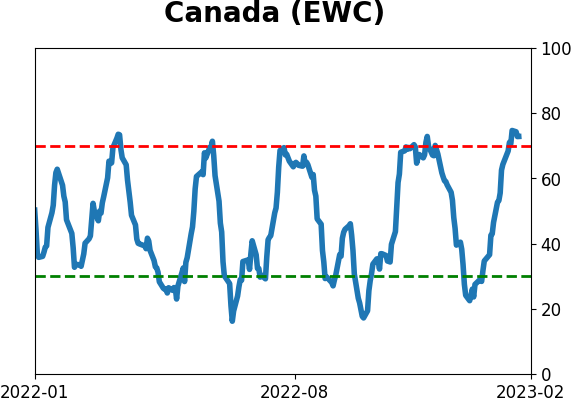
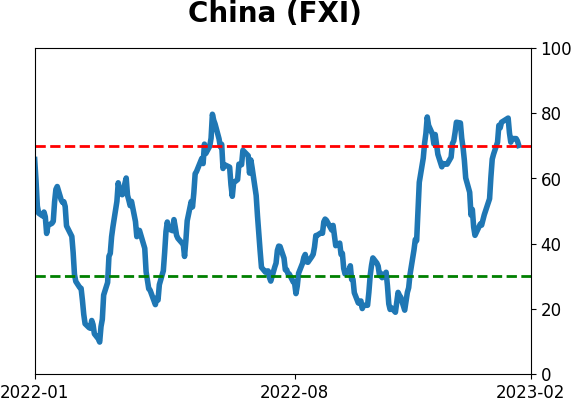
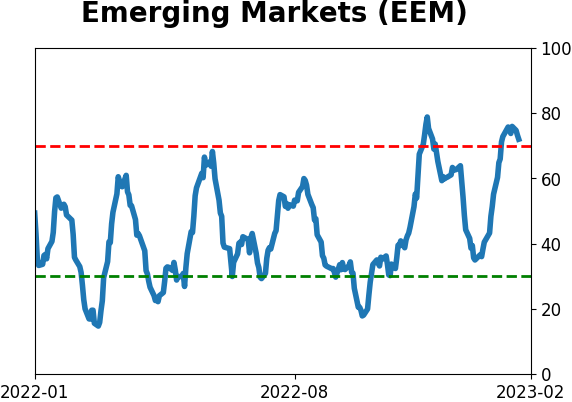
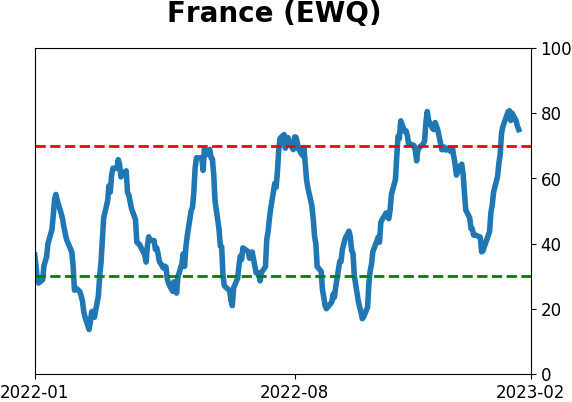
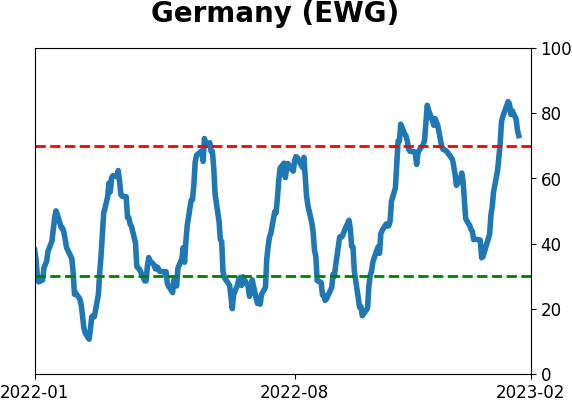
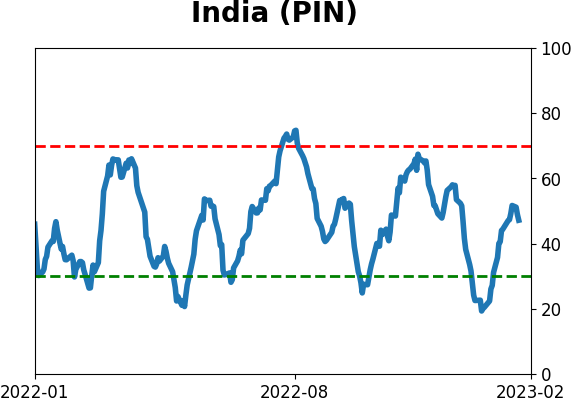
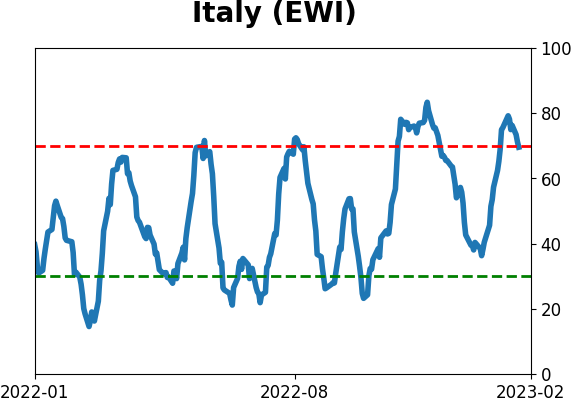
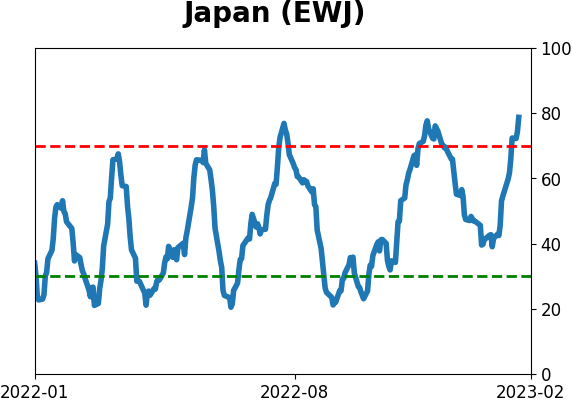
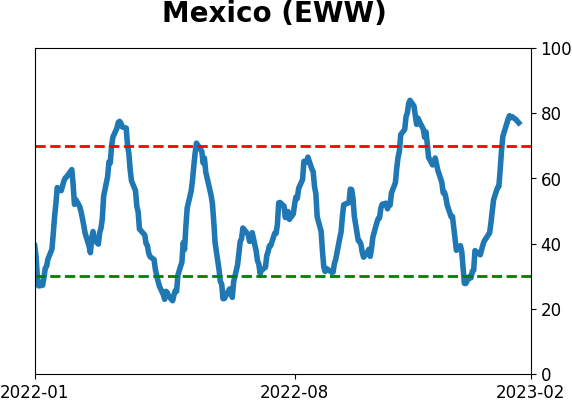
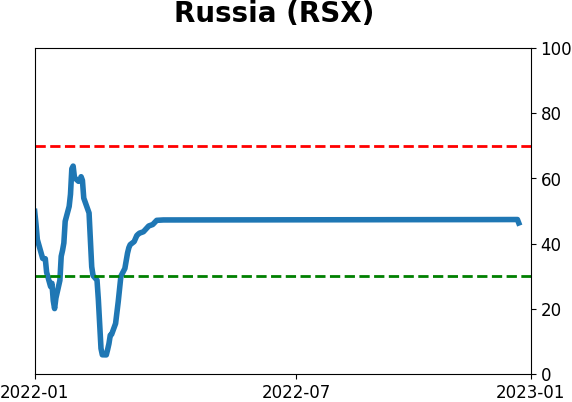
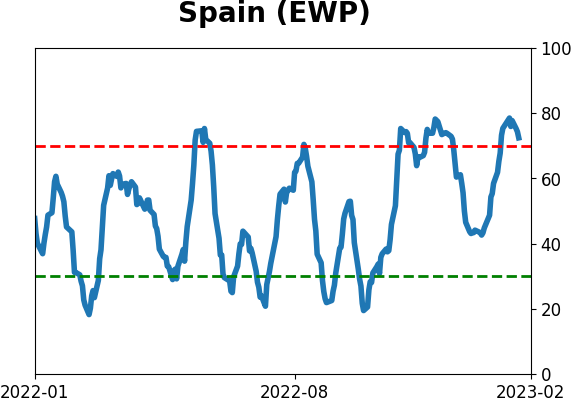
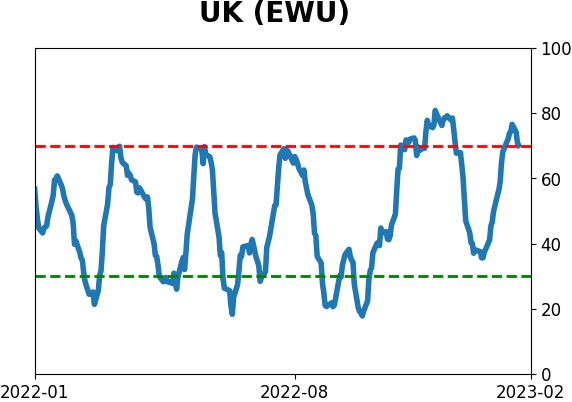
Sentiment Around The World
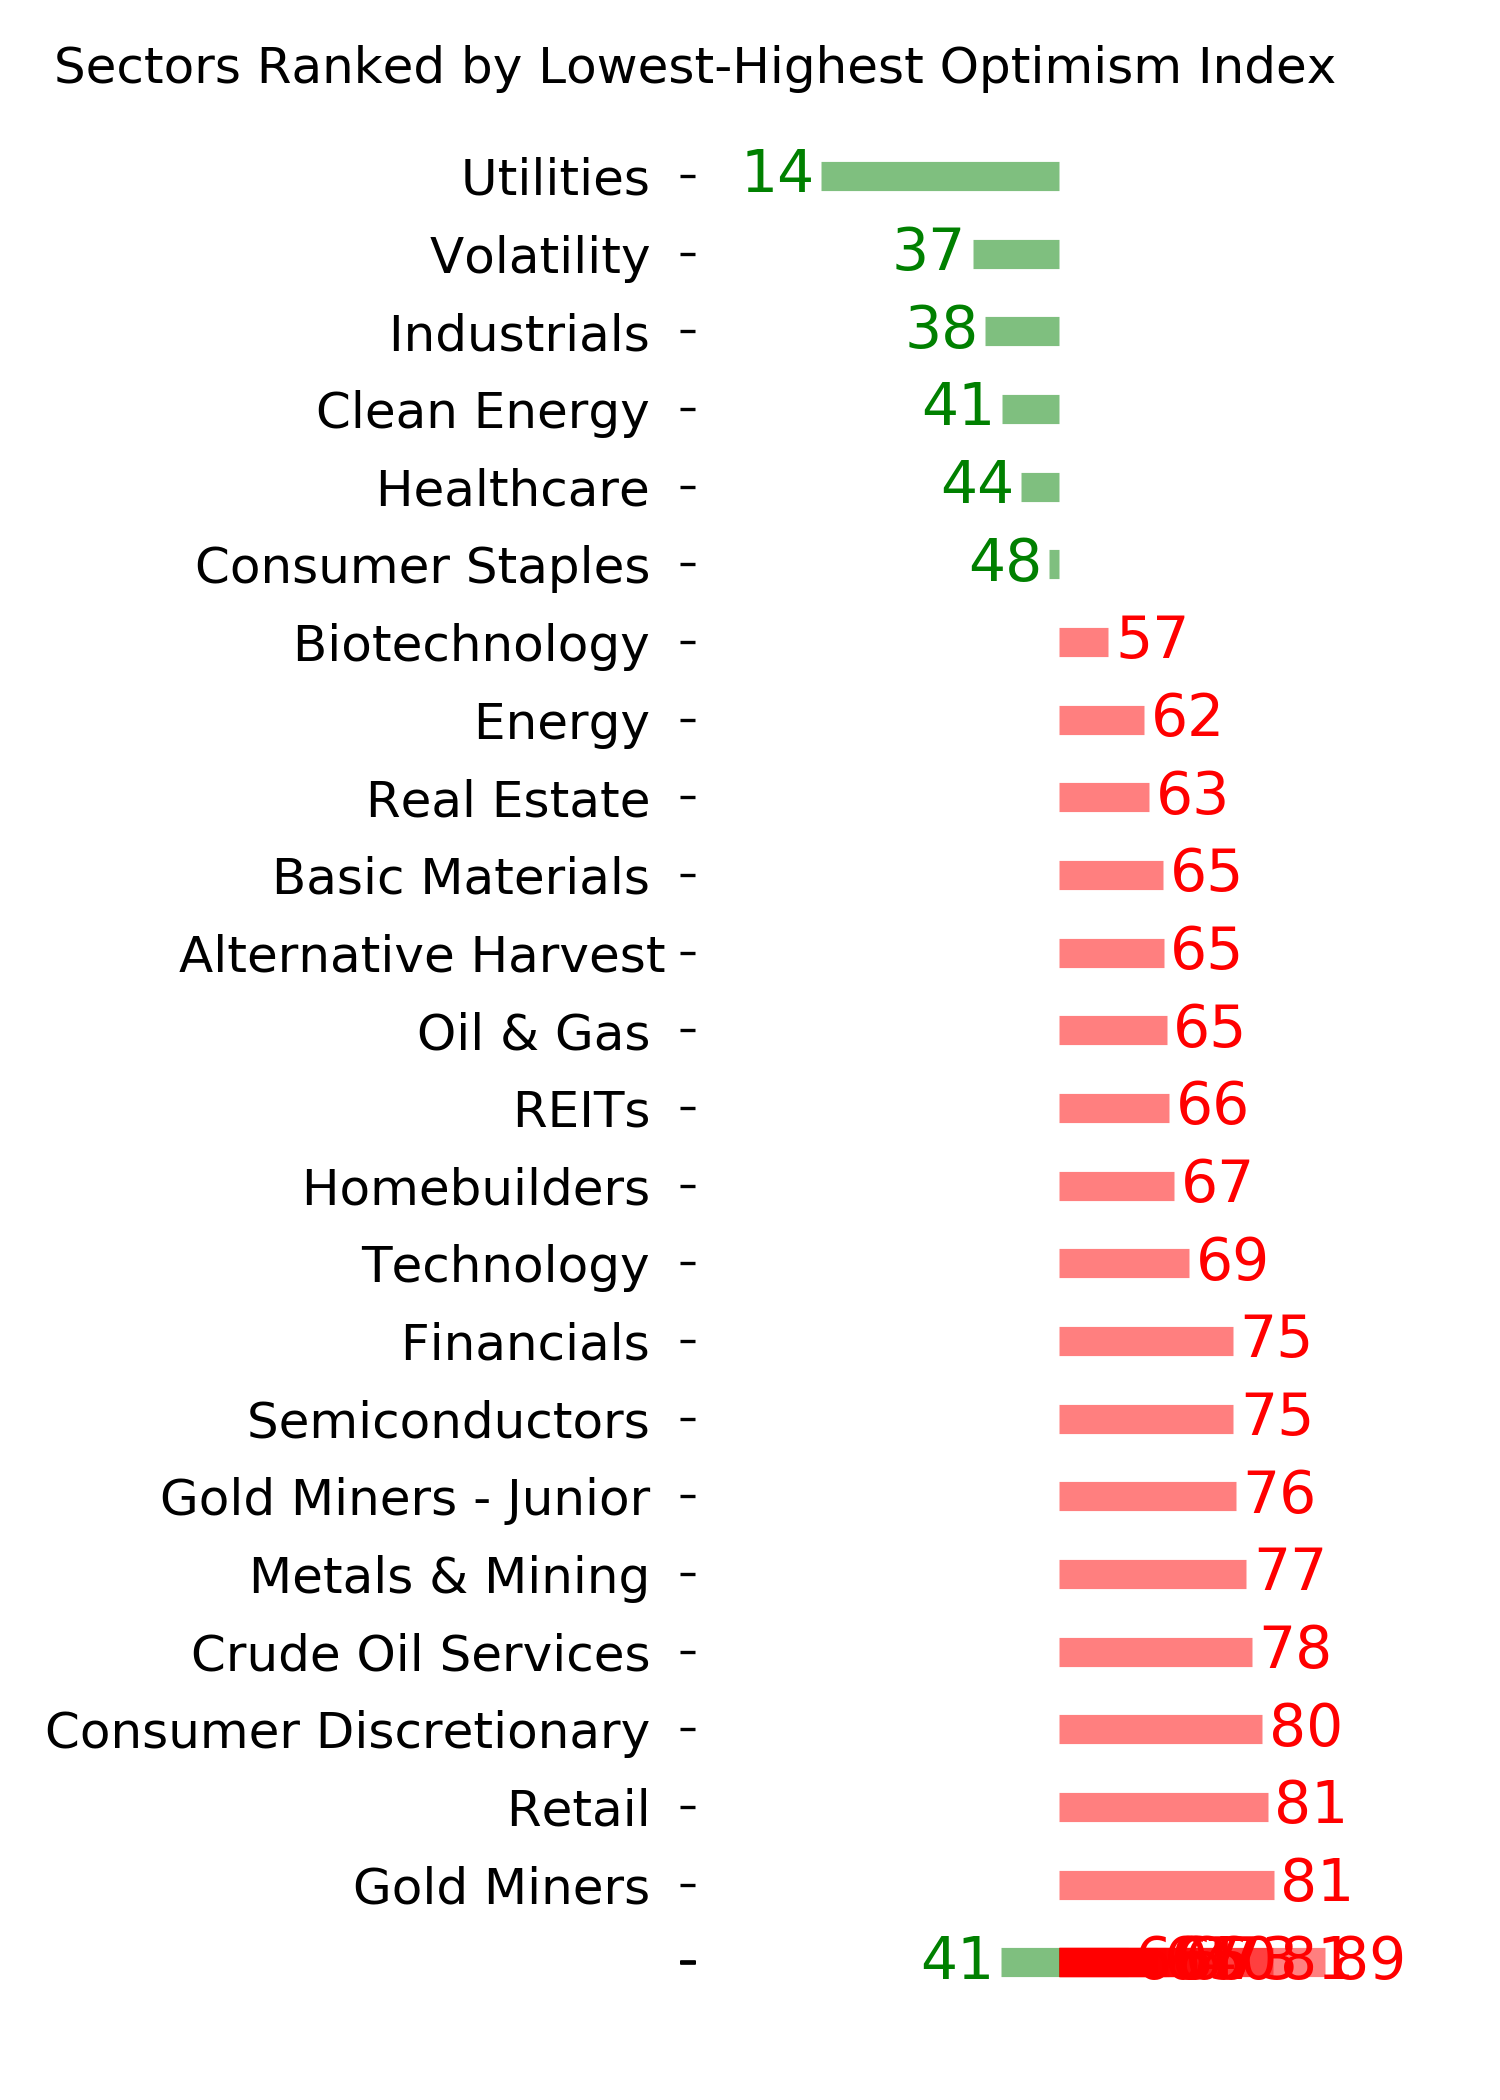
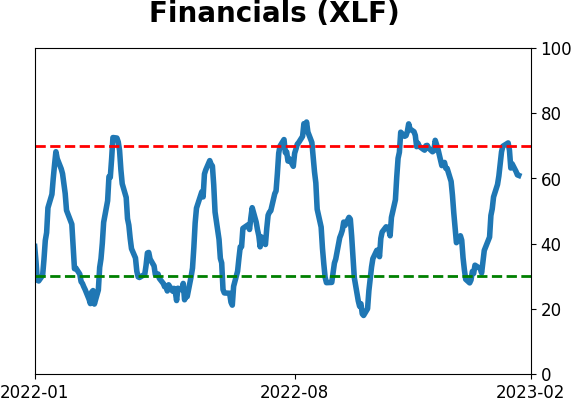
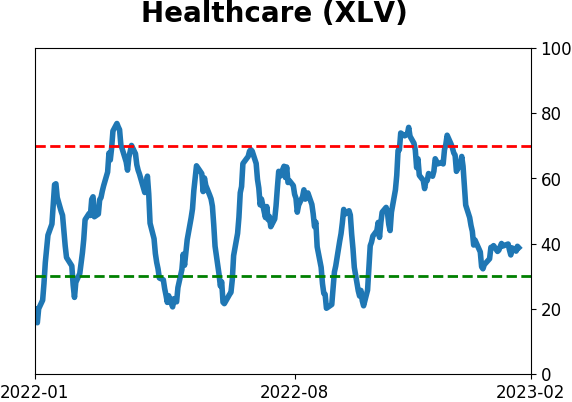
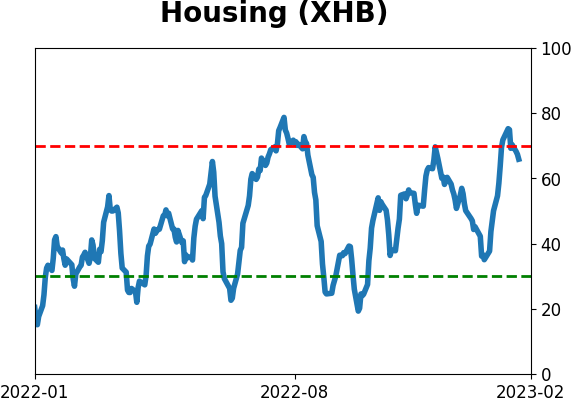
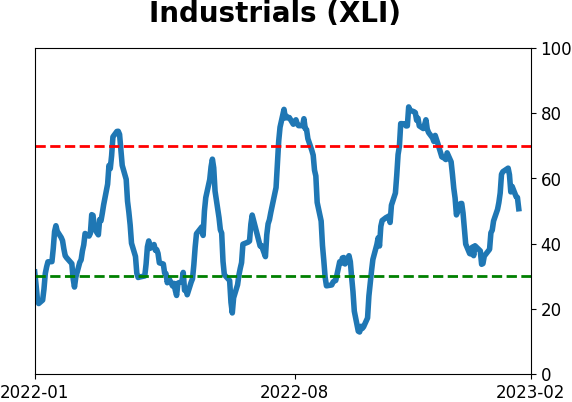
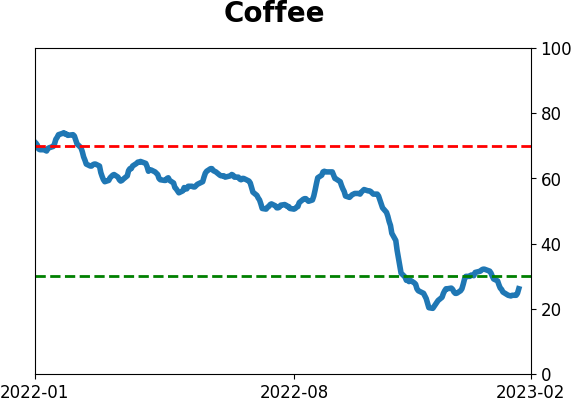
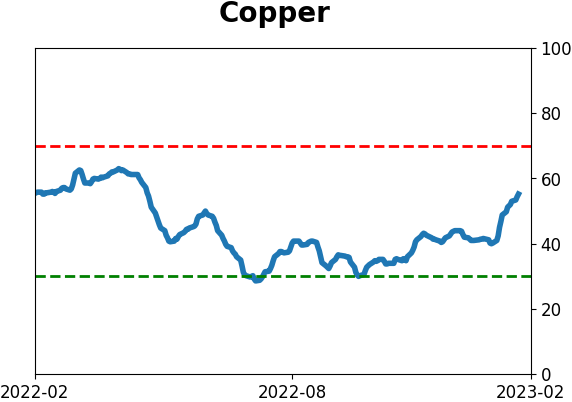
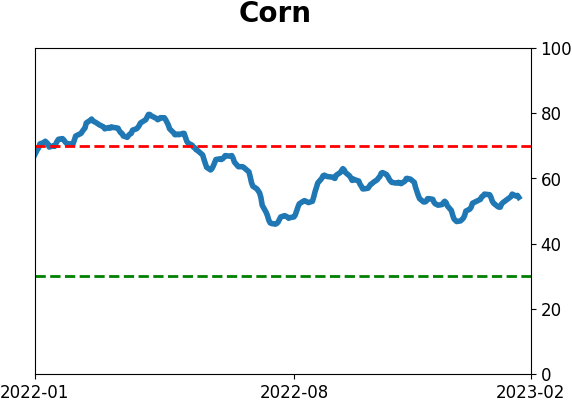
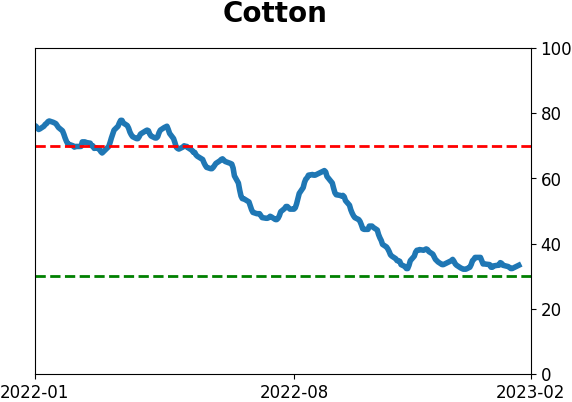
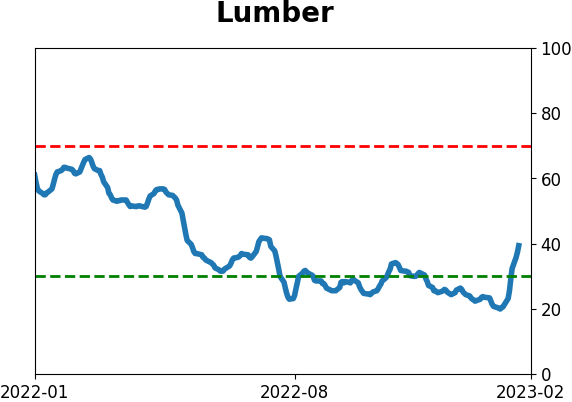
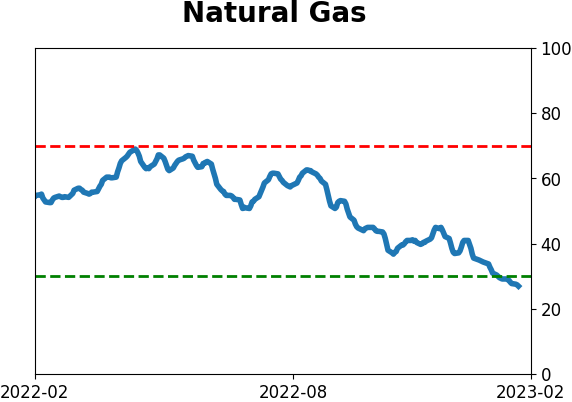
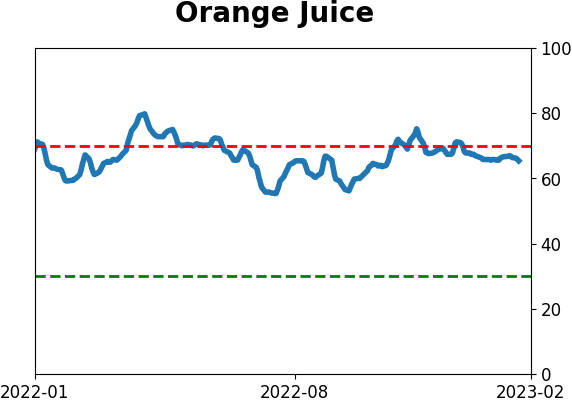
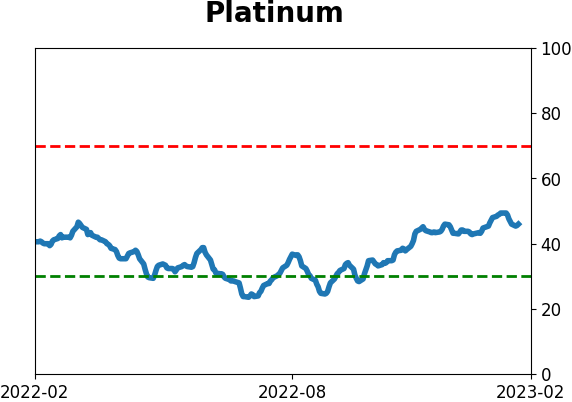
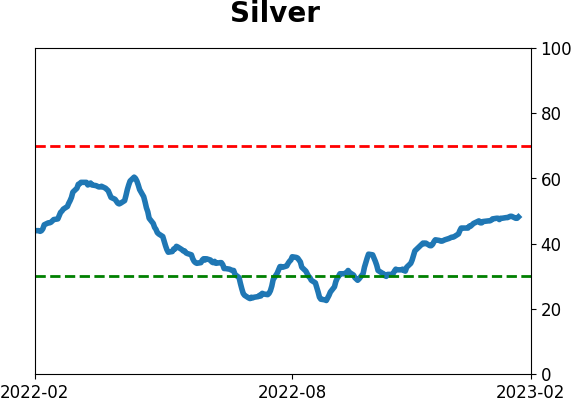
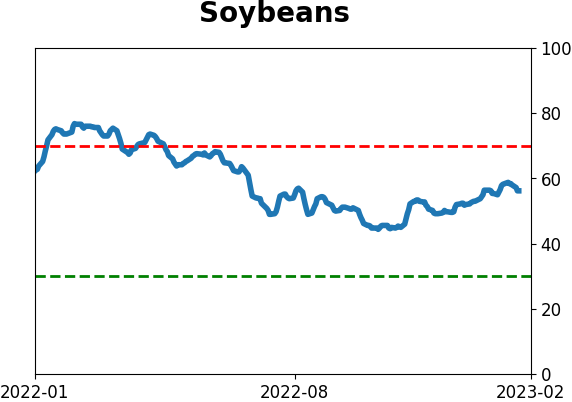
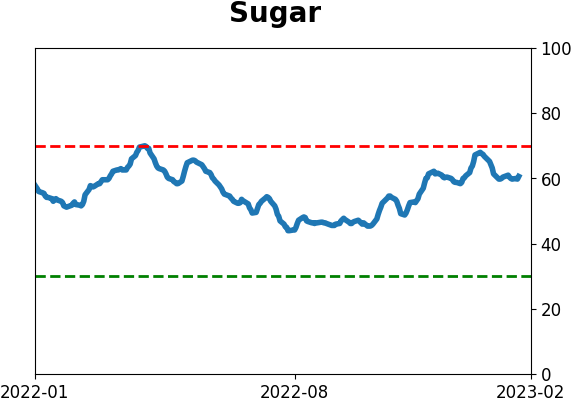
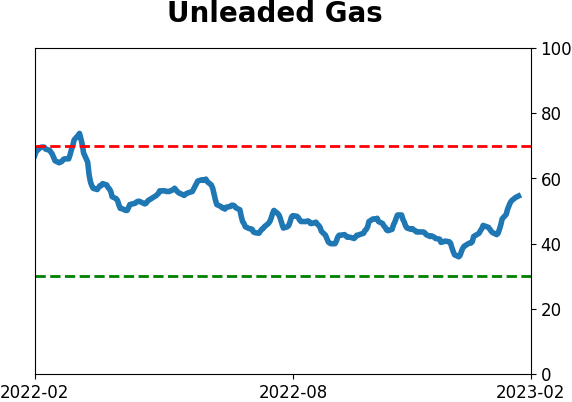
Optimism Index Thumbnails
|
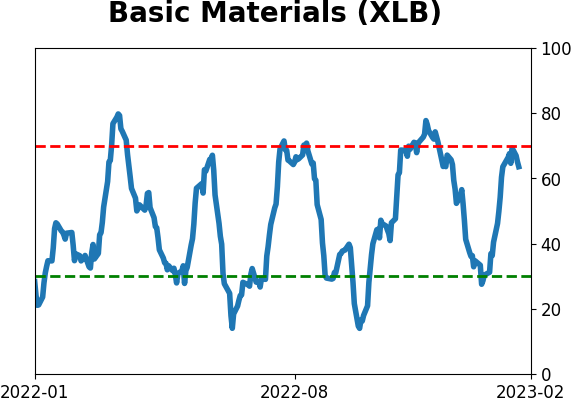
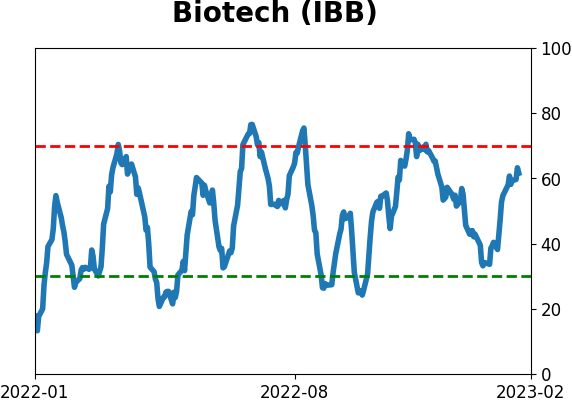
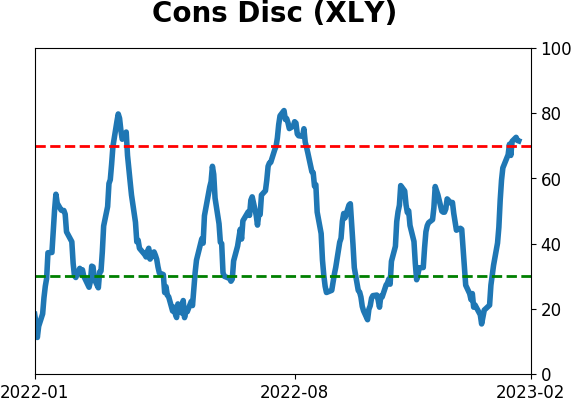
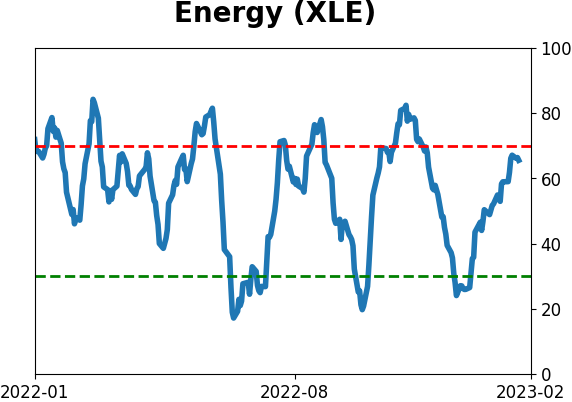
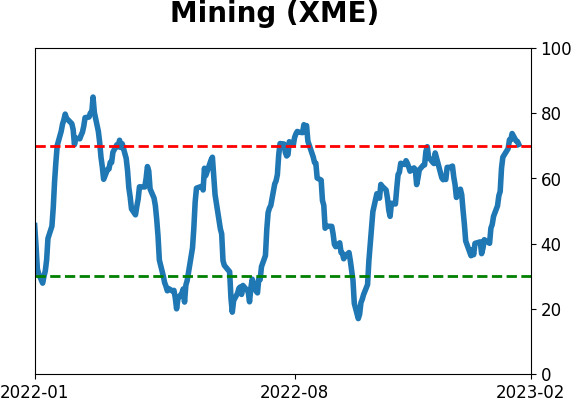
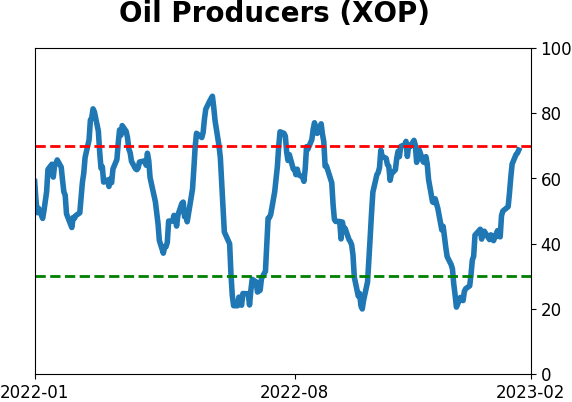
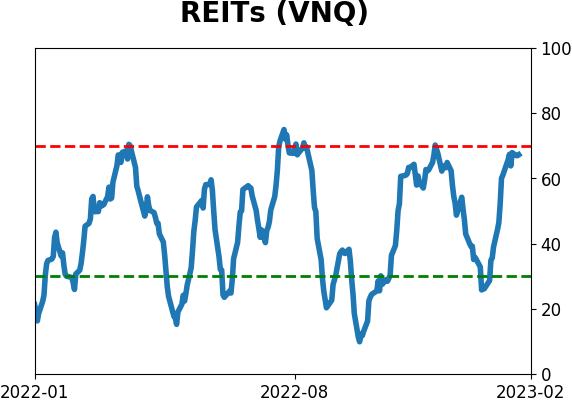
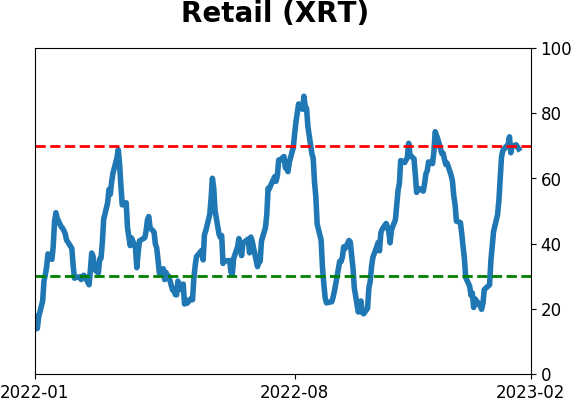
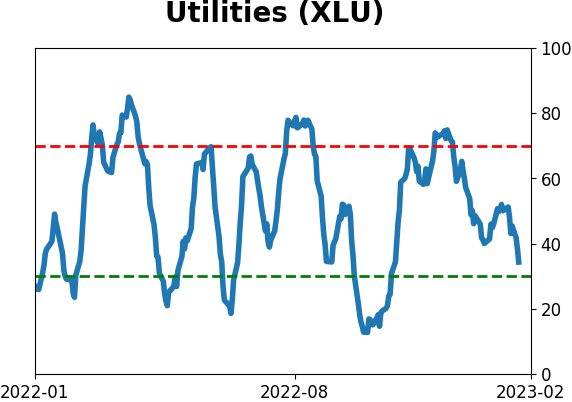
Sector ETF's - 10-Day Moving Average
|
|
|
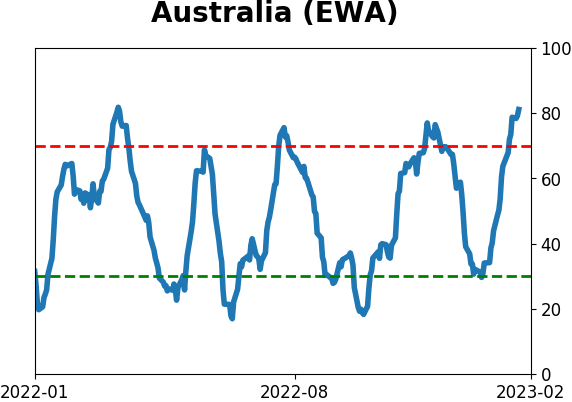
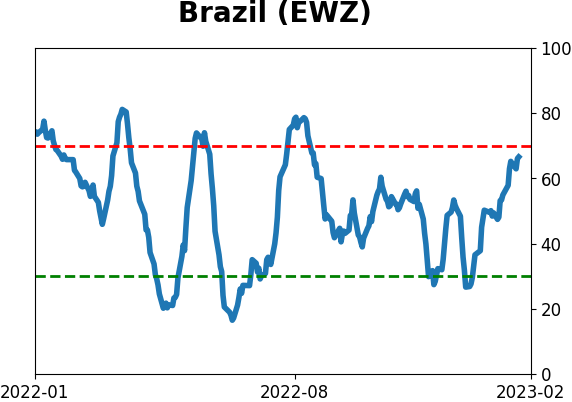
Country ETF's - 10-Day Moving Average
|
|
|
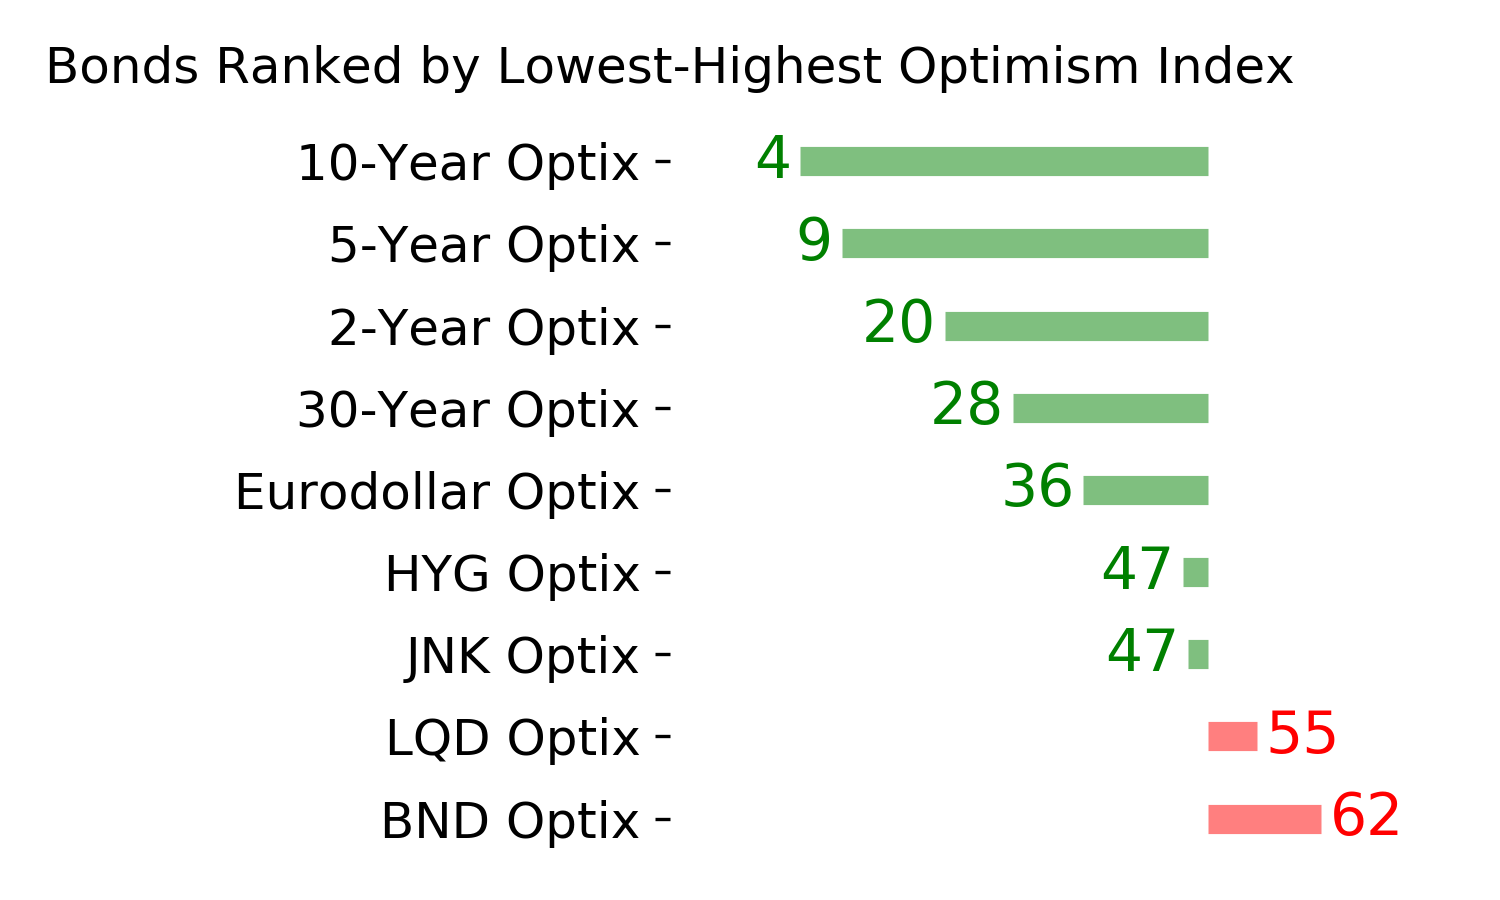
Bond ETF's - 10-Day Moving Average
|
|
|
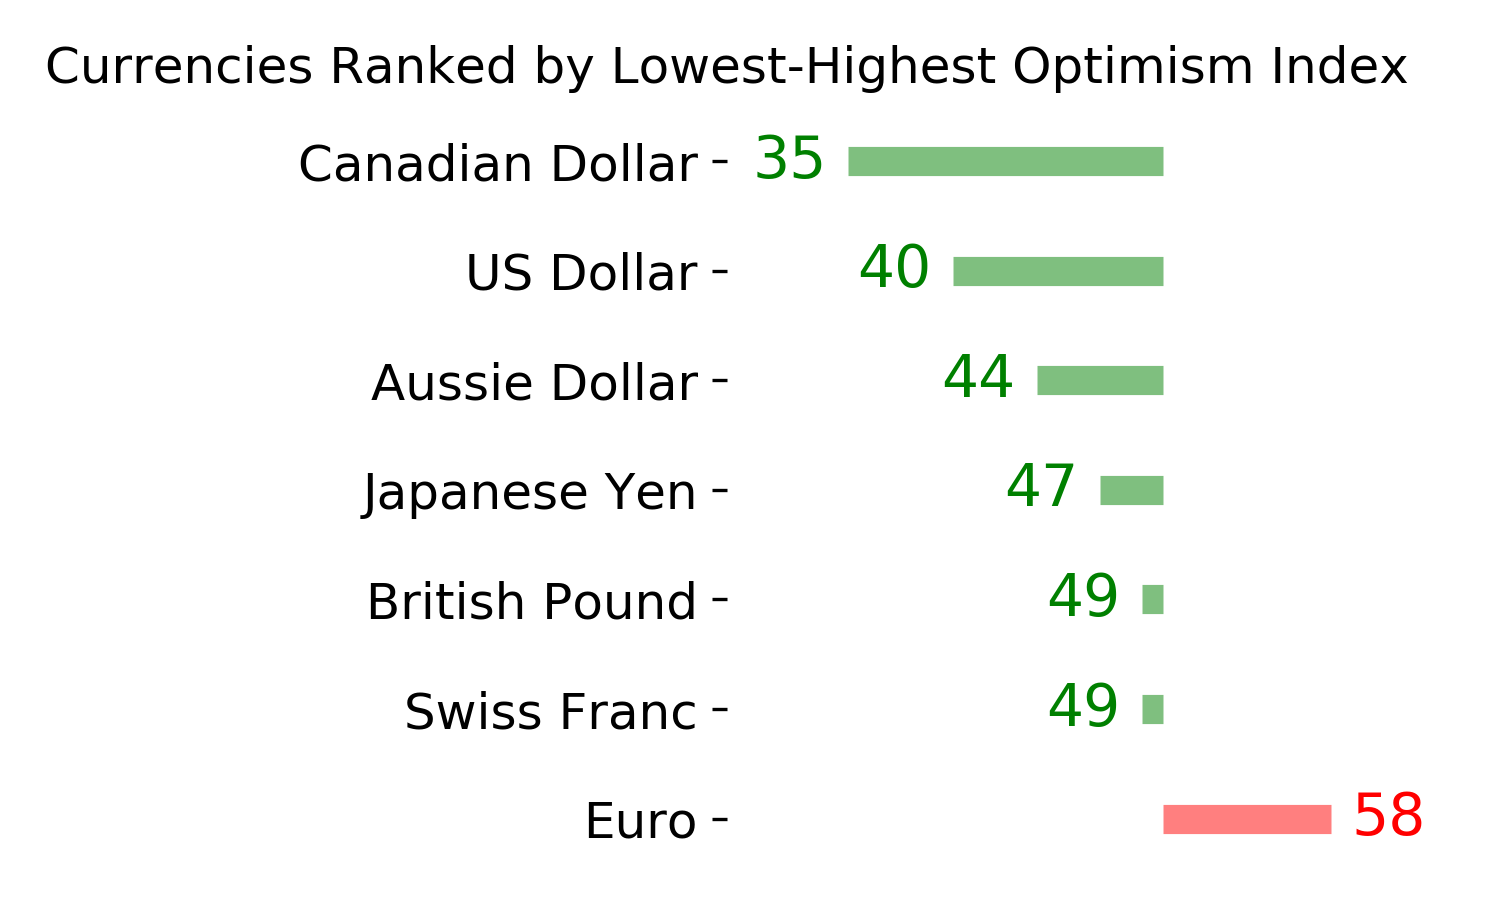
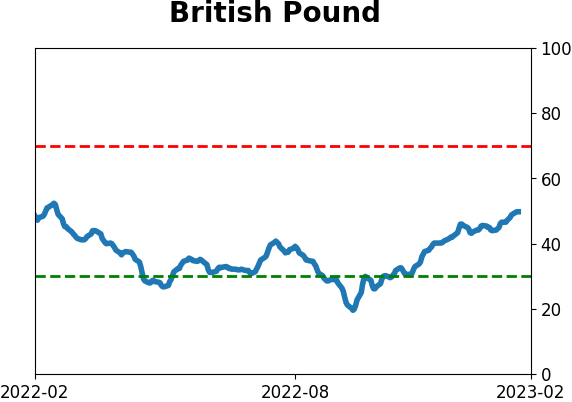
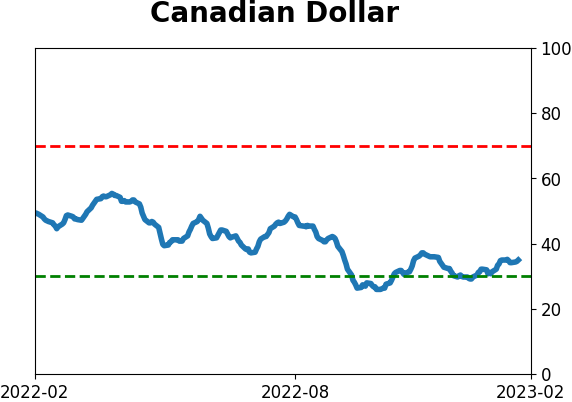
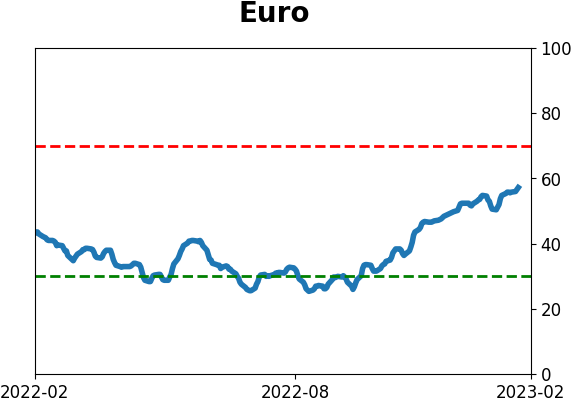
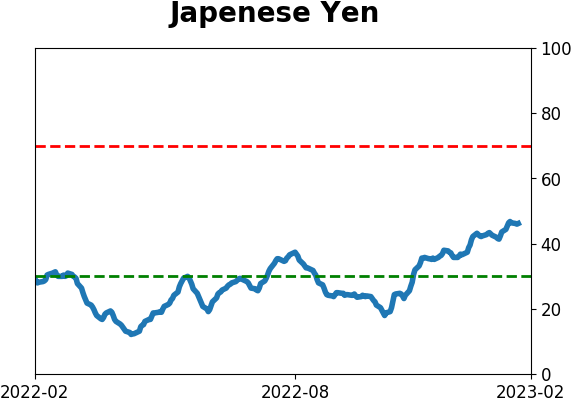
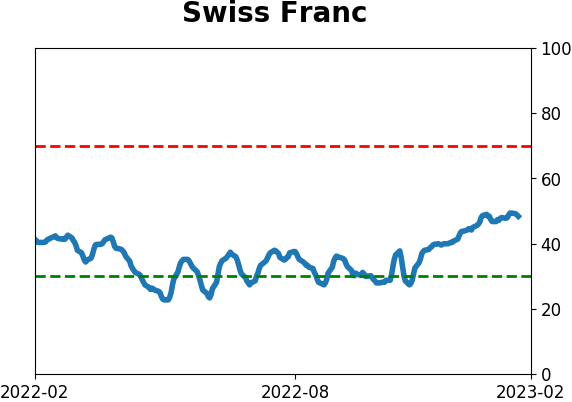
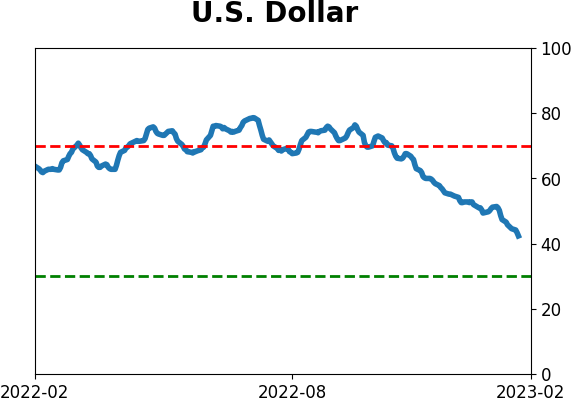
Currency ETF's - 5-Day Moving Average
|
|
|
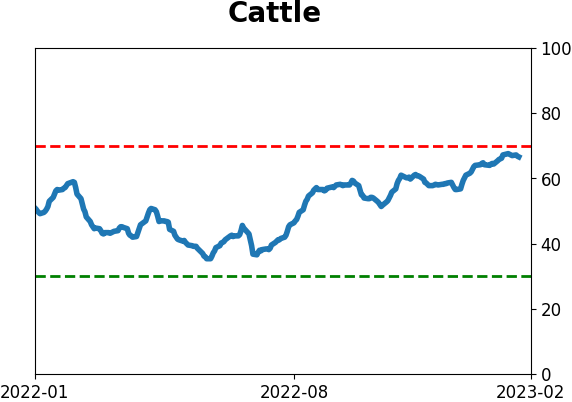
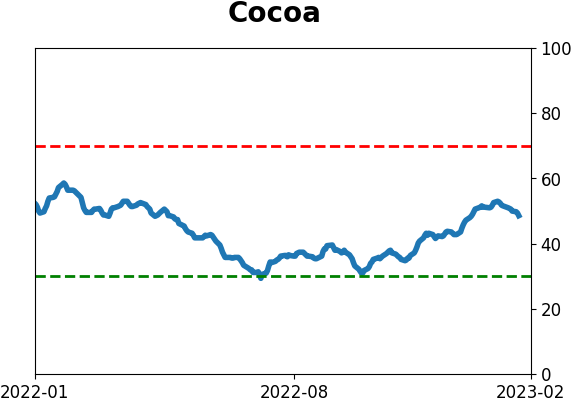
Commodity ETF's - 5-Day Moving Average
|
|