Headlines
|
|
High yield bonds continue to track other major recoveries:
A month ago, investors were scrambling to own high-yield bonds. That behavior triggered true extremes in a number of breadth metrics for the high-yield market. Since then, investors have focused on more exciting areas and high-yield bonds have chopped around. That's in line with historical precedents that quickly resumed their uptrends.
|
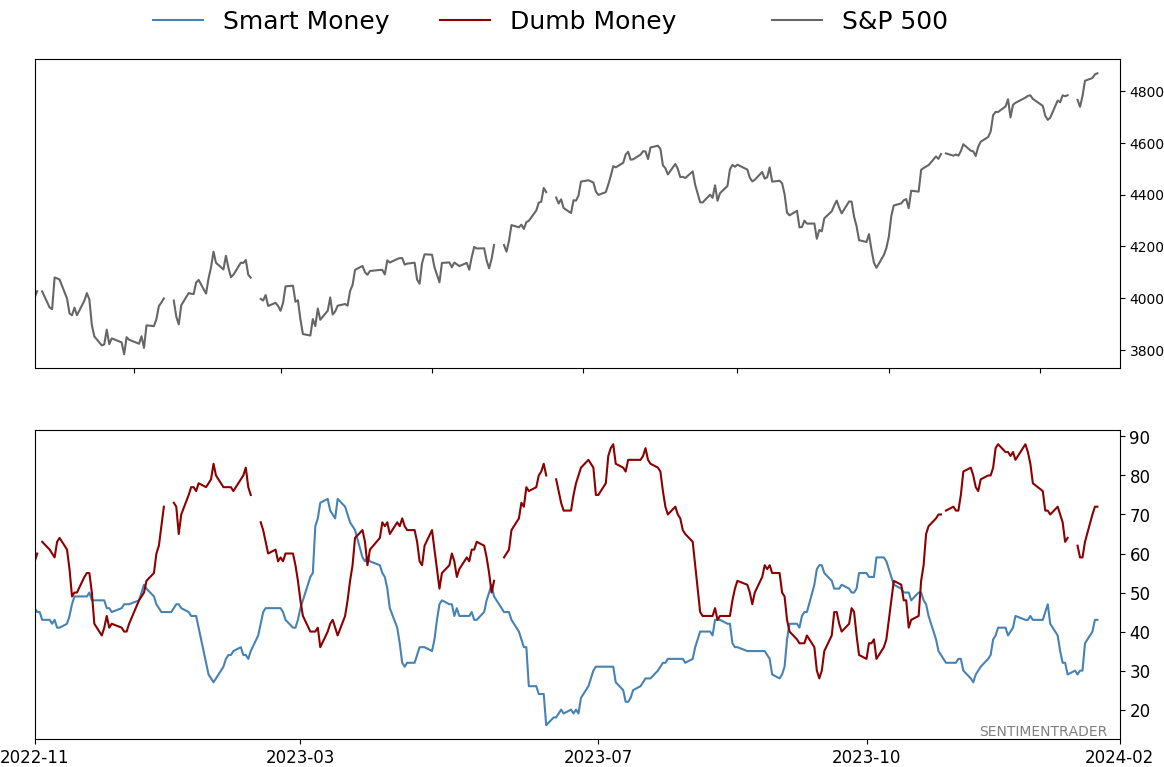
Smart / Dumb Money Confidence
|
Smart Money Confidence: 43%
Dumb Money Confidence: 72%
|
|
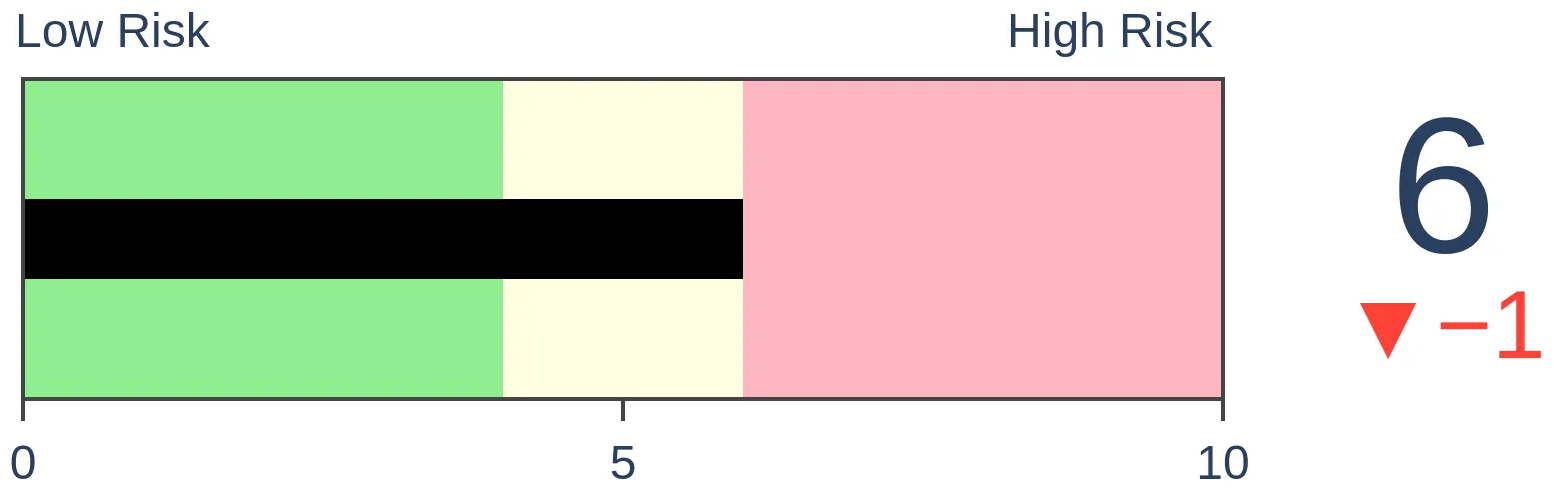
Risk Levels
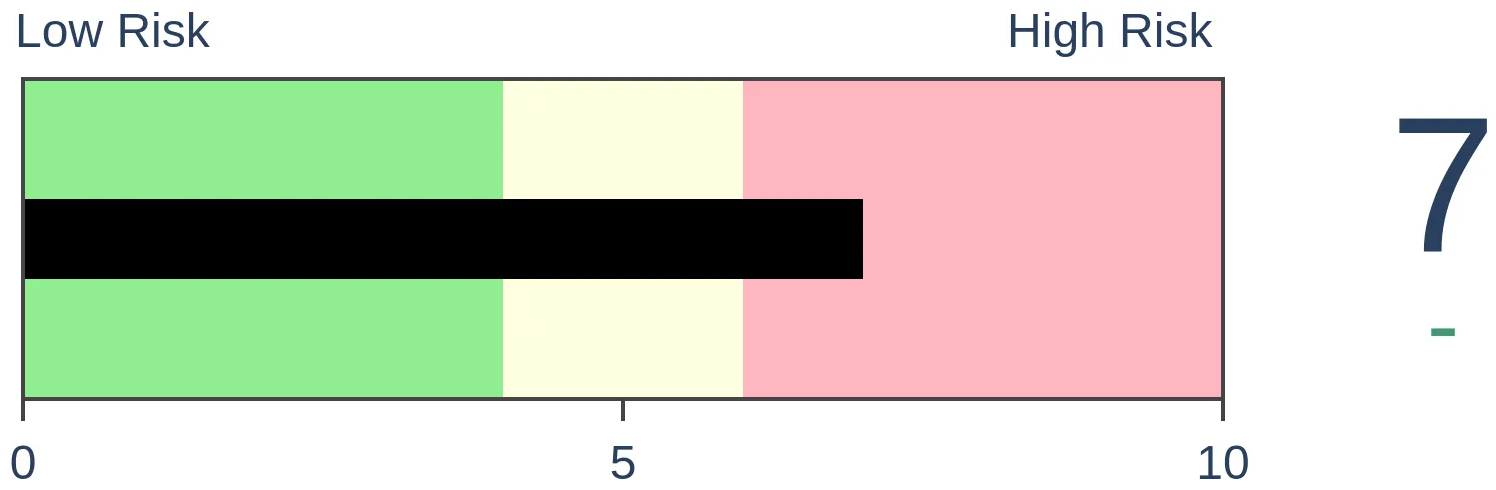
Stocks Short-Term
|
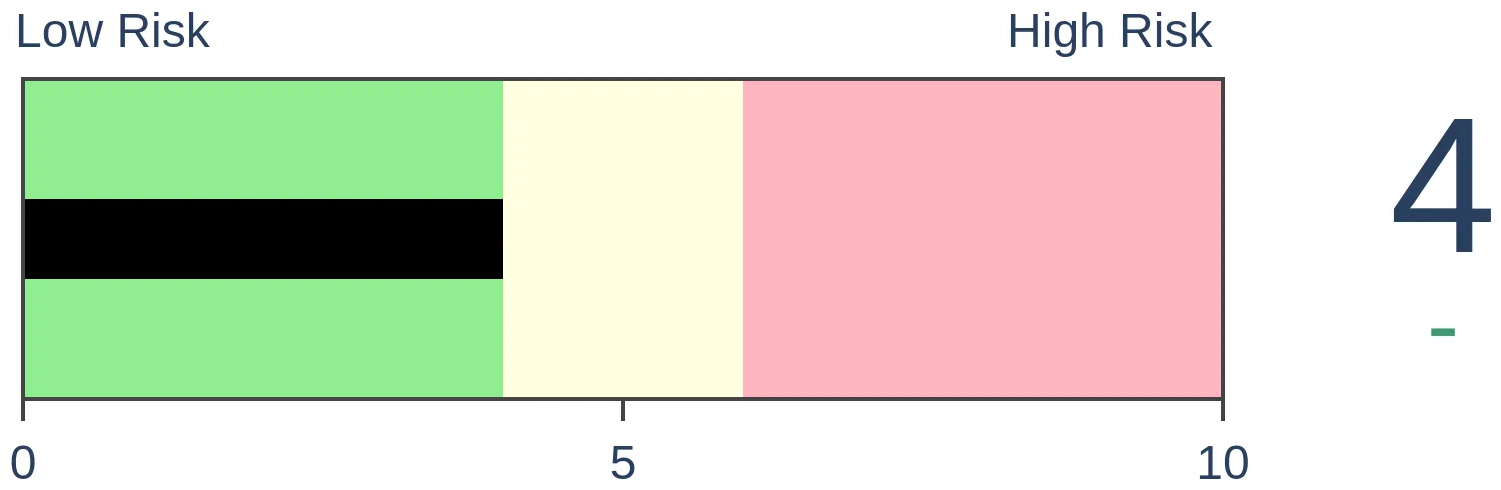
Stocks Medium-Term
|
|
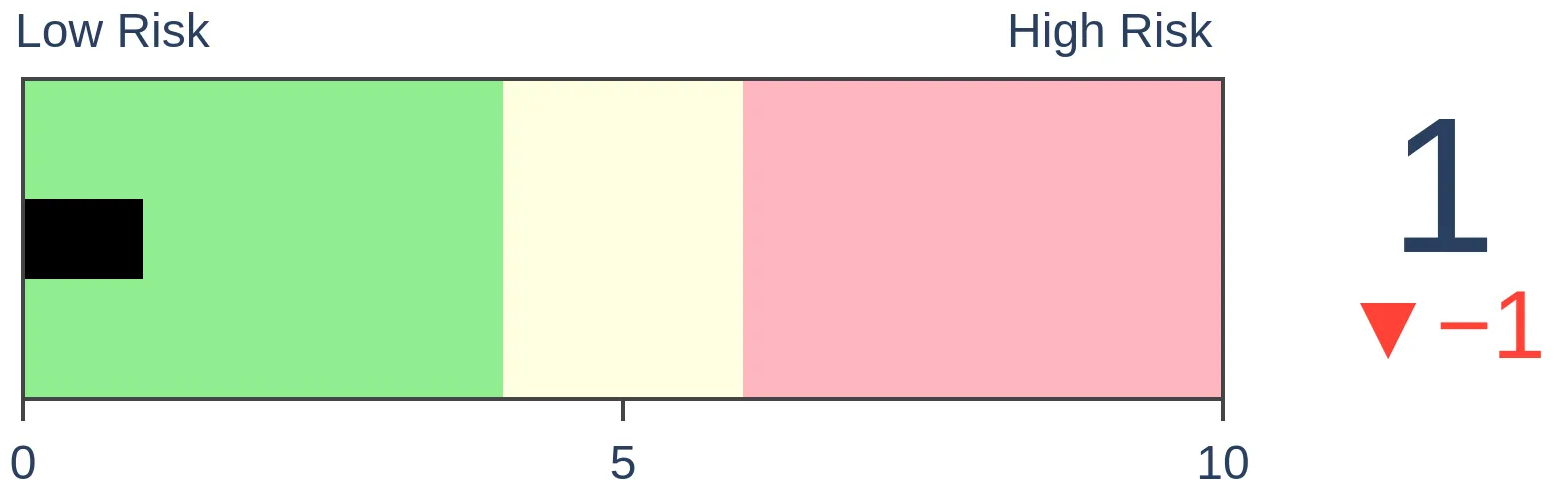
Bonds
|
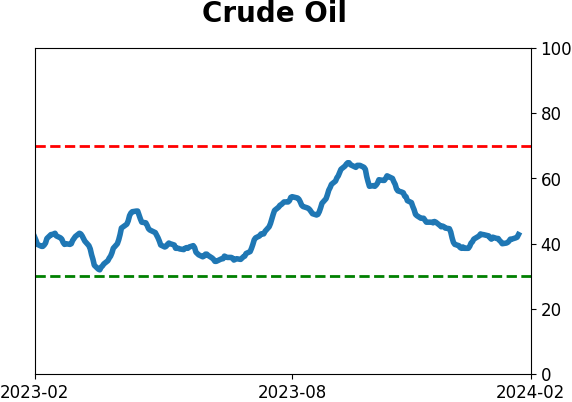
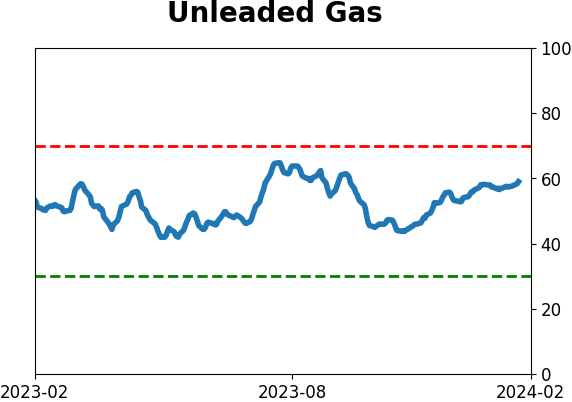
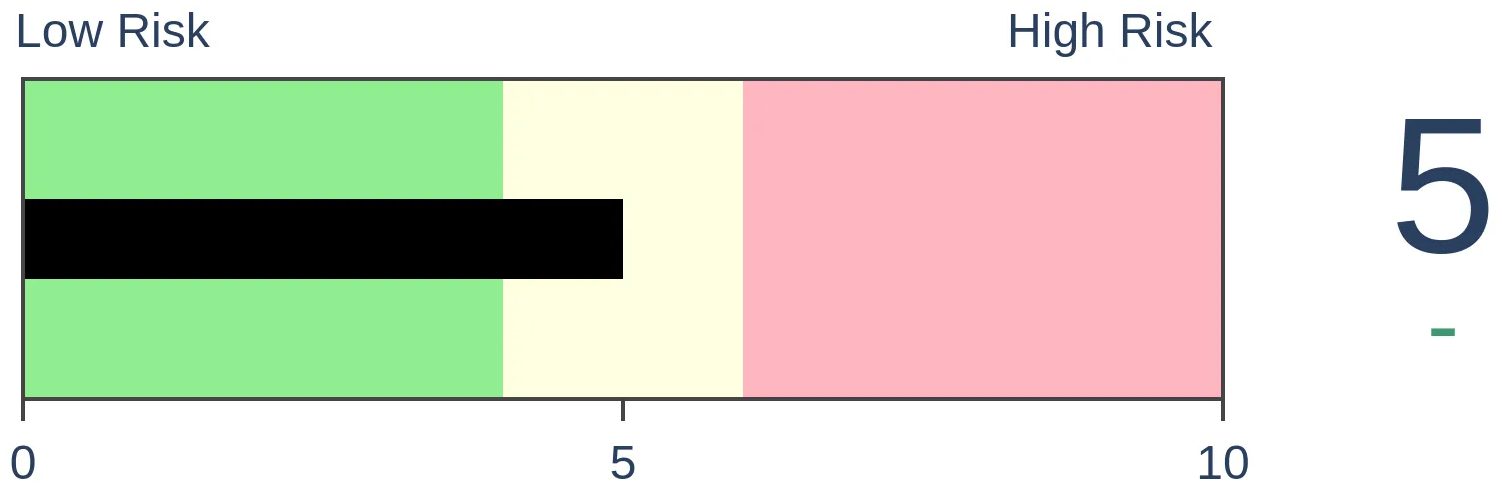
Crude Oil

|
|
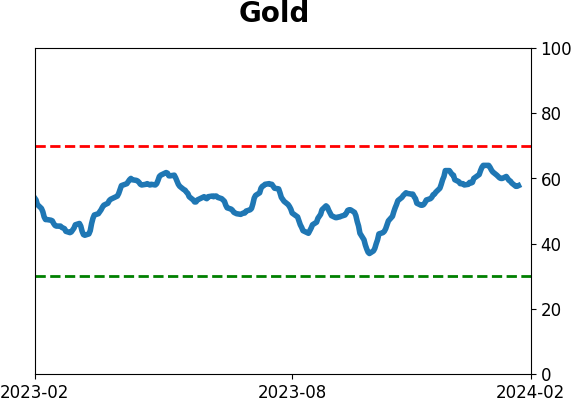
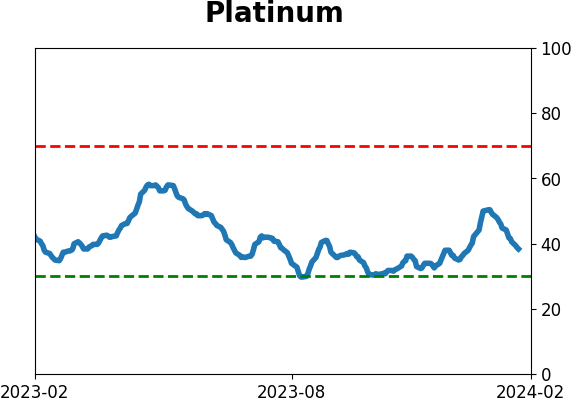
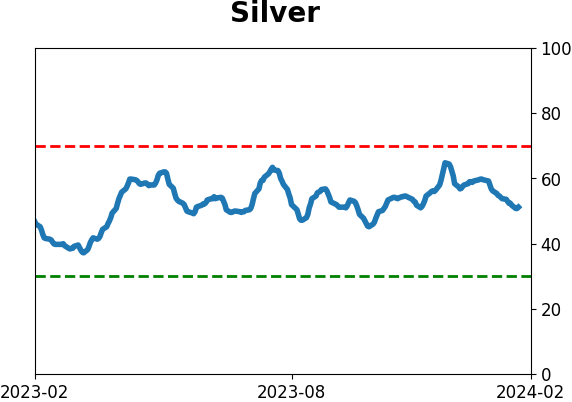
Gold
|
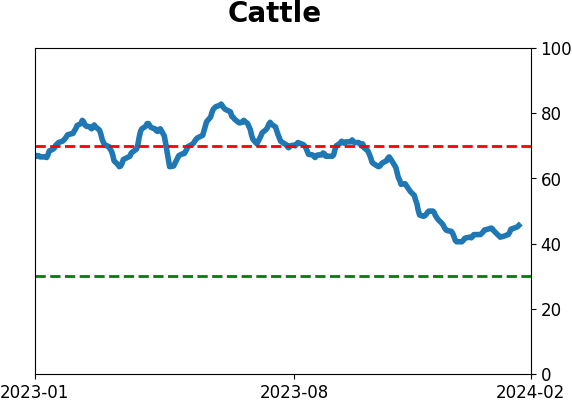
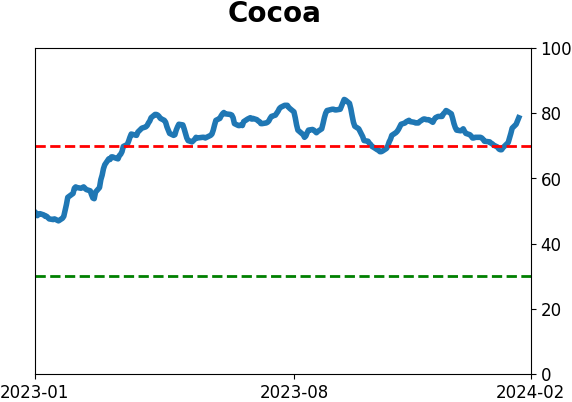
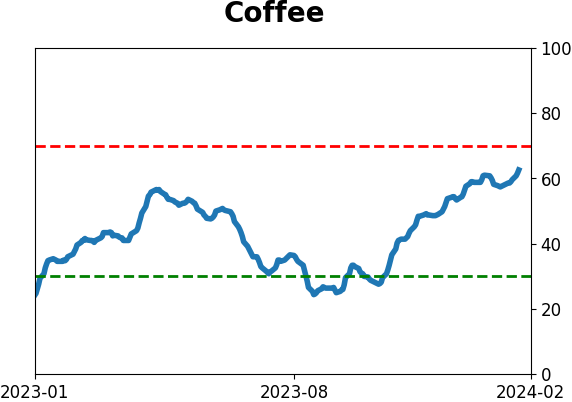
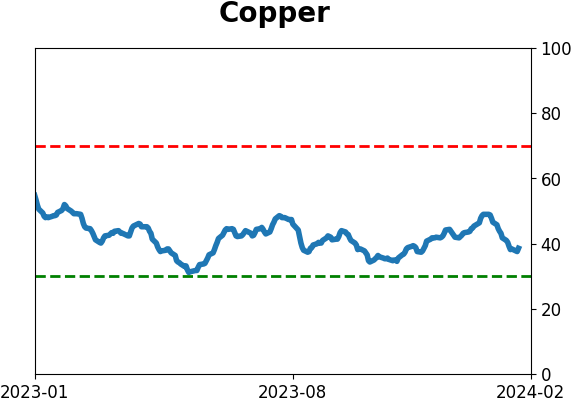
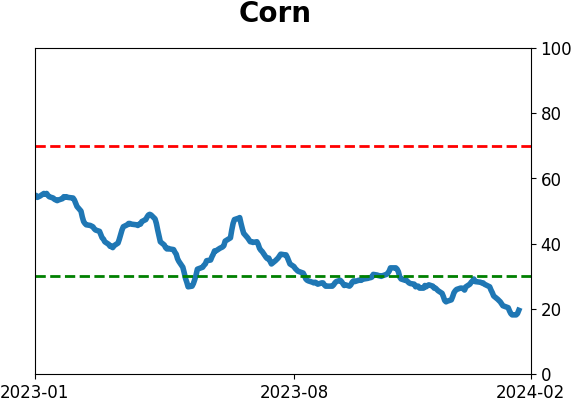
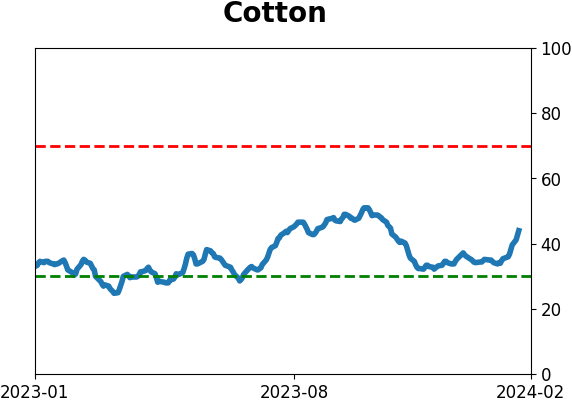
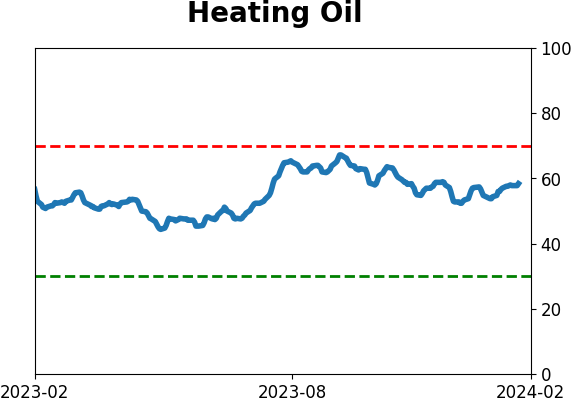
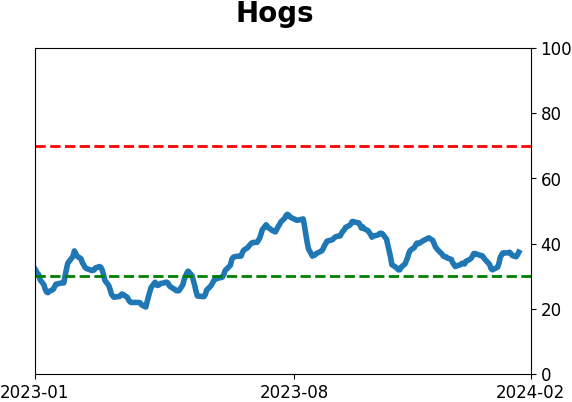
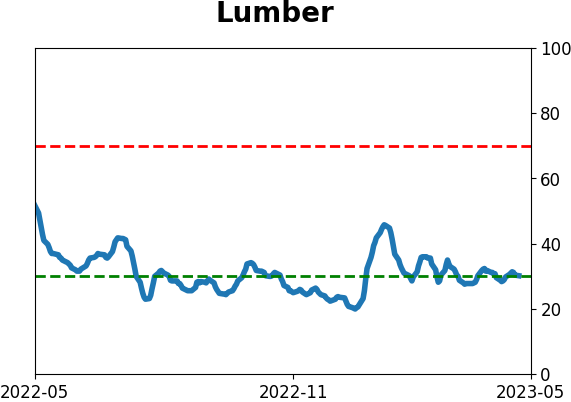
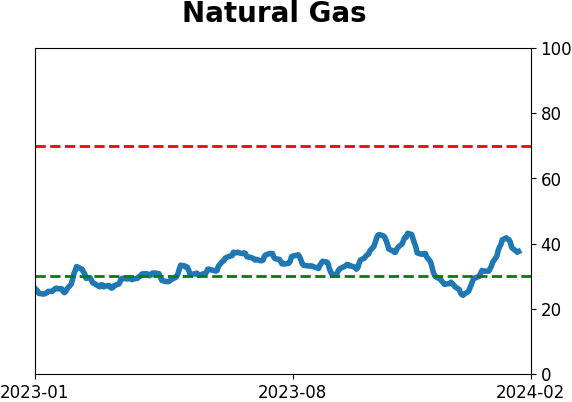
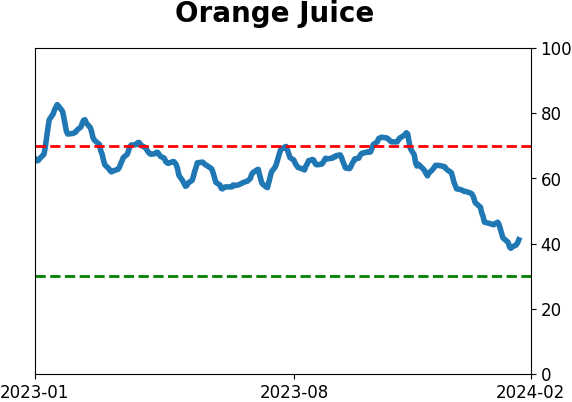
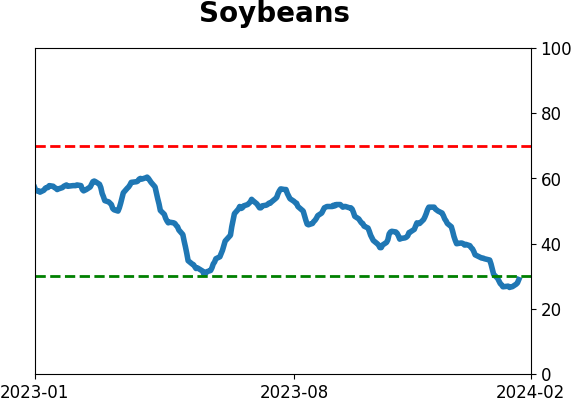
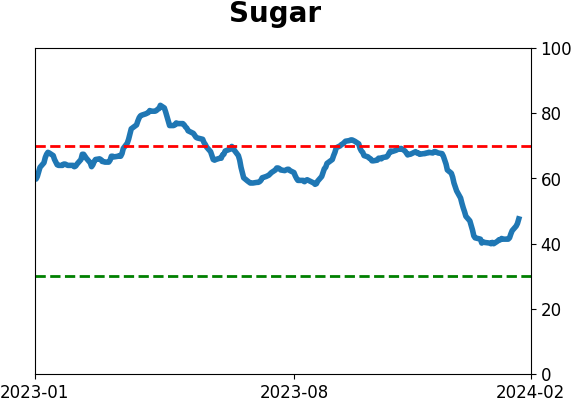
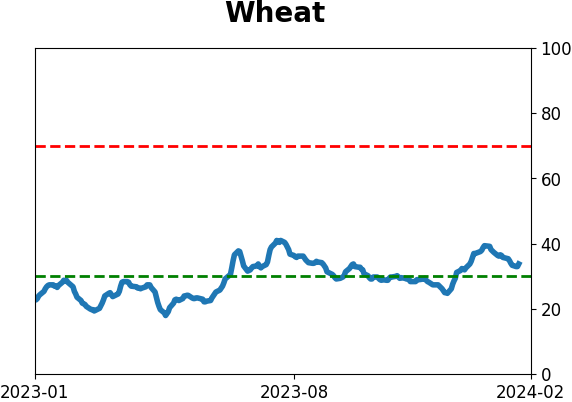
Agriculture
|
|
Research
By Jason Goepfert
BOTTOM LINE
A month ago, investors were scrambling to own high-yield bonds. That behavior triggered true extremes in a number of breadth metrics for the high-yield market. Since then, investors have focused on more exciting areas and high-yield bonds have chopped around. That's in line with historical precedents that quickly resumed their uptrends.
FORECAST / TIMEFRAME
None
|
Key points:
- In December, investors rushed into high-yield bonds, triggering extremes in breadth metrics
- Since then, the market has consolidated as investors focus on other markets
- This is in line with other spikes in high-yield bonds, which quickly resumed their uptrends
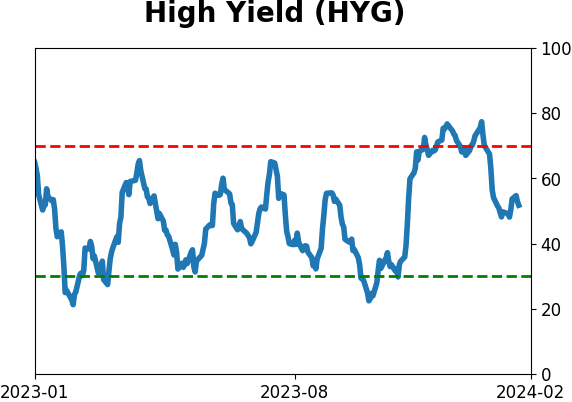
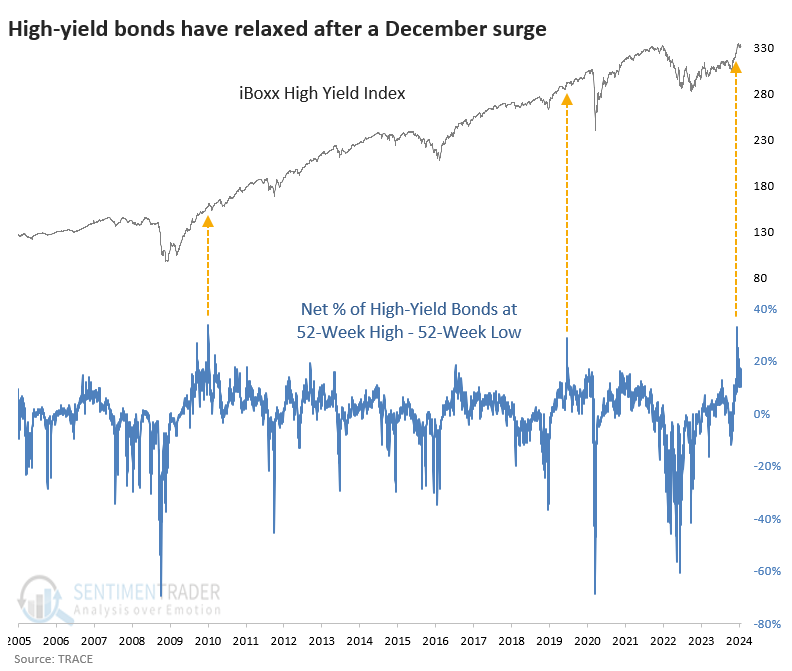
Since December's surge in new highs, junk bonds have chopped around
As many stock indexes continue to record new high after new high, some tangential markets have been holding back. We already saw that with small-cap stocks, and we can add high-yield bonds to the mix.
In December, there was a surge in 52-week highs among high-yield (junk) bonds, and since then, they have tread water. At the peak, there was a net of 33% more bonds hitting 52-week highs than 52-week lows, the 2nd-highest percentage in nearly 20 years. The other spikes came from the bear markets in 2008 and 2018.
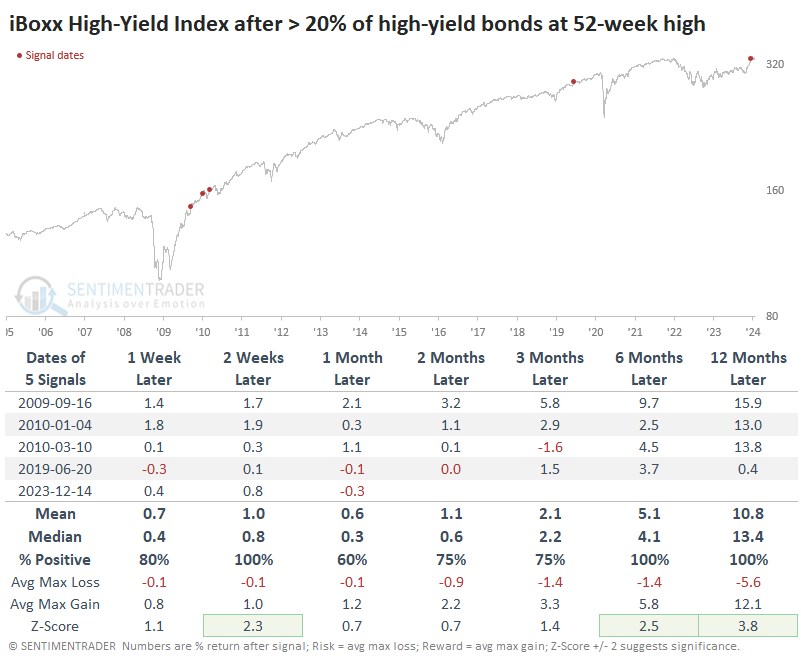
The table below shows forward returns in the iBoxx High-Yield Bond Index after more than a net 20% of bonds hit 52-week highs. This index closely tracks the popular HYG and JNK funds and has a longer history.
We can see from the table that since the spike in December, the iBoxx index has chopped around and shows a slight negative return. That's perfectly in line with the precedents. The good news is that returns were excellent over the next six months, though we're limited to two distinct periods.
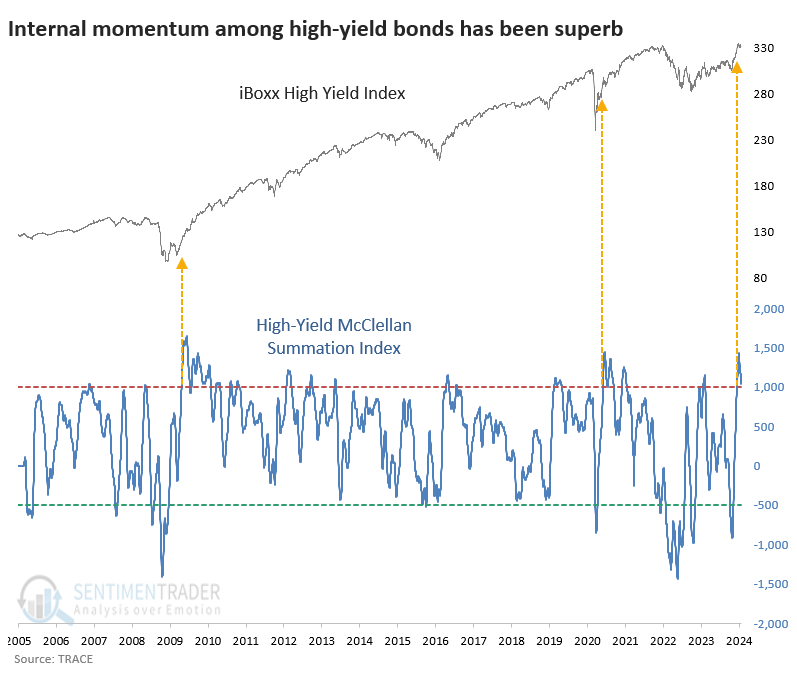
Internal momentum neared record-breaking territory
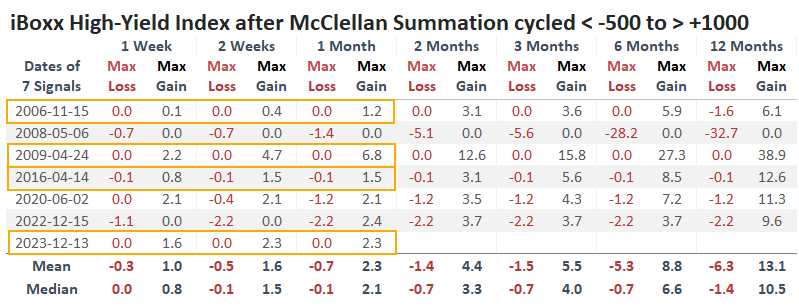
Thanks to the December rally, internal momentum in high-yield bonds has been exceptional. The McClellan Summation Index for that market climbed to nearly +1500 for only the third time. The other two were coming out of the severe bear markets in 2008 and 2020, and the bonds continued to climb for months or years afterward.
The table below shows every time when the Summation Index for high-yield bonds cycled from below -500 to above +1000. There was one clear failure in 2008 when junk bonds rolled over pretty much immediately. That has not been the case this time, which helps lessen the probability of seeing a repeat of that failure. After all the others, there was a strong tendency to see persistent gains.
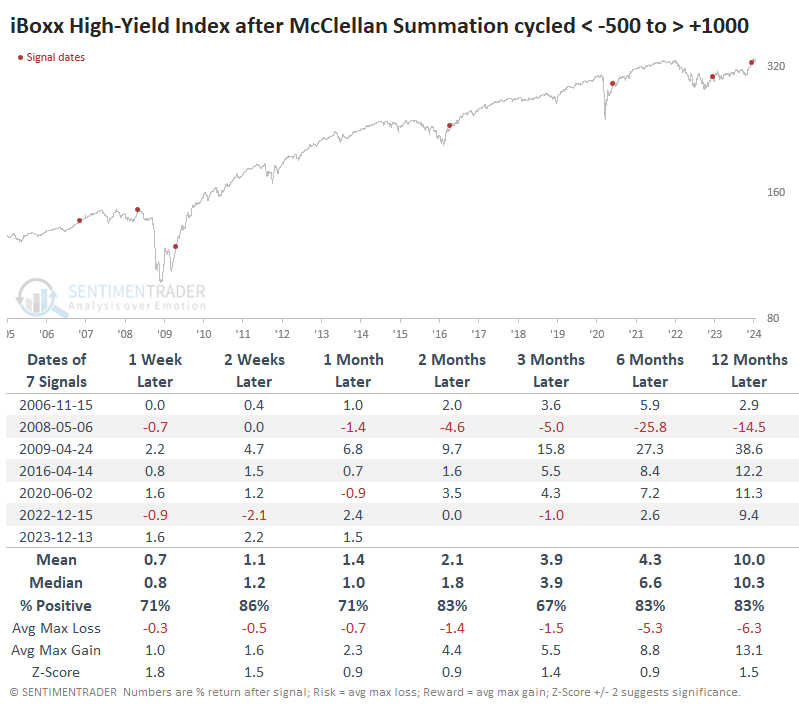
The table of maximum gains and losses across time frames shows that the December signal has closely tracked the ones from November 2006, April 2009, and April 2016. Each of those continued to rise in the months ahead with no further drawdown.
What the research tells us...
After a market reaches an extreme, either way, it's often helpful to just sit back and watch for a while to see how investors react. If they reject the extreme and go the other way, that tells us much about their risk appetite. Regarding high-yield bonds, there was a surge in interest among investors in December, and since then, they've been ignored for more exciting parts of the market. It turns out that this is pretty normal and has been a good sign.
It's hard to have too much confidence in the conclusion due to limited history and tiny sample sizes. Still, the behavior of the bonds over the past month has been in line with behavior after surges-and-consolidations that ultimately resolved higher, which helps contribute to a bullish view.
Indicators at Extremes
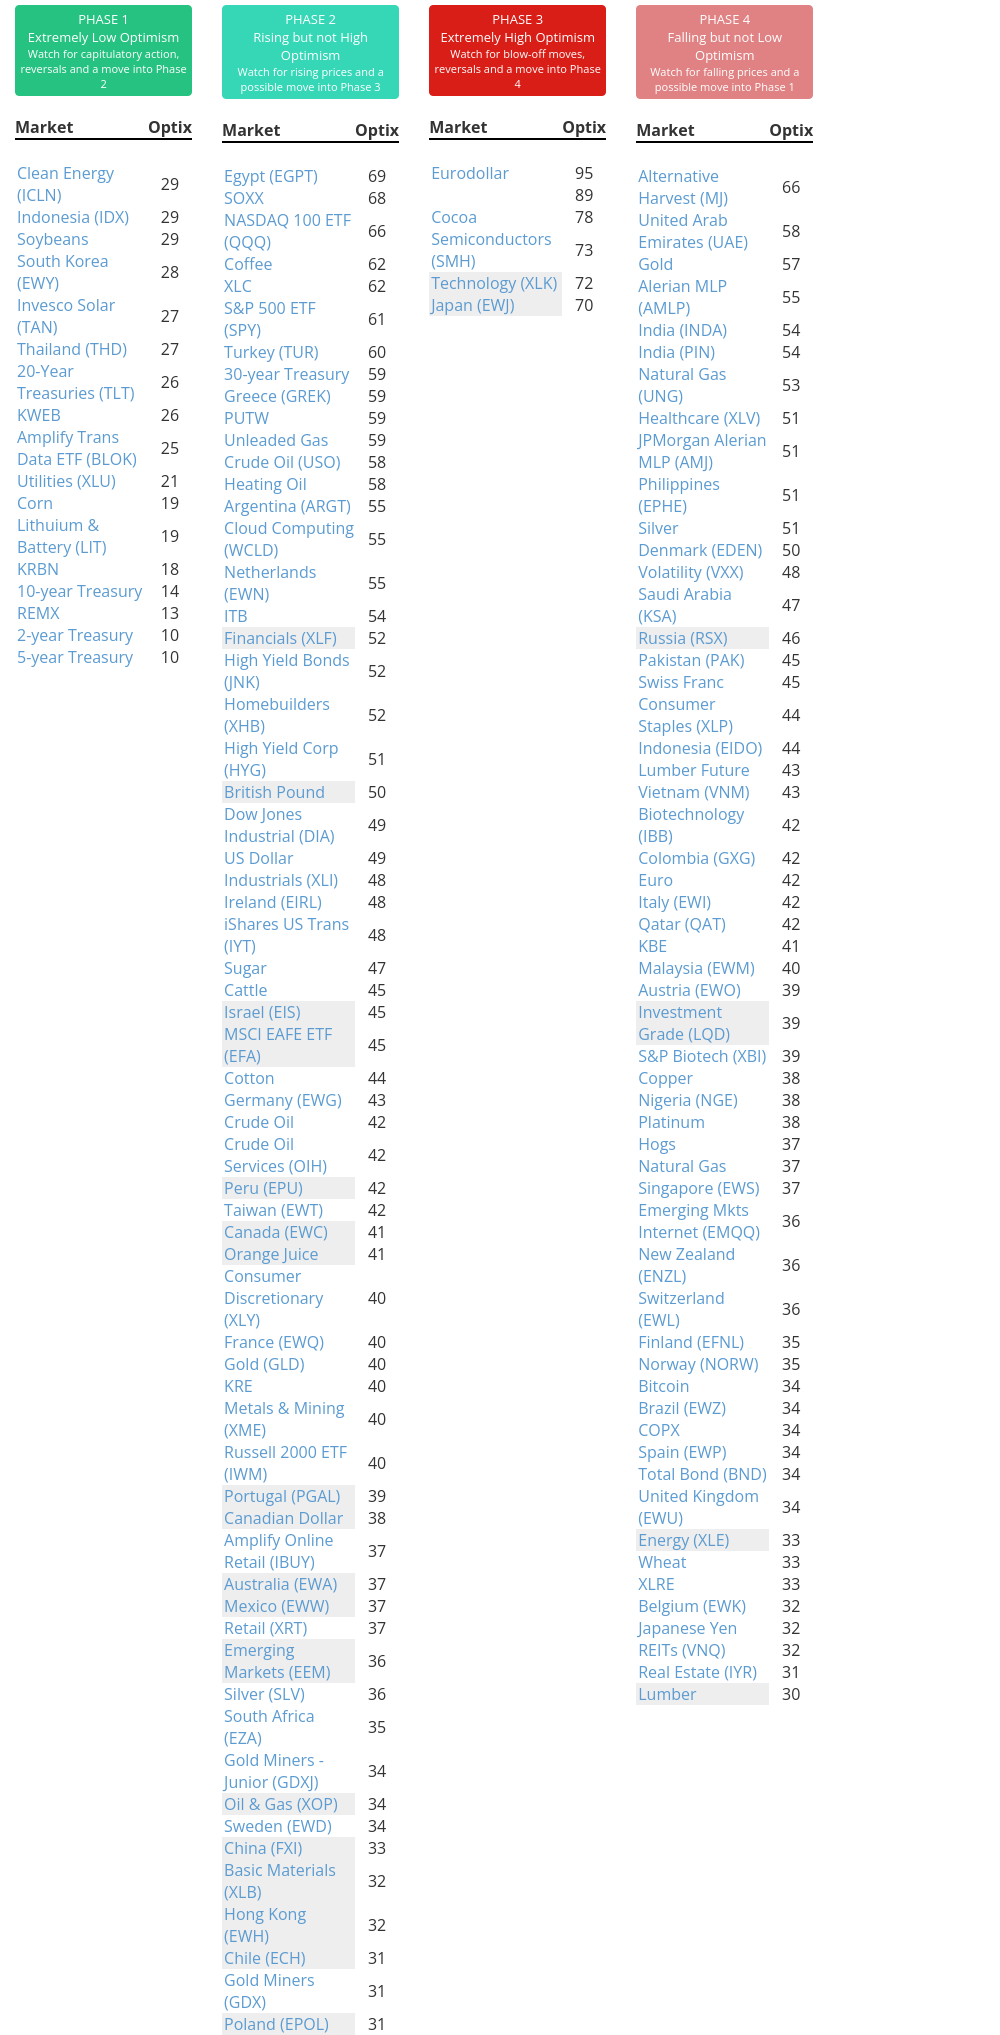
Phase Table
Ranks
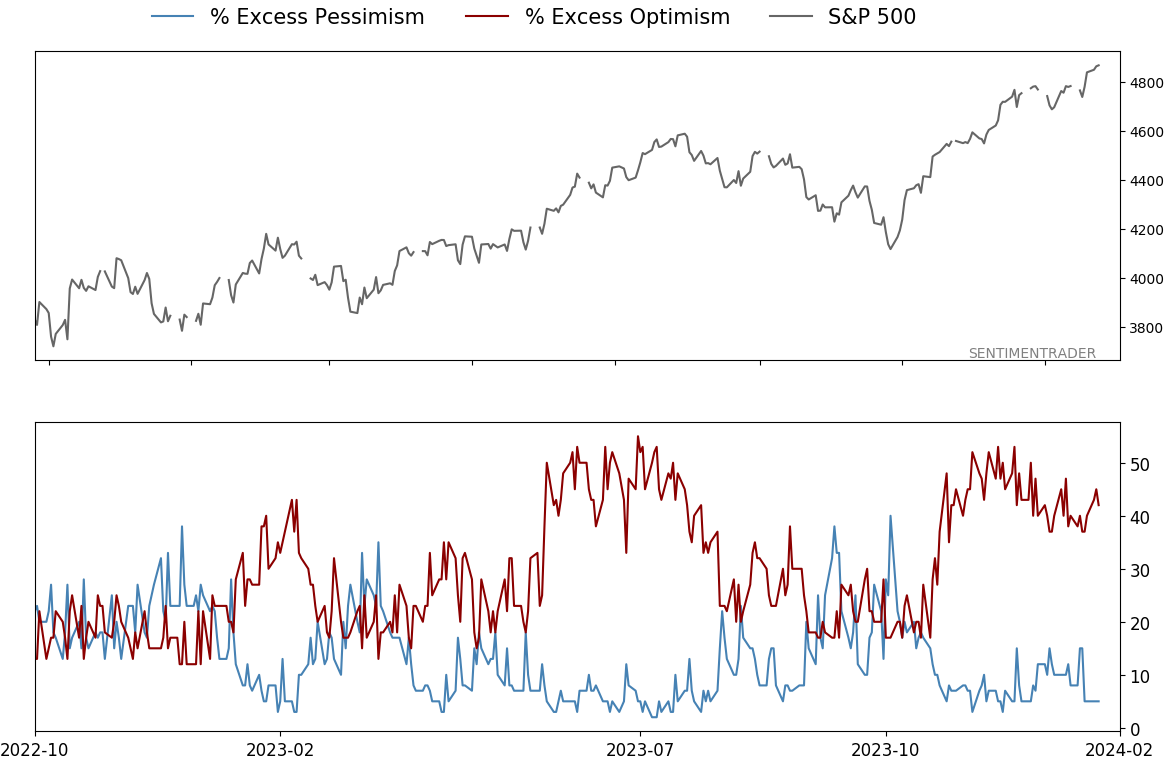
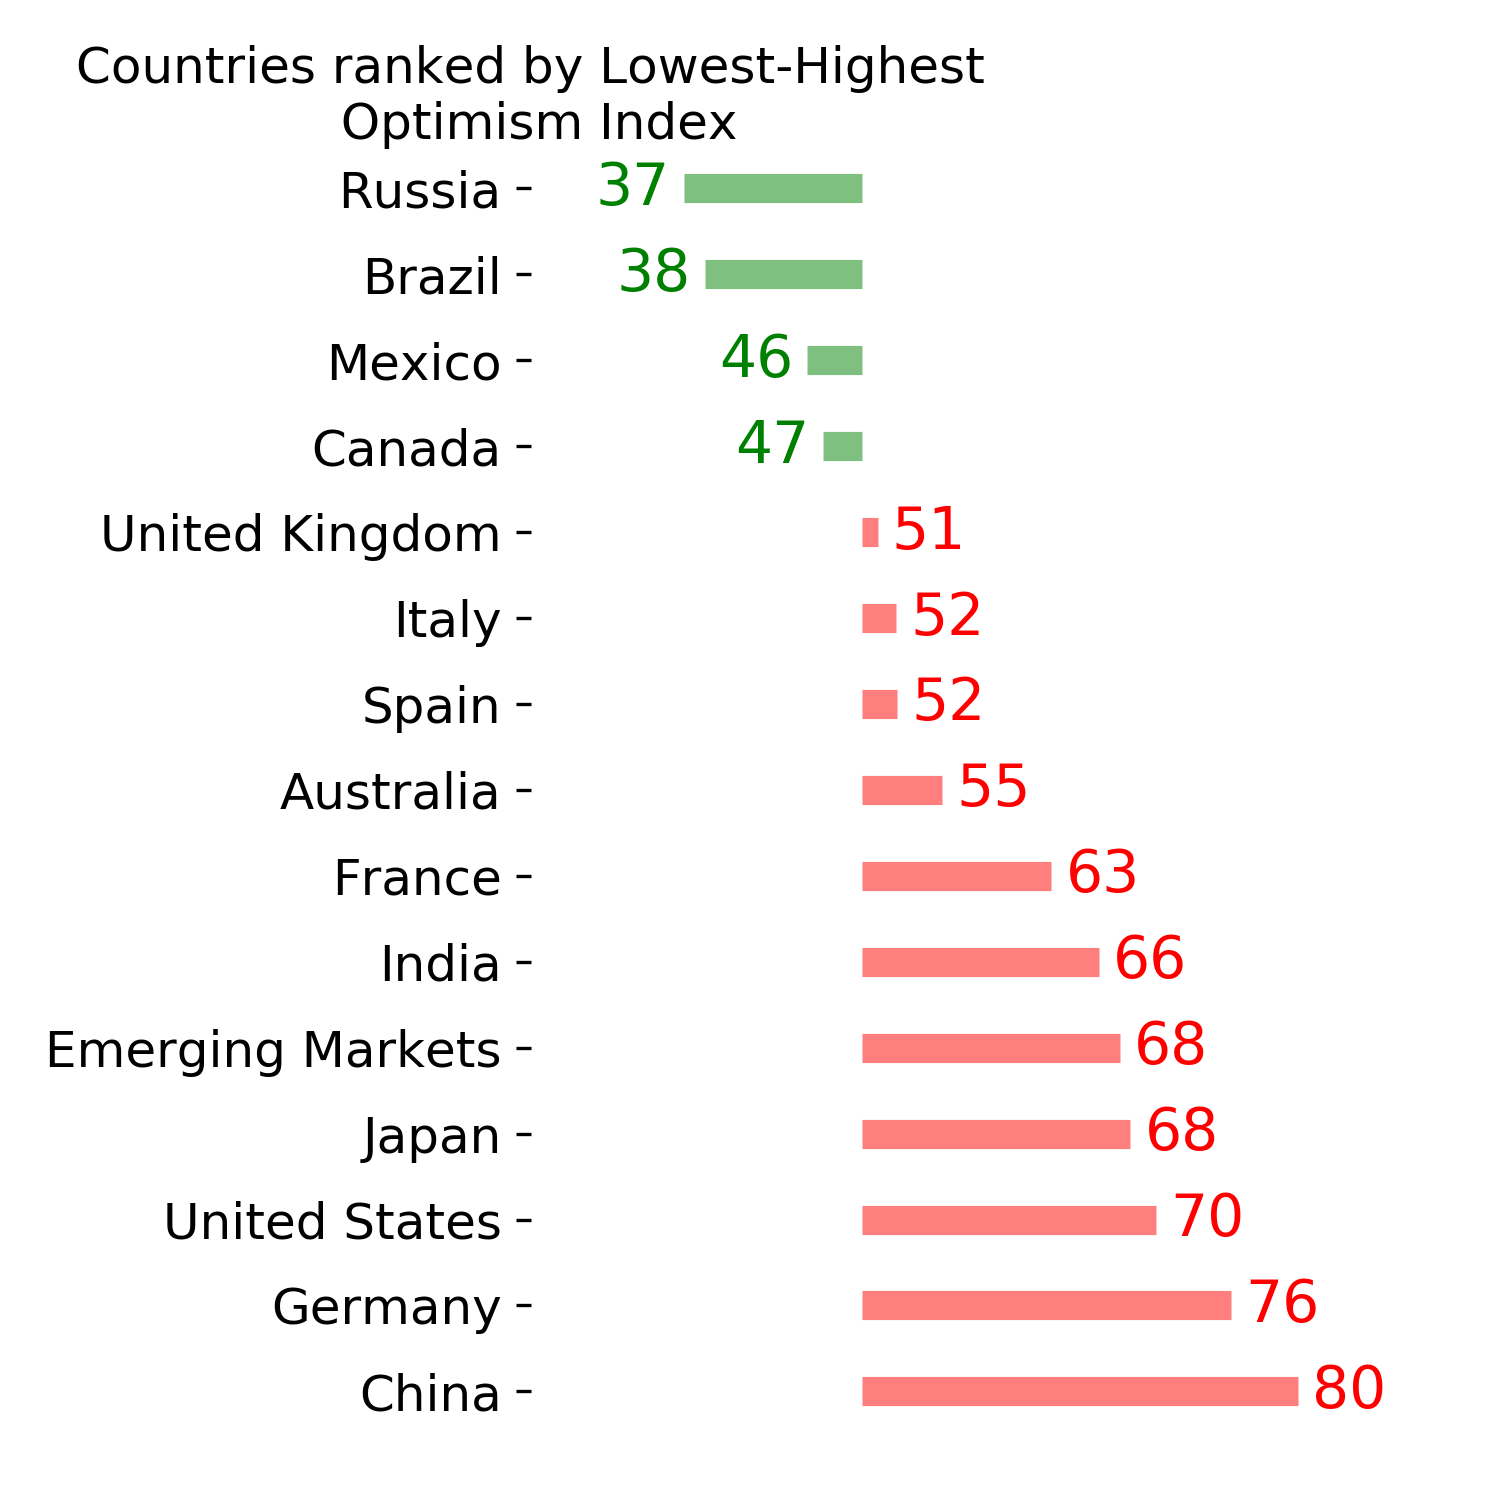
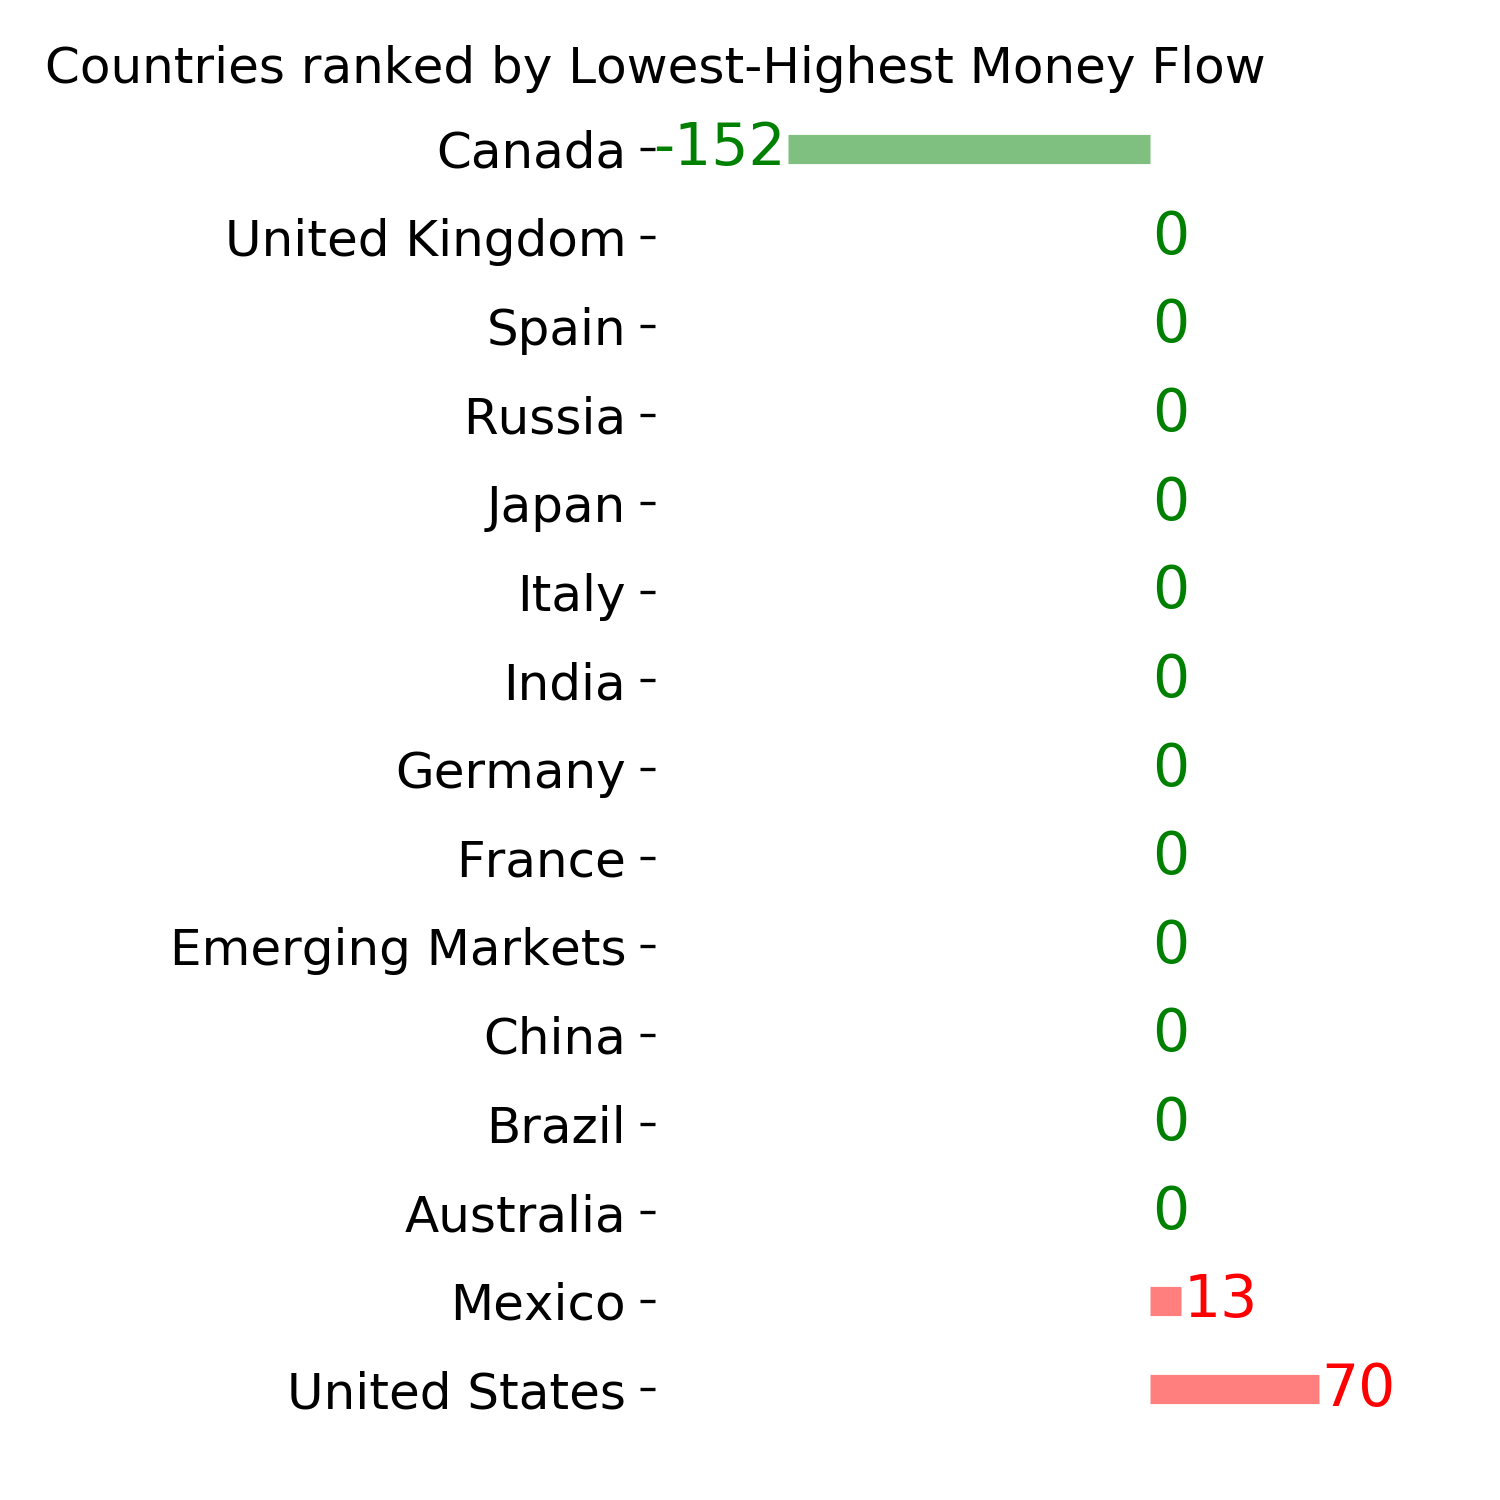
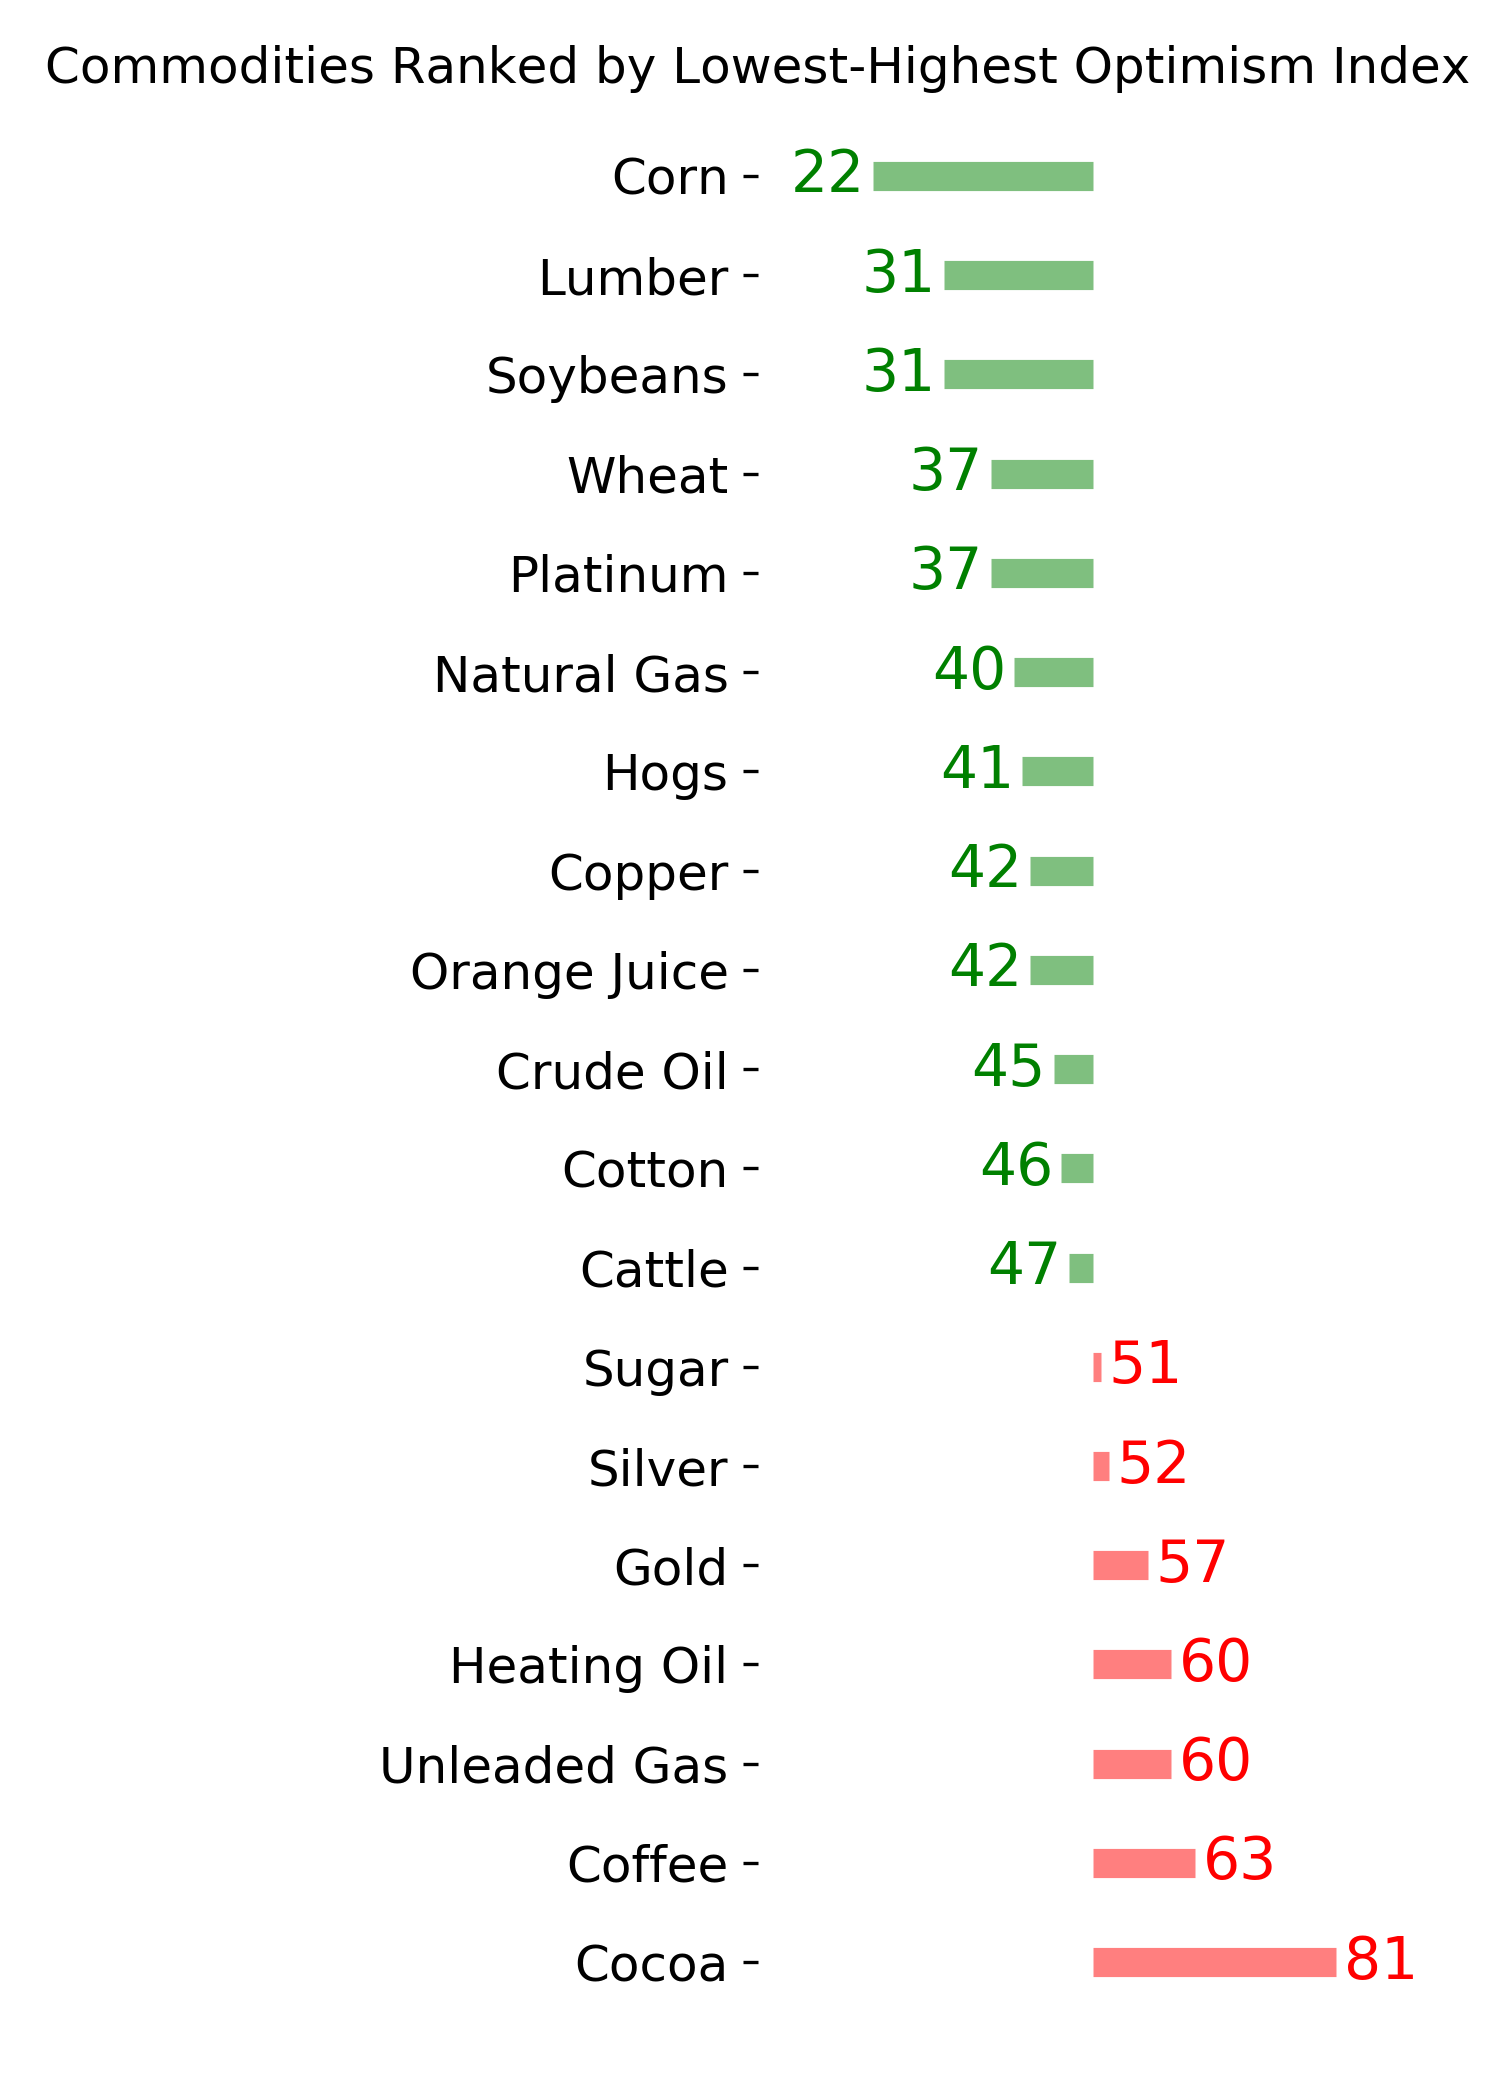
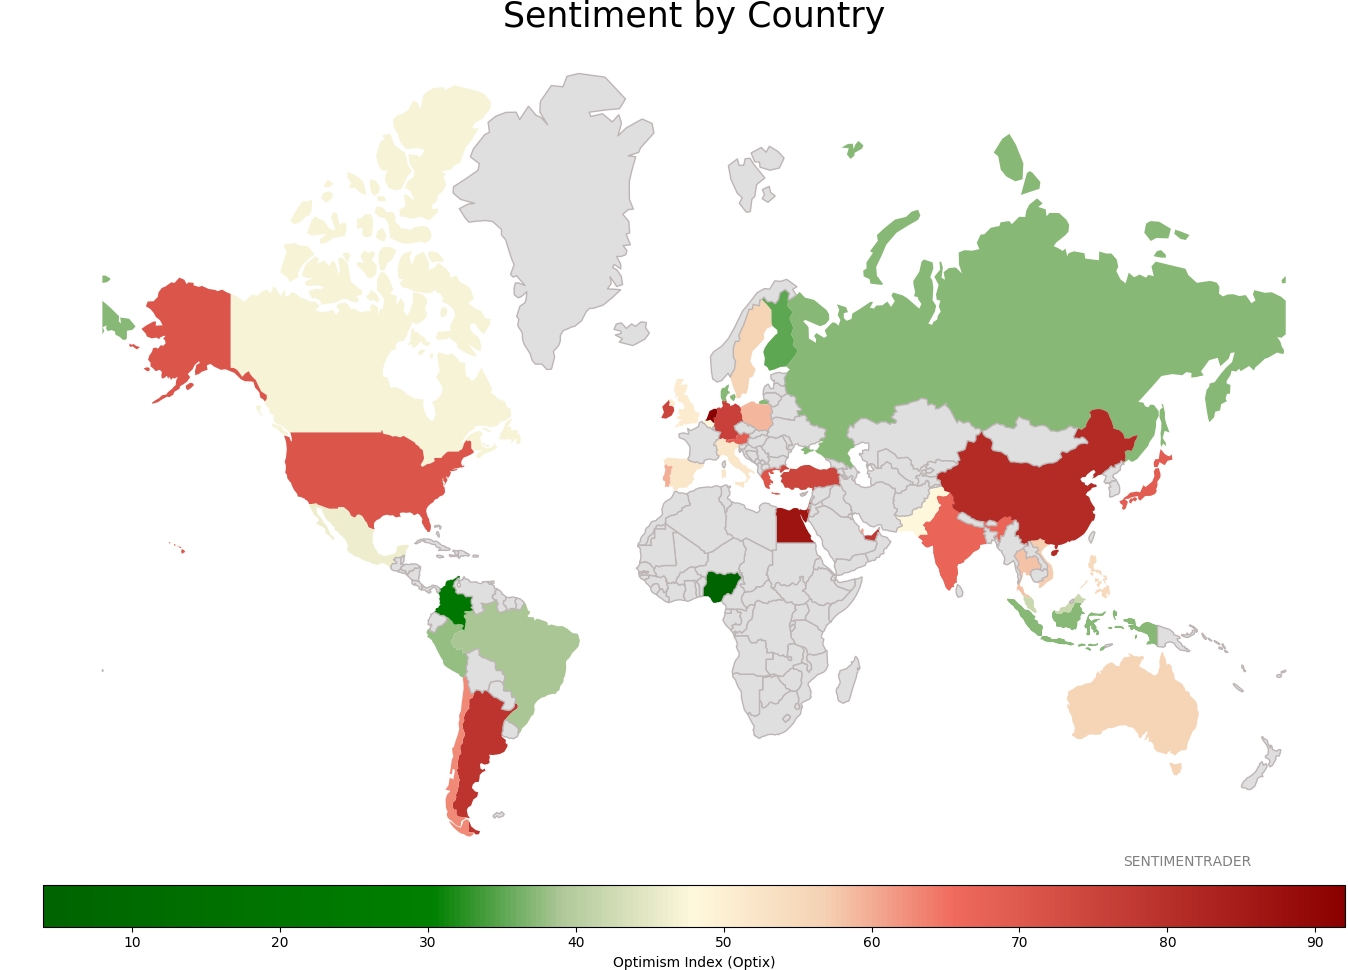
Sentiment Around The World
Optimism Index Thumbnails
|
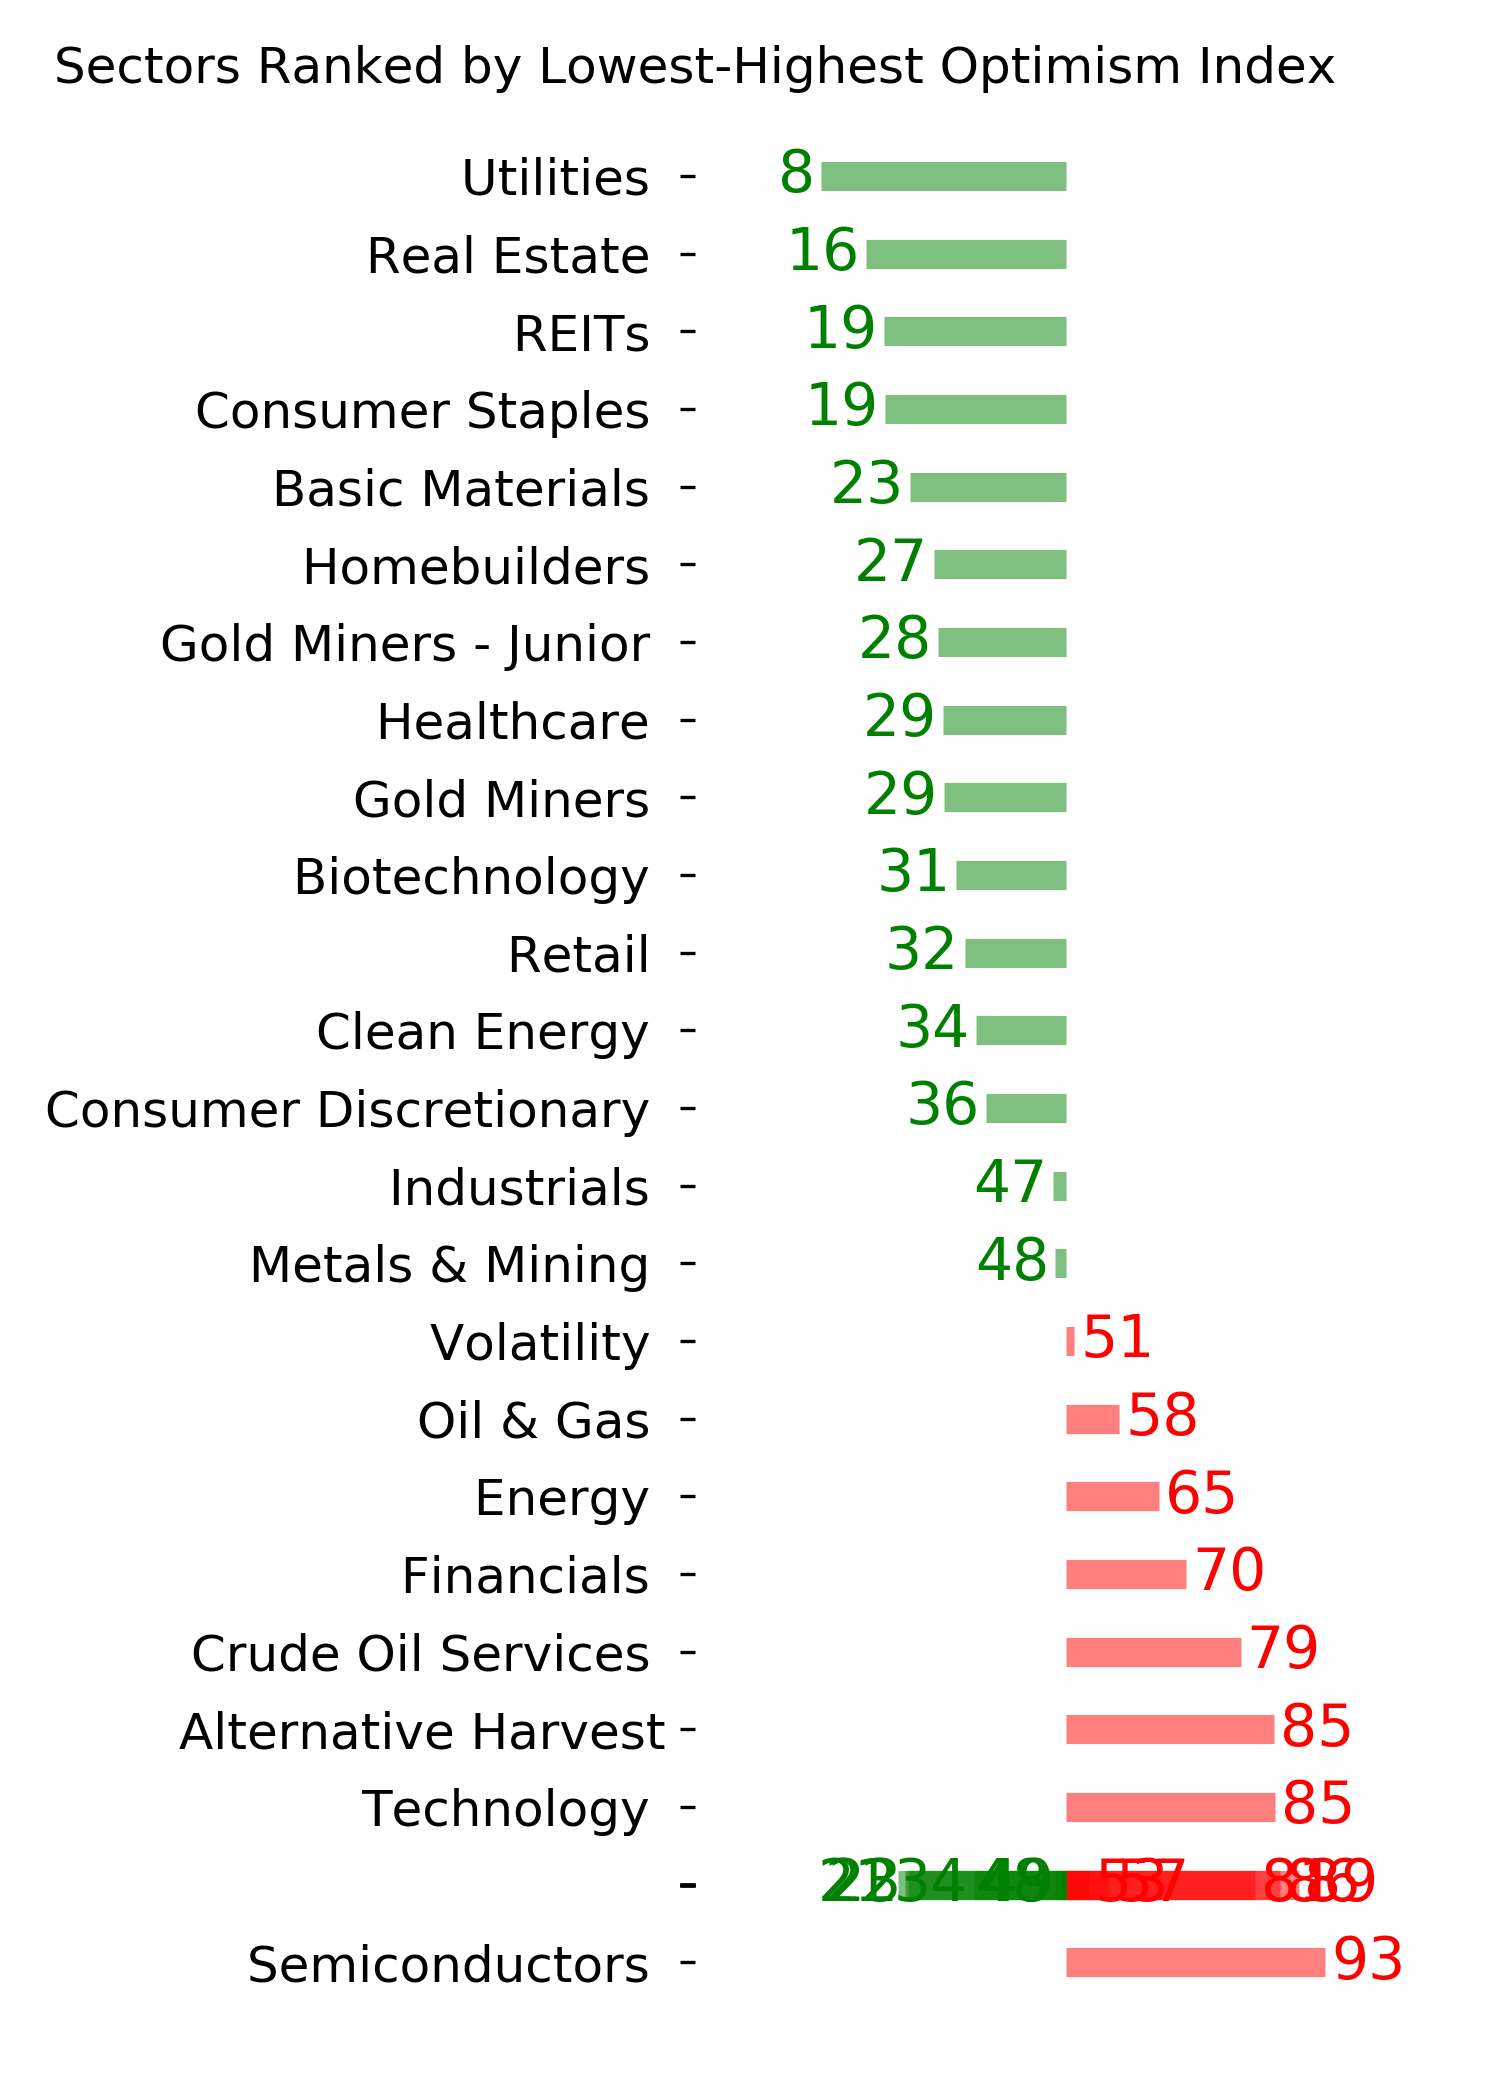
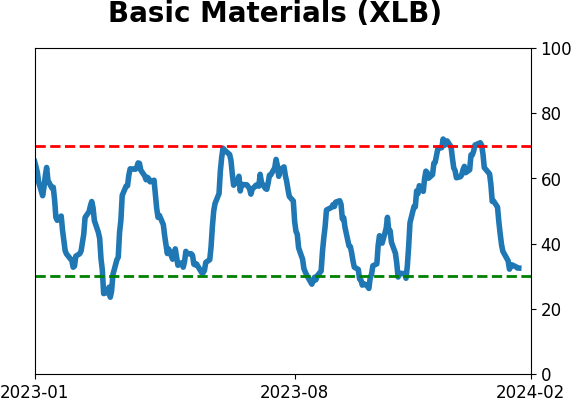
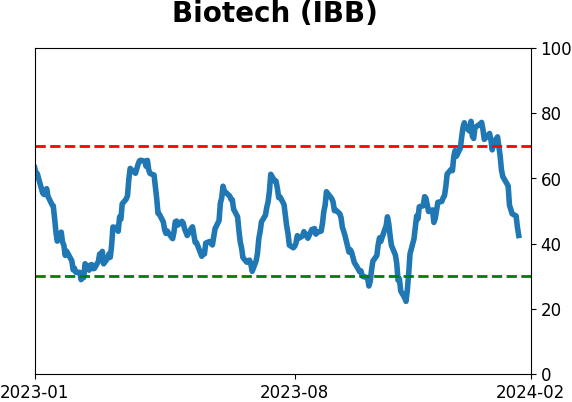
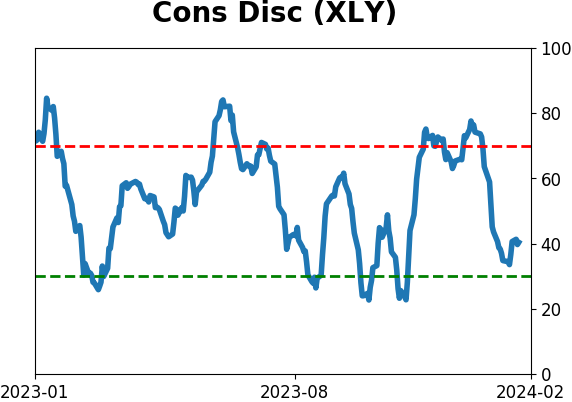
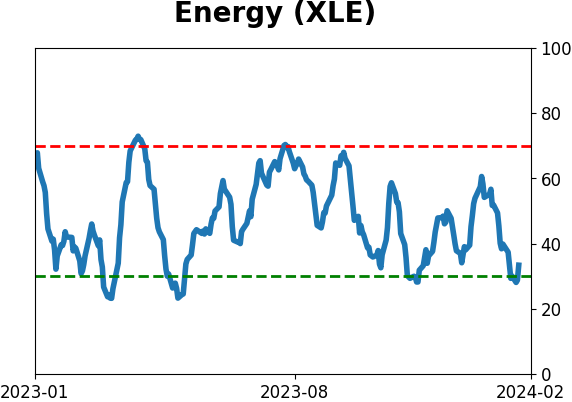
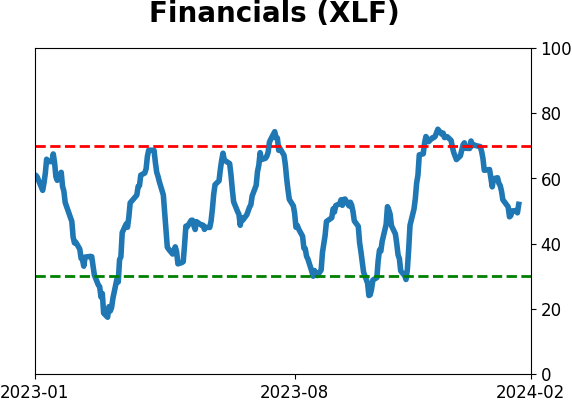
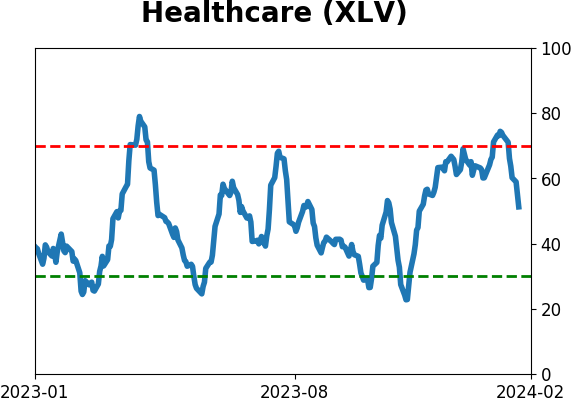
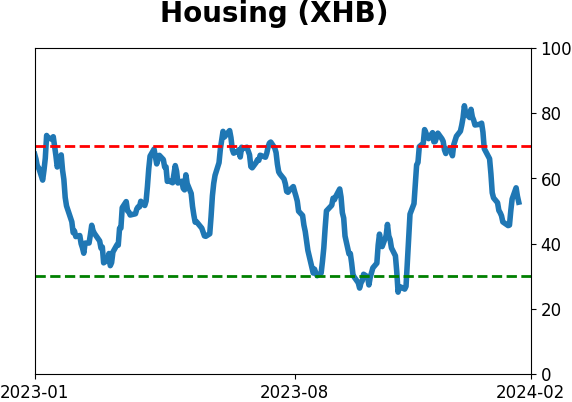
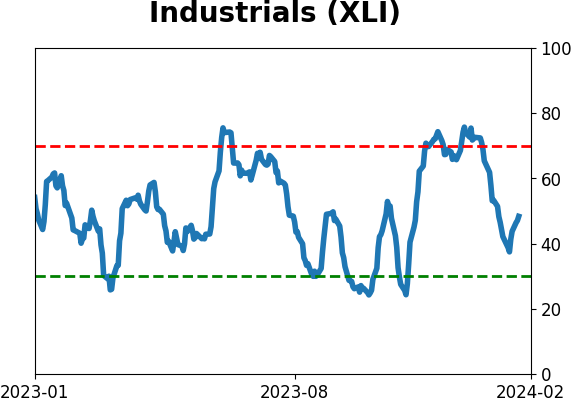
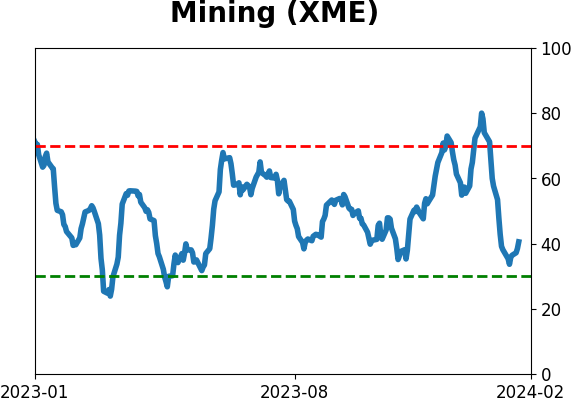
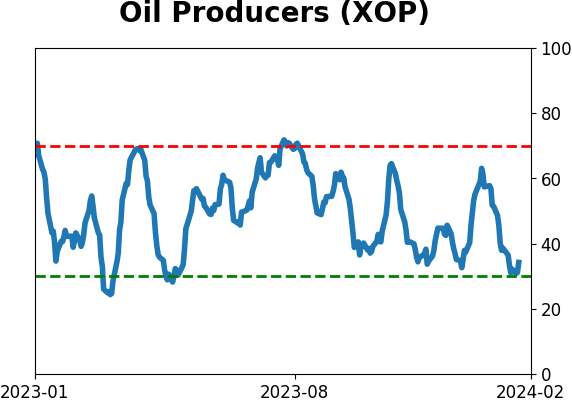
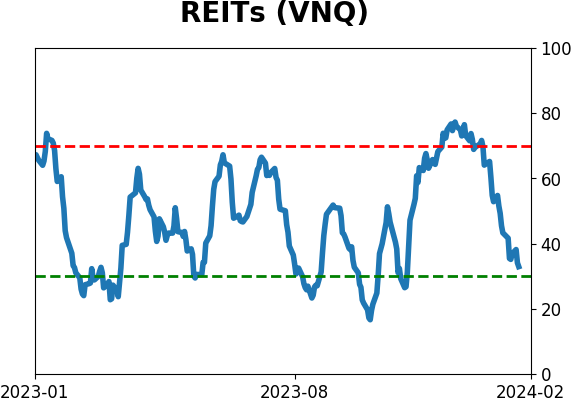
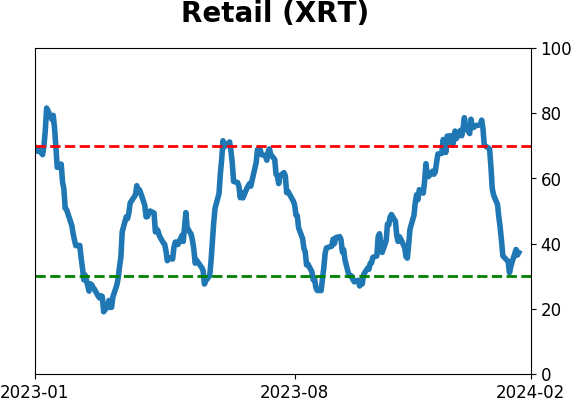
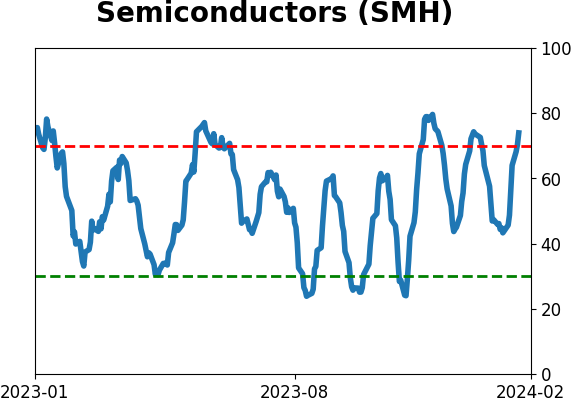
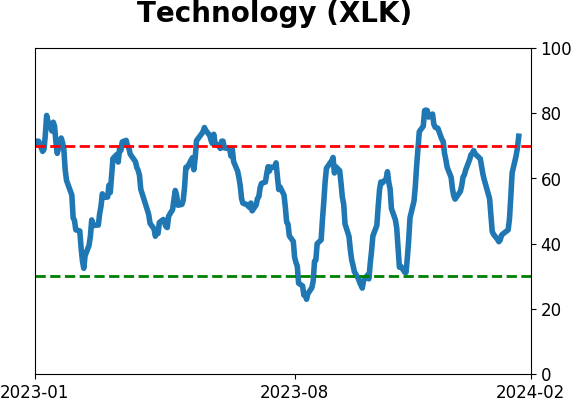
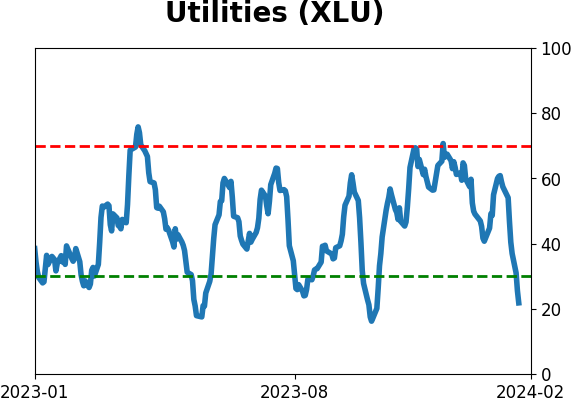
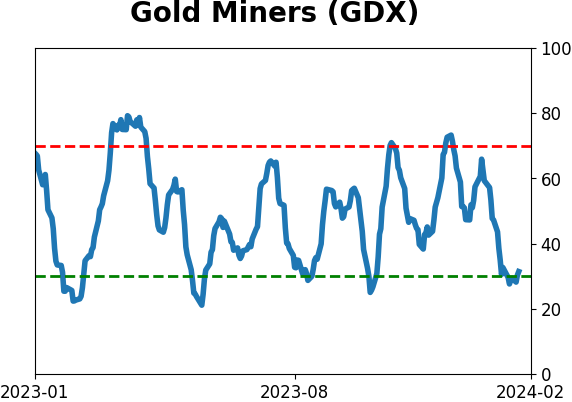
Sector ETF's - 10-Day Moving Average
|
|
|
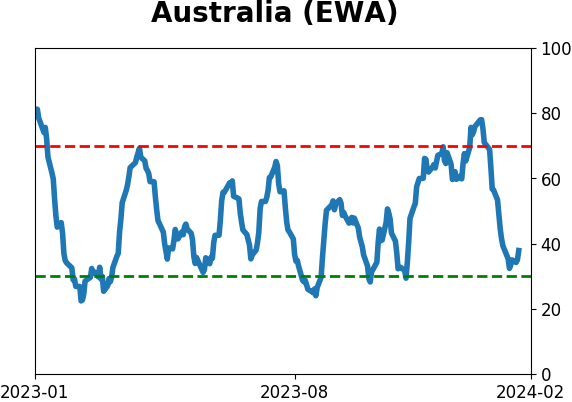
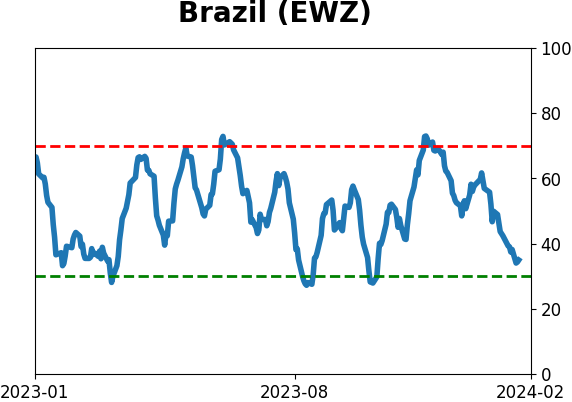
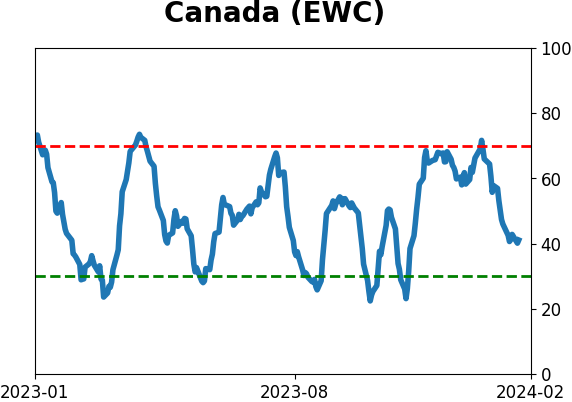
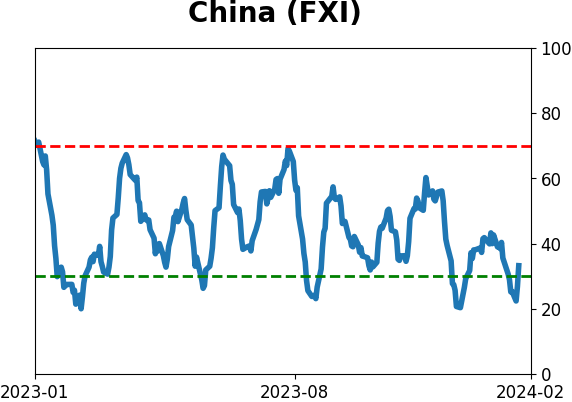
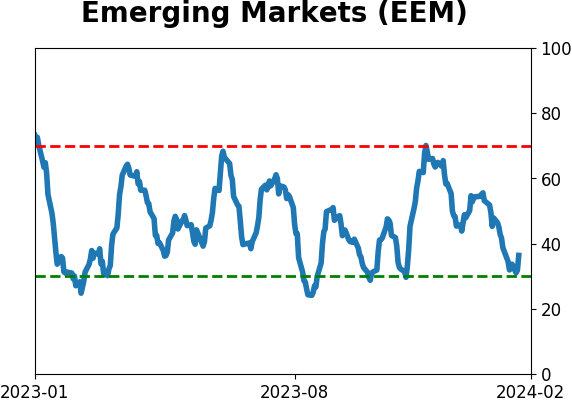
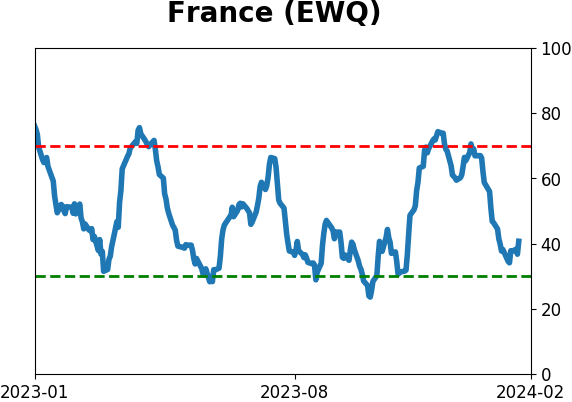
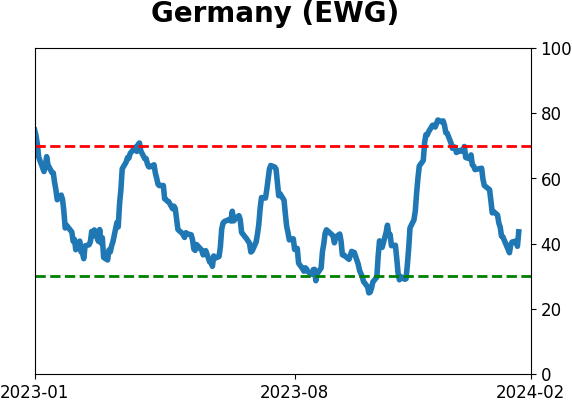
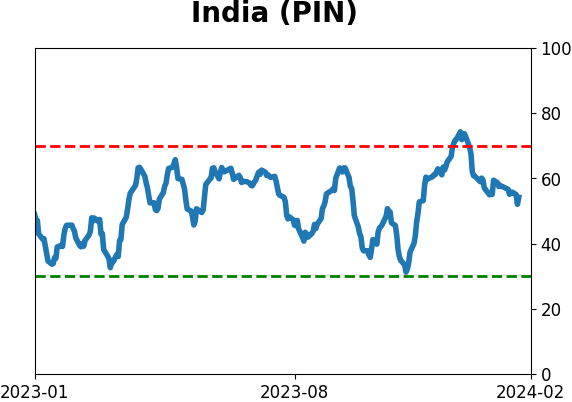
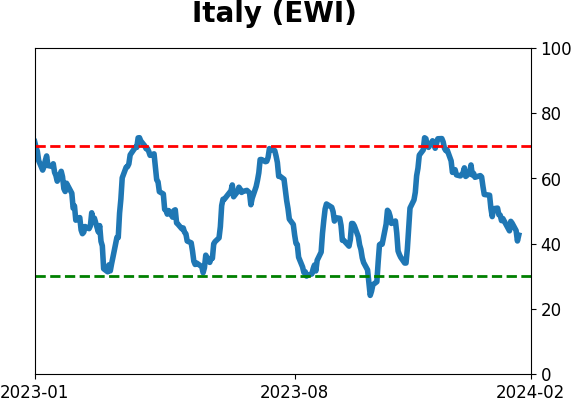
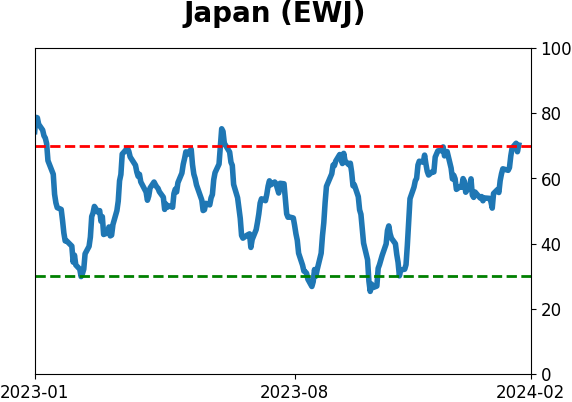
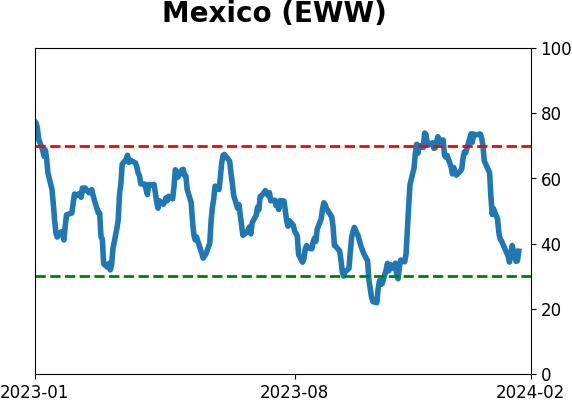
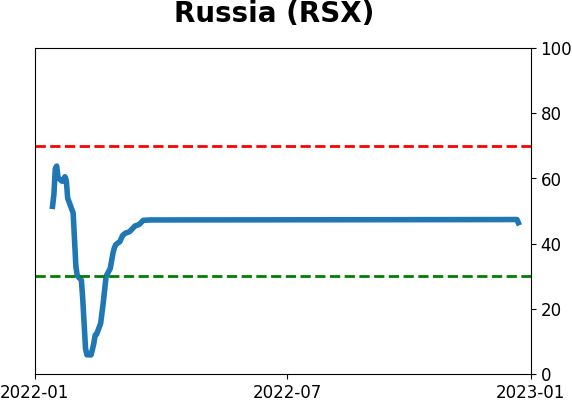
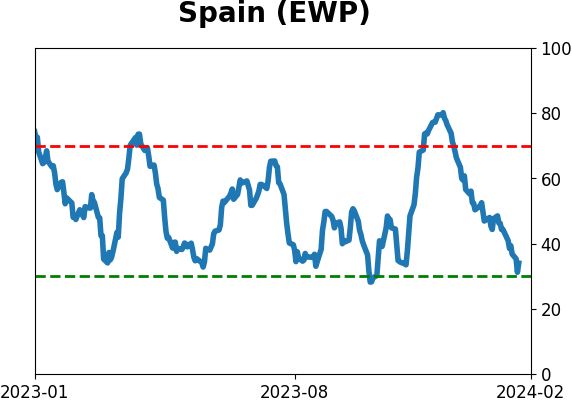
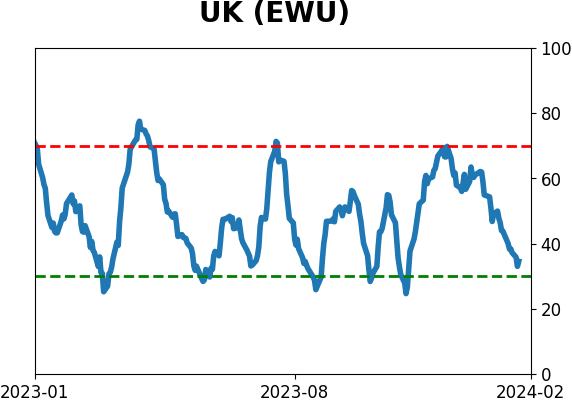
Country ETF's - 10-Day Moving Average
|
|
|
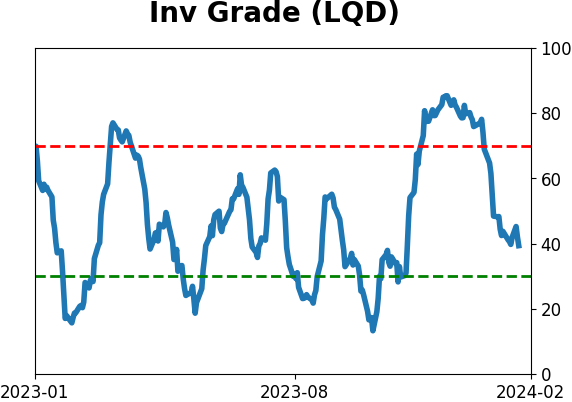
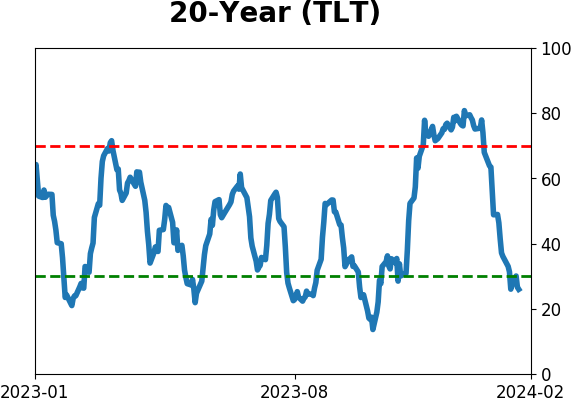
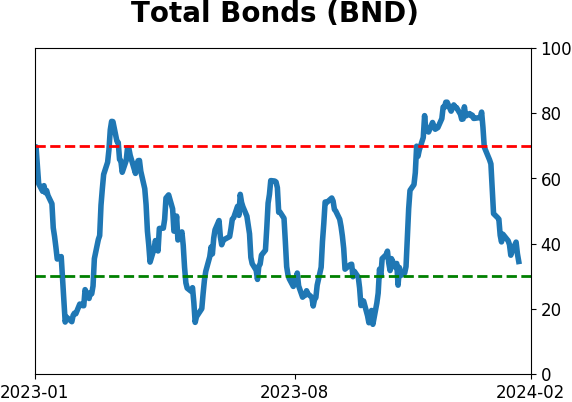
Bond ETF's - 10-Day Moving Average
|
|
|
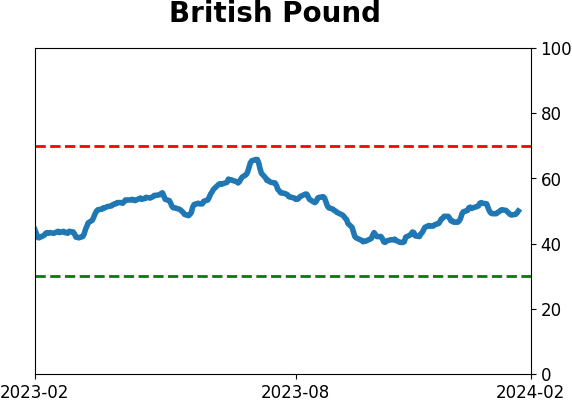
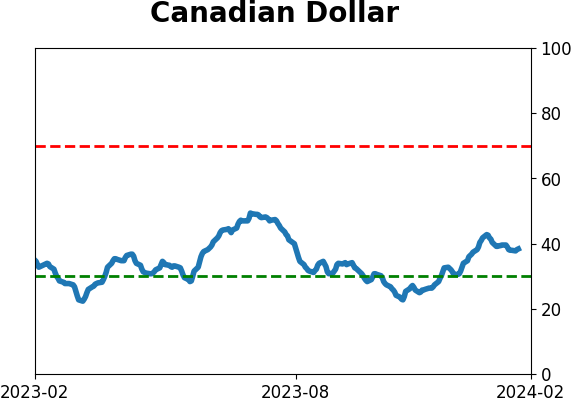
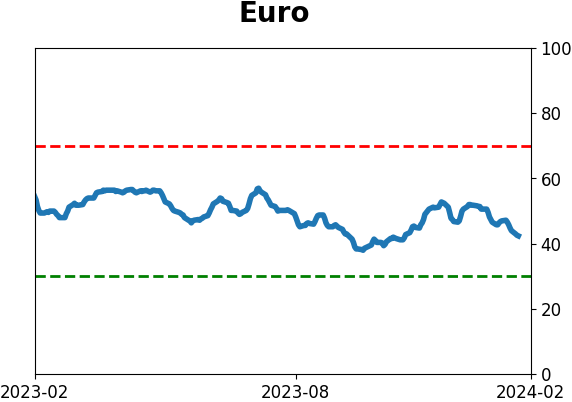
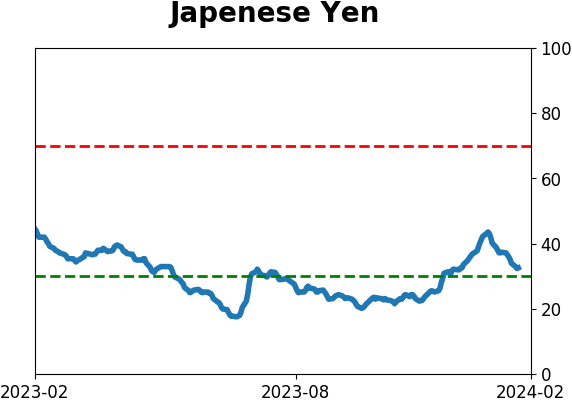
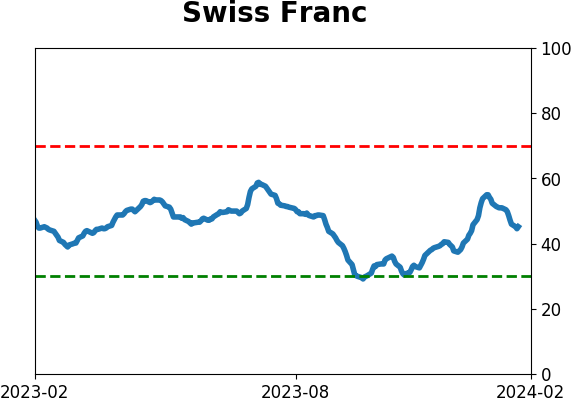
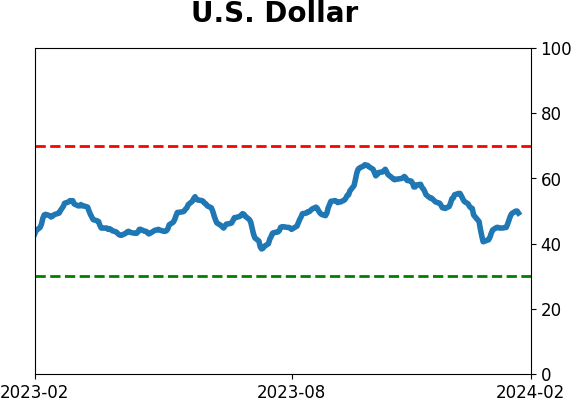
Currency ETF's - 5-Day Moving Average
|
|
|
Commodity ETF's - 5-Day Moving Average
|
|