Headlines
|
|
Gold's impressive run pushed mining stocks out of the doldrums:
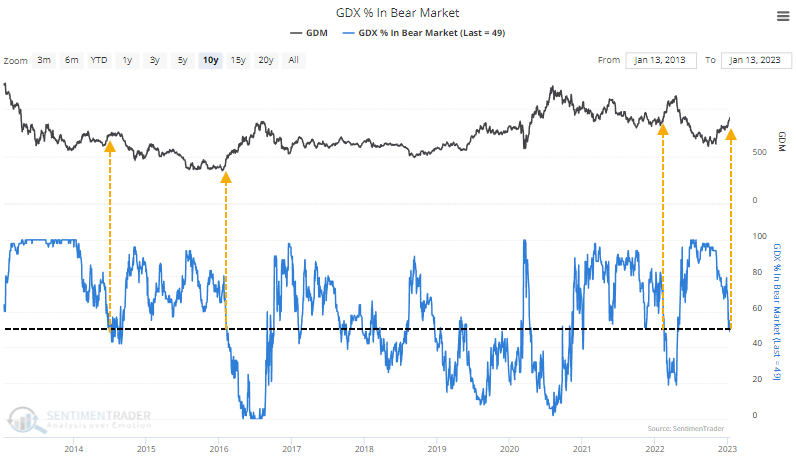
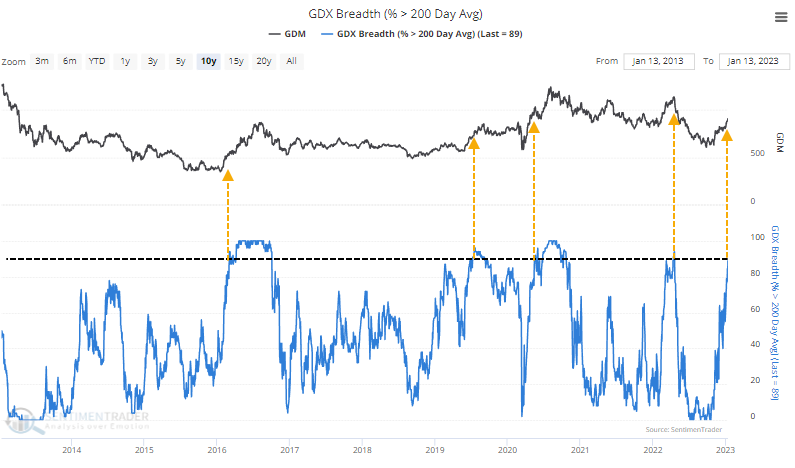
Gold mining stocks have recovered strongly. In recent weeks, nearly 90% of them climbed above their 200-day moving averages, causing fewer than half of them to be mired in bear markets. It's been tough for the stocks to hold this kind of momentum.
|
Smart / Dumb Money Confidence
|
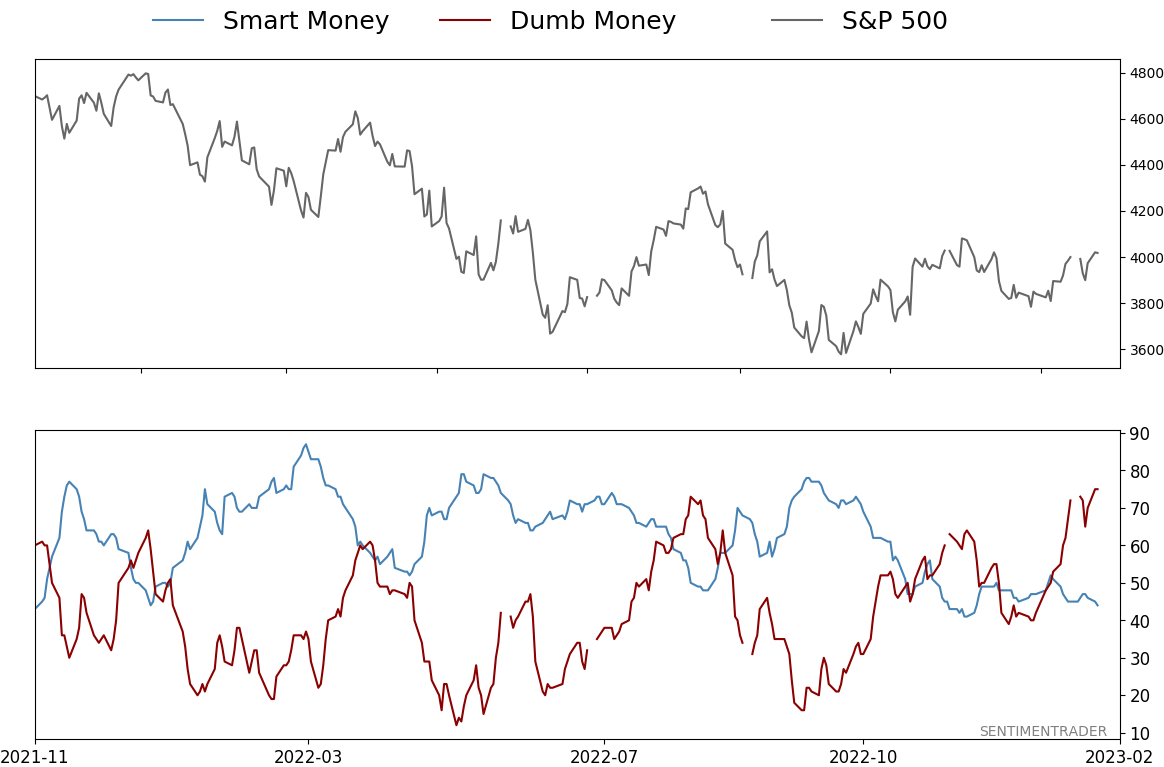
Smart Money Confidence: 44%
Dumb Money Confidence: 75%
|
|
Risk Levels
Stocks Short-Term
|
Stocks Medium-Term
|
|
Bonds
|
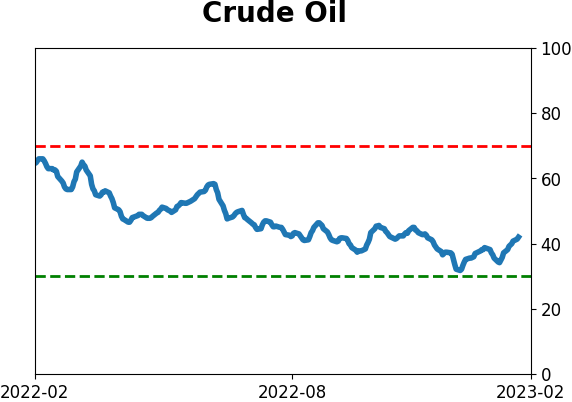
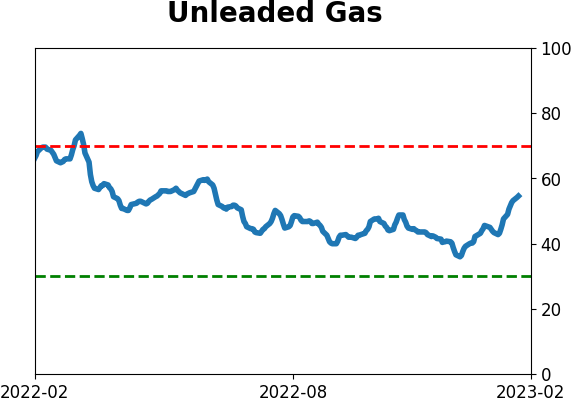
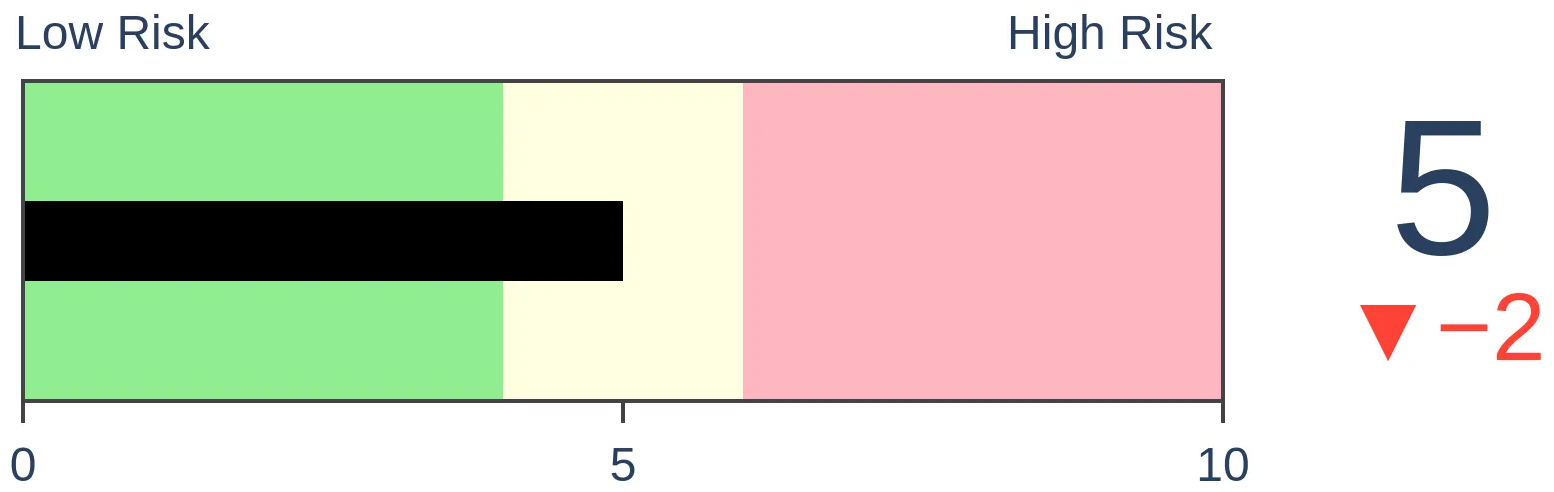
Crude Oil
|
|
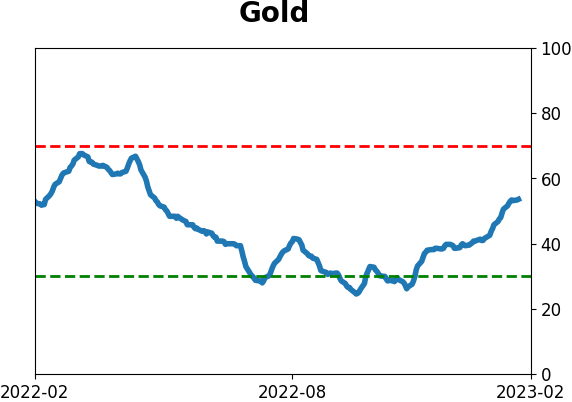
Gold

|
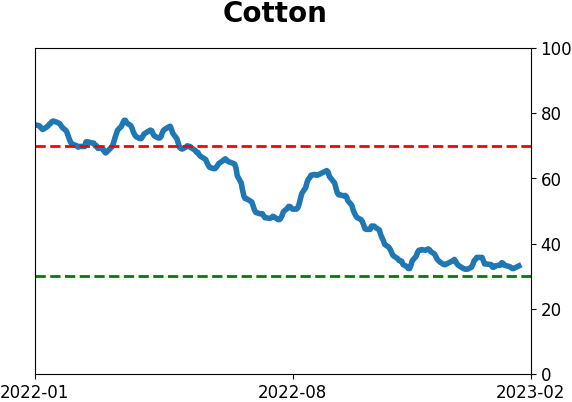
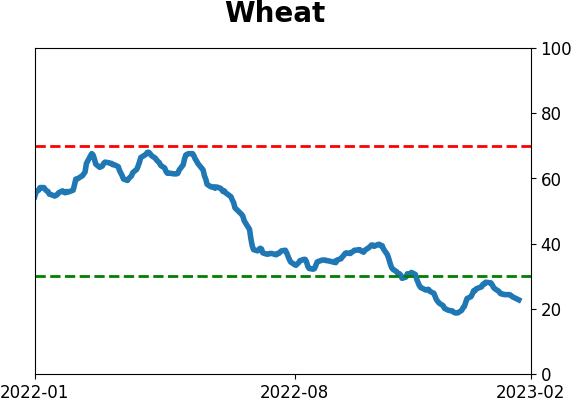
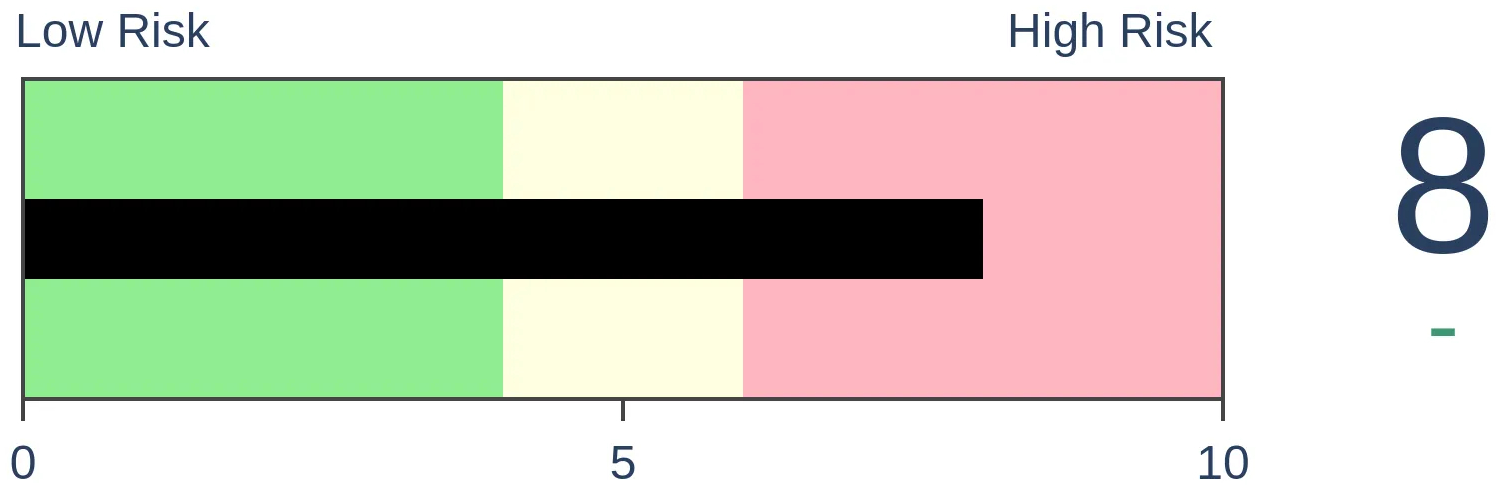
Agriculture
|
|
Research
By Jason Goepfert
BOTTOM LINE
Gold mining stocks have recovered strongly. In recent weeks, nearly 90% of them climbed above their 200-day moving averages, causing fewer than half of them to be mired in bear markets. It's been tough for the stocks to hold this kind of momentum.
FORECAST / TIMEFRAME
None
|
Key points:
- Fewer than half of gold mining stocks are now mired in bear markets
- Nearly 90% of them have managed to close above their long-term trendlines
- After similar recoveries, forward returns in the sector were mixed, though modestly positive over the medium-term
Gold mining stocks have staged an impressive recovery
On Monday, we saw that gold had rallied even more than the S&P 500 since the latter bottomed in October. As gold goes, so do gold mining stocks, and they have likewise had a fantastic run.
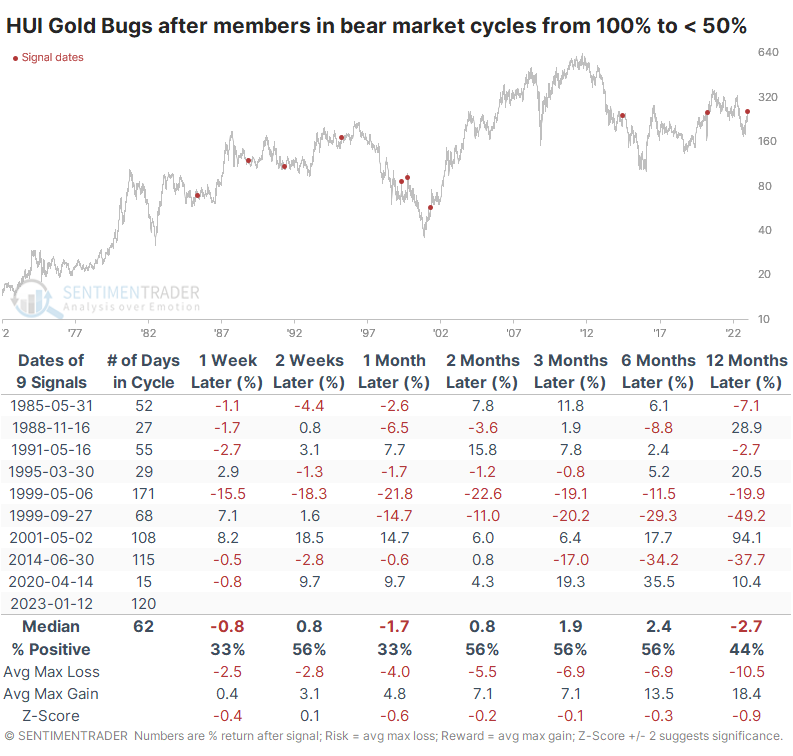
For the first time in months, the percentage of miners in a bear market has plunged below 50%. That's down by half since they bottomed last year. The last few times it cycled from all, or nearly all, miners in bear markets to fewer than half of them, the stocks showed mixed returns in the months ahead.
Holding upside momentum has always been challenging in this feast and (mostly) famine market. When there have been similar cycles over the past 50 years, miners showed mostly below-average returns in the future. They did gain more than lose over the next 2-6 months, but the losing signals were substantial.
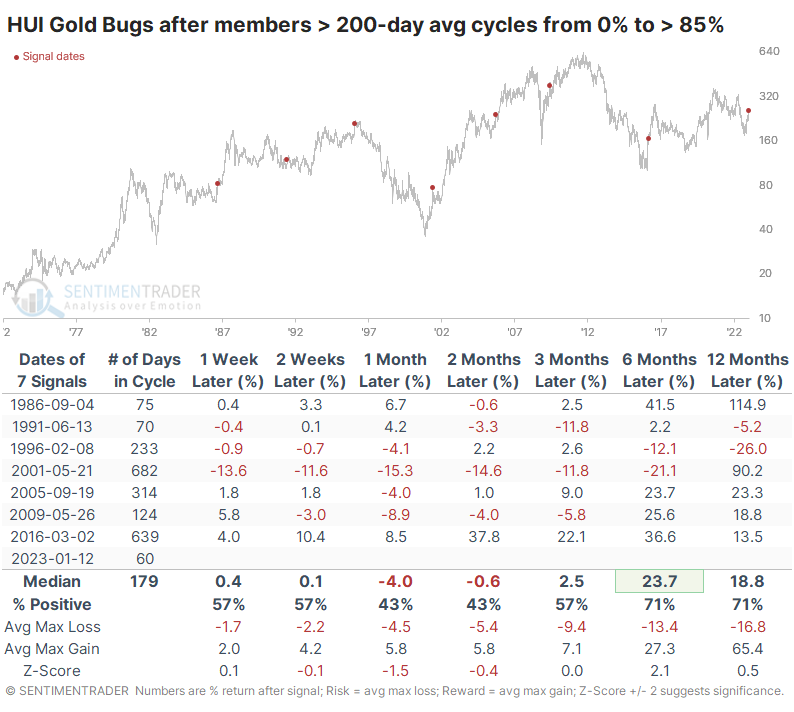
The ability of more and more mining stocks to climb to within 20% of their previous 52-week high necessarily means more of them have overtaken their 200-day moving averages. Recently, it nearly reached 90% of stocks.
Again, it has been difficult for miners to hold gains after similar behavior, though returns were better than in the previous study. Over the next six months, the HUI Gold Bugs Index rallied after five of the seven signals, with an impressive average return. But the two losers were significant.
What the research tells us...
Gold mining stocks have gone on a couple of nice runs over the past 50 years, but most of the time, they struggle. That's especially the case after bouts of upside momentum. When the sector cycled from extreme depths of selling pressure, like in 2022, and recovered, their forward prospects were mixed. The medium-term looks okay, especially if gold follows through on its recent gains, as noted on Monday. But there isn't a lot in the data that suggests a heavily overweight position is a high-probability opportunity.
Indicators at Extremes
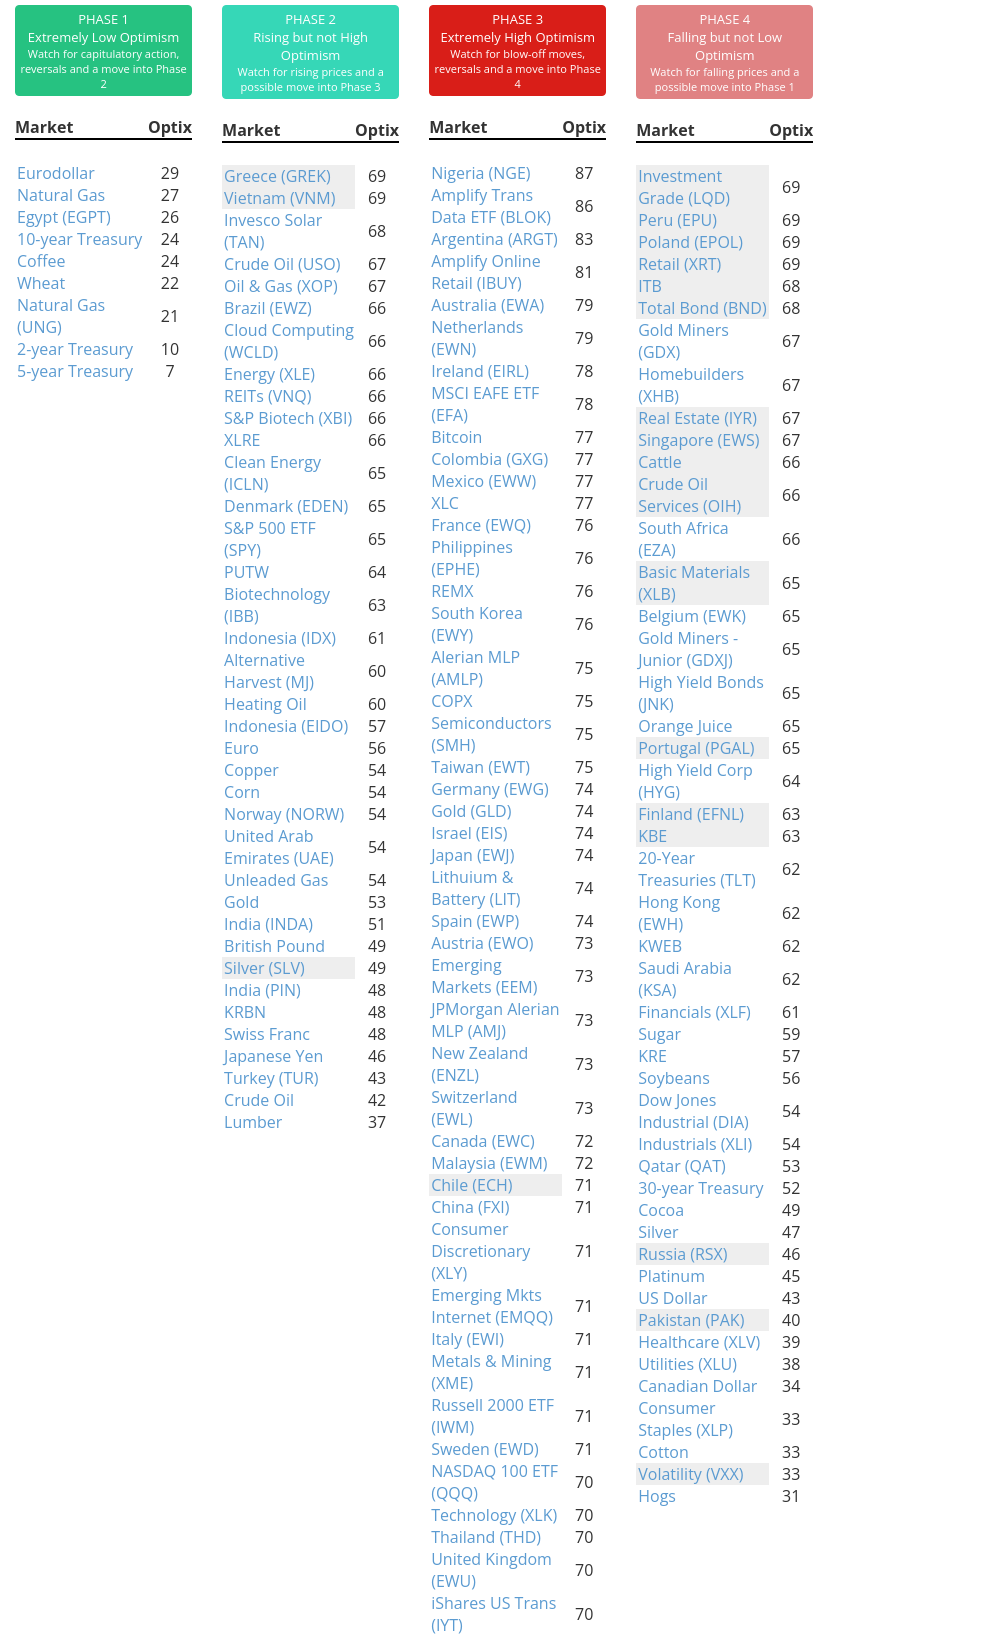
Phase Table
Ranks
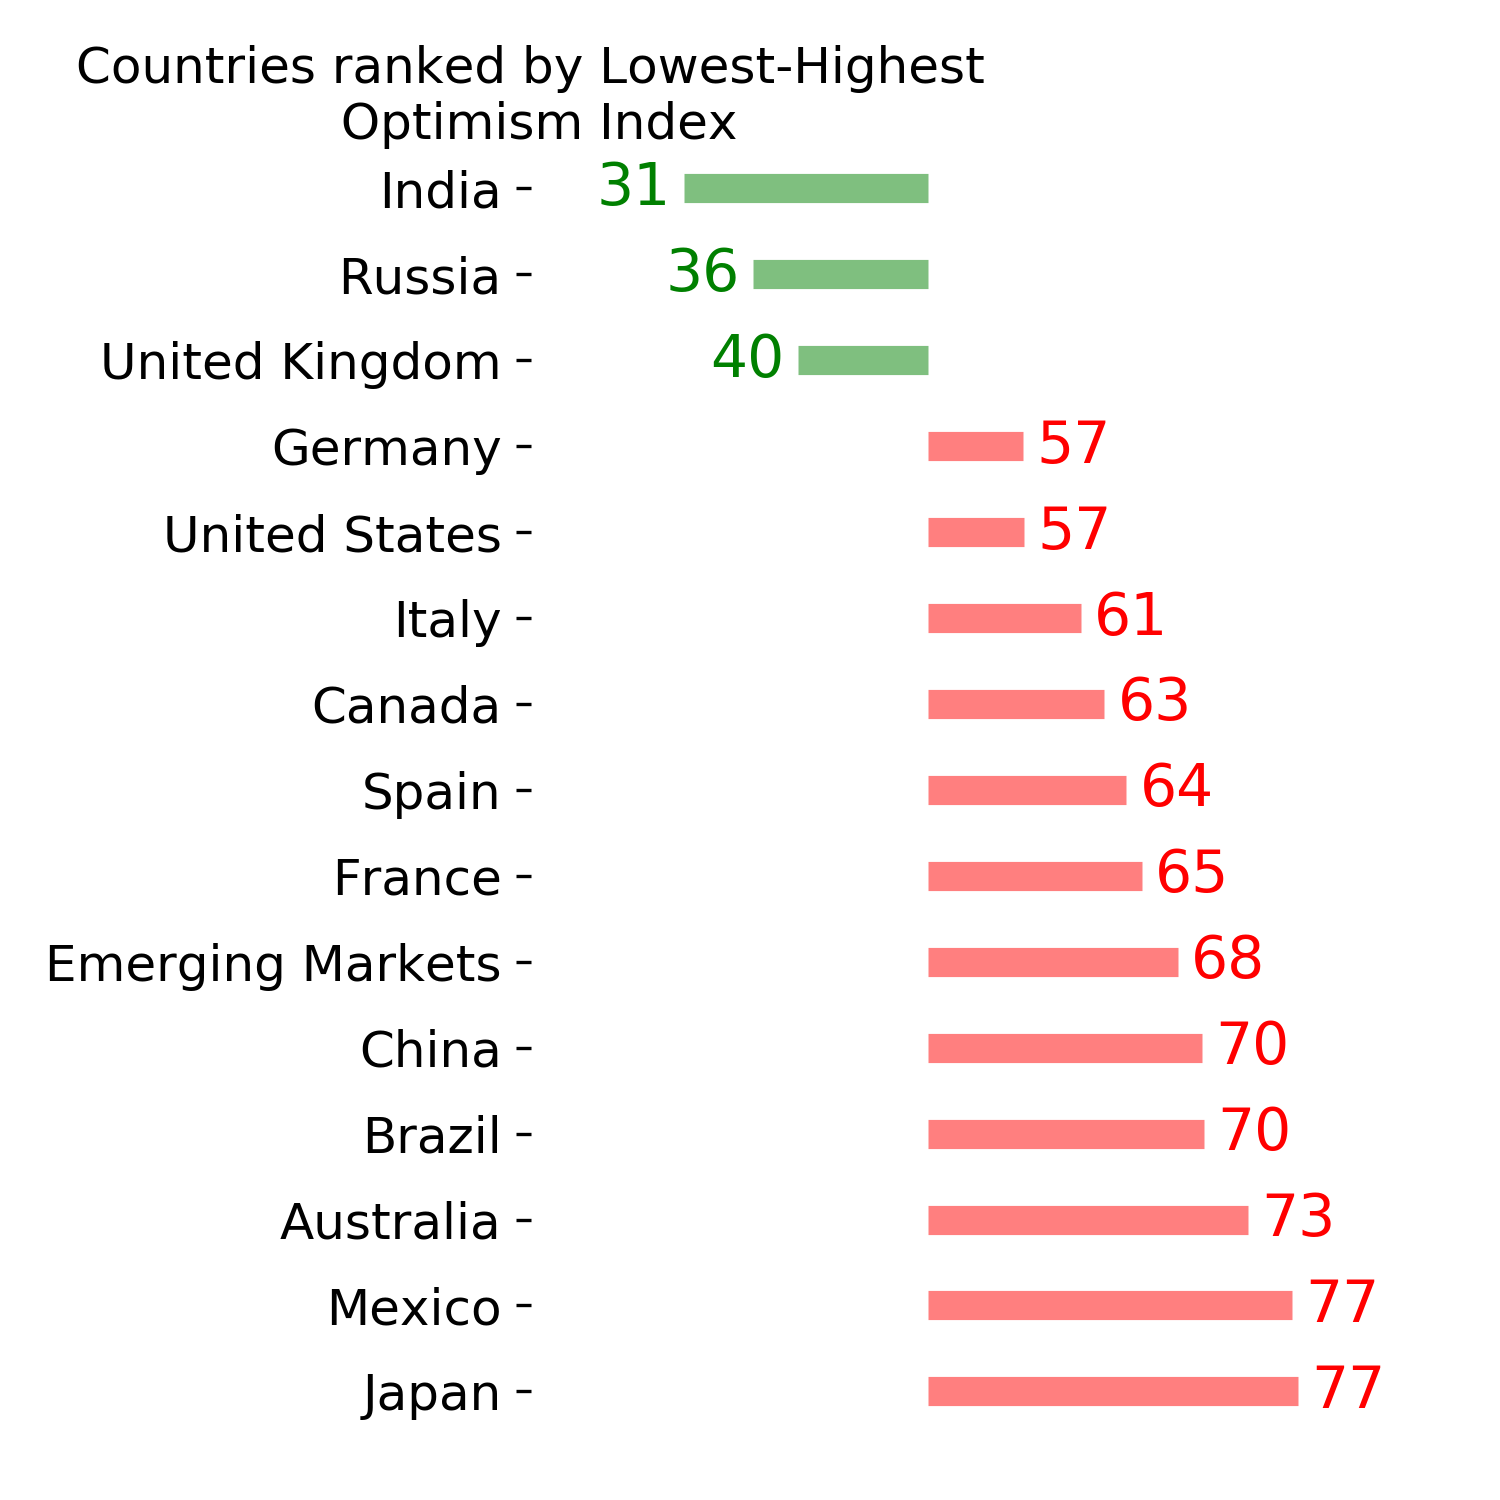
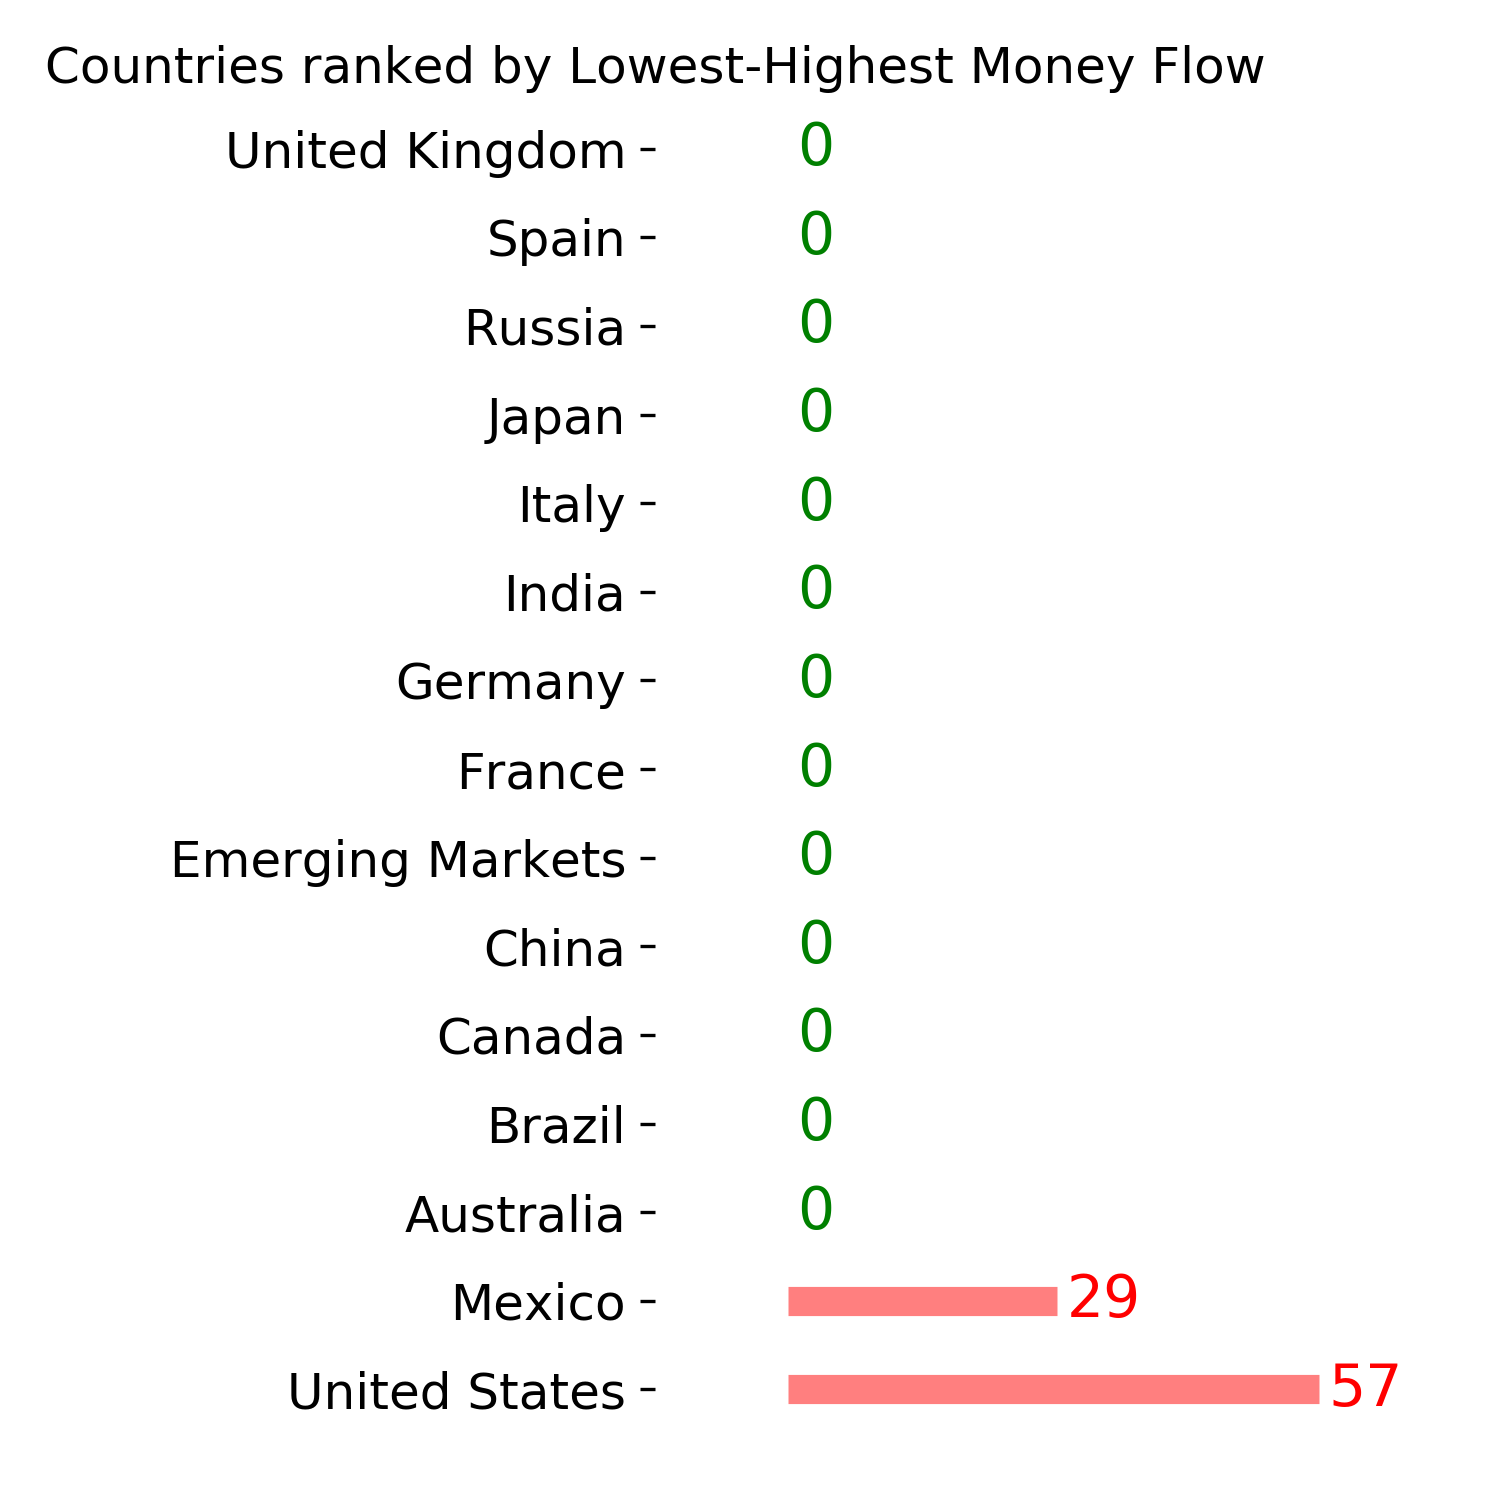
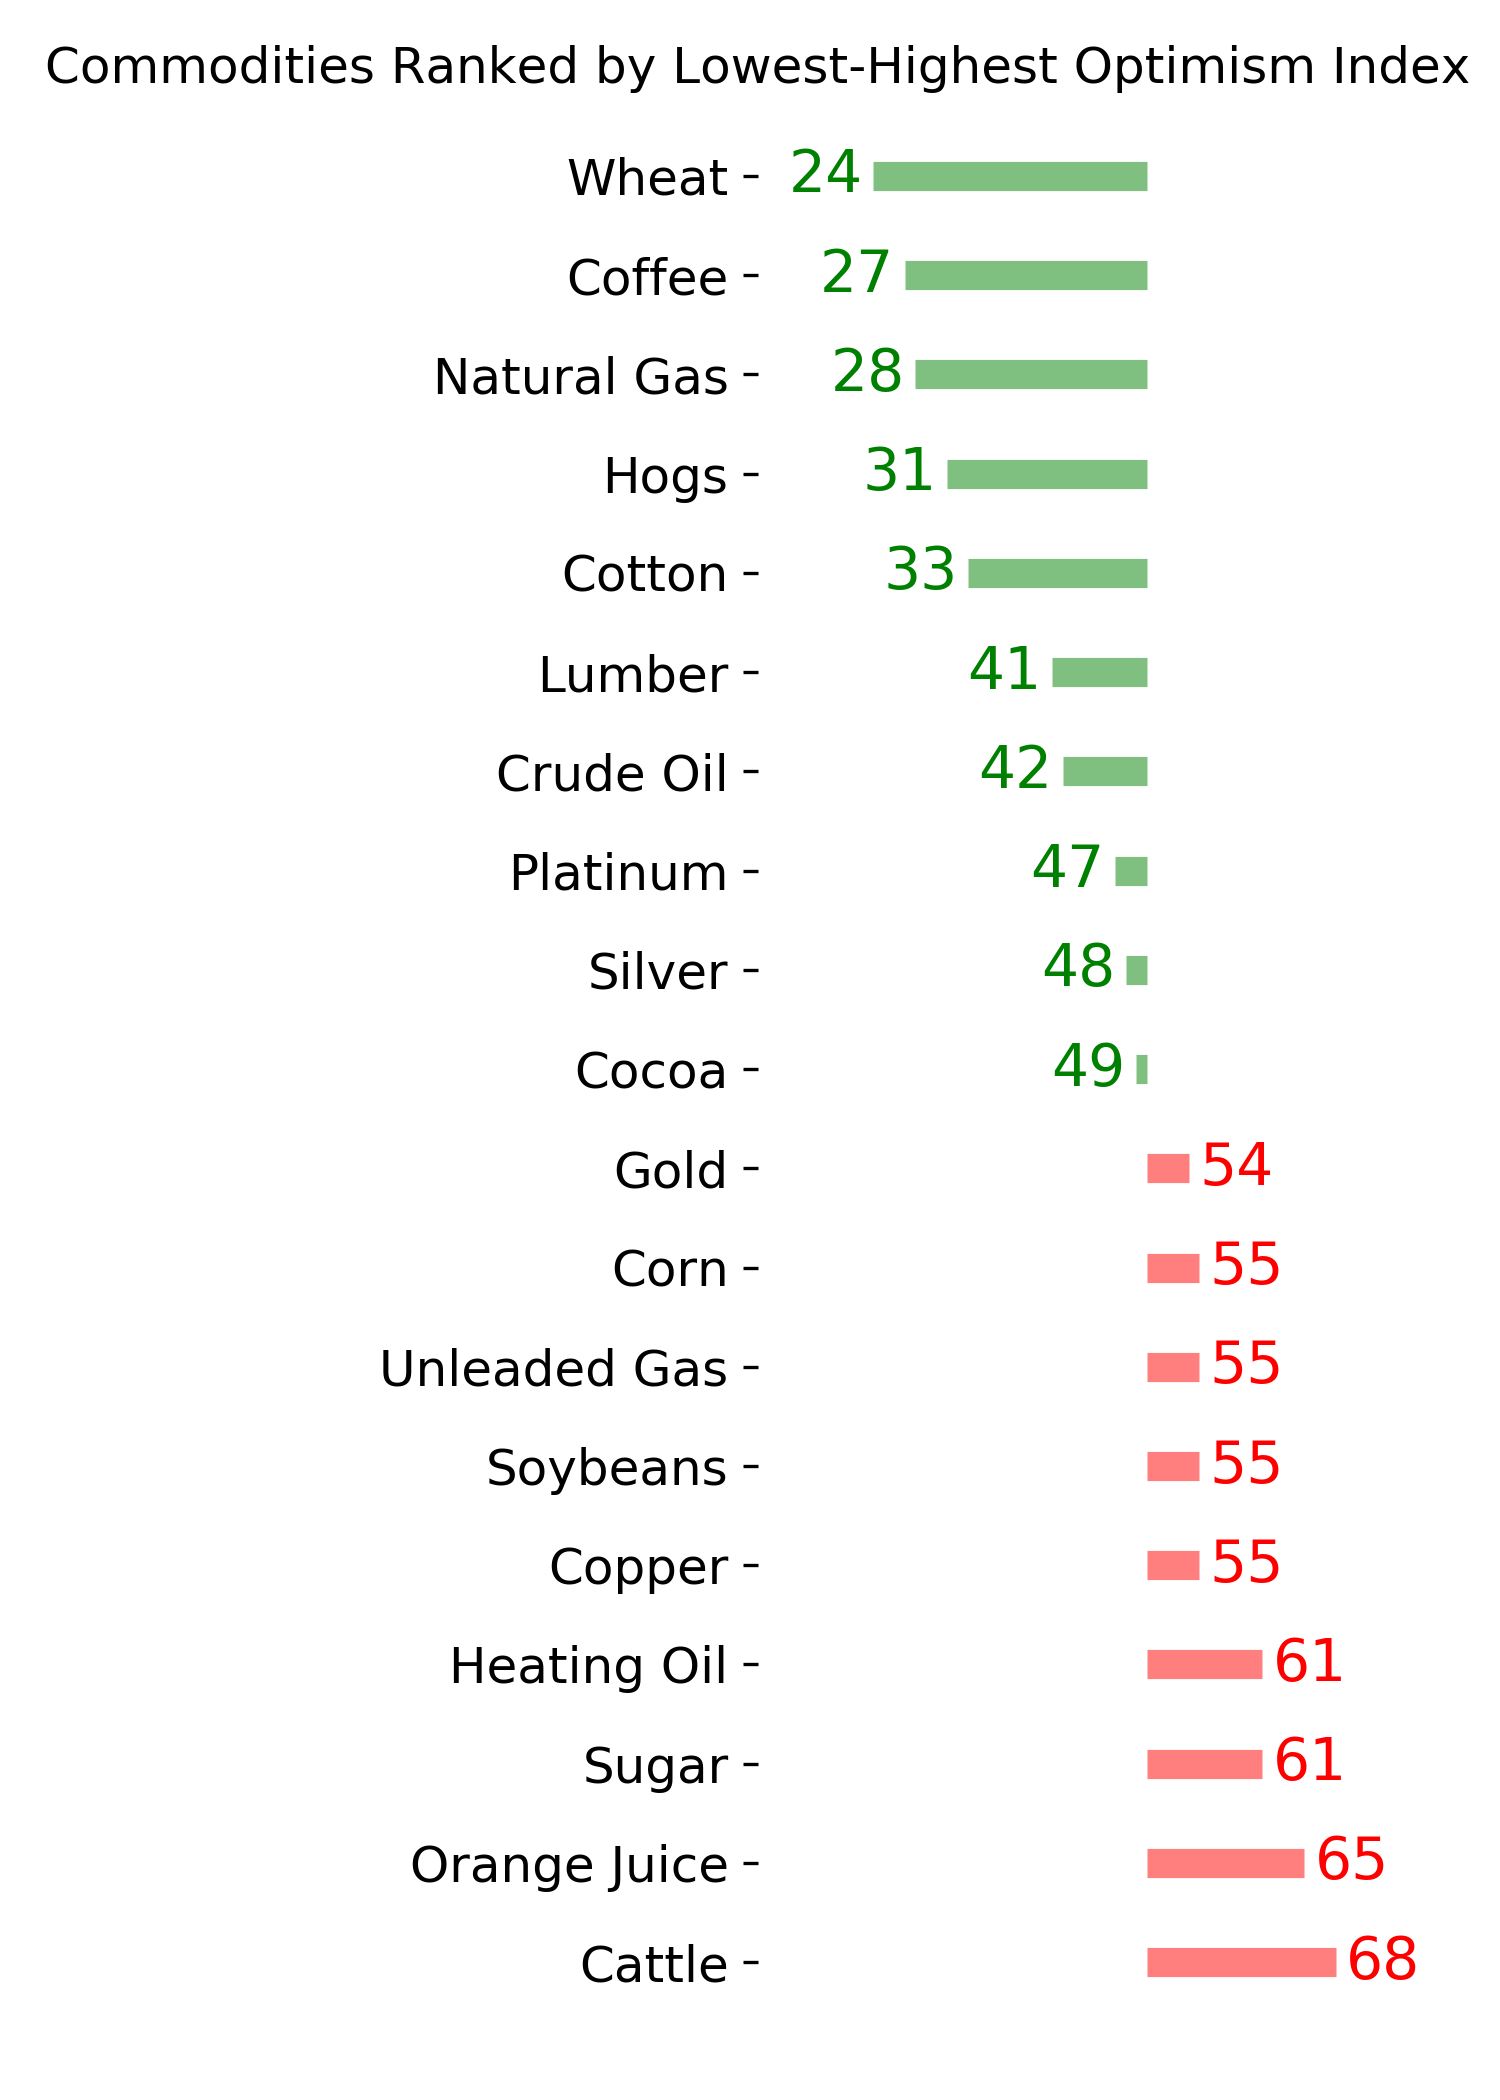
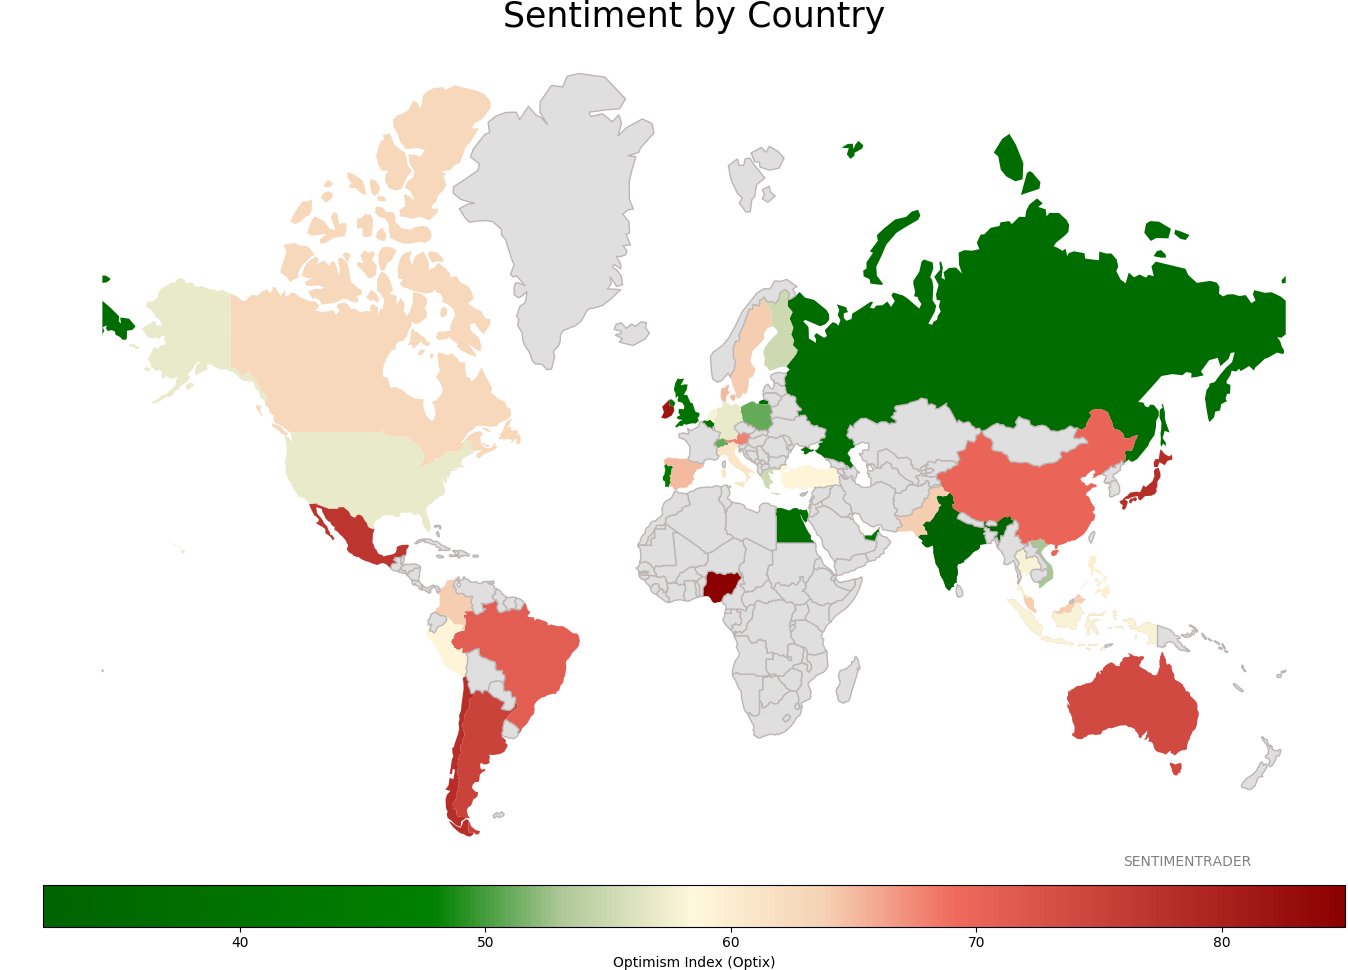
Sentiment Around The World
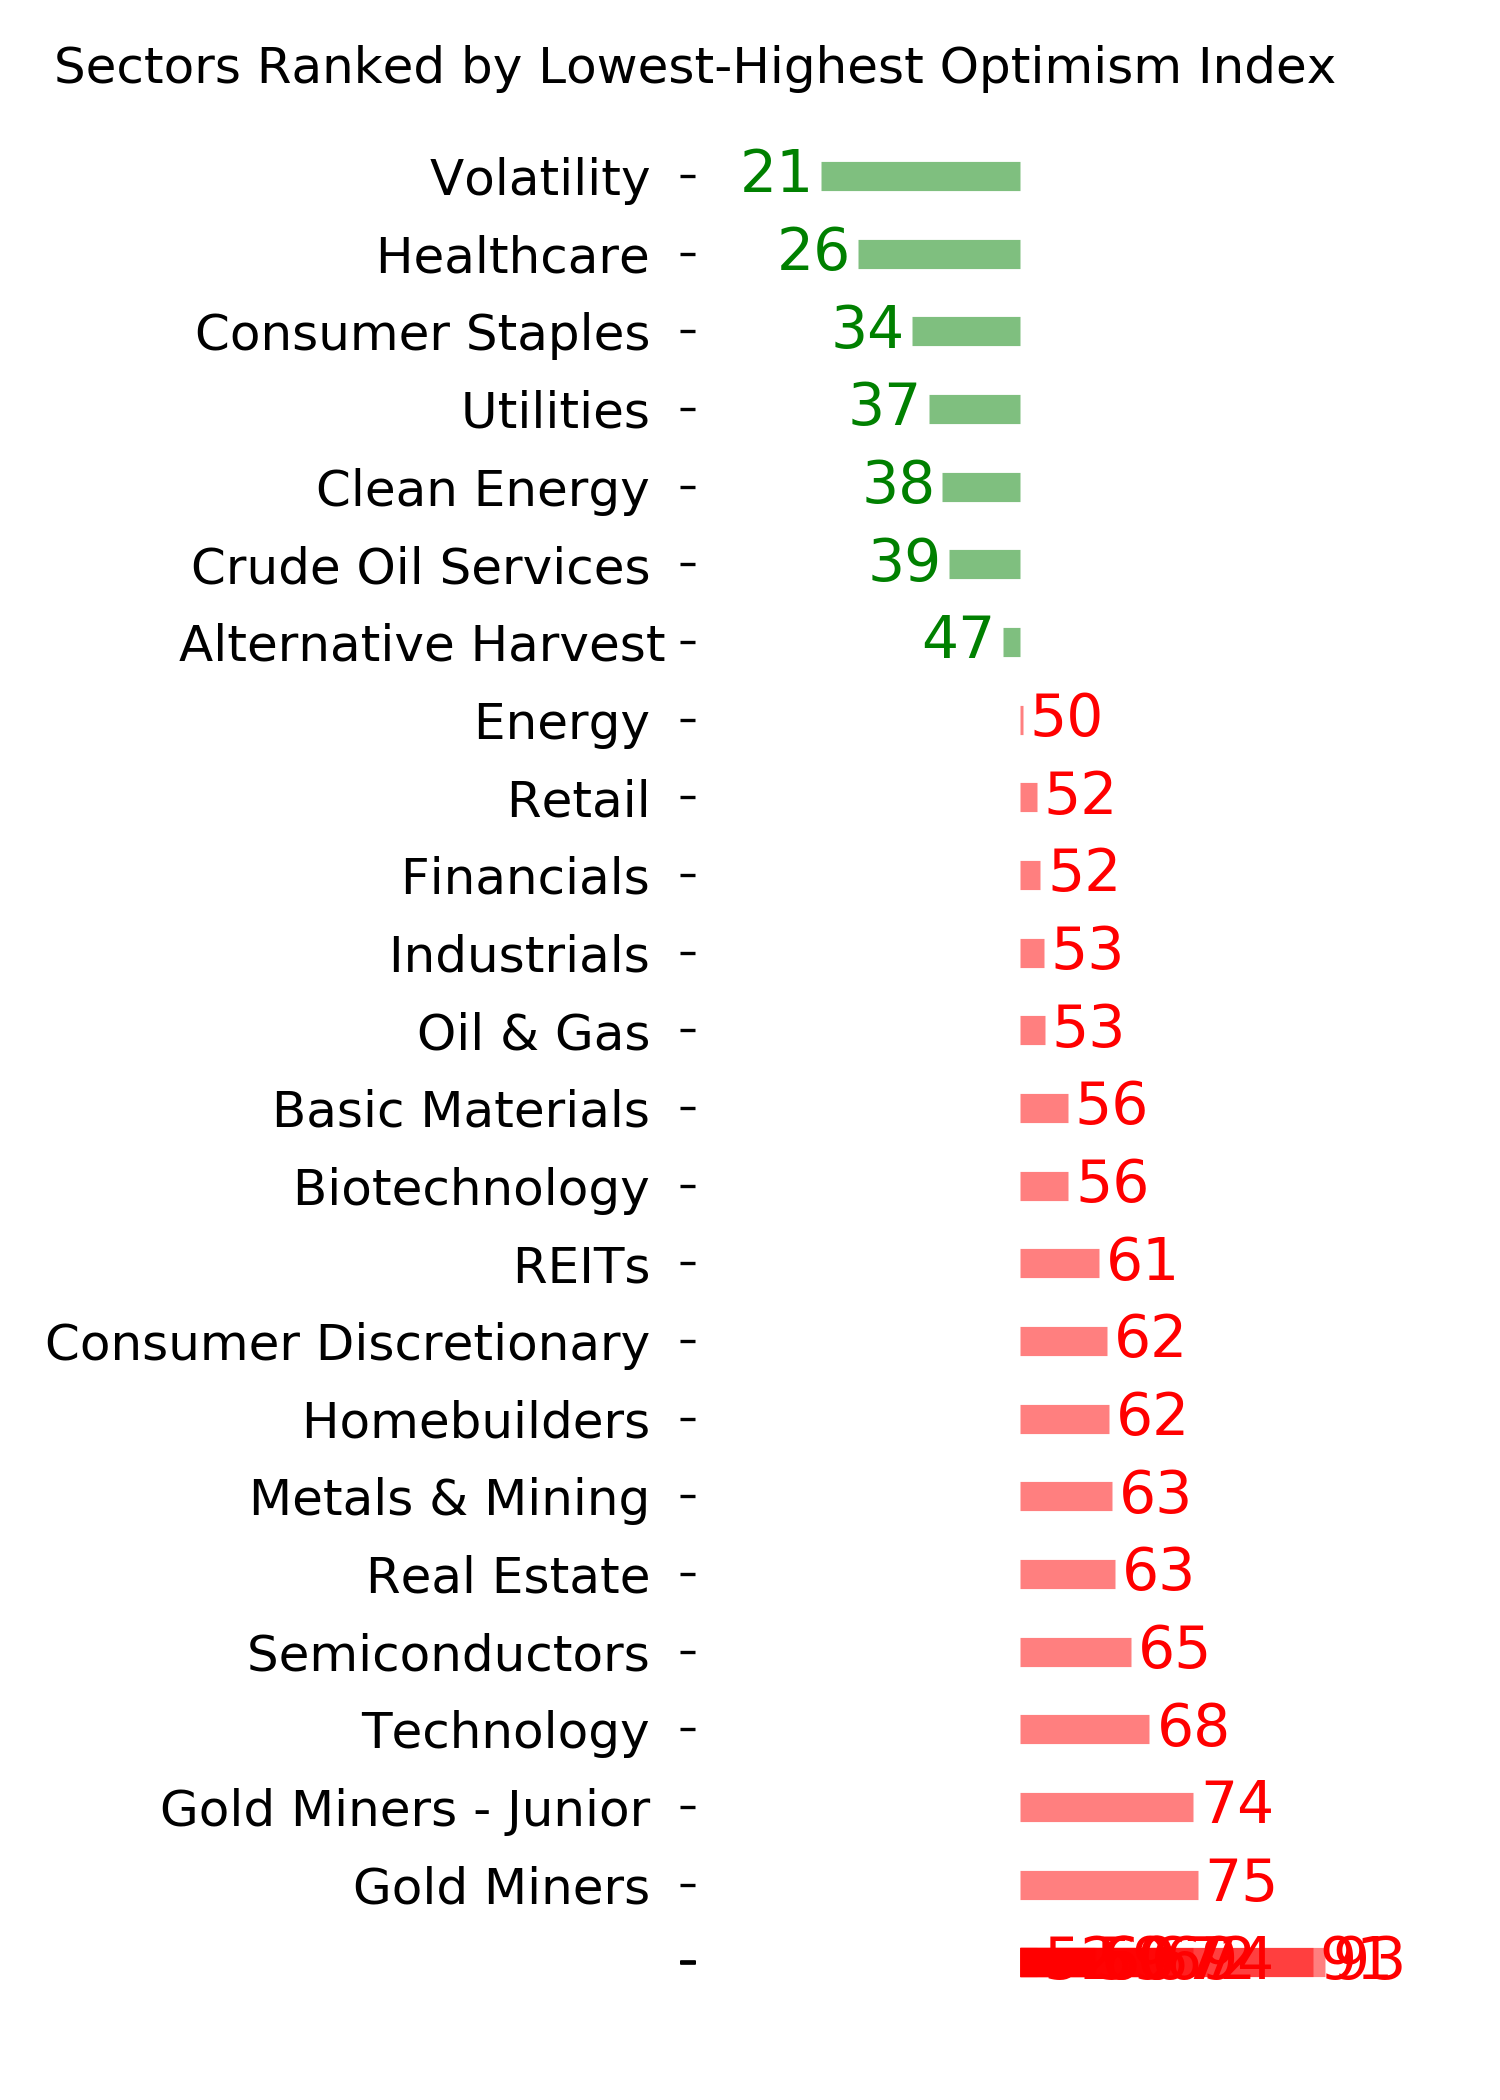
Optimism Index Thumbnails
|
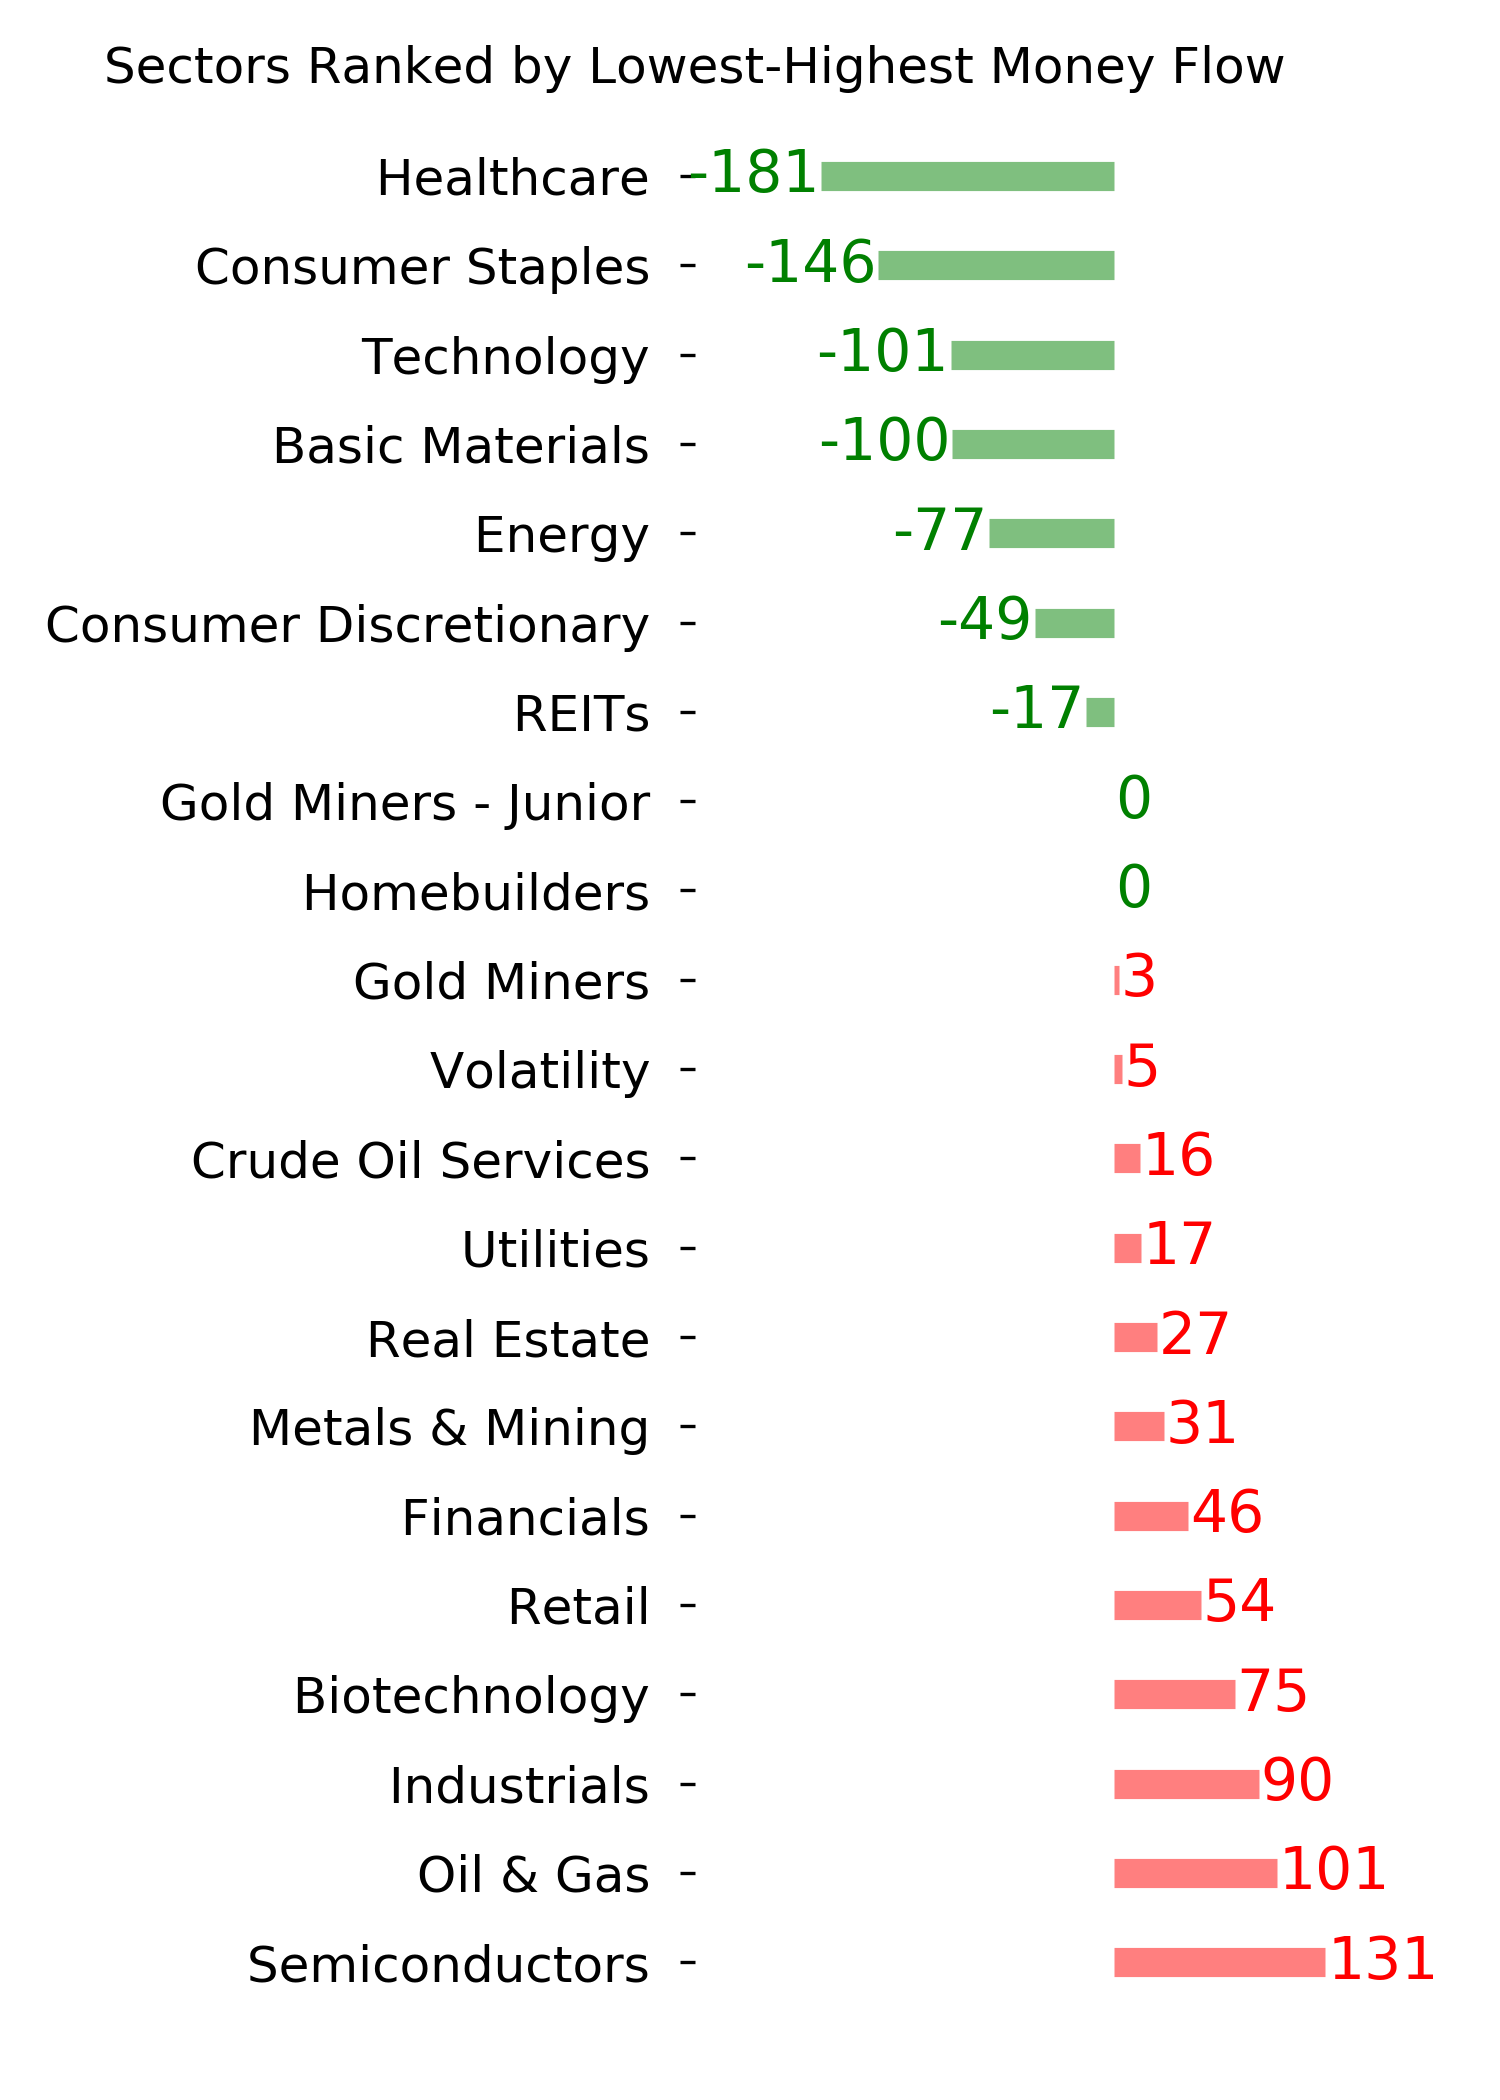
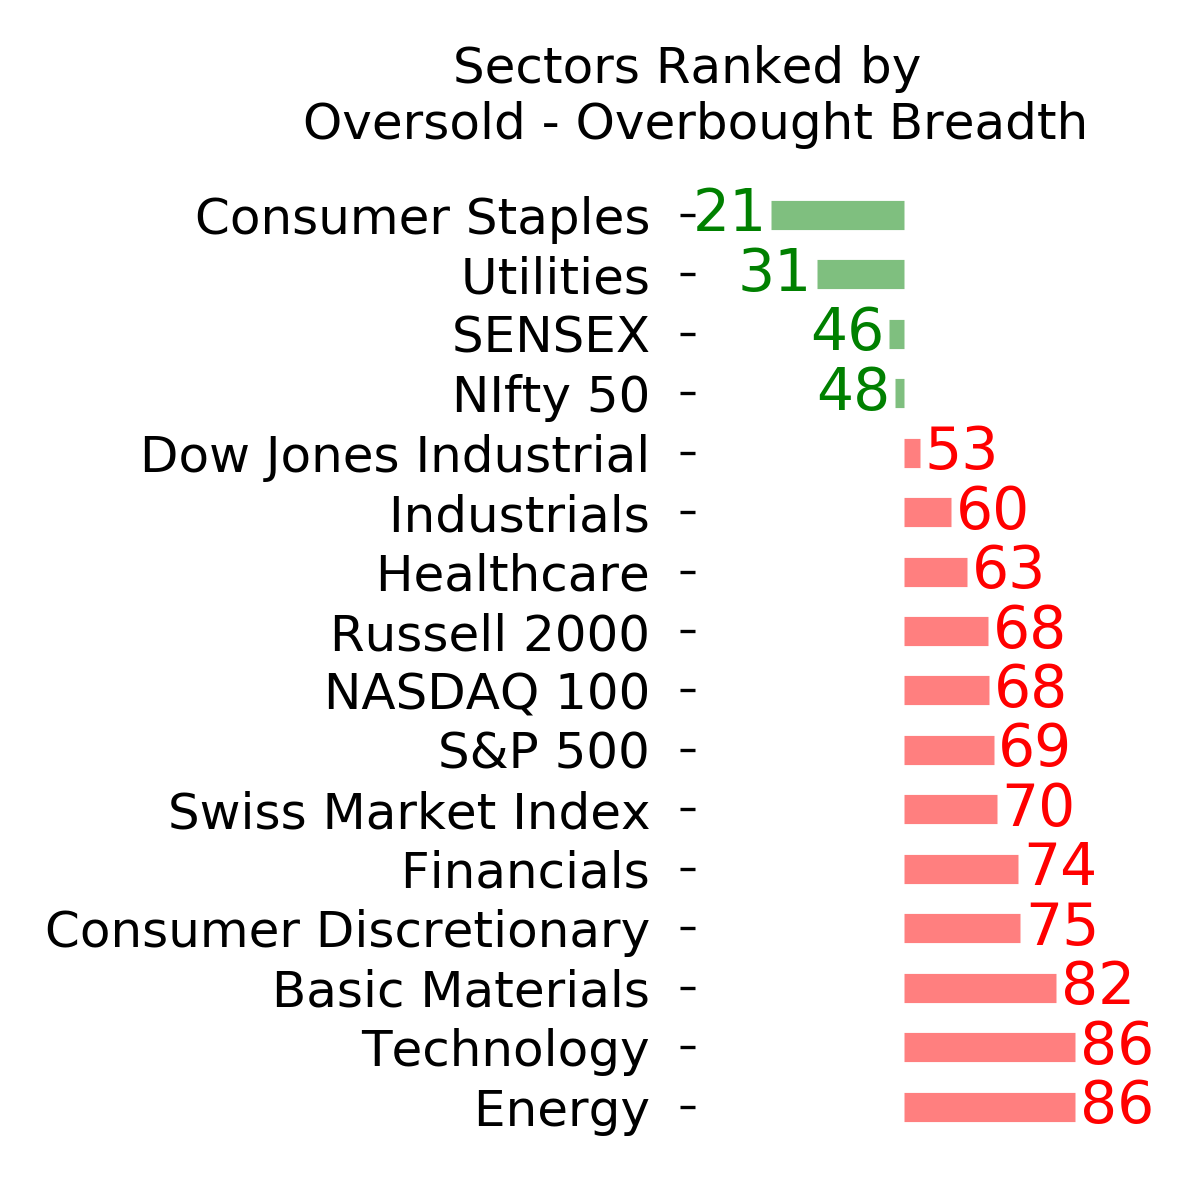
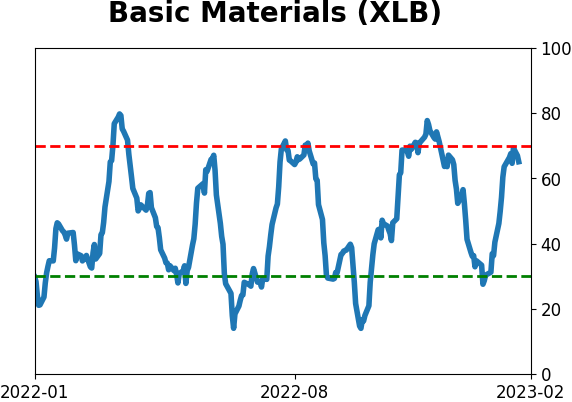
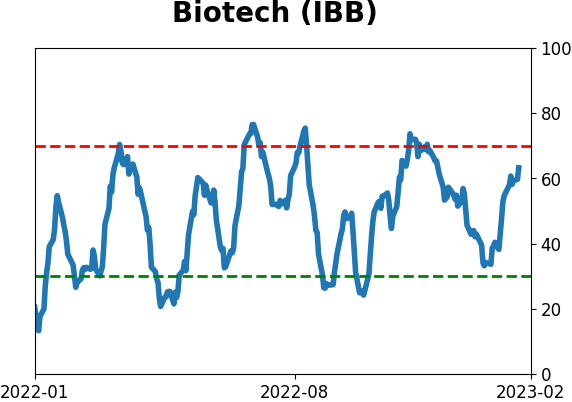
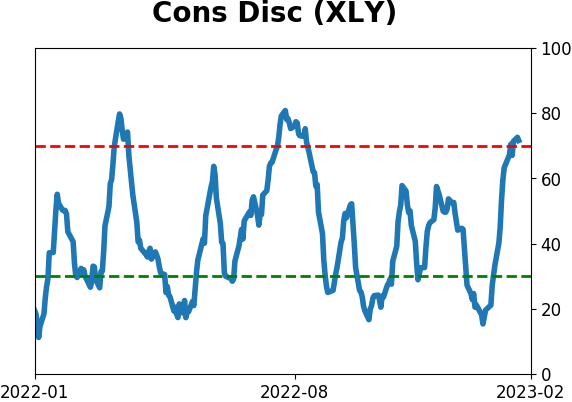
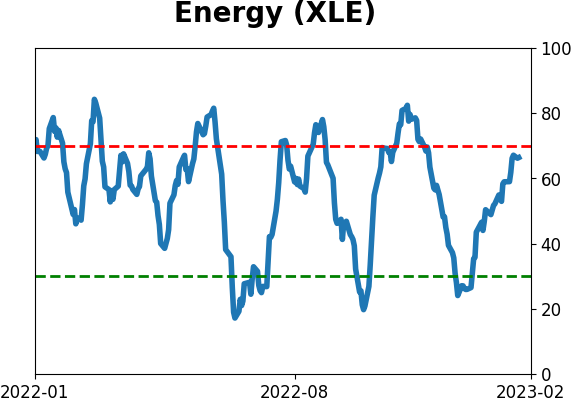
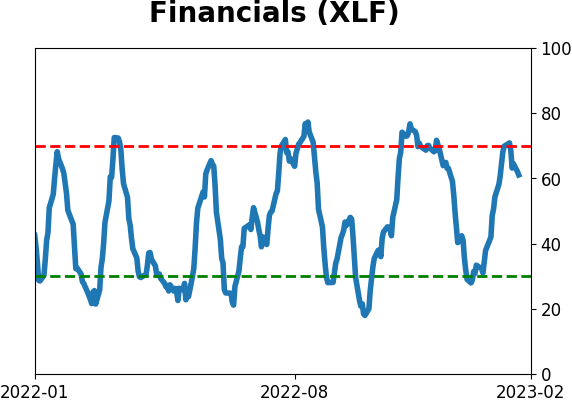
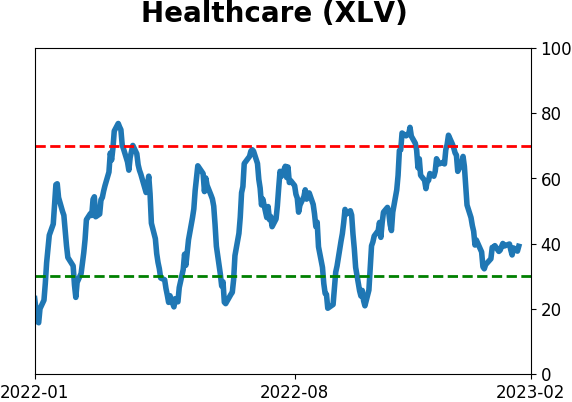
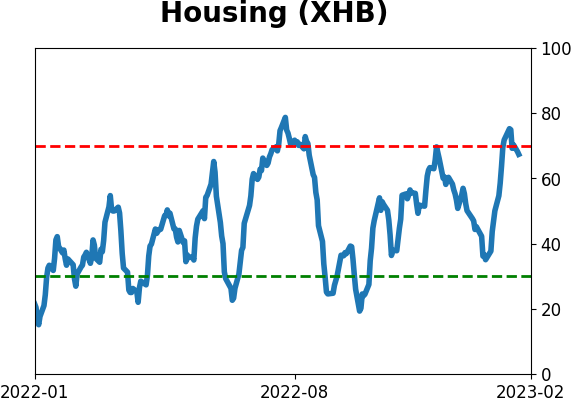
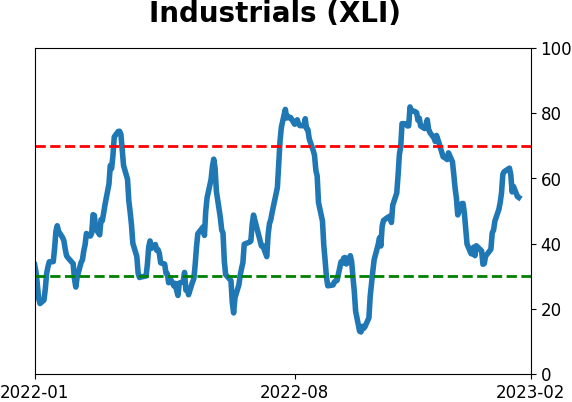
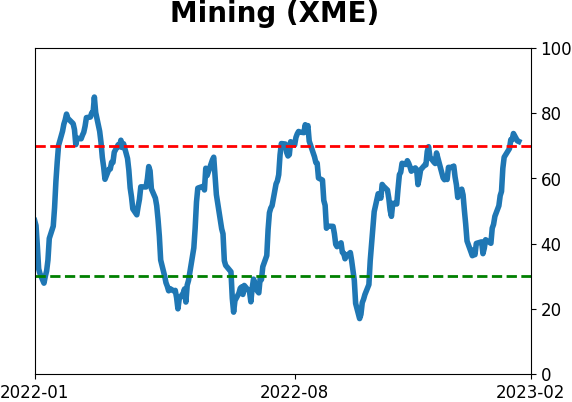
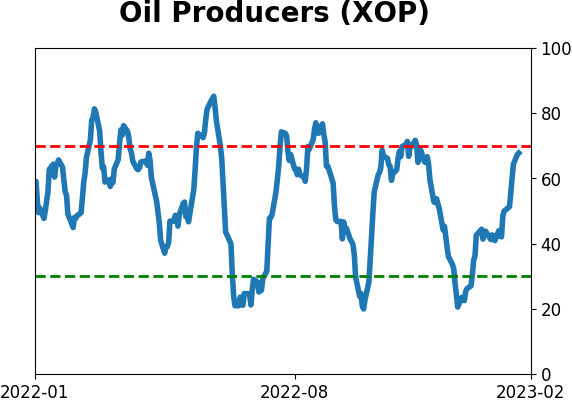
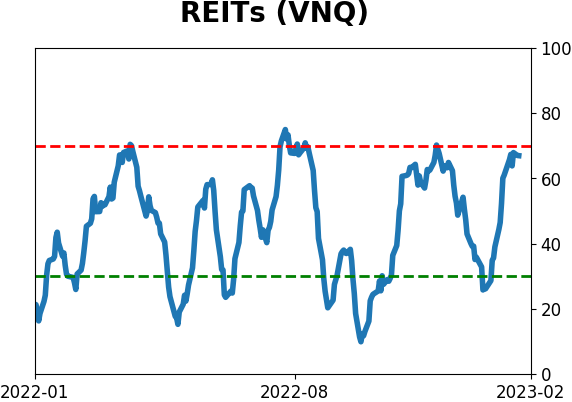
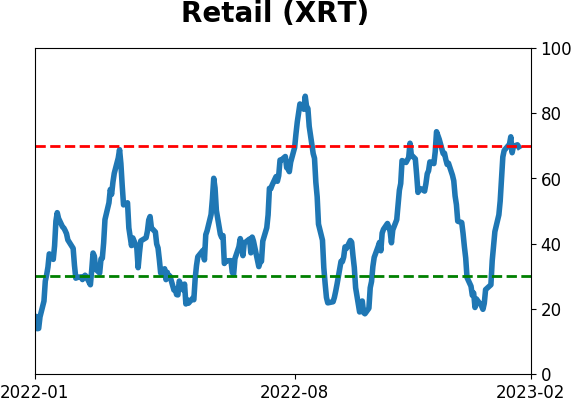
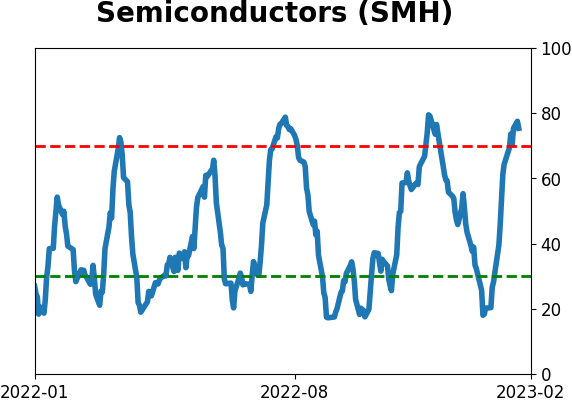
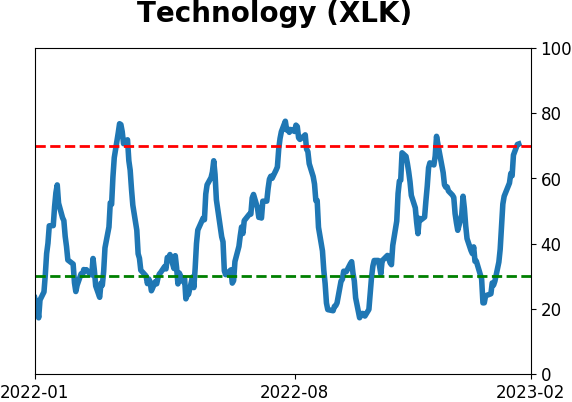
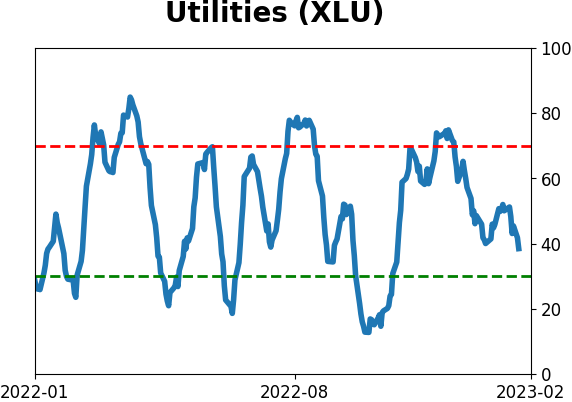
Sector ETF's - 10-Day Moving Average
|
|
|
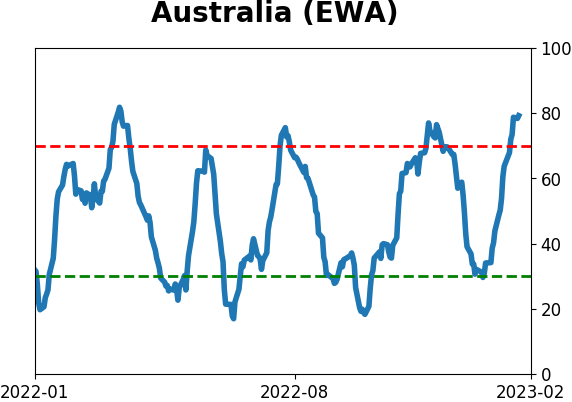
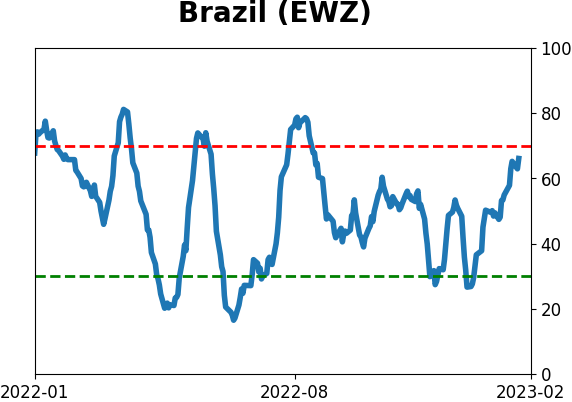
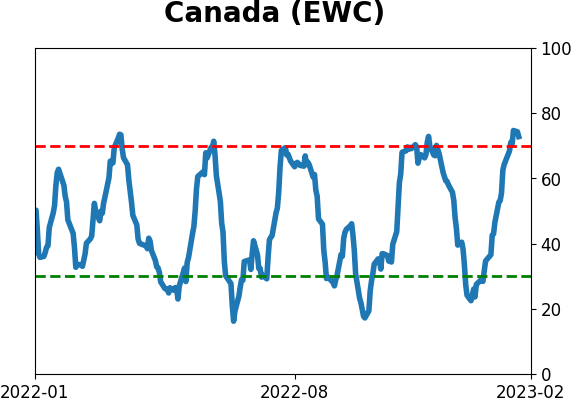
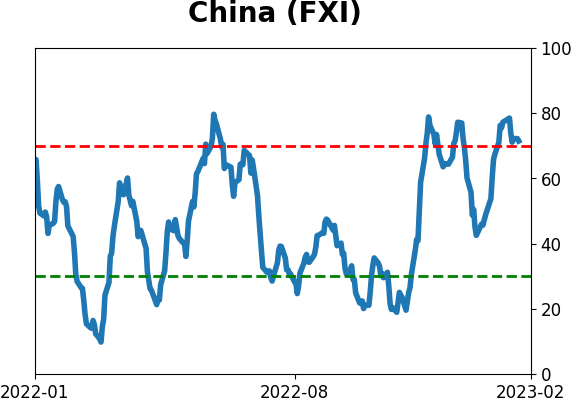
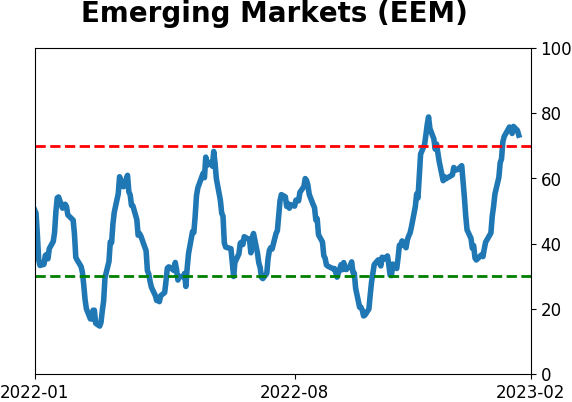
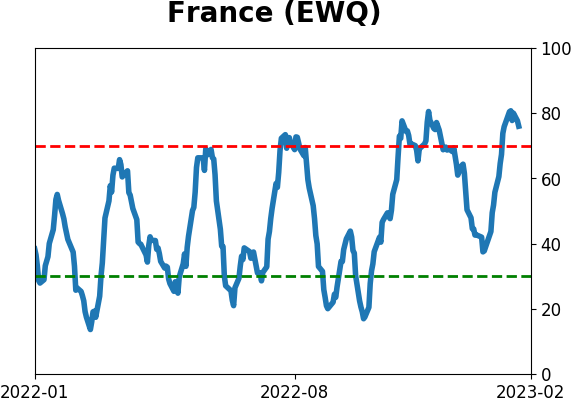
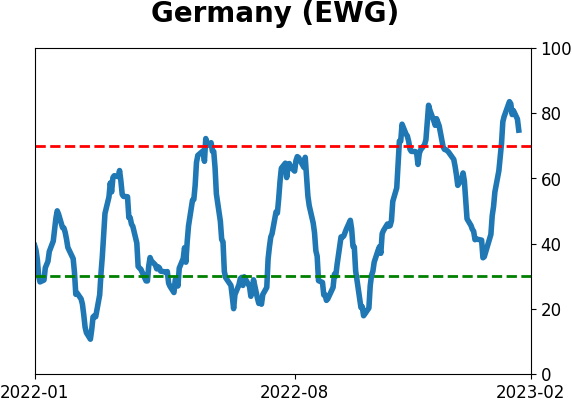
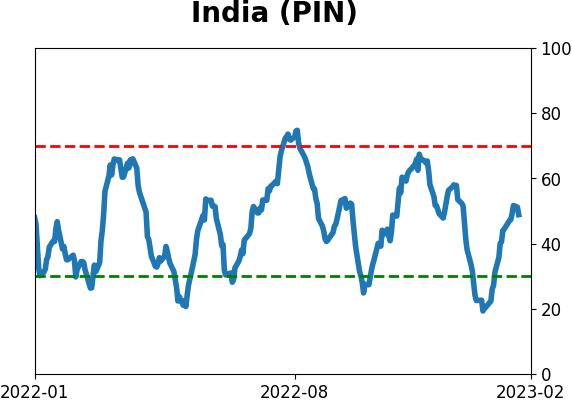
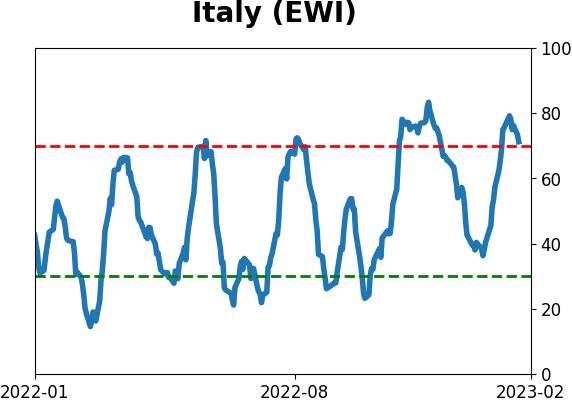
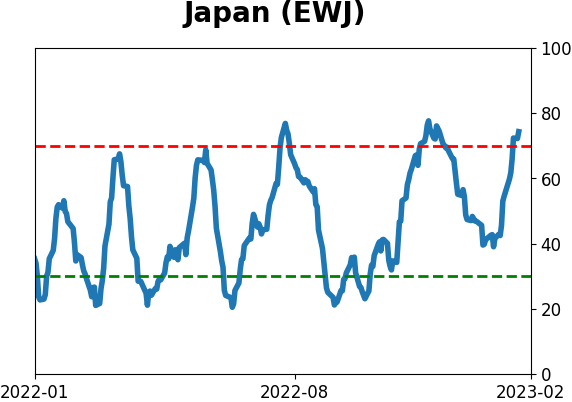
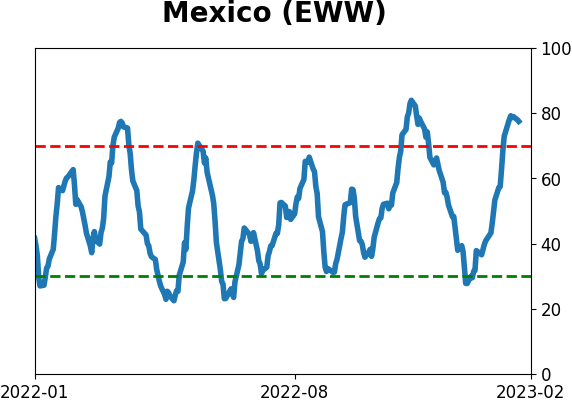
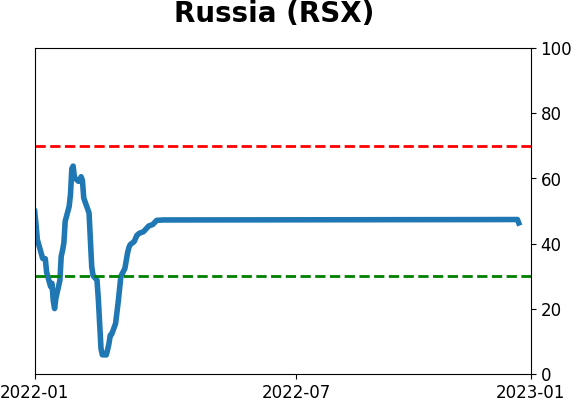
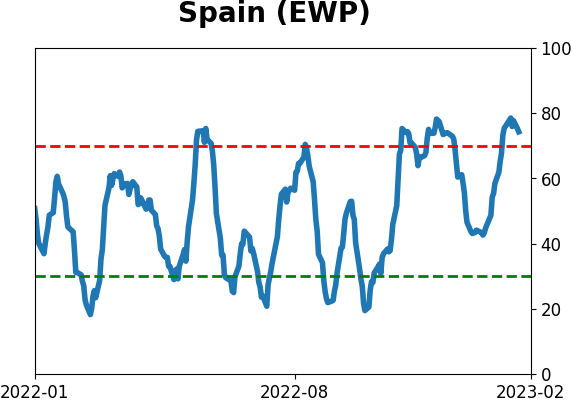
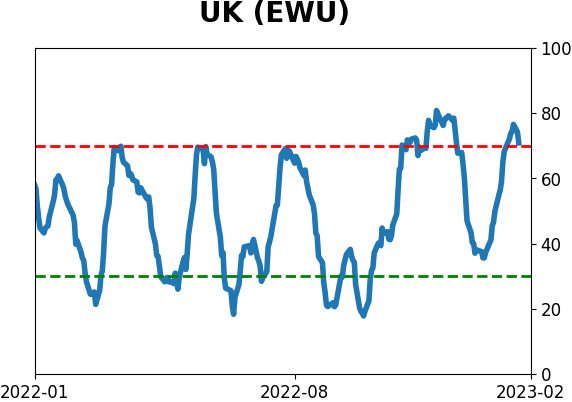
Country ETF's - 10-Day Moving Average
|
|
|
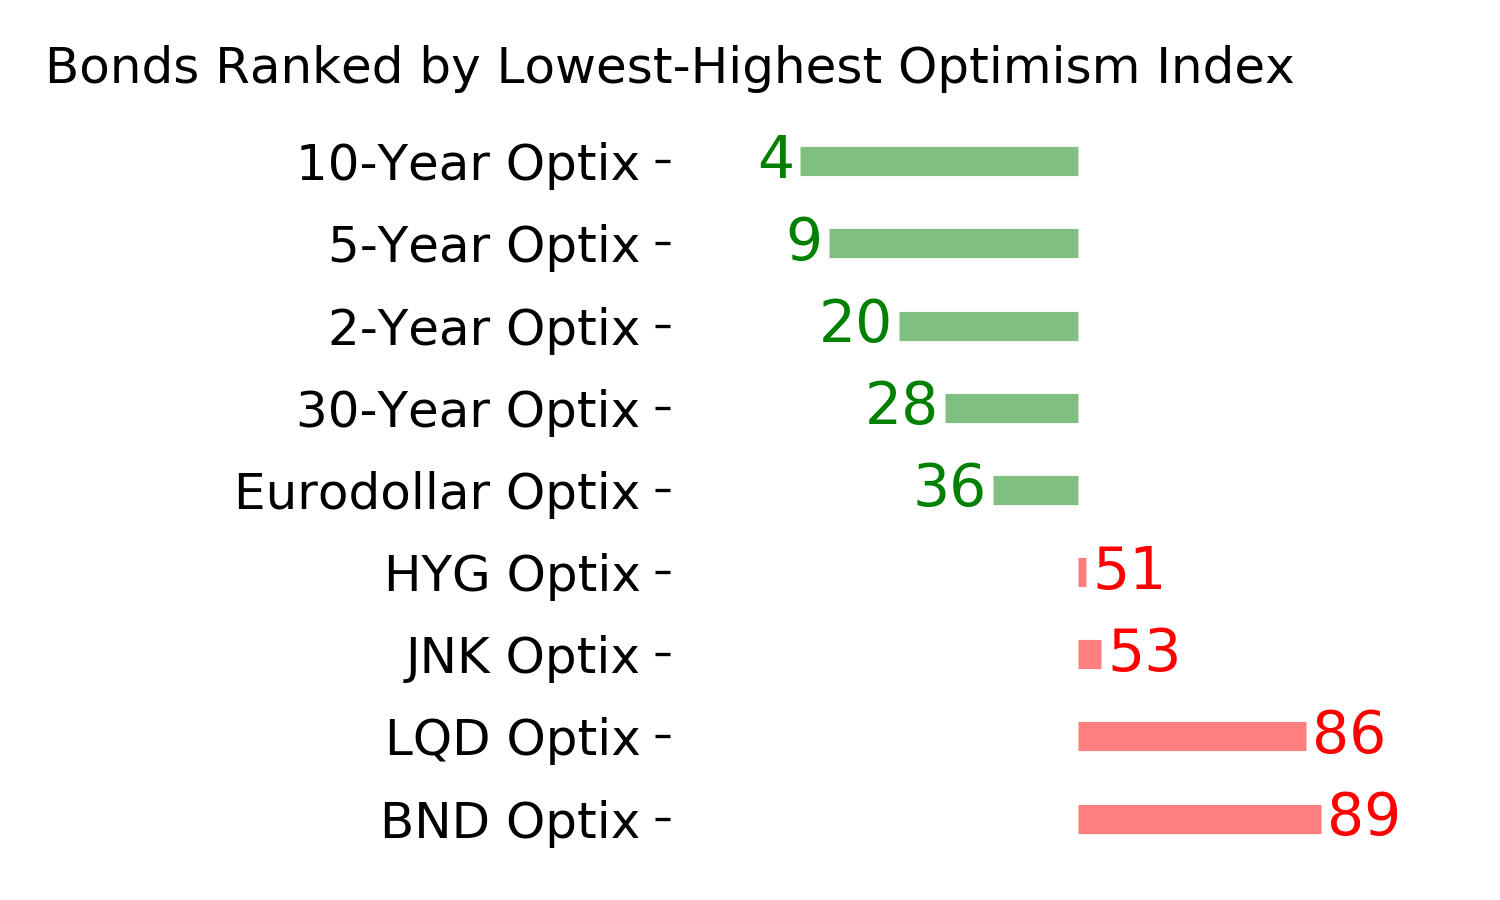
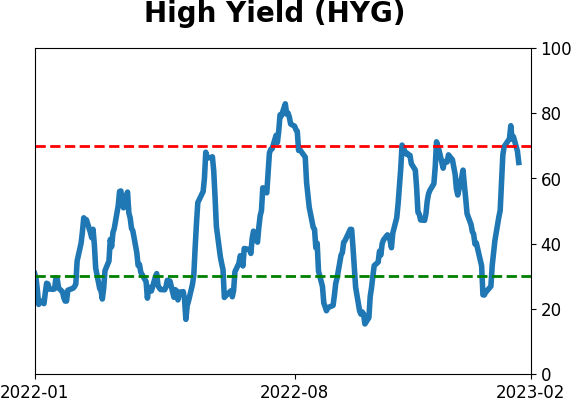
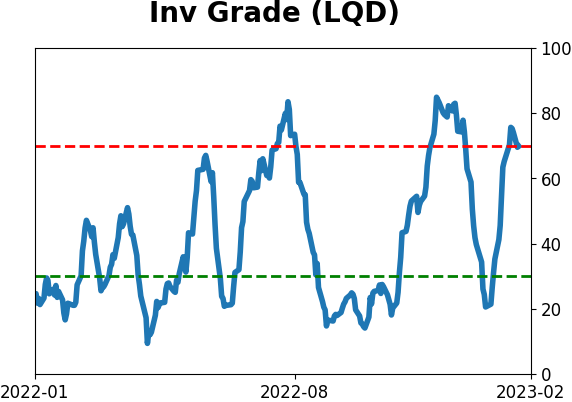
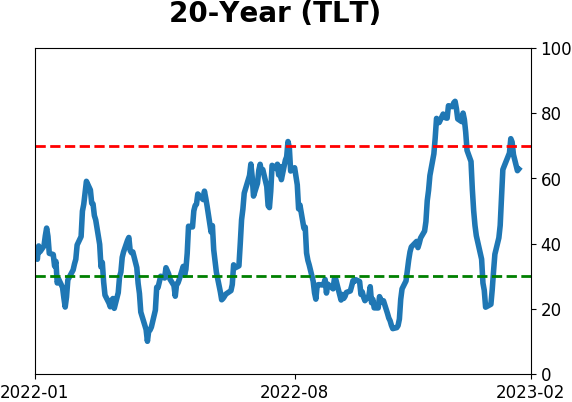
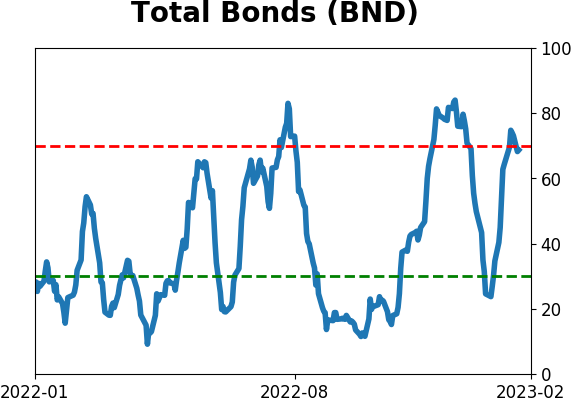
Bond ETF's - 10-Day Moving Average
|
|
|
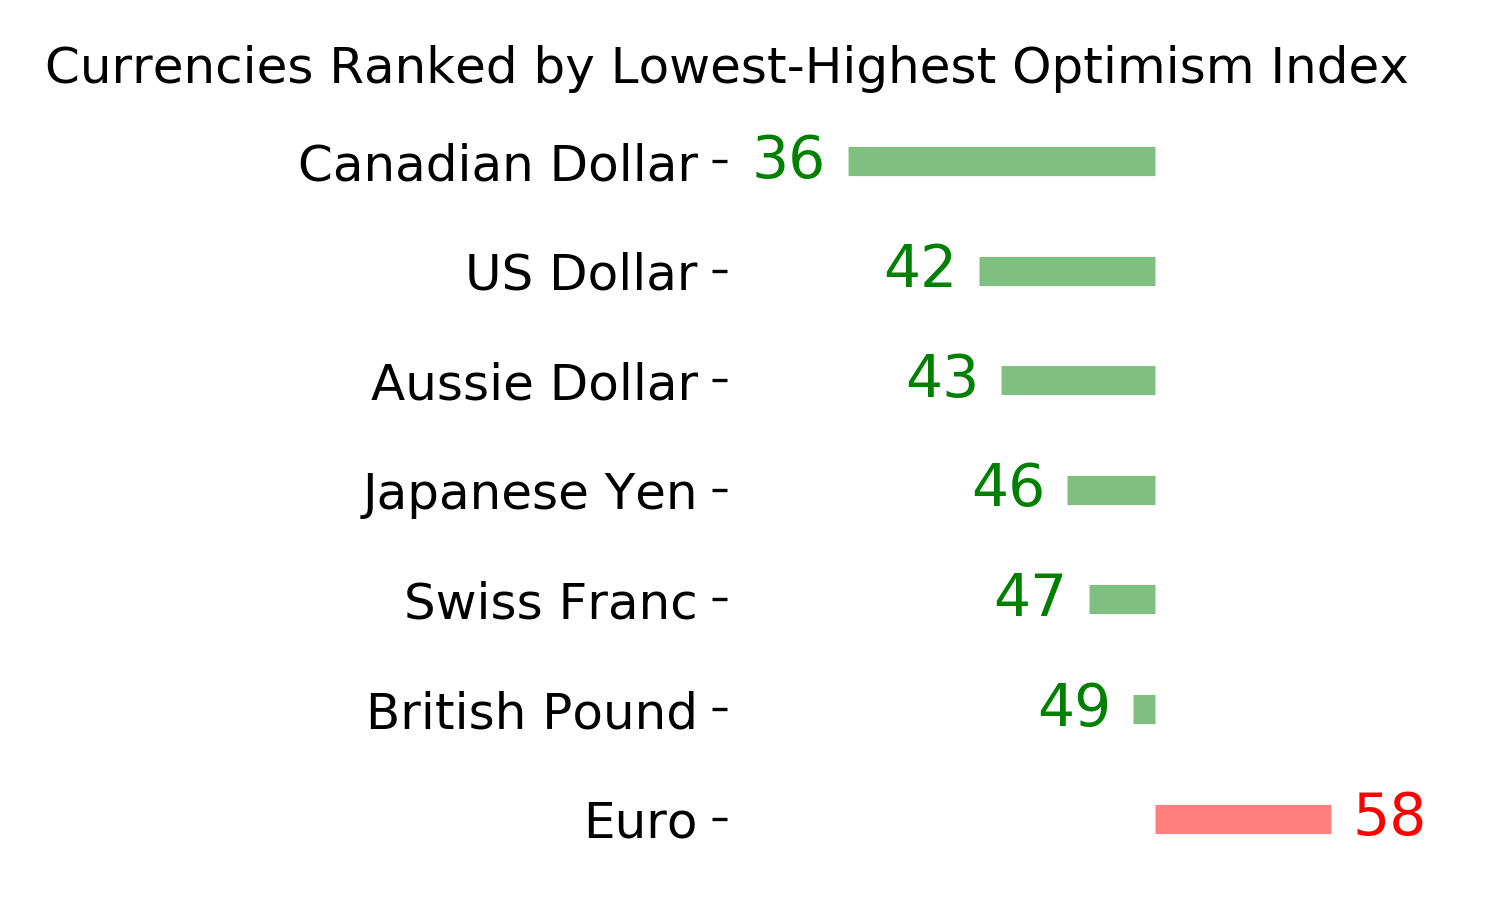
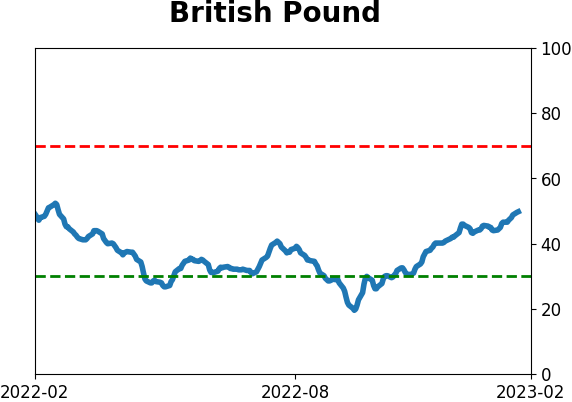
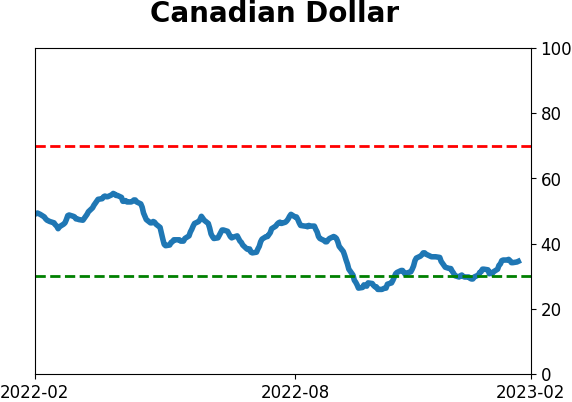
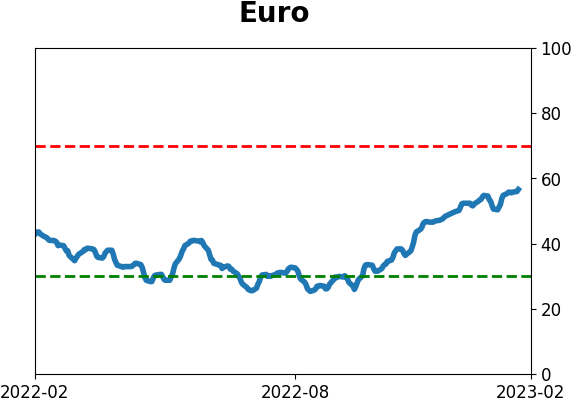
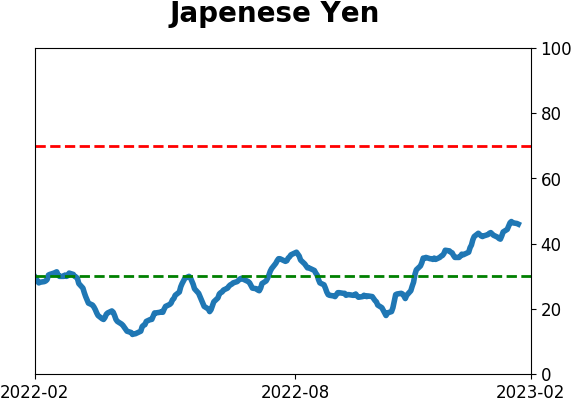
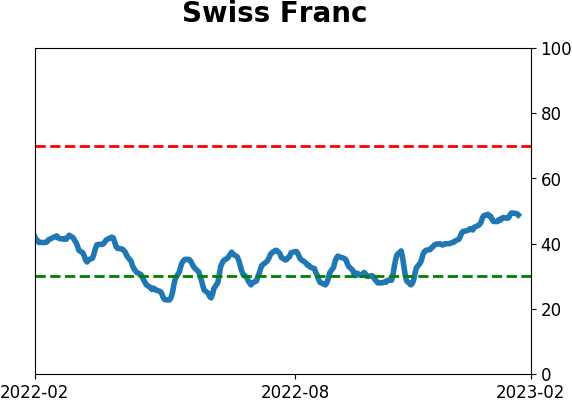
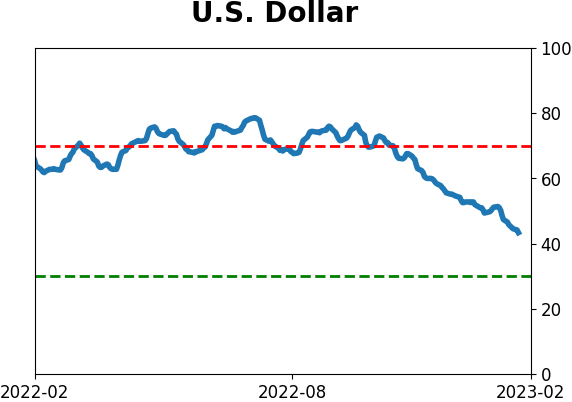
Currency ETF's - 5-Day Moving Average
|
|
|
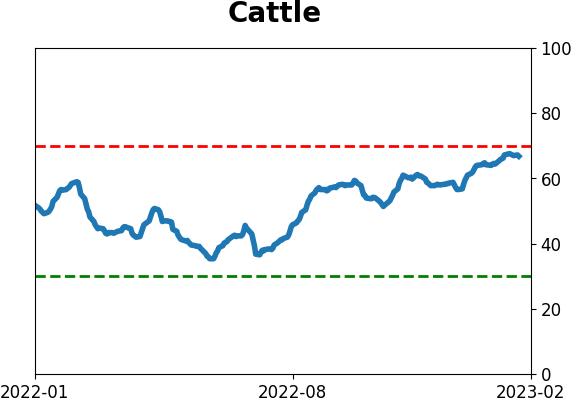
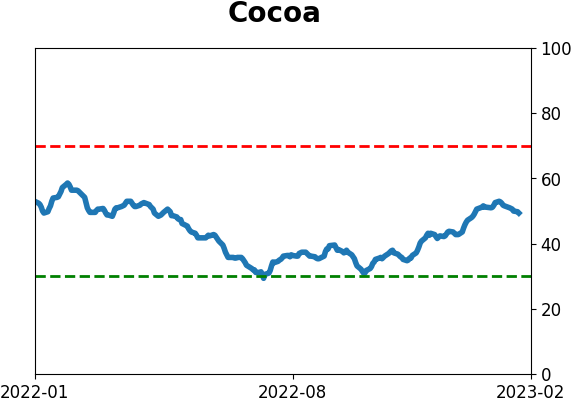
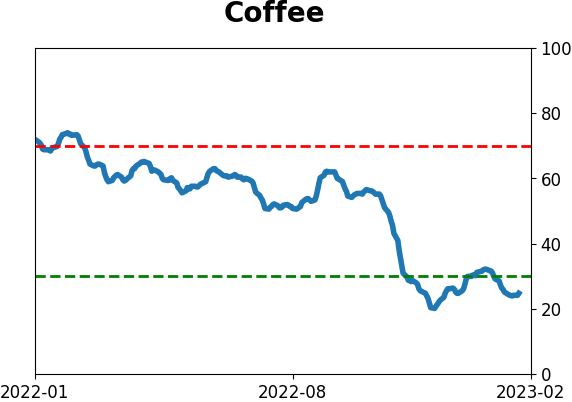
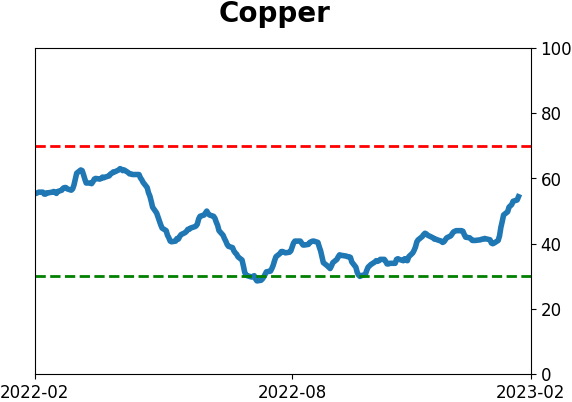
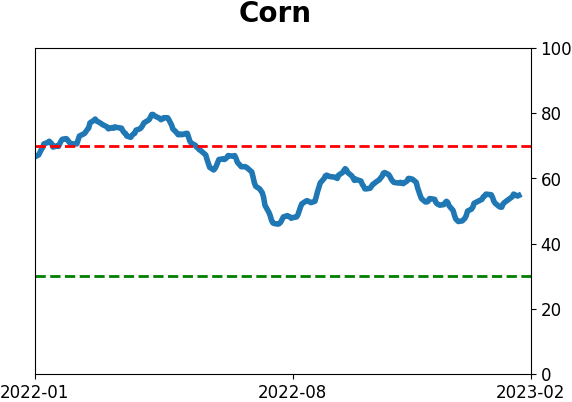
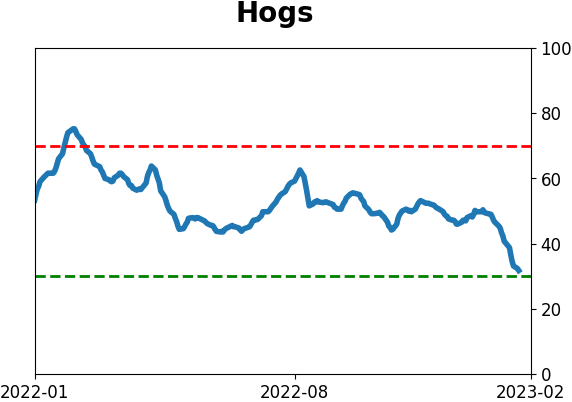
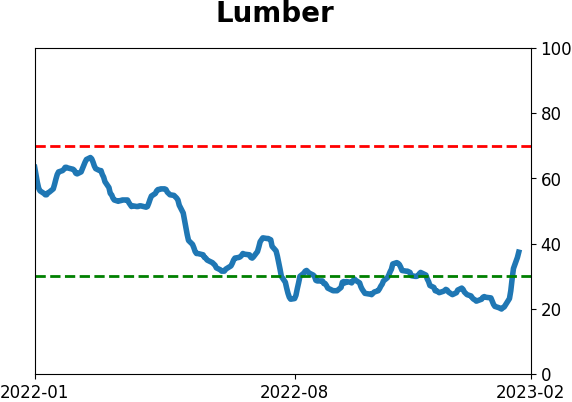
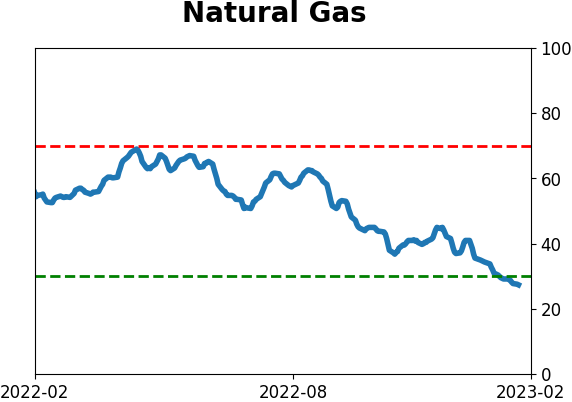
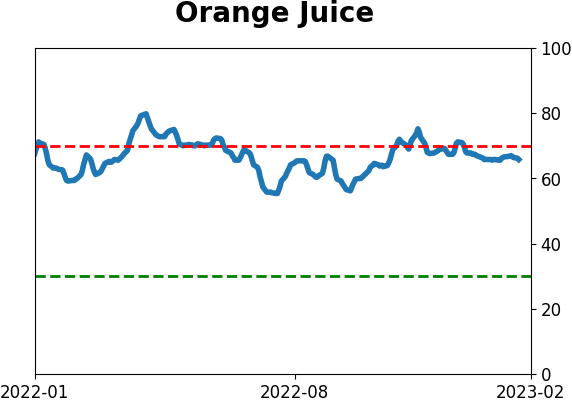
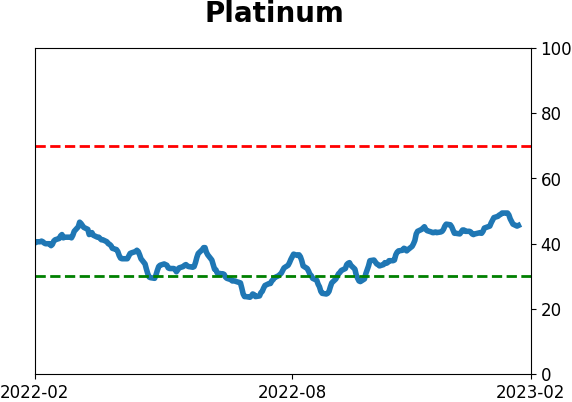
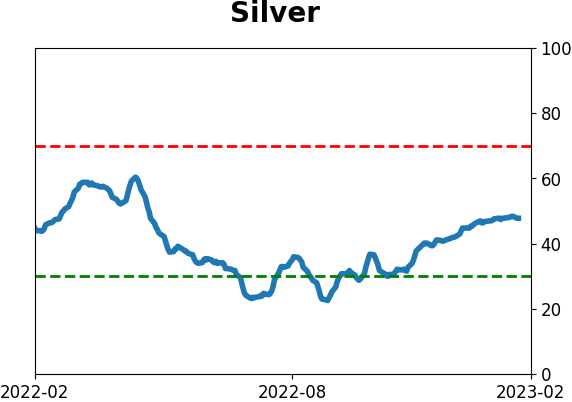
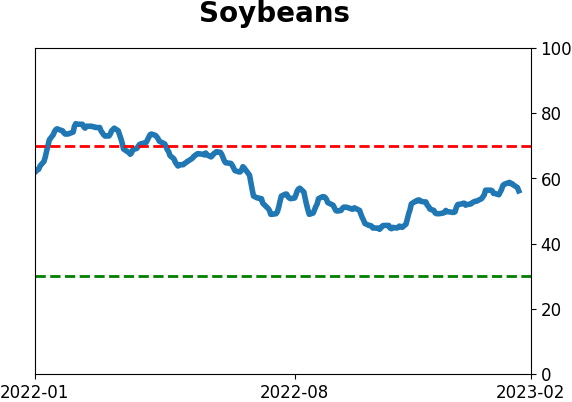
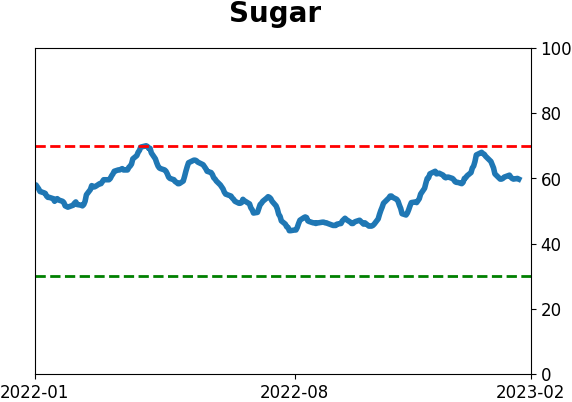
Commodity ETF's - 5-Day Moving Average
|
|