Daily Report : TradingEdge Weekly for Jan 19 - Multiple expansion, jump in new lows, corn cropped

| View/Print a PDF version of this Report |
Headlines
|
TradingEdge Weekly for Jan 19 - Multiple expansion, jump in new lows, corn cropped: This week, we saw that most of 2023's returns were due to a jump in valuation multiples. With a mostly rocky start to the year, Greed is retreating and fear is building a bit, triggering a rise in new lows. Overseas stocks are faring worse, with few outperforming the S&P 500. As corn prices wilt, there are a couple of positive signs. |
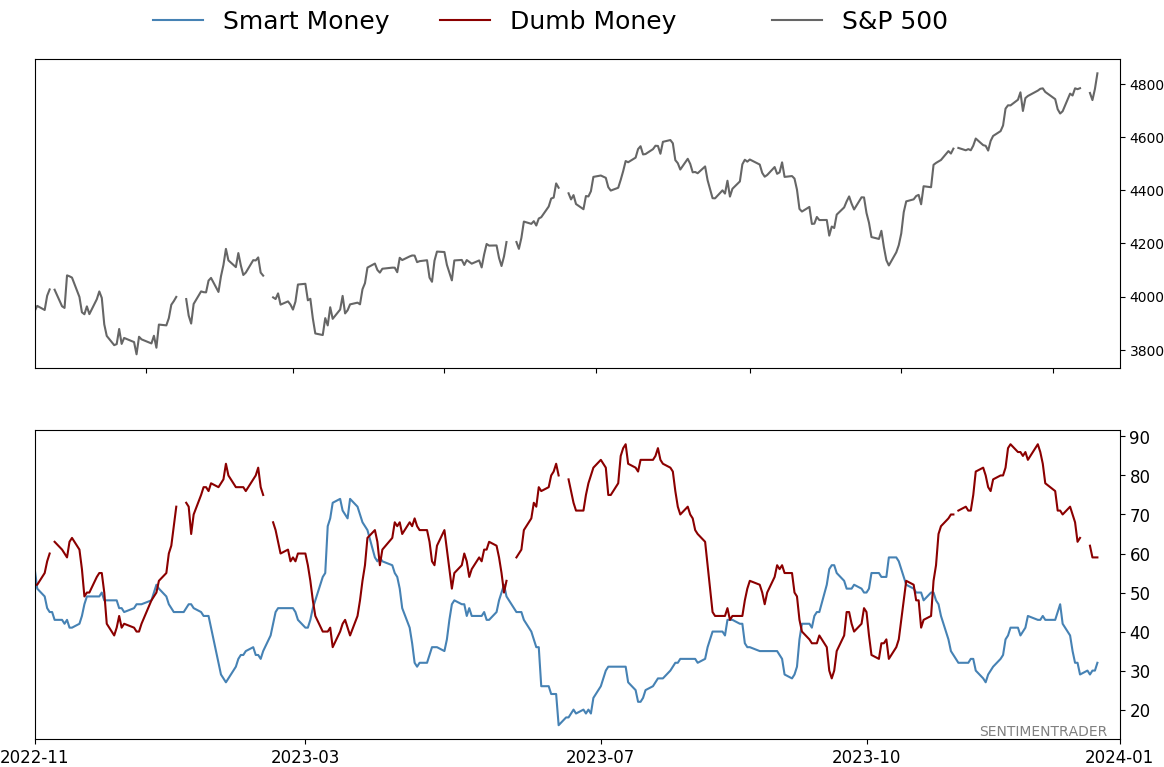
Smart / Dumb Money Confidence
|
|
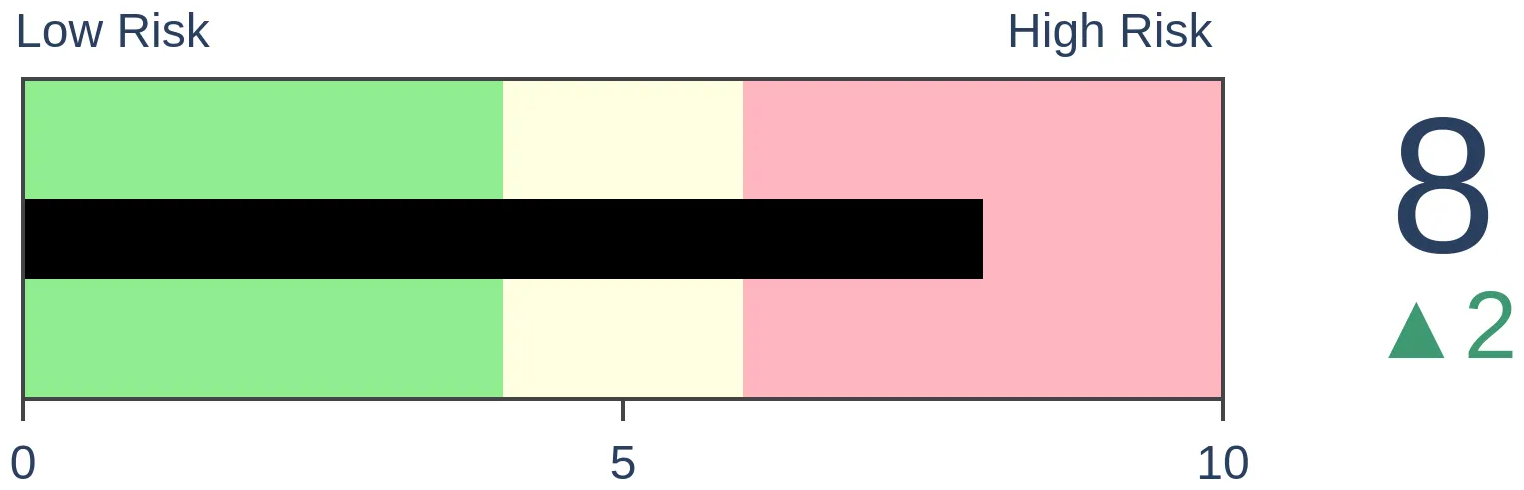
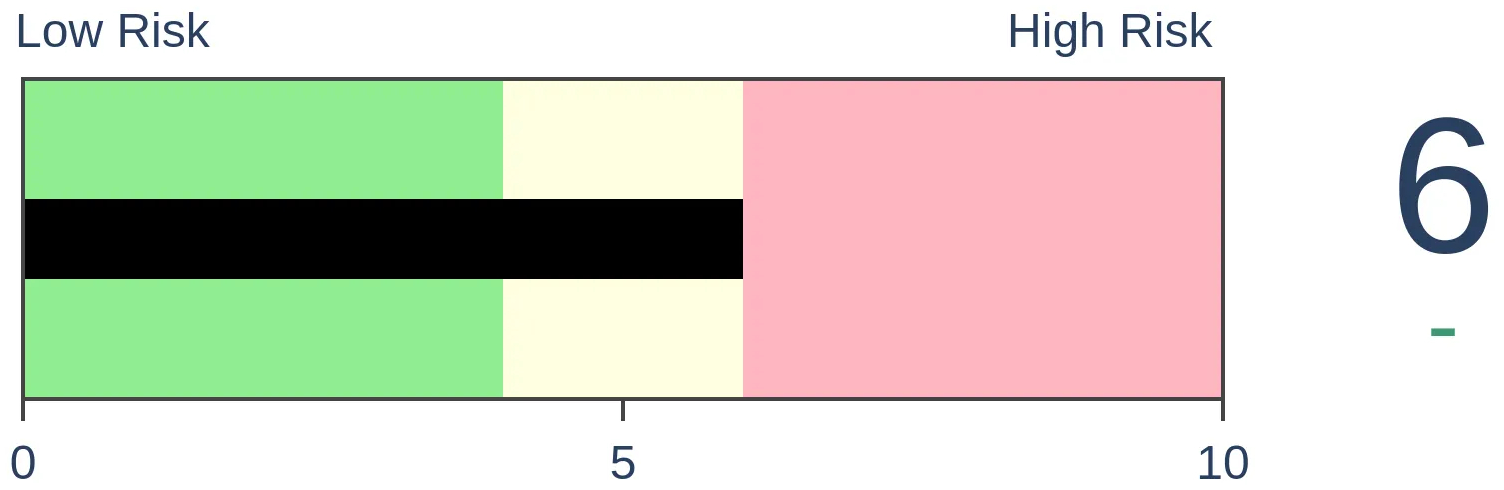
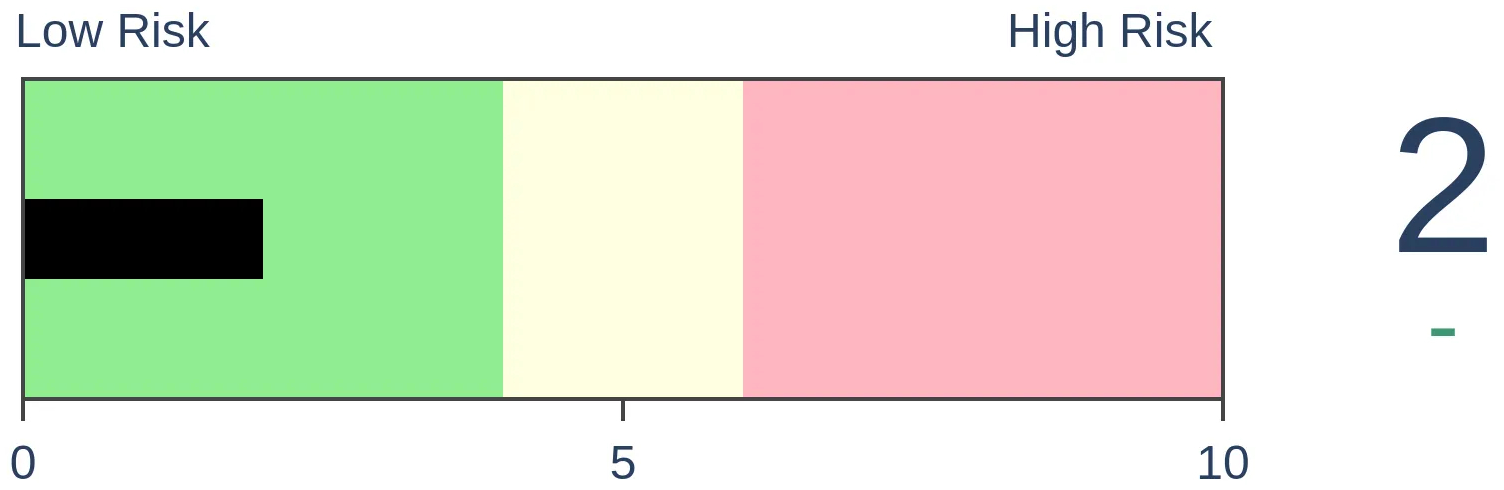
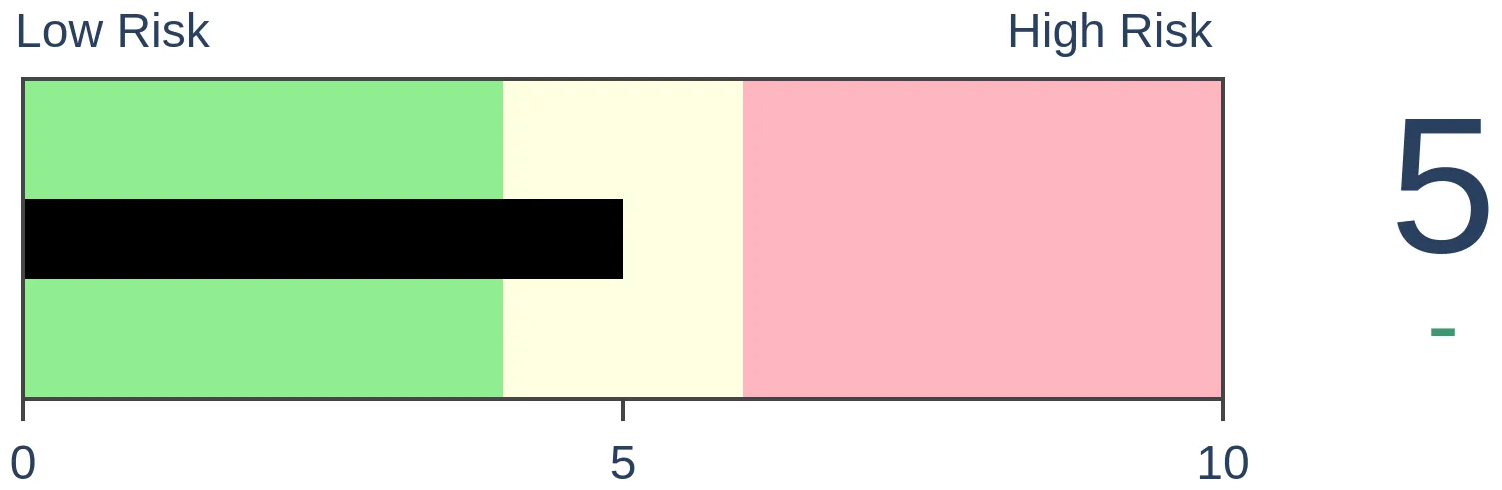
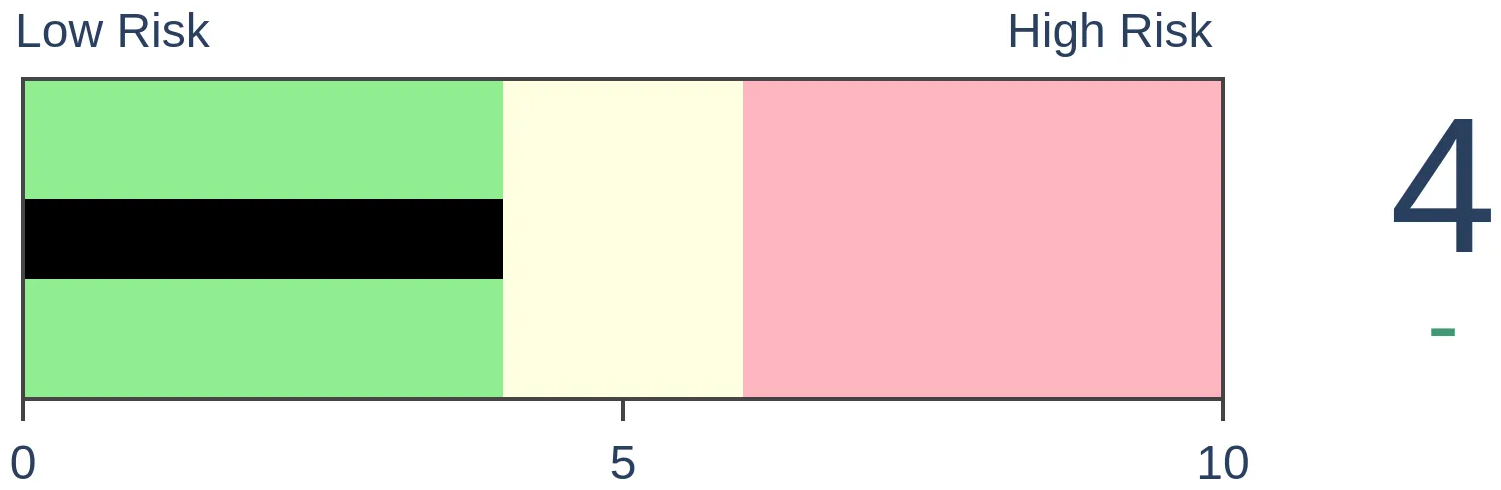
Risk Levels
|
|
|

Research
TradingEdge Weekly for Jan 19 - Multiple expansion, jump in new lows, corn croppedBy Jason GoepfertBOTTOM LINEThis week, we saw that most of 2023's returns were due to a jump in valuation multiples. With a mostly rocky start to the year, Greed is retreating and fear is building a bit, triggering a rise in new lows. Overseas stocks are faring worse, with few outperforming the S&P 500. As corn prices wilt, there are a couple of positive signs. FORECAST / TIMEFRAME |
Key points:
- Most of the gain for stocks in 2023 was thanks to a jump in valuation multiples
- Few countries are outperforming the S&P 500 again
- A couple of indicators are giving long-term positive vibes for stocks
- Greed has retreated from a historical extreme
- New lows exceeded new highs, triggering a short-term warning
- It's been a bad few weeks for industrial metals
- Using options to speculate on a positive window for gold mining stocks
- Corn prices have a couple of things going for them
Most of last year's rise was thanks to a jump in valuation multiples
The rise in a stock (or index) can be due to three primary factors: 1) An increase in earnings per share, 2) An increase in the valuation investors place on those earnings, and 3) Dividends.
Almost all of the S&P 500's returns last year were due to #2, an increase in the valuation investors were willing to put on earnings. Very little of it was driven by an increase in actual earnings per share or dividends. Dividends are almost never the primary driver, but still.
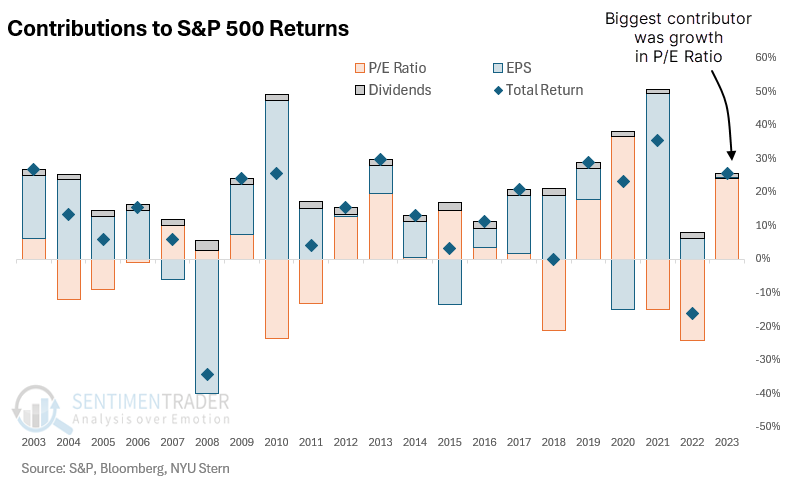
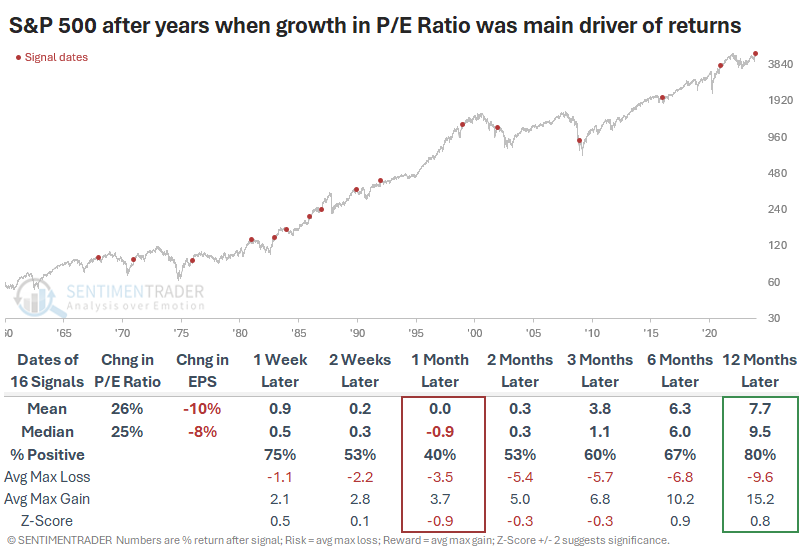
Whether any of this actually matters is up for debate. The table below shows every year since 1960 when the majority of the S&P 500's return in that year was driven by an increase in the P/E Ratio rather than Earnings Per Share (EPS).
Returns in January weren't great, as the index rallied only 40% of the time and suffered a negative median return. But over the next year, returns were about in line with any random year. There was really nothing outstanding about it either way.
If these factors matter, we should see better returns in the index following years when fundamental earnings were the primary driver of returns. These should be years when investors were afraid and didn't place much of an increase in valuations despite better fundamentals.
After those years, returns were a bit better. But it wasn't all that dramatic - the median one-year return was much better, though the mean was not due to a few significant losses. The maximum gains and losses were about the same as in the table above.
After years like 2023, when the S&P's returns were driven mostly by an increase in the P/E Ratio, Value stocks tended to shine. They showed the most consistent gains across time frames and among the highest returns.
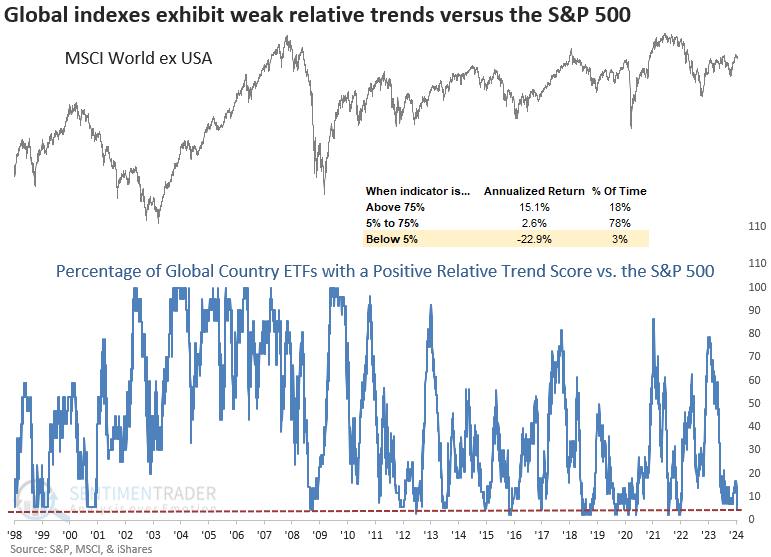
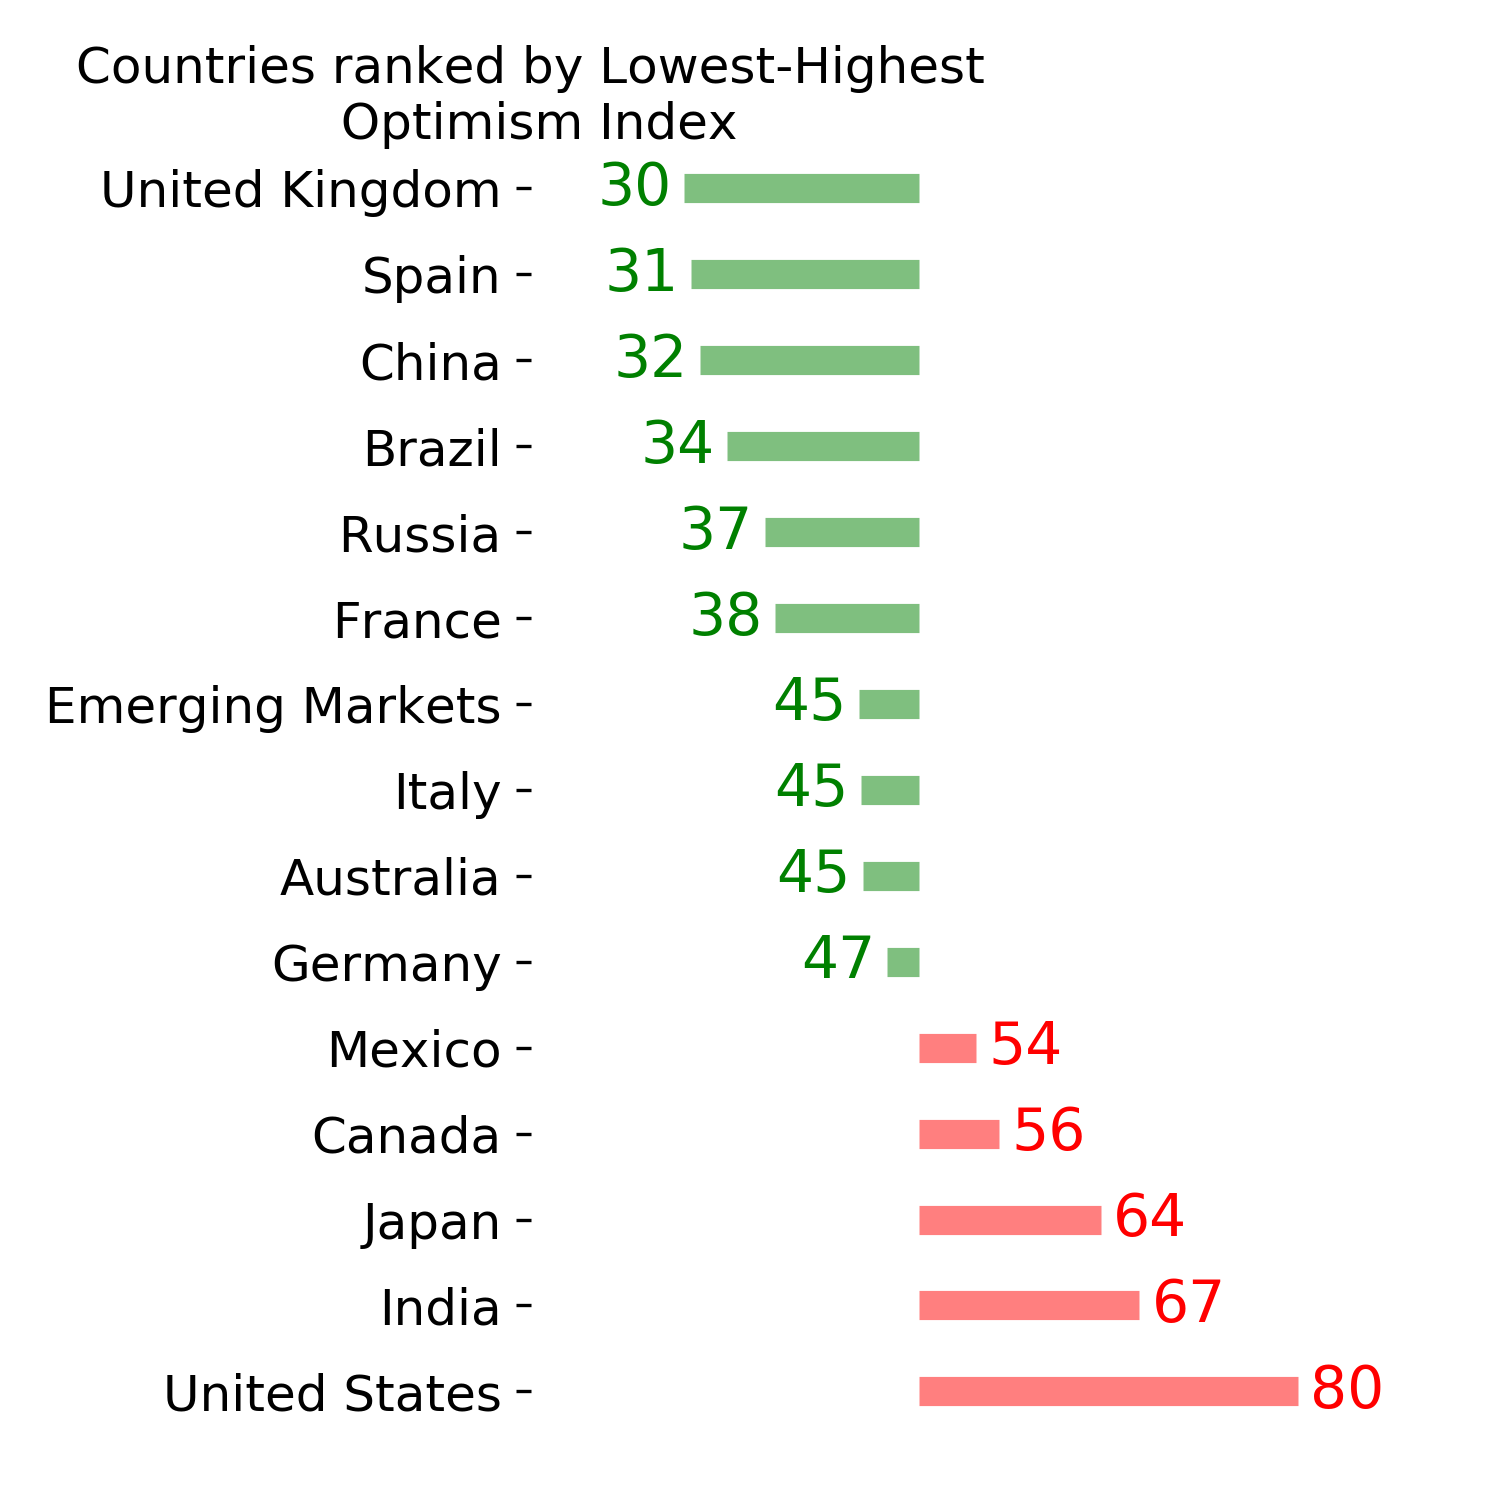
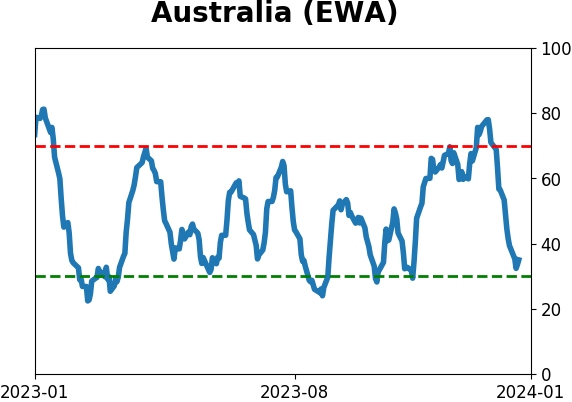
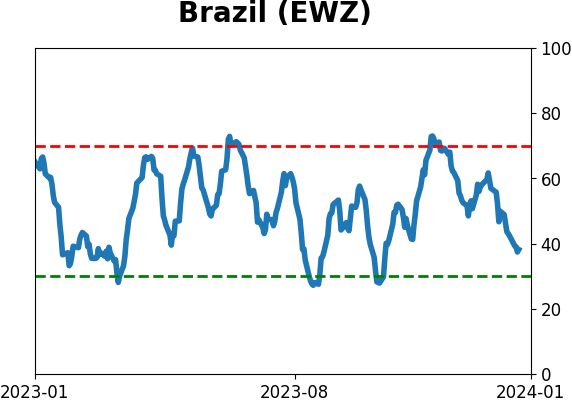
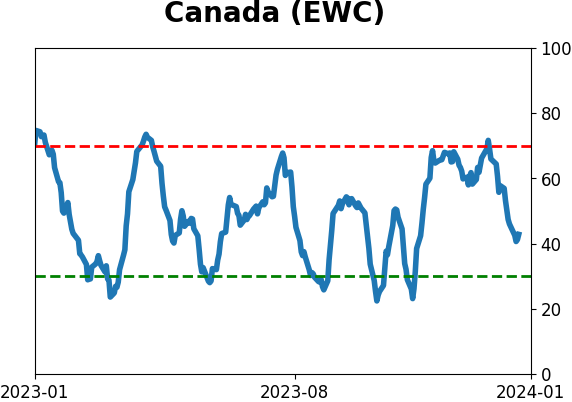
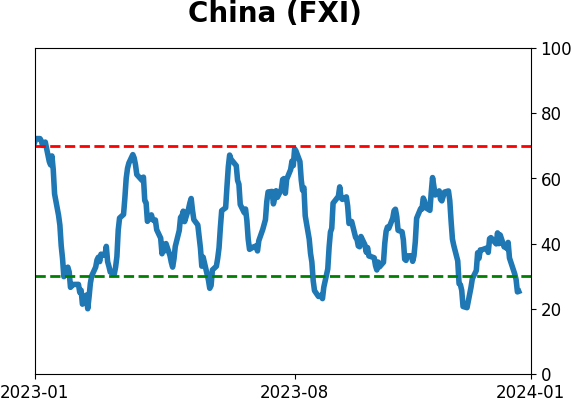
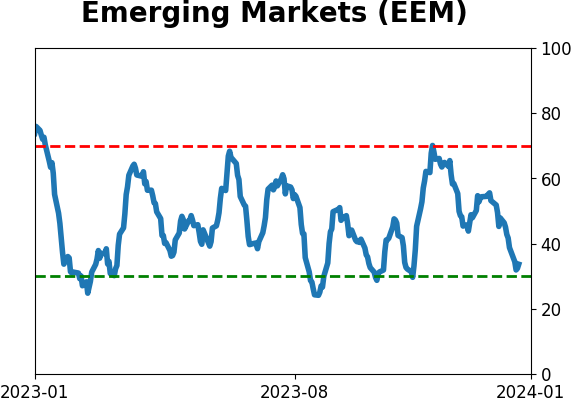
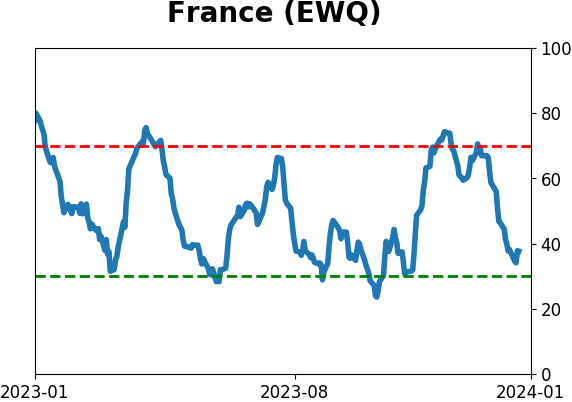
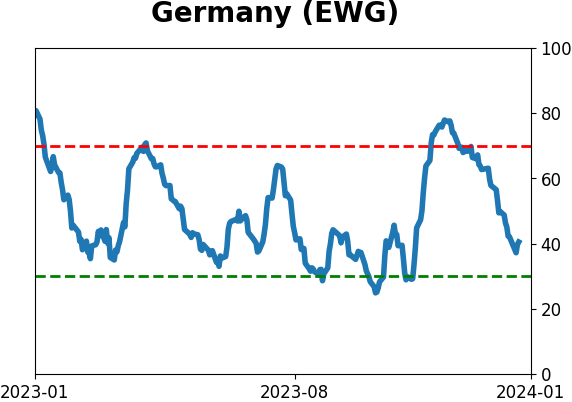
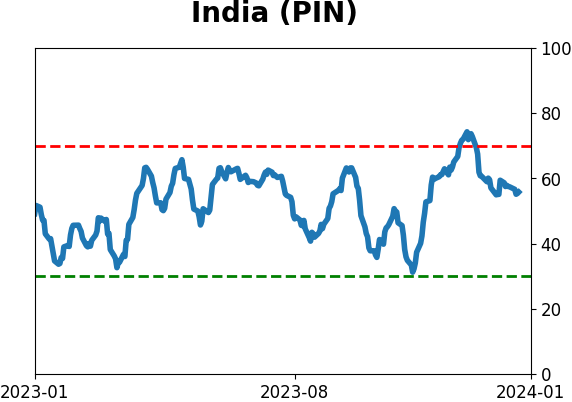
Few countries are outperforming the S&P
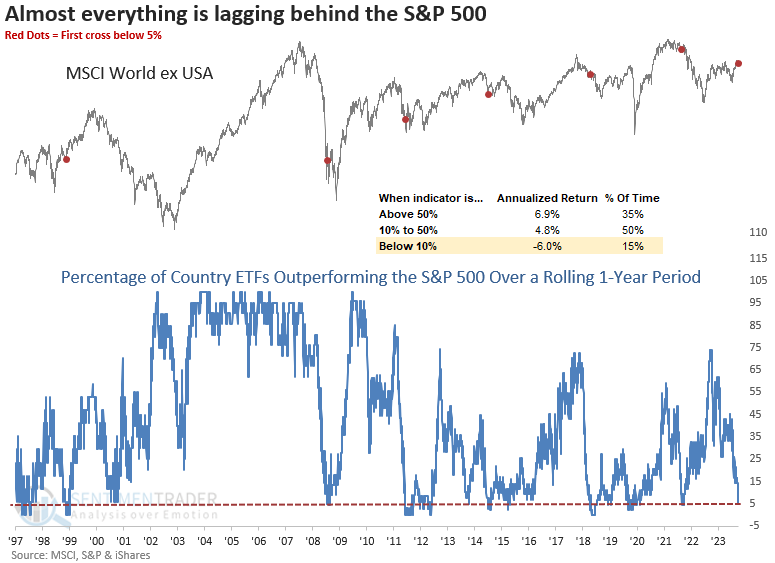
Dean showed that the percentage of country ETFs with a positive relative trend score versus the S&P 500 fell to a multi-year low. Similar relative trend conditions suggest a cautious outlook for the MSCI World ex USA Index.
On Tuesday, the percentage of global indexes with a positive relative trend score versus the S&P 500 fell to fewer than 5% of country ETFs, reaching the lowest value since December 2021.
With the percentage of country ETFs maintaining a positive relative trend score falling to one of the lowest levels in history, investors should remember that negative relative trends, like now, can often foreshadow weak absolute performance, as exhibited by the -22.95 annualized return for the MSCI World ex USA Index.
When the positive trend scores first fell below 6%, it suggested a negative near-term outlook followed by muted returns over a median-term horizon. The unfavorable win rate and median return over the following year demonstrate that the signal tends to manifest during prolonged corrections and bear markets.
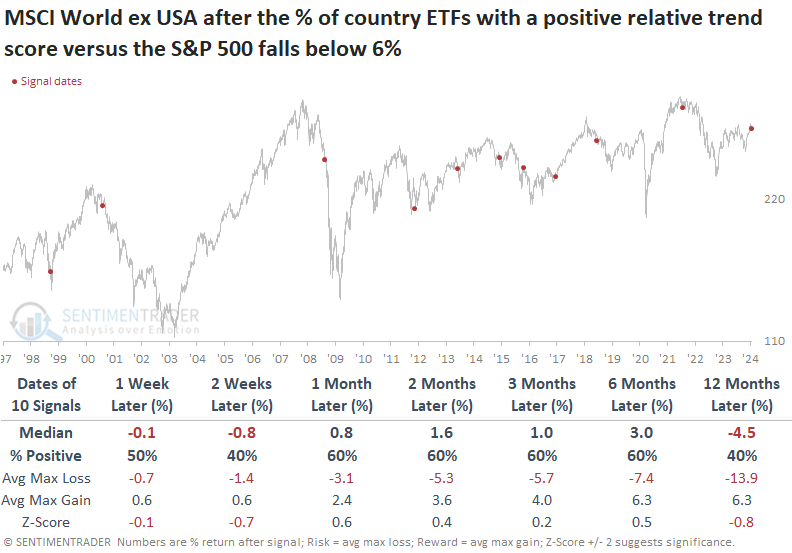
While the S&P 500 shows more favorable returns and win rates than the global benchmark, the z-score reveals lackluster performance compared to any random time.
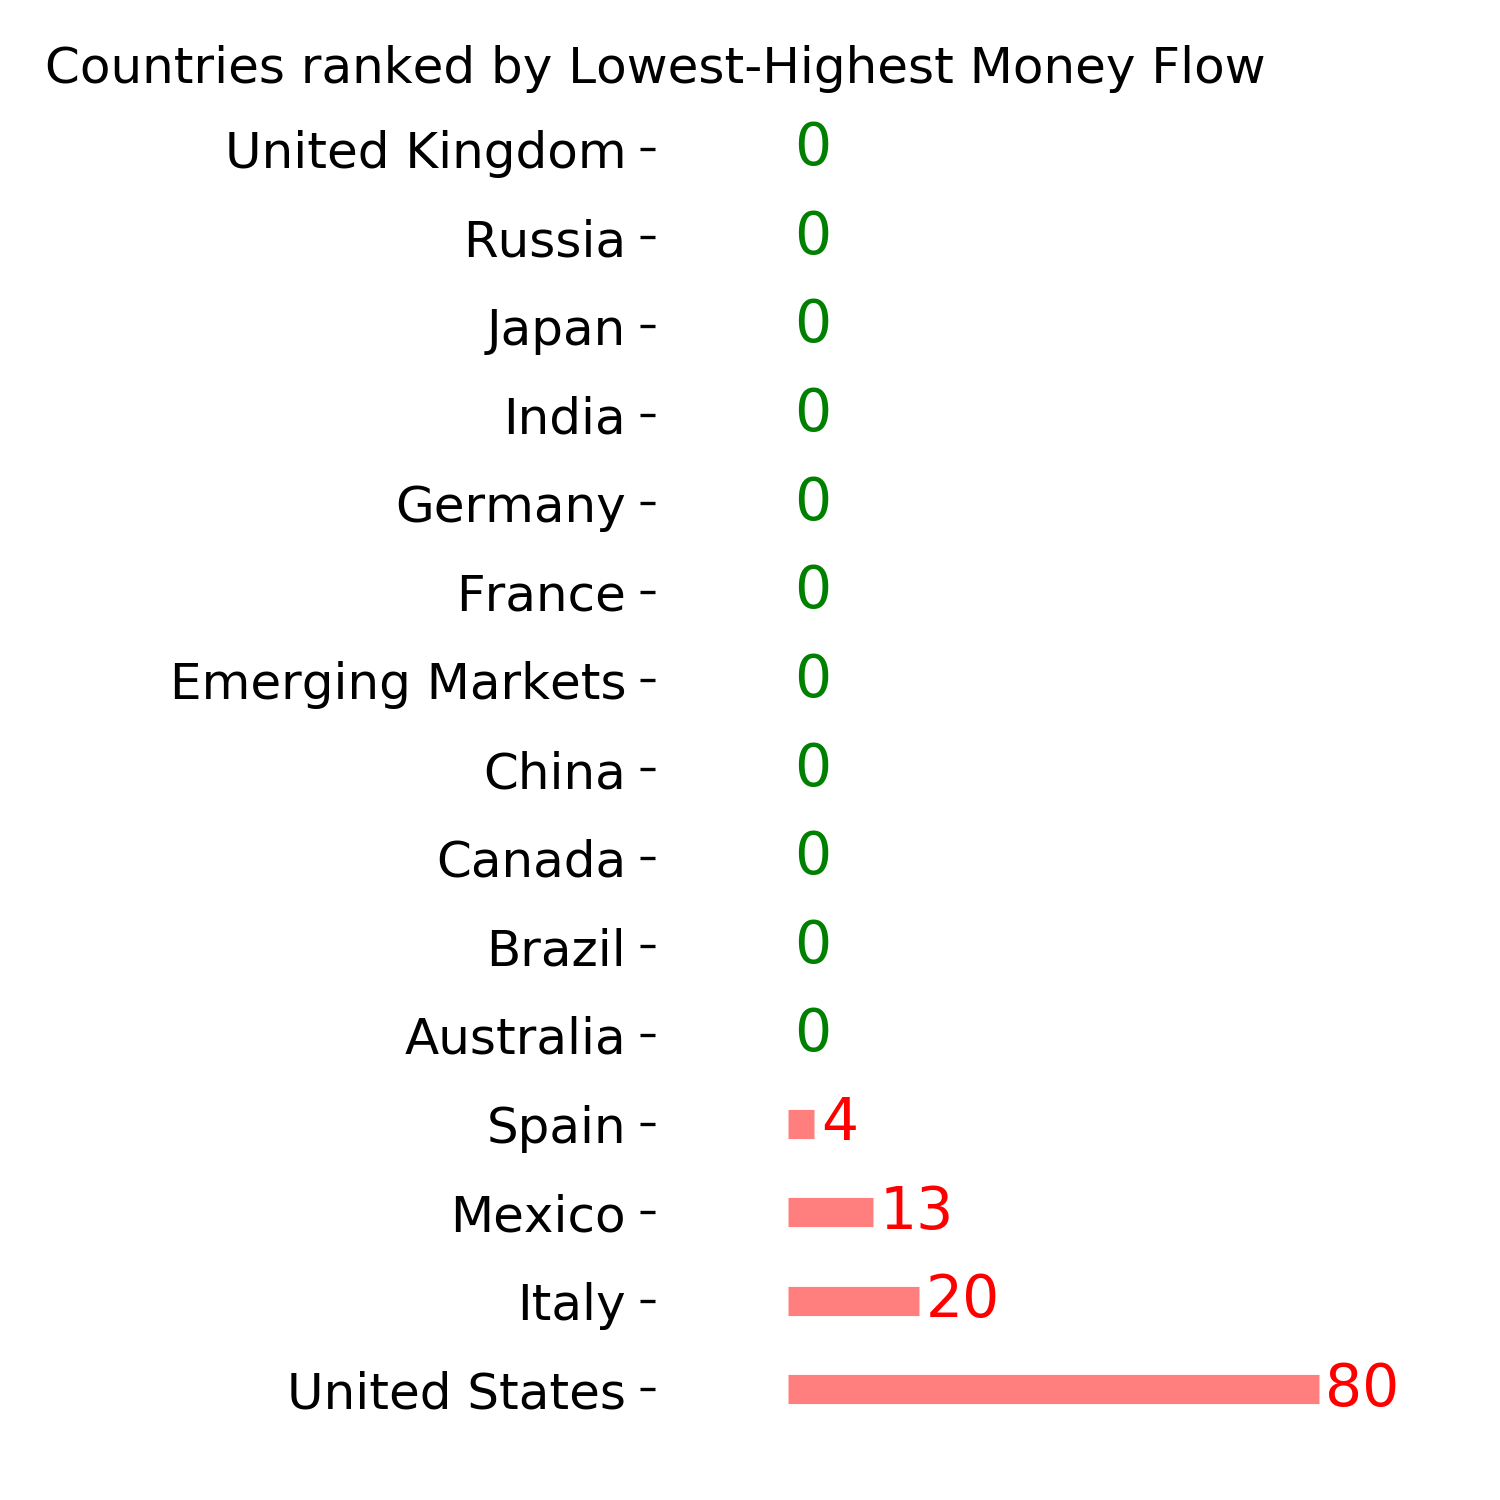
The percentage of country ETFs outperforming the S&P 500 over a rolling one-year period recently declined below 10%, indicating the dominance of the world's most benchmarked index compared to everything else. Similar conditions produced negative annualized returns for the MSCI World ex USA Index.
A couple of indicators suggesting higher long-term prices for stocks
Jay noted that as the stock market digests a streak of 10 out of 11 weeks showing a gain, fear and doubt make an immediate comeback.
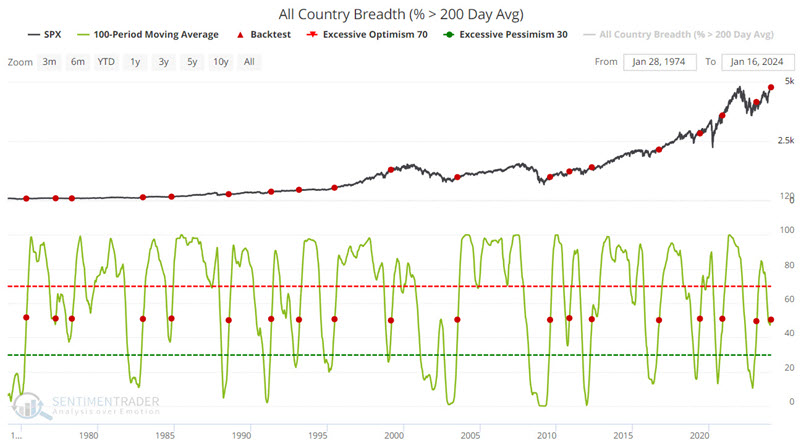
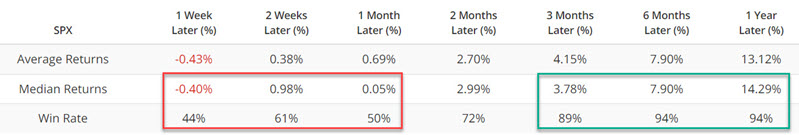
As the name implies, our All-Country Breadth (% > 200 Day Avg) indicator shows the percentage of major country equity indexes (currently numbering more than 20) that are trading above their 200-day moving averages. The chart below shows those dates when the 100-day moving average for this indicator crossed above 51%. The most recent signal occurred on 2024-01-16, and the S&P 500 showed a 94% win rate over the next 6-12 months.
The Equity Put/Call Ratio indicator measures the volume of puts traded divided by the volume of calls traded on individual equities on the CBOE (Chicago Board Options Exchange) on a given day. Readings above 1.00 are generally considered favorable for the overall stock market.
The chart below highlights all dates when the Equity Put/Call Ratio crossed above 1.00 while the S&P 500 was above its 200-day moving average.
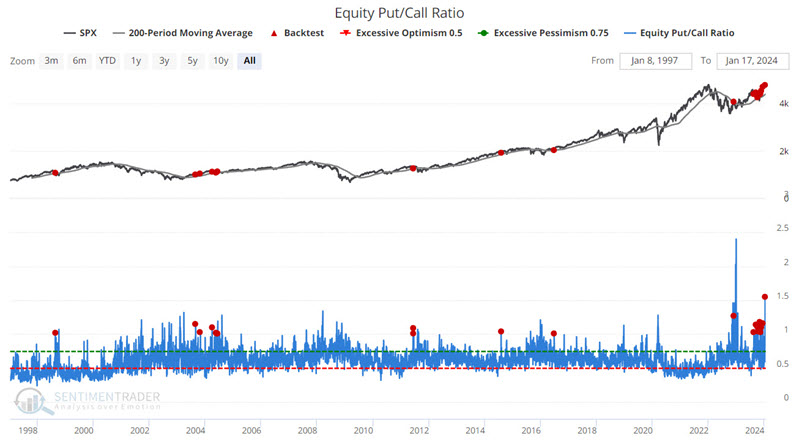
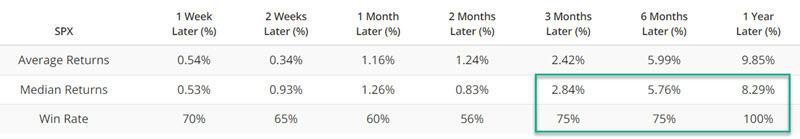
Note that based on the sporadic nature of the signals from this indicator, it is not a good candidate to be used as a standalone trading model. Nevertheless, the "lower-left to upper-right" nature of an equity curve using these signals argues that this indicator can be a valuable tool as part of a weight of the evidence approach.
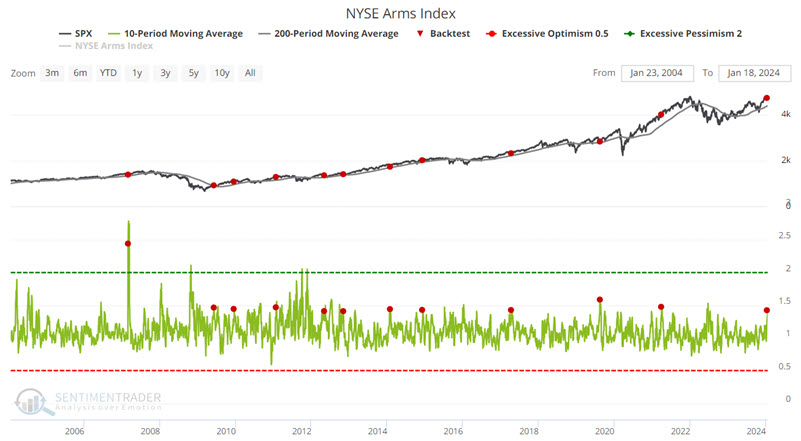
Jay further noted that the ARMS Index triggered an oversold signal, which often highlight decent buying opportunities.
Technician Richard Arms developed the TRIN (TRading INdex). It is calculated as follows:
(Advancing Issues / Declining Issues) / (Up Volume / Down Volume)
The chart below highlights all dates in the last 20 years when the 10-day average of the ARMs Index crossed above 1.40 while the S&P 500 Index was above its 200-day moving average. The intention is to highlight a potentially oversold situation in the context of an established uptrend.
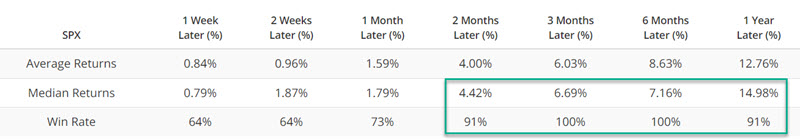
The critical thing to note is the 100% Win Rates for 3-month and 6-month periods. 2-month and 1-Year periods show a Win Rate above 90%, and the 1-Year Median Return has been 14.98%.
Greed is retreating and usually keeps going for a while
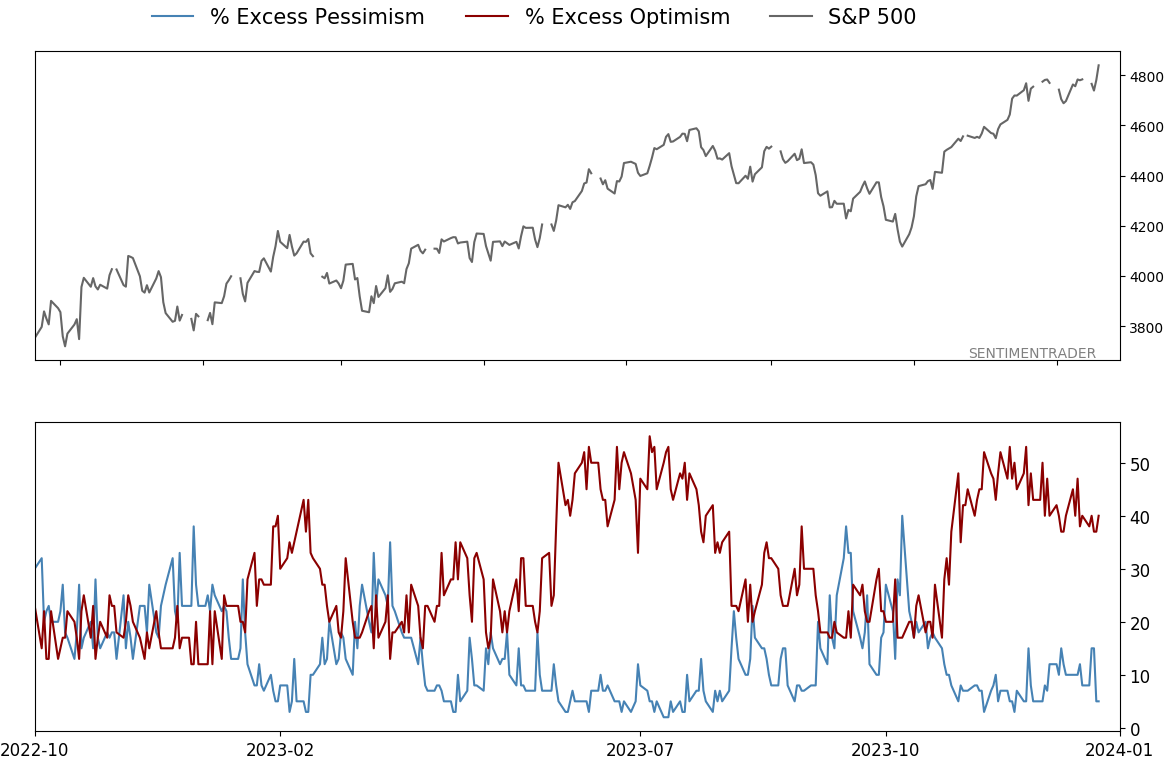
Greed is retreating. Even though stocks have rebounded to near all-time highs, the Fear & Greed Model has pulled back from one of the highest levels on record to just slightly extreme.
The model is based on the one published publicly by CNN, but the SentimenTrader version changed the high-yield bond and put/call ratio inputs to be less prone to errors inherent in the CNN version of the model.
Since the 2001 peak, when the model suggested that traders were supremely Greedy and then started to become less so, the S&P 500 declined until Greed was gone entirely, and the model dropped below neutral.
Using the new version of the Backtest engine, users can recreate this behavior, see how various stocks or indexes performed afterward, and even create realistic trading strategies. Let's theorize that when traders become exceptionally optimistic and start to doubt themselves, they sell stocks until Greed is completely gone. That is easily tested in the new Engine. If a user is on the Fear & Greed chart, click the "With Backtest Engine 2.0" button.
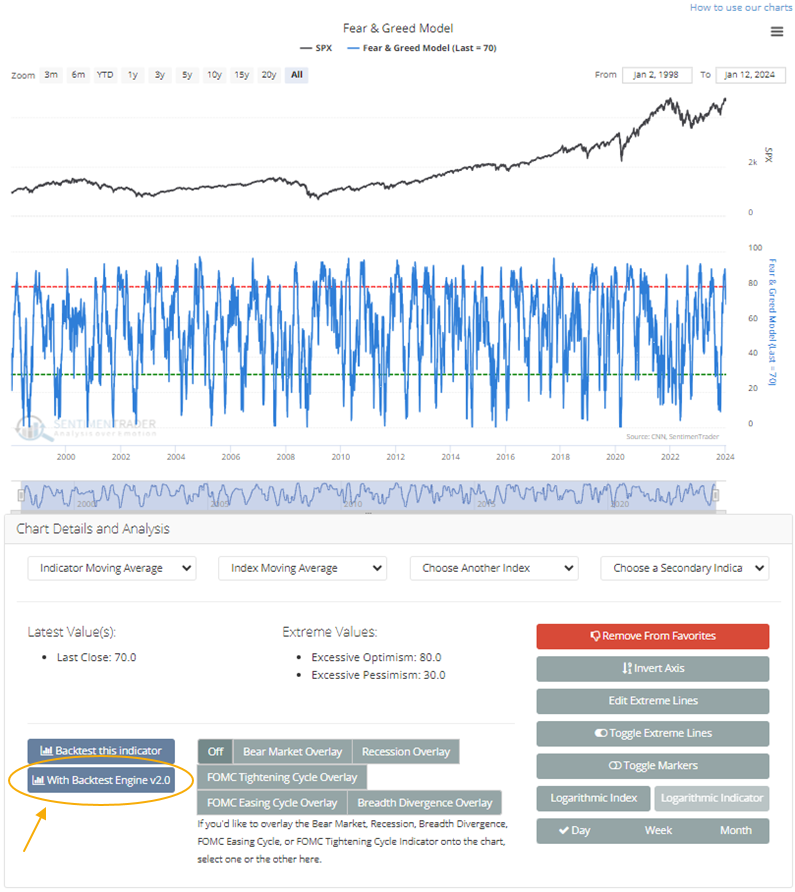
For our test, we'll ask the Engine what happens when Fear & Greed reaches at least 90 and falls below 70. Now, we need to tell it when to get it out of our short trade. It's very flexible, and we could tell it to get us out after 20 days (or however long we want), or at a 3% stop loss (or whatever percent we choose), or a profit target, or many dozens of other factors. But since our theory is that stocks will drop until Greed is gone, let's use that as our exit.
Sometimes, using an indicator as the only exit will trap us in a trade. If we wait until Greed is gone, sometimes we'll have to wait for months because stocks just kept chugging higher. So, we'll exit either when Greed is gone or until it rebounds and becomes optimistic again. We'll use the indicator as a type of stop loss.
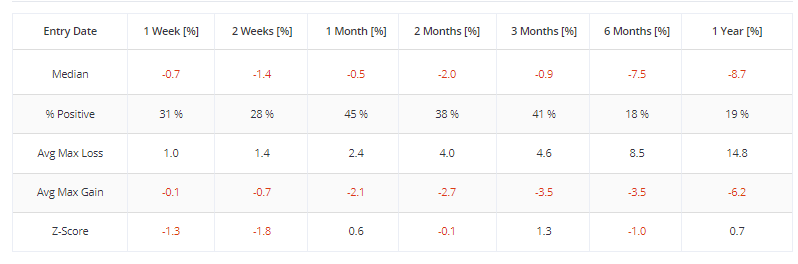
These are not going to be gigantic winning trades. It will only tell us how SPY has typically behaved when sentiment gets supremely greedy, retreats, and then either returns to normal or becomes greedy again.
When the test is complete, and you see the summary information, you can scroll down and see that returns were mixed. It isn't easy to create a short-selling system for something like SPY. Still, in recent years, it has succeeded, at least in terms of profitable short trades.
If you click the "Exit with different Time-In-Market frame" tab, you can see the individual dates of the trades and how the short position would have fared over various time frames. While it wasn't a great trade, the next month showed a 45% win rate, which means if you had entered the trade after Greed pullback back to 70 and stayed short for one month, your short sales would have been profitable 45% of the time.
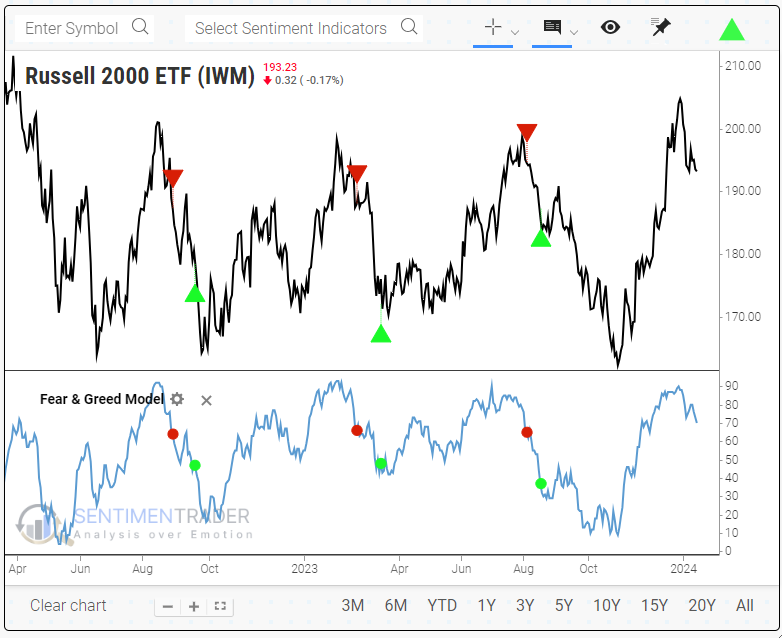
You can edit the test to choose different indexes, ETFs, or individual stocks. If we change the market to the small-cap Russell 2000 ETF, IWM, then it was a more successful strategy. Small-cap stocks have tended to pull back more consistently when traders ease back on their extreme bullishness.
A short-term warning
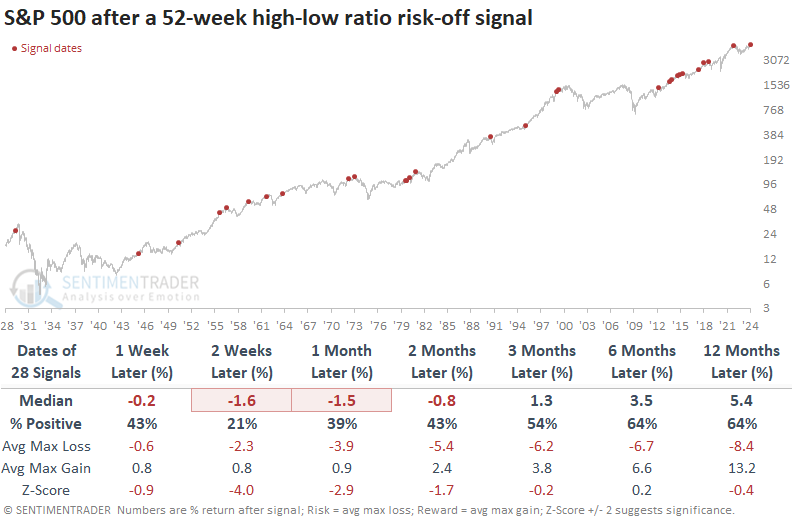
The ratio between 52-week highs and lows on the NYSE exceeded -1.5 to 1, two sessions from a high. Dean showed that similar skews in highs versus lows preceded negative returns for the S&P 500 over the subsequent two months.
The previous alert occurred in December 2021, three weeks before the peak in the S&P 500 on 2022-01-03. However, that signal was accompanied by several other risk-off signals from members in the Composite Risk Warning Model, culminating in a timely composite signal on 2022-01-13.
While this alert could be an isolated event, it raises a yellow flag regarding the sustainability of broad market participation that began last Autumn.
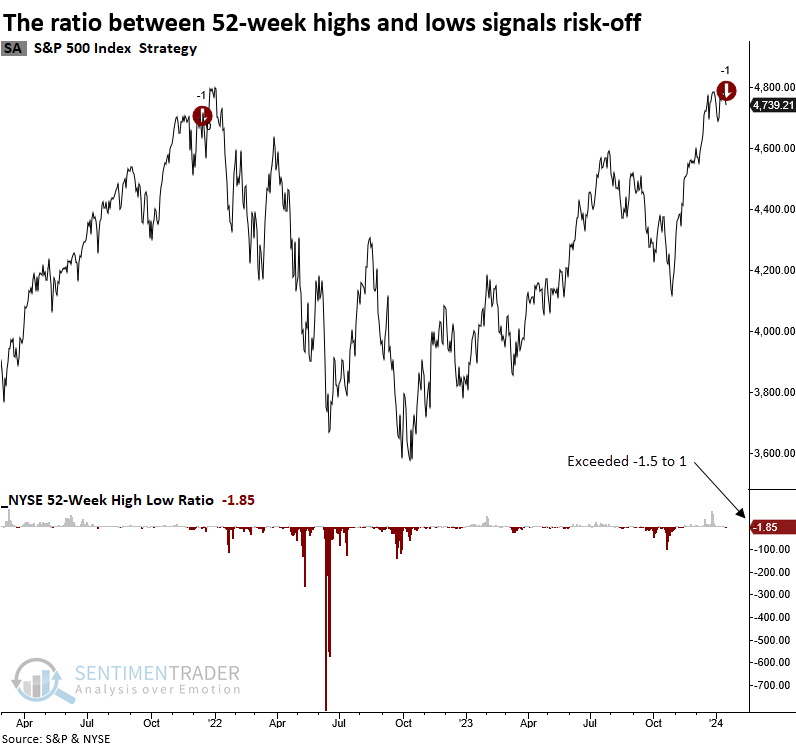
If, within two days of hitting an annual high, the ratio of NYSE 52-week highs to lows exceeds -1.5 to 1, the world's most benchmarked index displayed negative returns and unfavorable win rates over the subsequent two months. While the S&P 500 eventually recovered, the outlook from three to twelve months later underperformed relative to historical trends.
For a Composite Risk Warning Model alert to activate, the composite signal count must hit a minimum threshold of 50%, a currently unmet condition. It's common to see the signal count increase to levels below the trigger threshold. Typically, it denotes sector rotation.
A bad few weeks for industrial metals
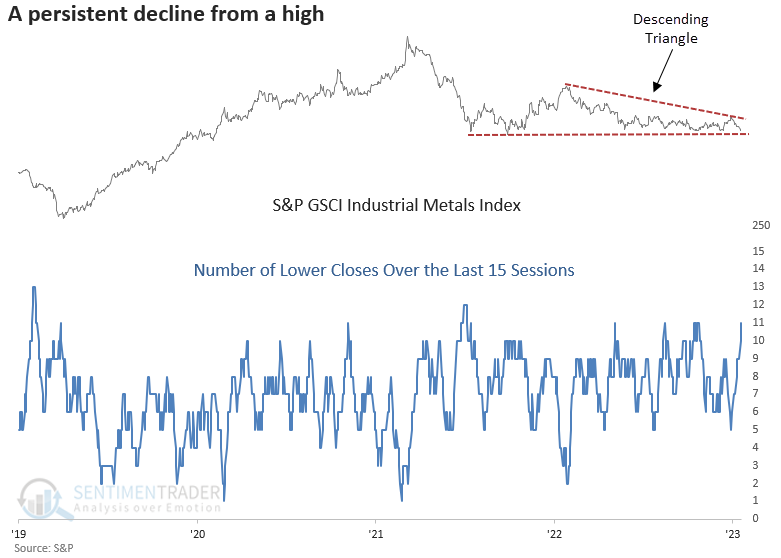
An Industrial metals index declined in 11 out of the last 15 sessions from a 3-month high. Dean showed that comparable price patterns suggest the downtrend in metals widely used in cyclical industries will persist.
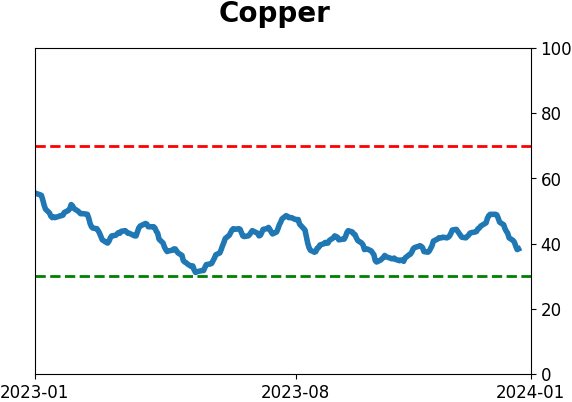
With the S&P GSCI Industrial Metals Index, a commodity basket containing Aluminum, Copper, Lead, Nickel, and Zinc, declining in 11 out of 15 sessions from a 3-month high, let's assess the outlook for the metals index and stocks after similar precedents.
Whenever the S&P GSCI Industrial Metals Index declined in 11 out of 15 sessions from a 3-month high, returns were stagnant over the subsequent two months. The outlook over the following six and twelve months suggests any bounce should be sold.
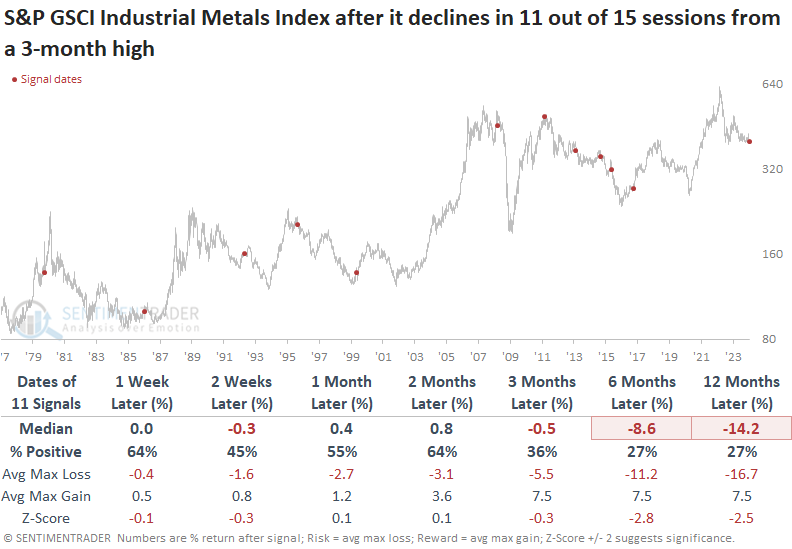
The persistent downturn in industrial metals impacted stocks in the short term, yet they shrugged off the worry, and the S&P 500 showed gains in all but one instance over the following two months.
While most sectors follow the same return pattern as the S&P 500 in the near term, the Materials sector, which contains companies involved in the extraction and processing of metals, underperformed most groups over the following year.
China is known as the world's manufacturing hub. Therefore, any increase or decrease in output can impact the demand for industrial metals. While the Shanghai Composite may not be an ideal index to measure, and historical data limits the analysis to two fewer signals, it's notable that the Composite showed a gain over the next 2-6 months only 38% of the time.
Some options for gold and silver
Gold stocks and silver have performed very poorly so far in 2024. Jay looked at two examples of extremely speculative trades in these two typically highly seasonal markets.
Just when it looks like gold is about to break out and make a run, it seems to hit a hard ceiling and fall back. For many years, gold stocks have been an even worse performer. Meanwhile, another pack of people closely monitor silver in the hopes that when the rally comes, silver will outperform gold.
As Jay uses it, seasonality is not a standalone trading tool but something to indicate "when to look where" or "in which direction to be looking." The chart below displays the annual seasonal trend for the Market Vectors Gold Miners ETF (ticker GDX). The one for silver (SLV) looks similar.
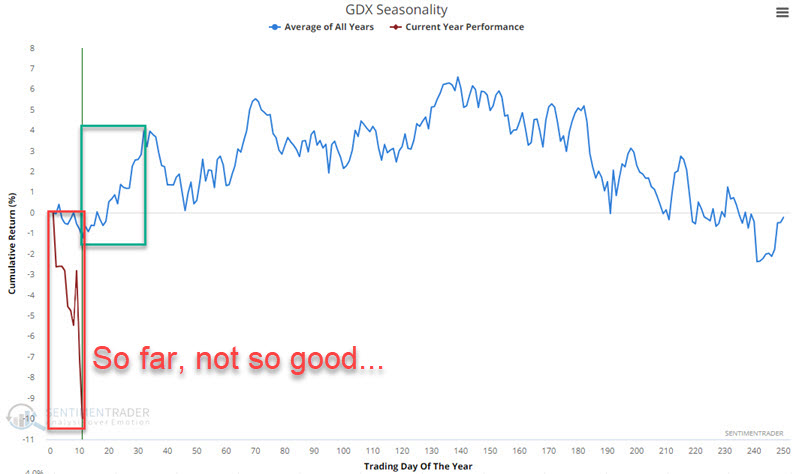
Both GDX and SLV have shown a historical tendency to rally into mid-February and traded sharply lower so far in 2024.
So, one of two scenarios would seem to be setting up. Either:
- Early 2024 is simply not going to follow the general script of early strength
- These ETFs are due for a sharp rebound rally
The most straightforward play for the tickers above would be to buy 100 shares of GDX and 100 shares of SLV (this would cost $2,751 and $2,065, respectively). The question then would be where to cut a loss.
Let's go a different route and look at simple long-call options on both securities to limit cost and risk while leveraging profit potential. We will look to establish positions with a delta close to 100 to replicate a long 100 shares position.
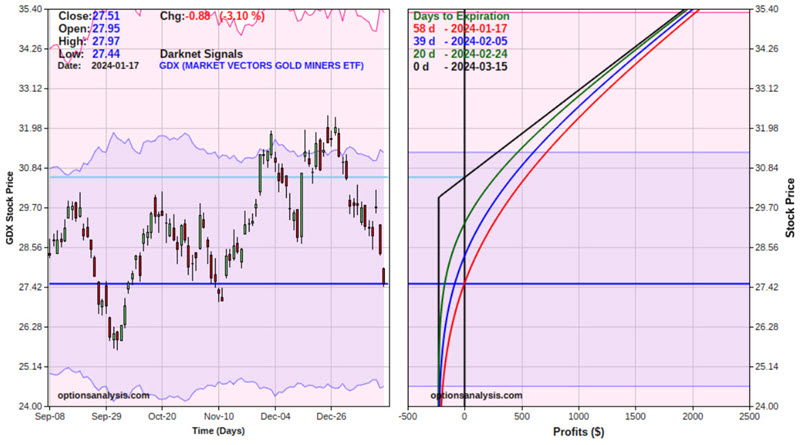
For our example trade, we will buy 4 GDX 2024 March15 30 strike price calls @ $0.57. The particulars for this trade and the risk curves (i.e., the expected profit or loss as of a given date based on the price of GDX shares) appear below. The black line in the risk curve chart represents the expected P/L as of option expiration on March 15th.
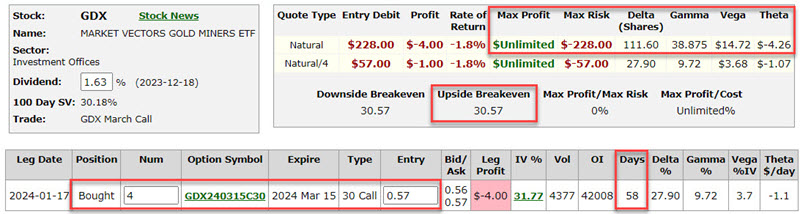
This is a very speculative position! The cost to enter - and maximum risk - is $228 and the breakeven price if held until expiration is $30.57 (strike price + option cost). The total position has a Delta of 111.60, which means that for now, it will behave like a position of long 111 shares of GDX. Note, however, that the option itself has a Delta of 27.90, which essentially means that if held until expiration, there is roughly a 28% probability that the option will be in-the-money.
The bottom line is pretty straightforward: If GDX does rally, this position has the potential to generate a large percentage gain. If GDX does not rebound, this position is sure to lose money. The only saving grace is that the worst possible scenario is a loss of -$228.
Jay discussed some ways to manage the trade, and also went over a detailed example of an option trade for SLV.
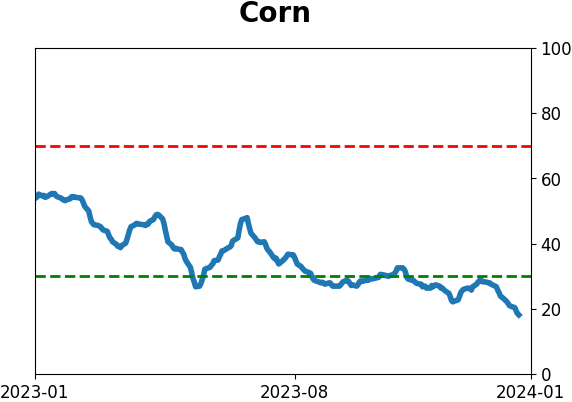
Corn has a couple of things going for it
Corn has entered a favorable seasonal period. Jay noted that so far, the price trend is not confirming but trader sentiment suggests that traders watch closely for a buying opportunity.
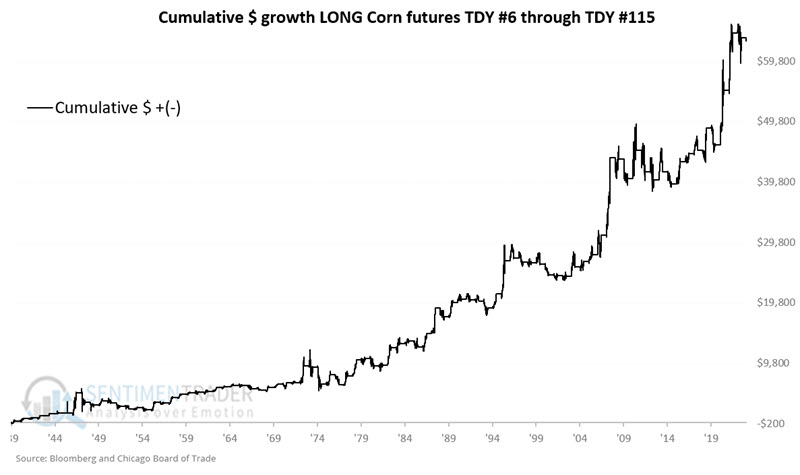
The good news is that a favorable seasonal period extends from Trading Day of Year #6 through TDY #115. For 2024, that period runs from 2024-01-09 through 2024 06-14. The bad news is that there is never a guarantee that corn will, in fact, rally during this period during any given year - and 2024 is off to a lousy start.
The chart below displays the hypothetical cumulative $ +(-) achieved by holding a long position in corn futures during TDY #6 through TDY #115 every year starting in 1940.
This suggests looking for a price trend to confirm or some sign from another indicator that the tide may turn more favorable before getting in. Since the price trend is not cooperating so far, let's look at another indicator that suggests the potential for a turnaround in corn.
As corn prices have trended lower in the past six months, corn trader sentiment has fallen sharply. It's recently reached a level that has typically seen higher prices six months hence. The chart and table below highlight all dates when our Corn Optix indicator stood at 20% or below.
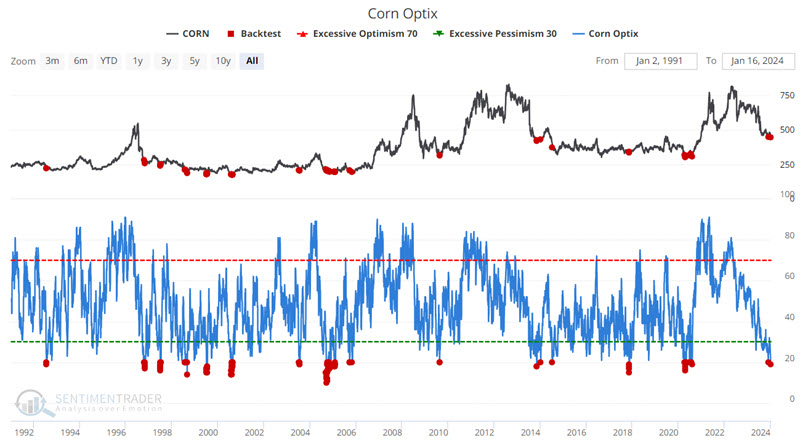
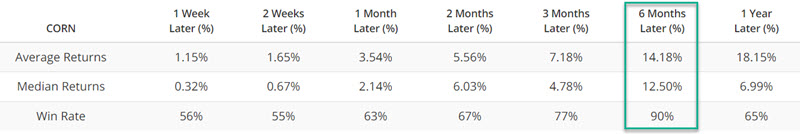
Following previous signals, corn prices stood higher six months later, 90% of the time. This dovetails nicely with the seasonal outlook for corn shown above. Traders unwilling to trade corn futures can consider the Teucrium Corn Fund (ticker CORN). Shares of CORN can be bought and sold just like shares of stock in a standard stock brokerage account. Ticker CORN is designed to track the price of corn futures.
About TradingEdge Weekly...
The goal of TradingEdge Weekly is to summarize some of the research published to SentimenTrader over the past week. Sometimes there is a lot to digest, and this summary highlights the highest conviction or most compelling ideas we discussed. This is NOT the published research; rather, it pulls out some of the most relevant parts. It includes links to the published research for convenience, and if you don't subscribe to those products, it will present the options for access.
Indicators at Extremes
|
|
|
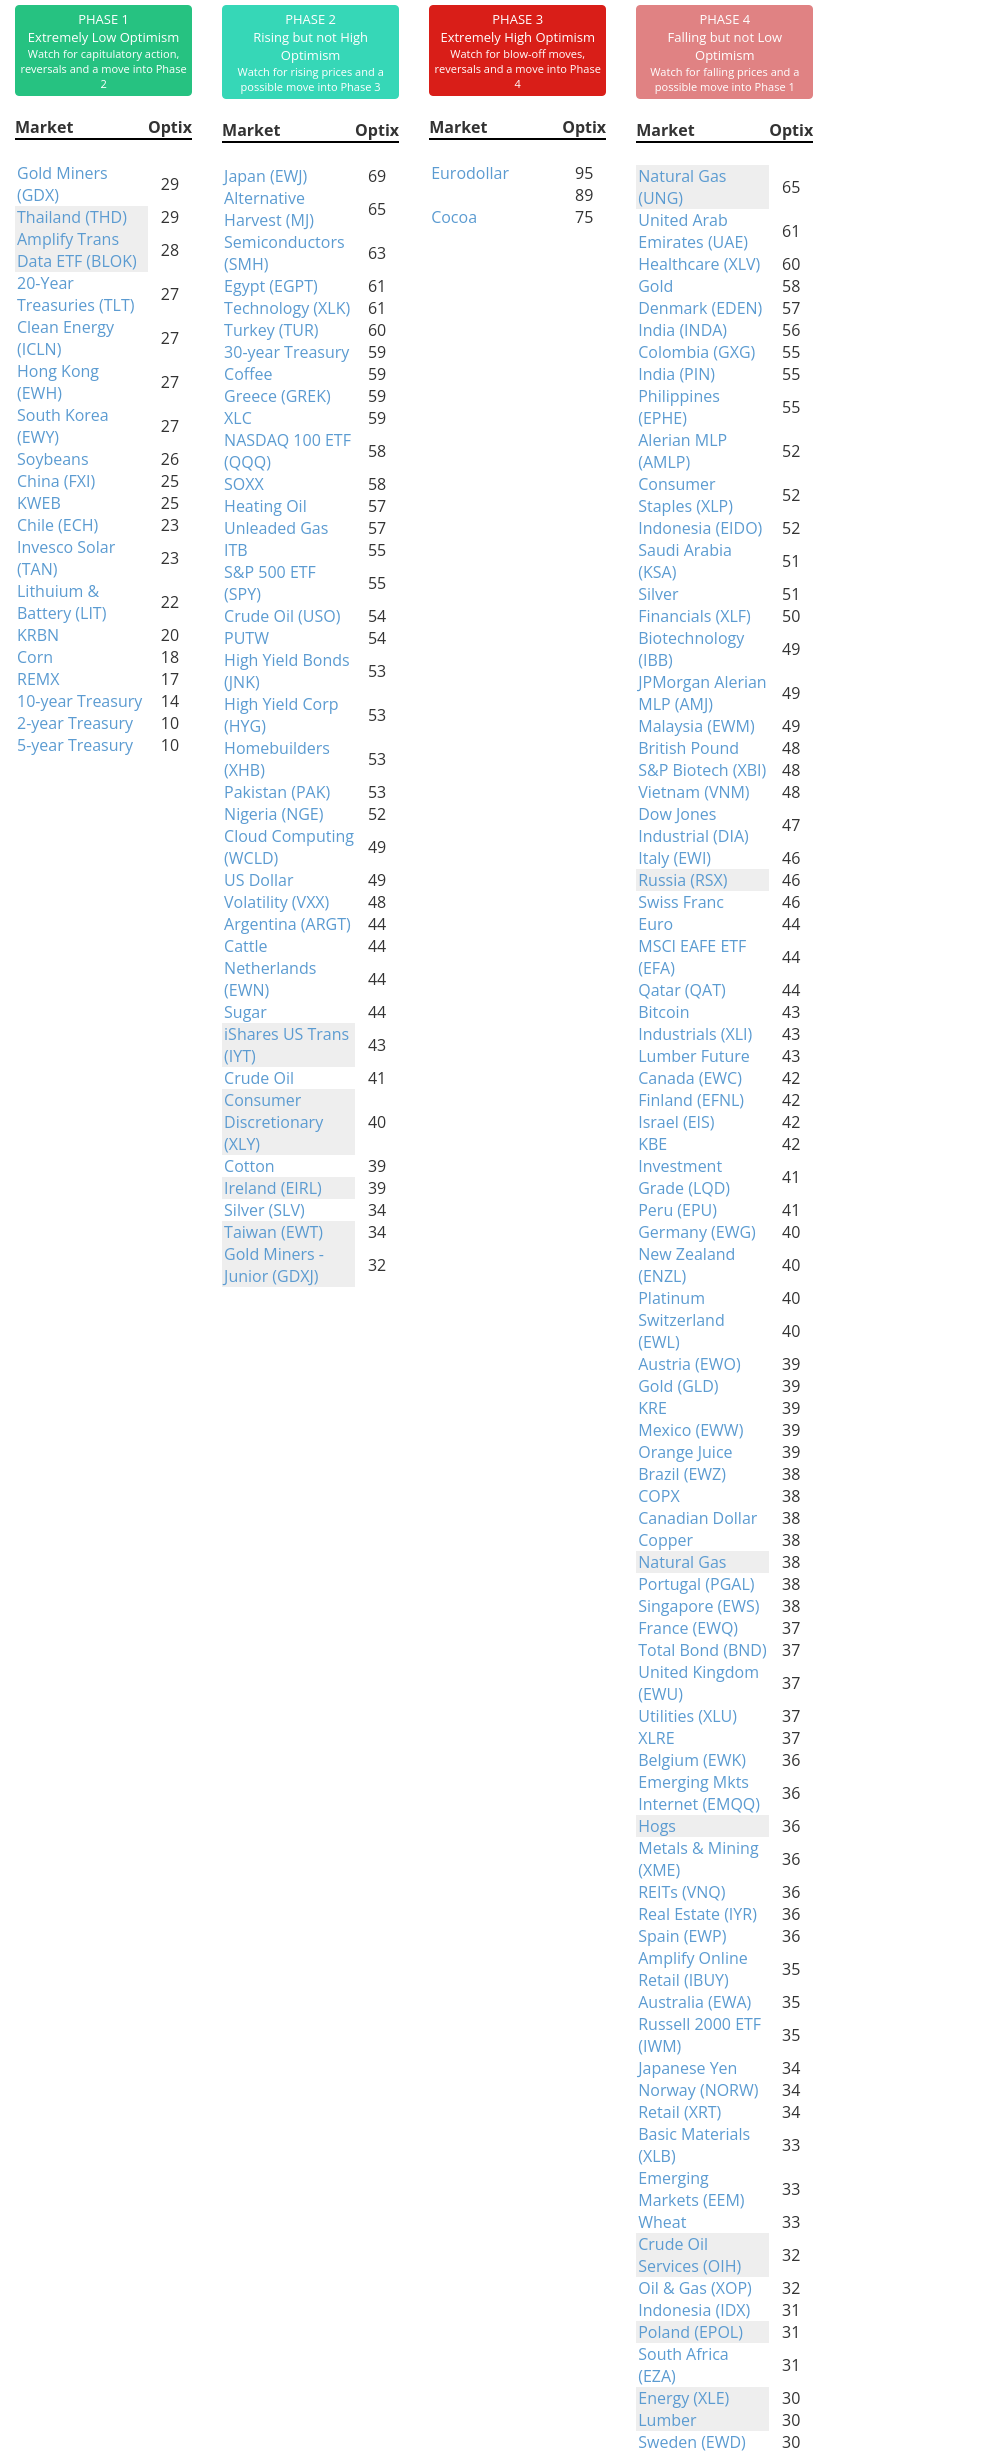
Phase Table
|
|
|
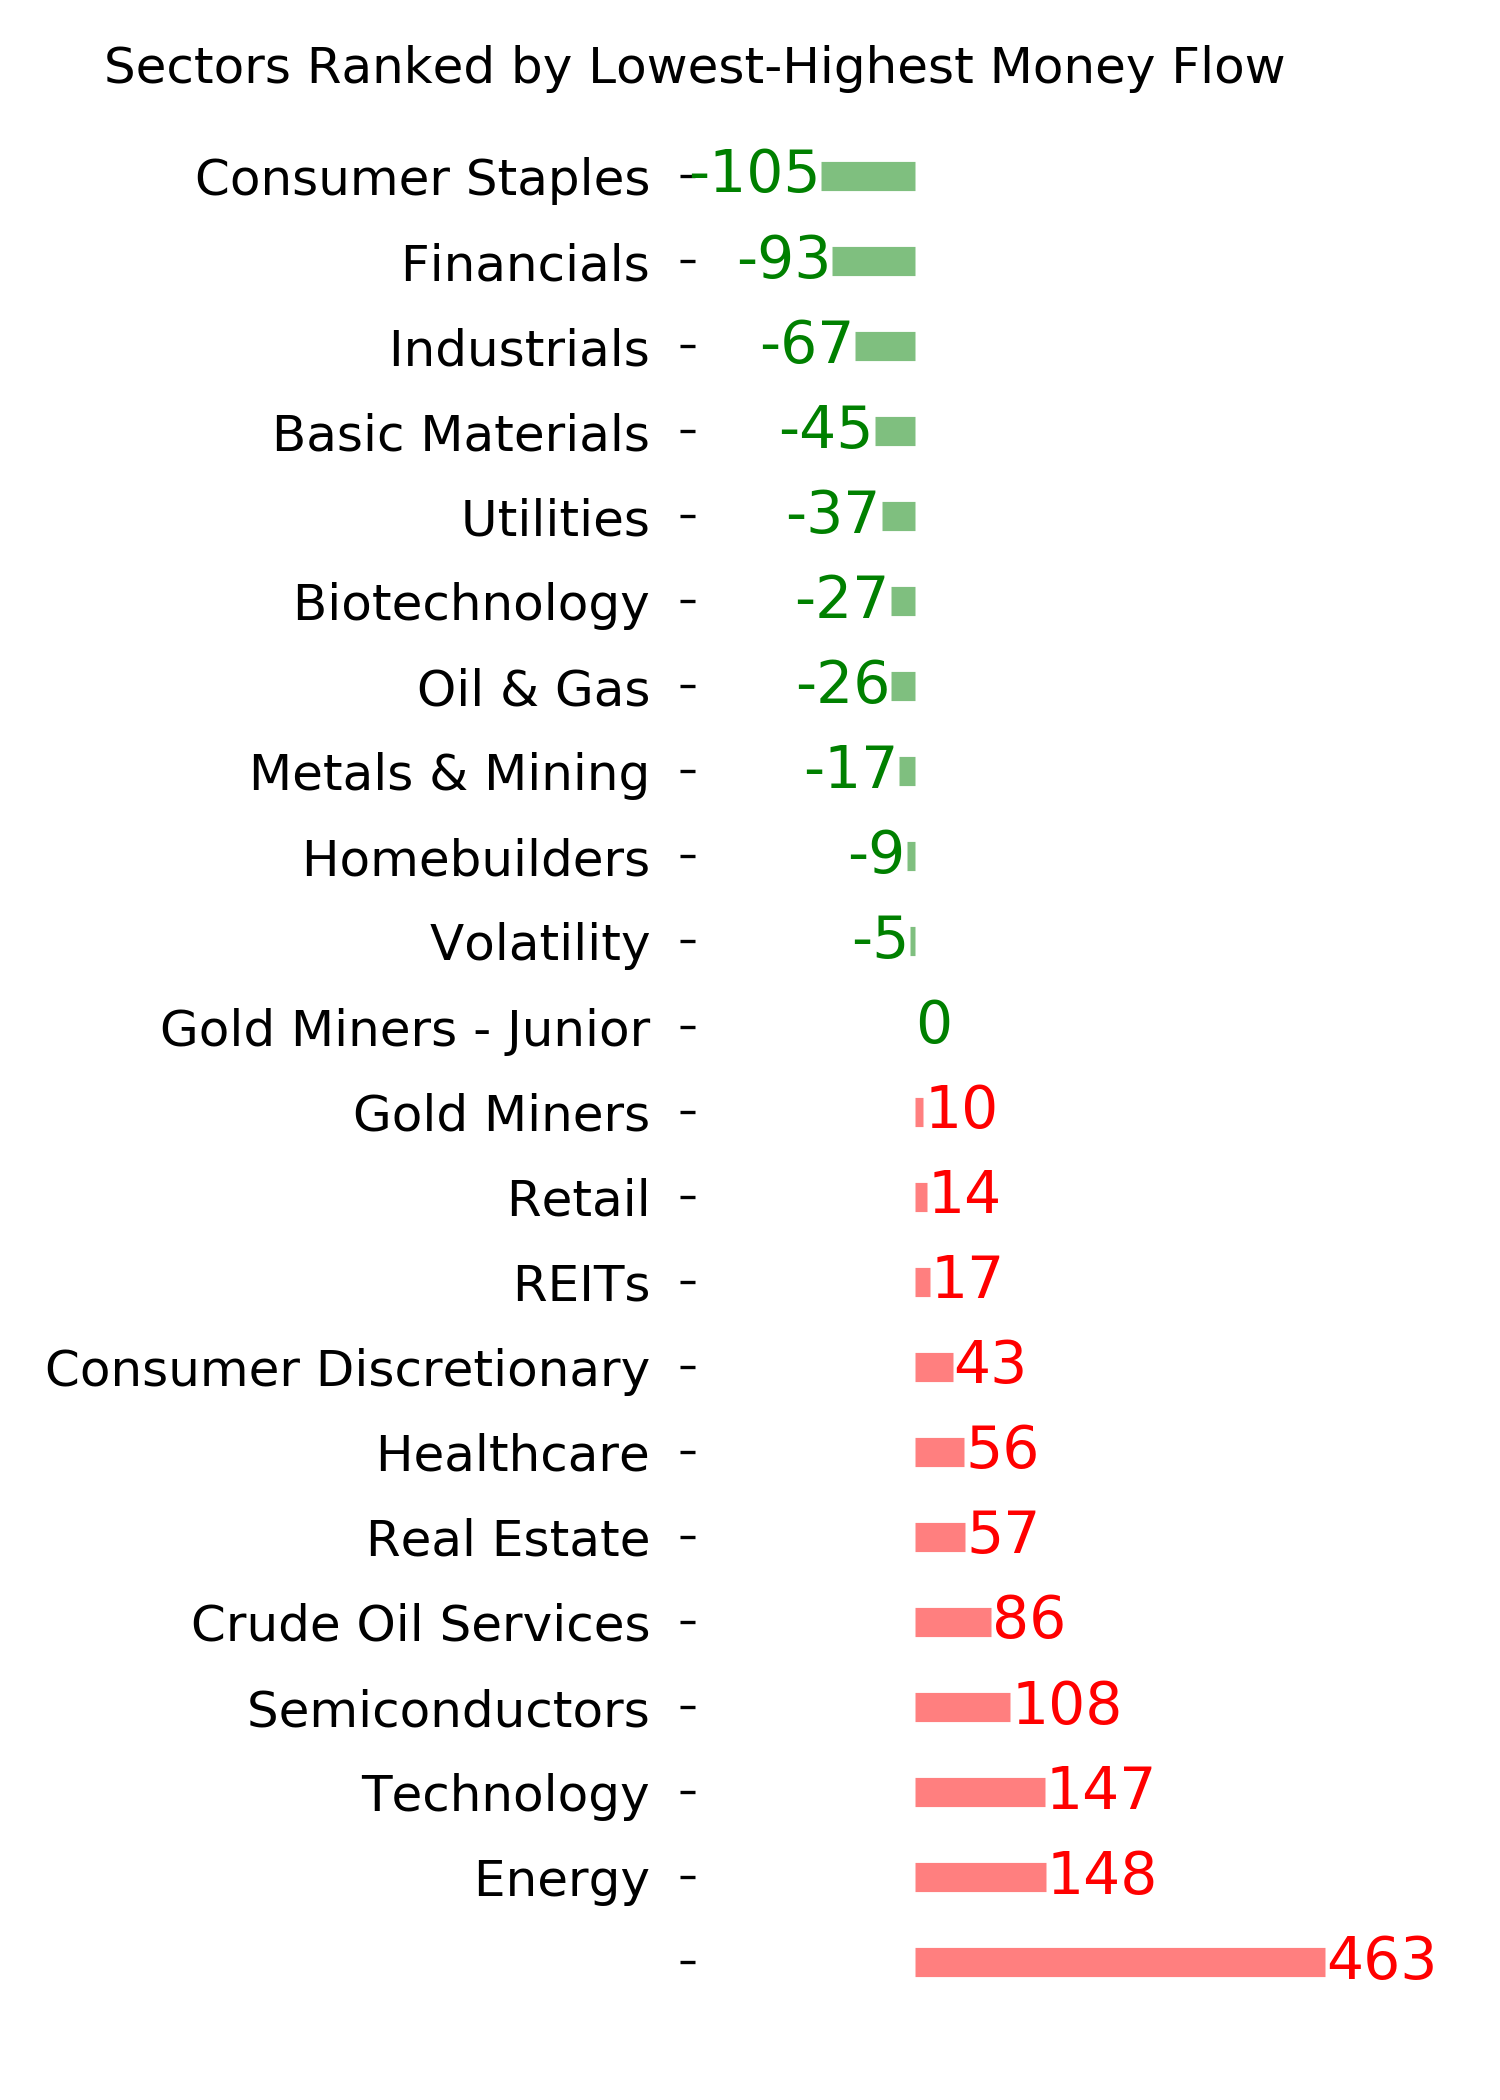
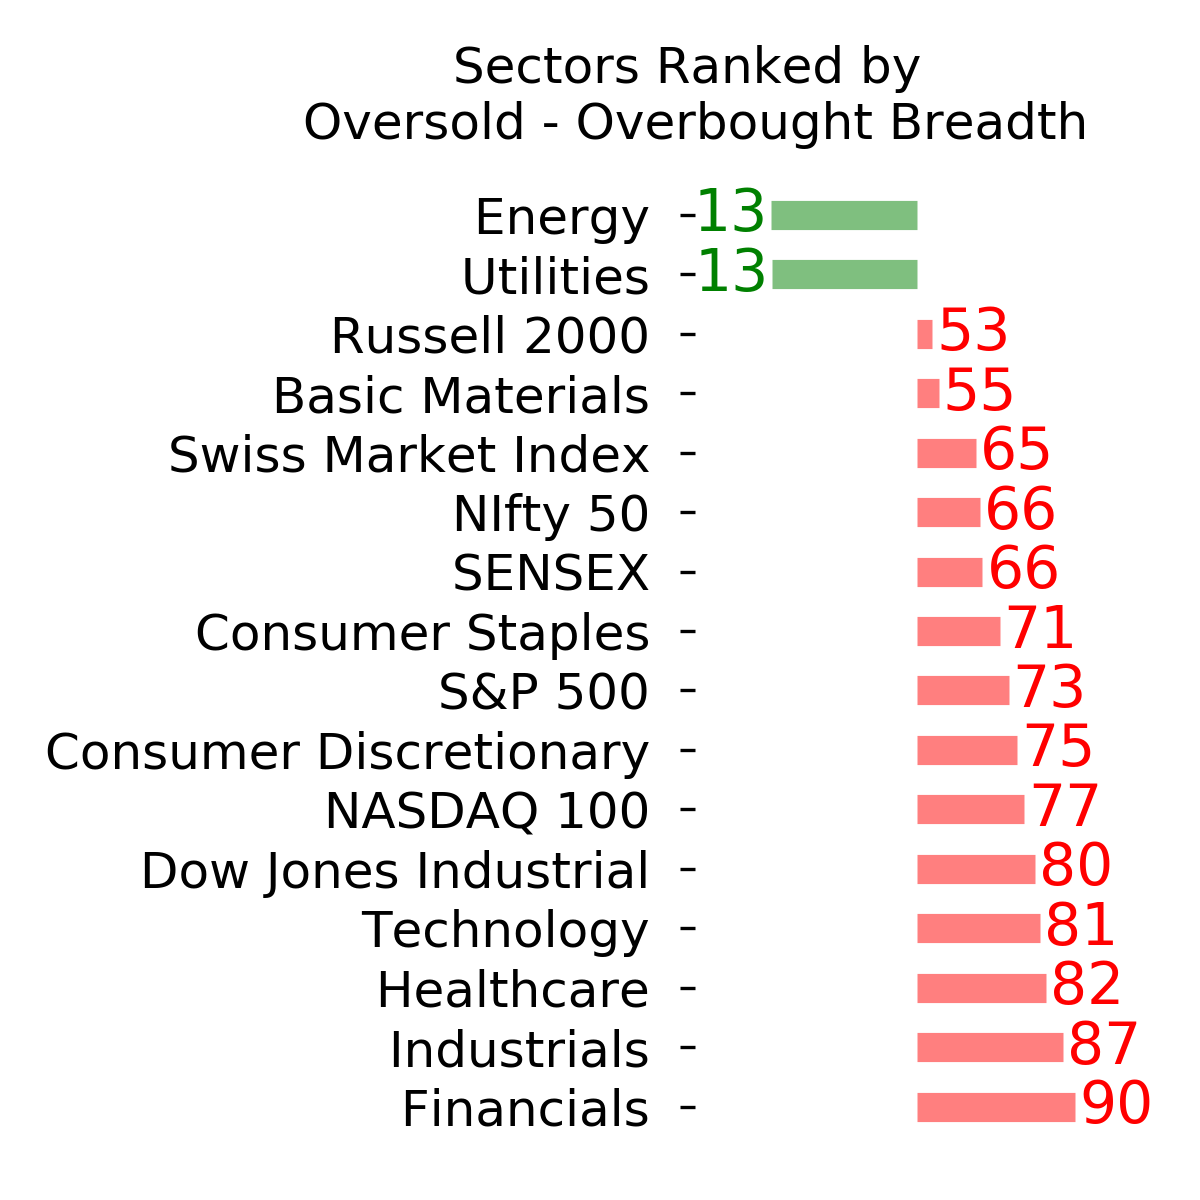
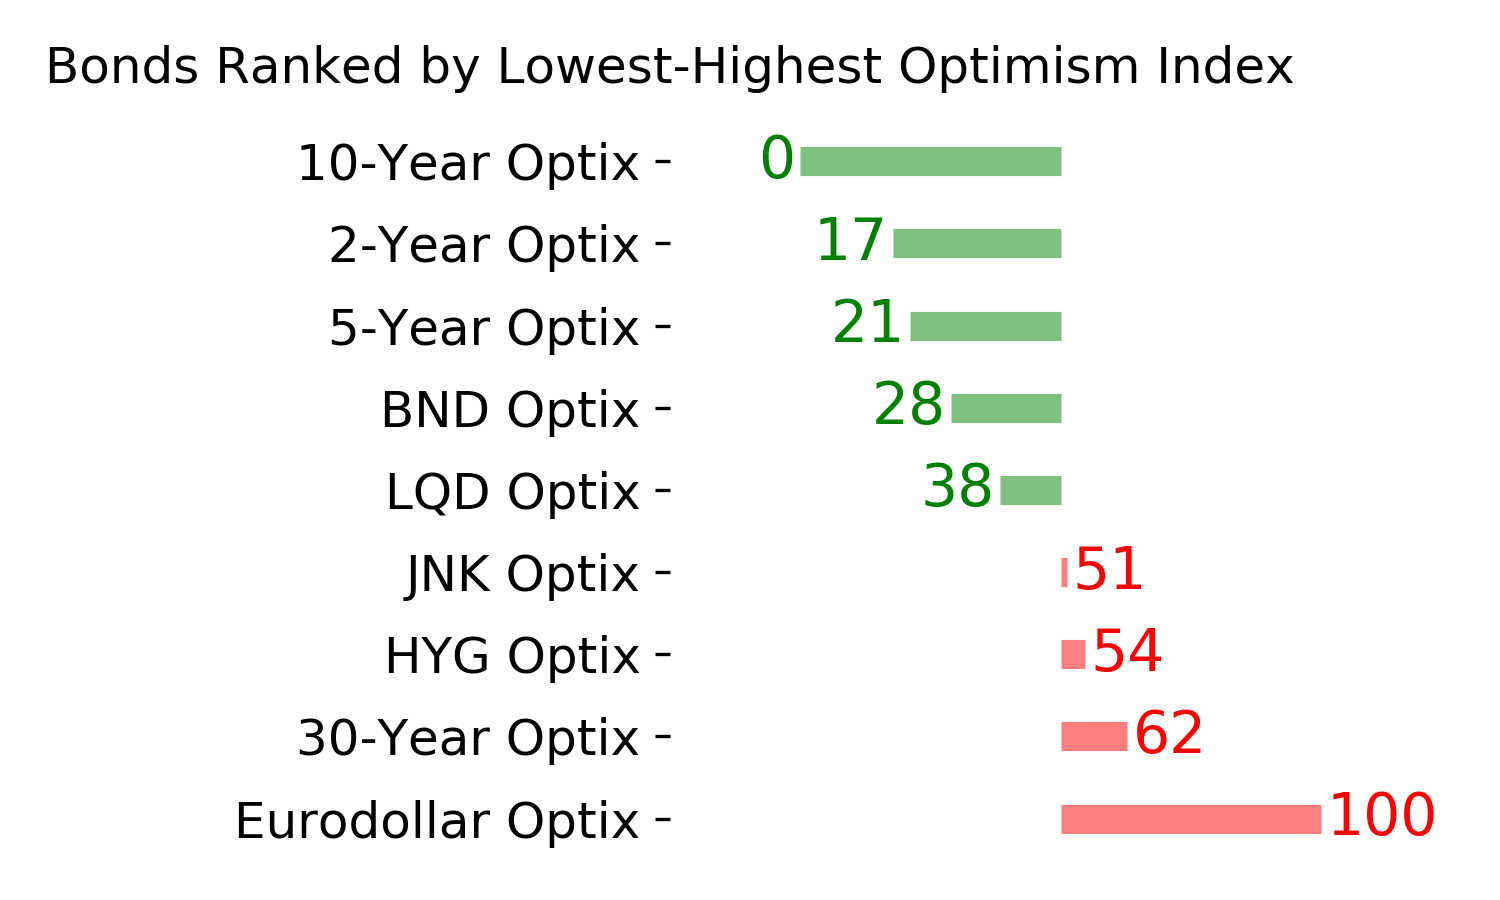
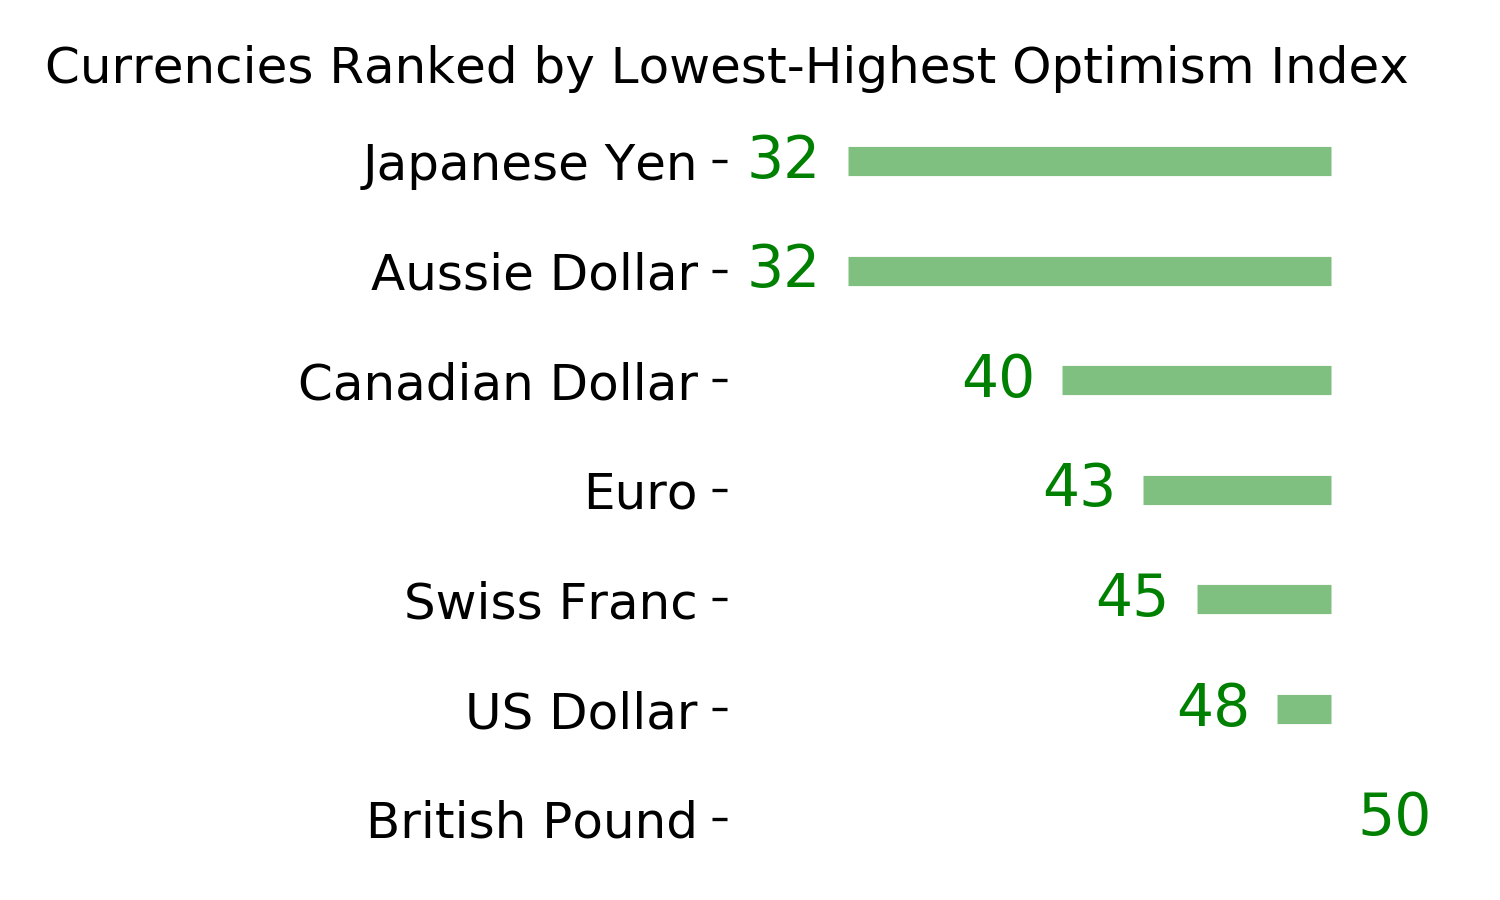
Ranks
|
|
|
|
|
|
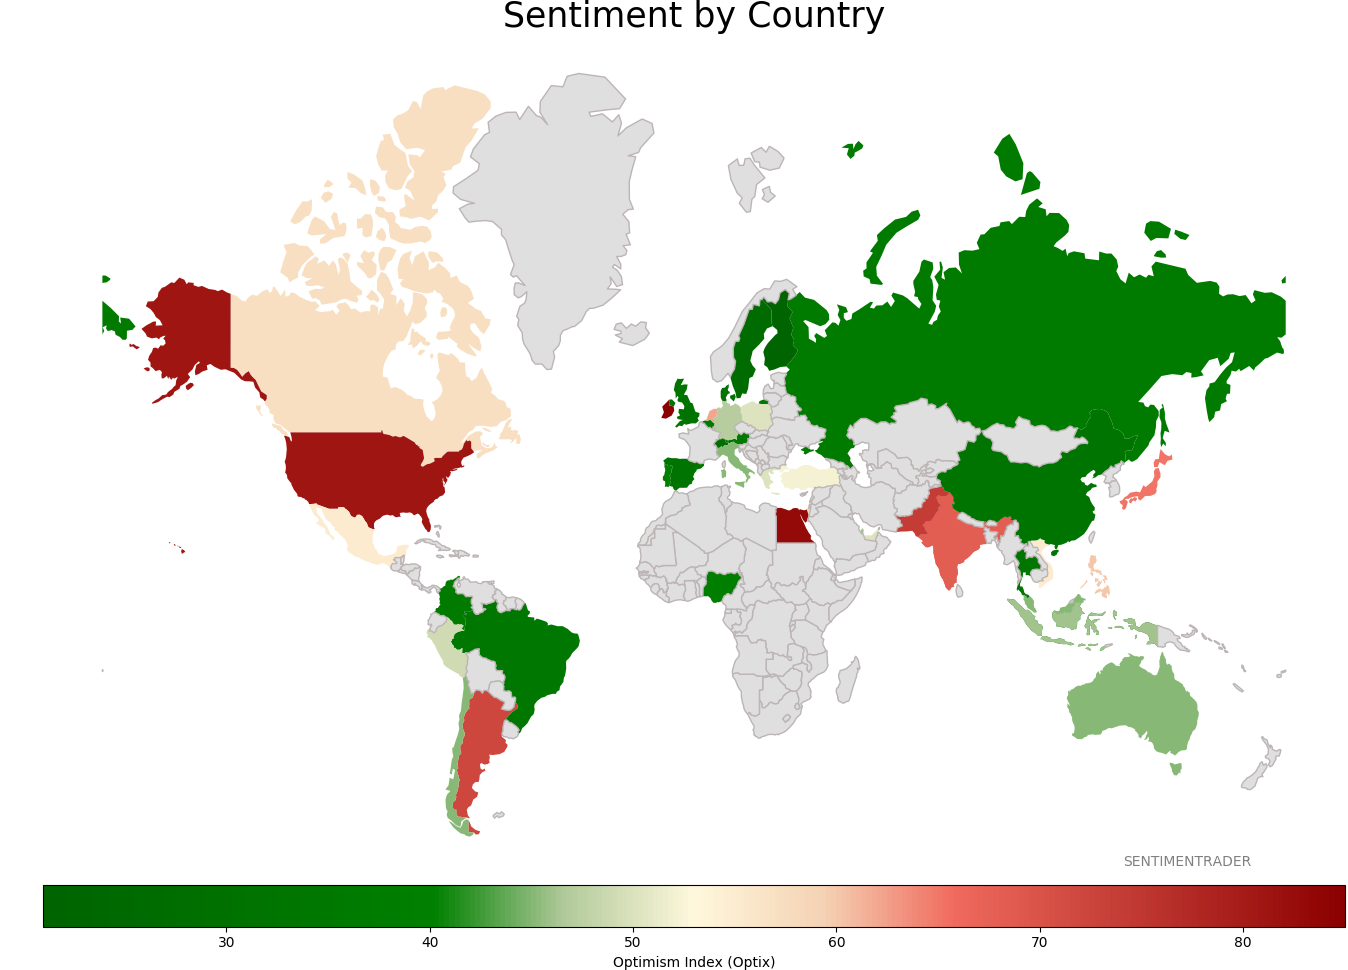
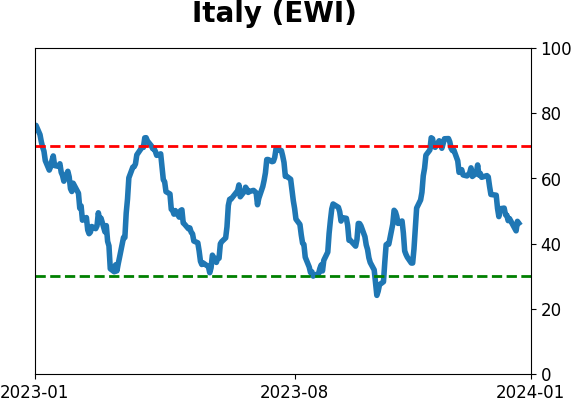
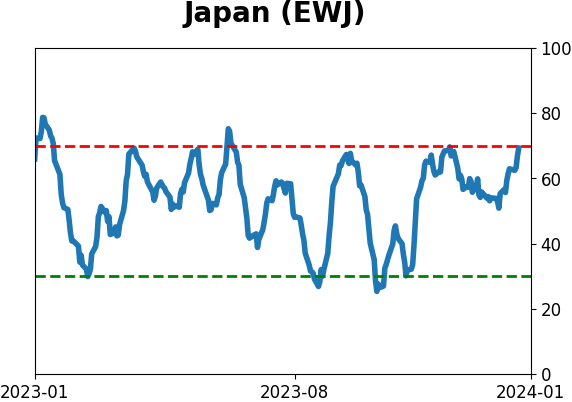
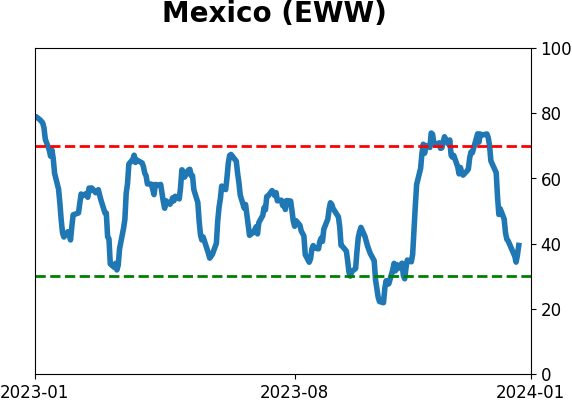
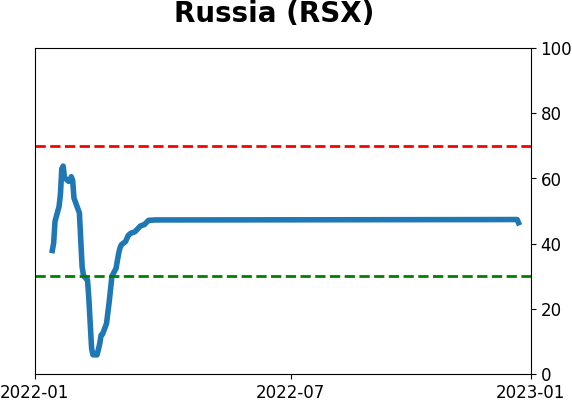
Sentiment Around The World
|
|
|
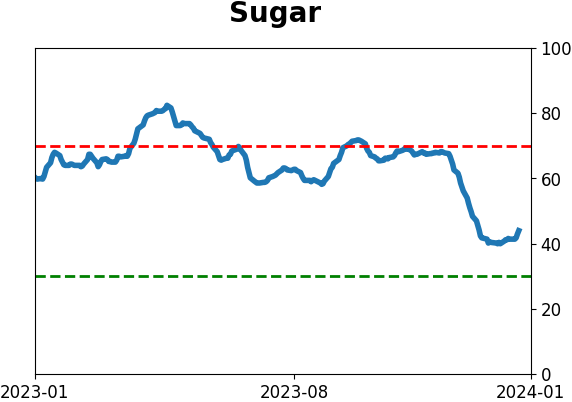
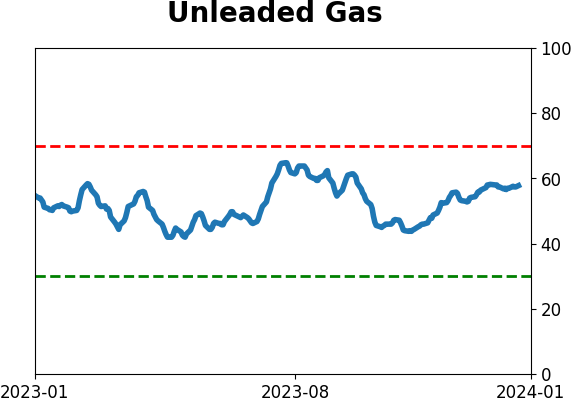
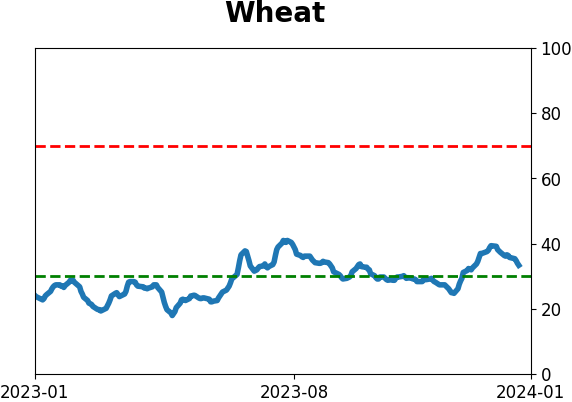
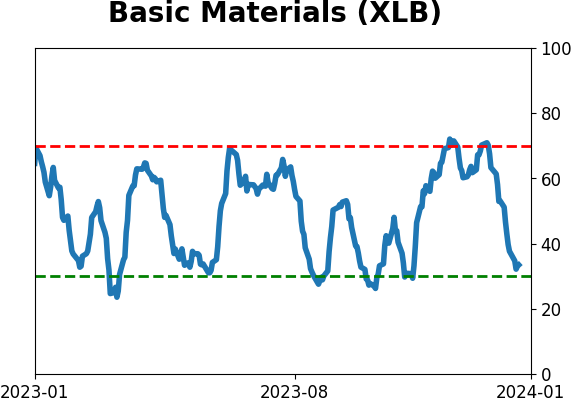
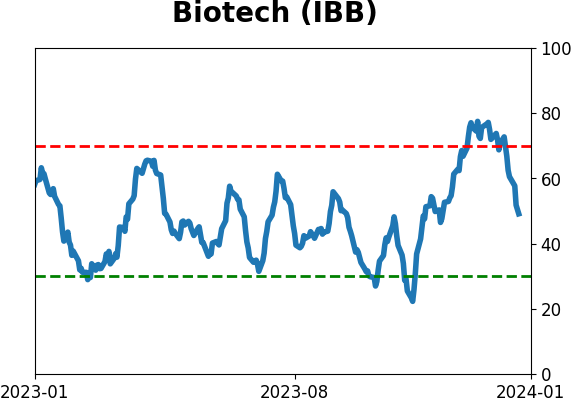
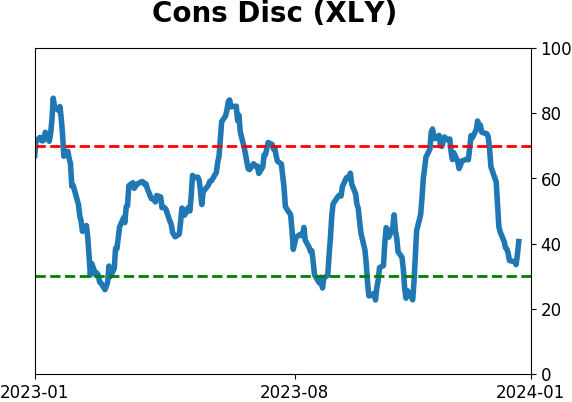
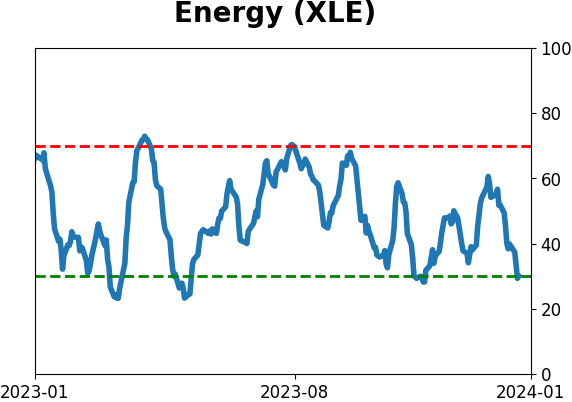
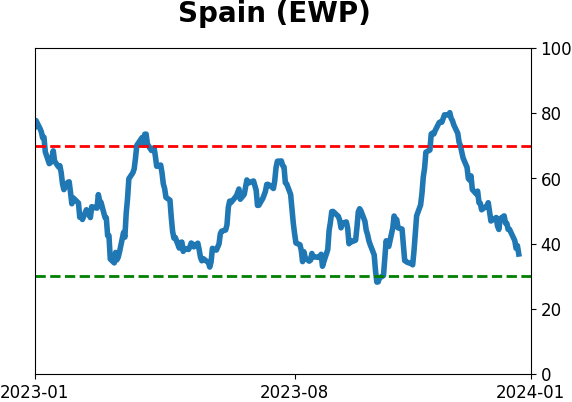
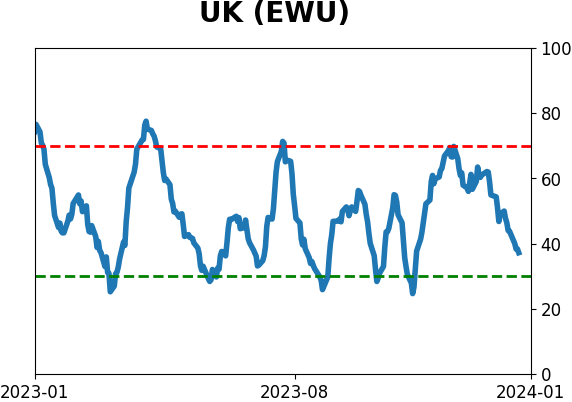
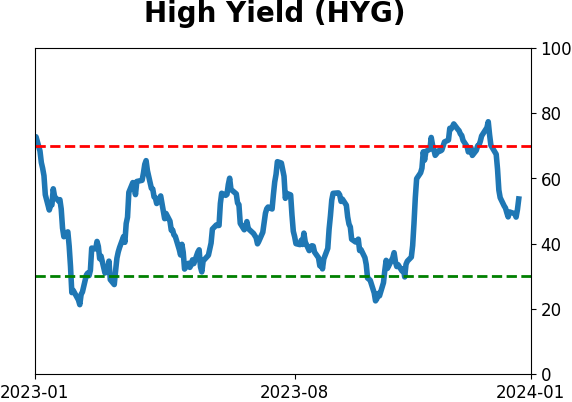
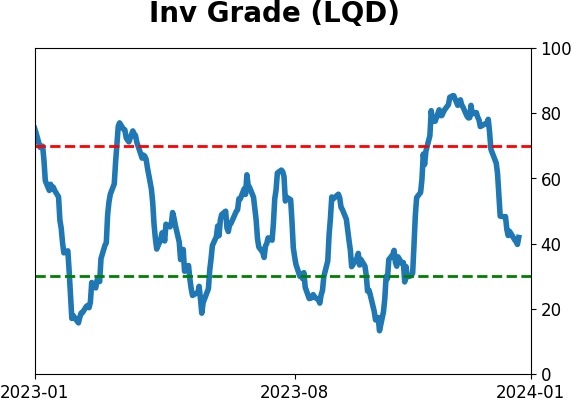
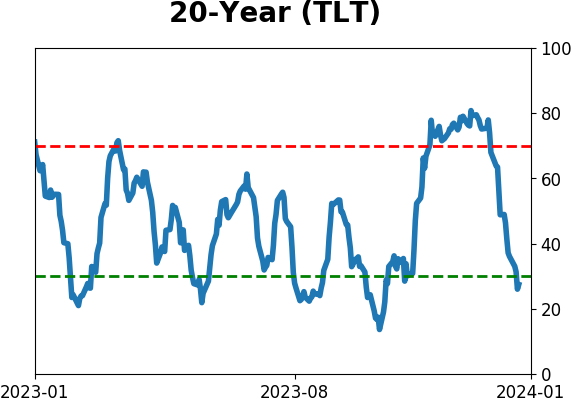
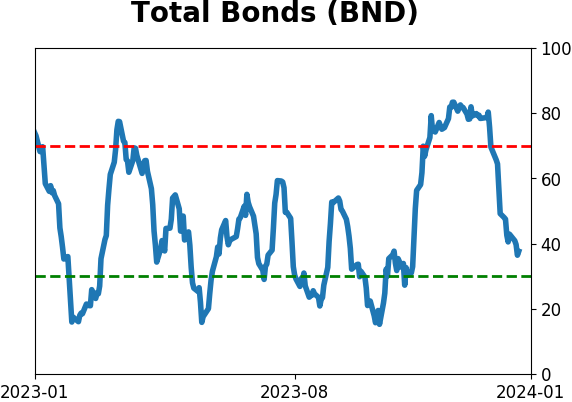
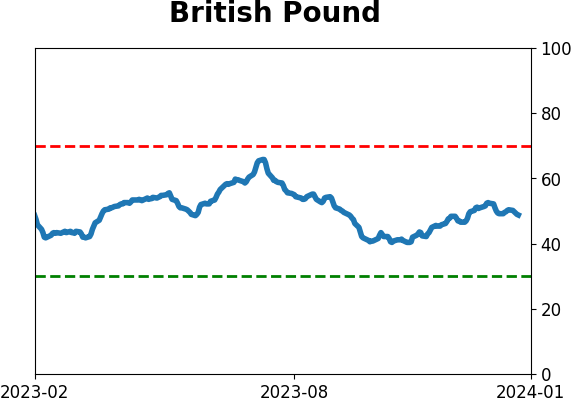
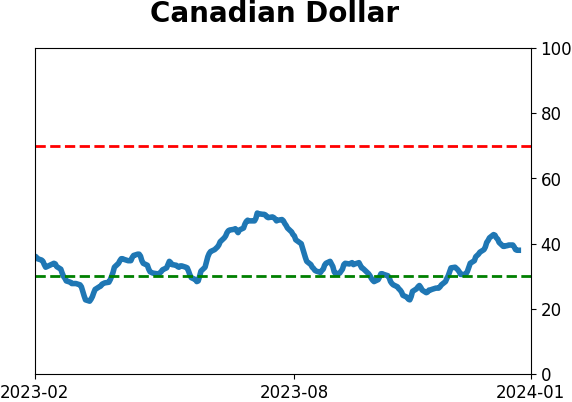
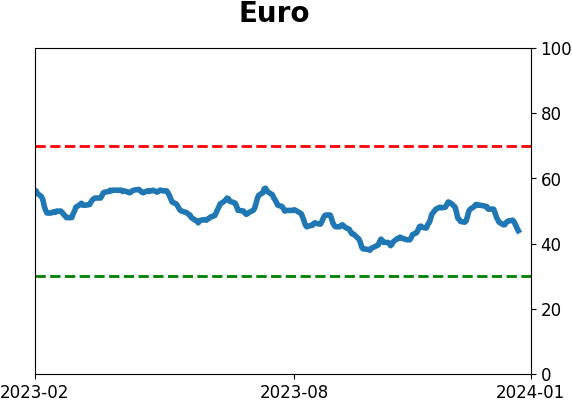
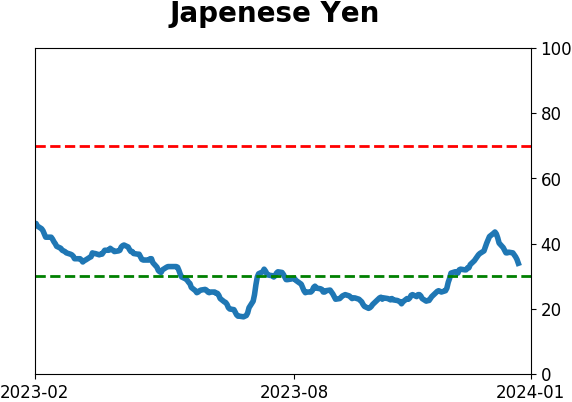
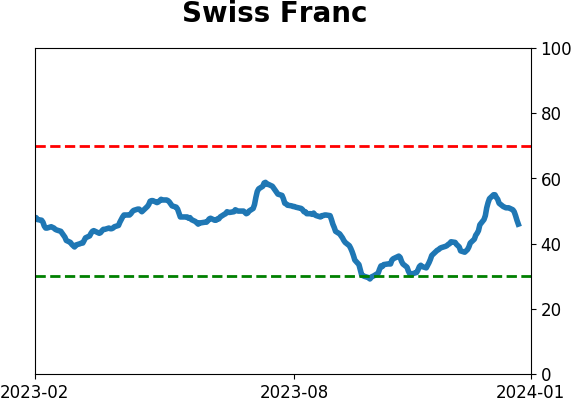
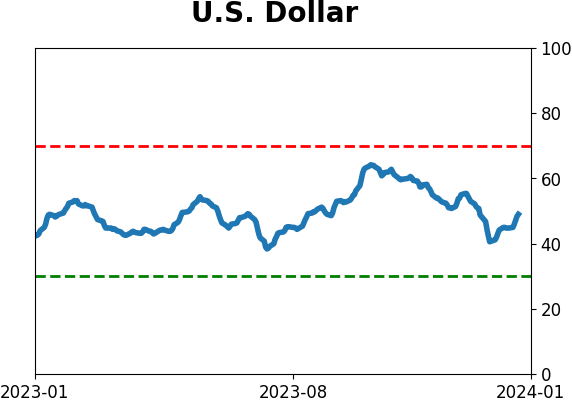
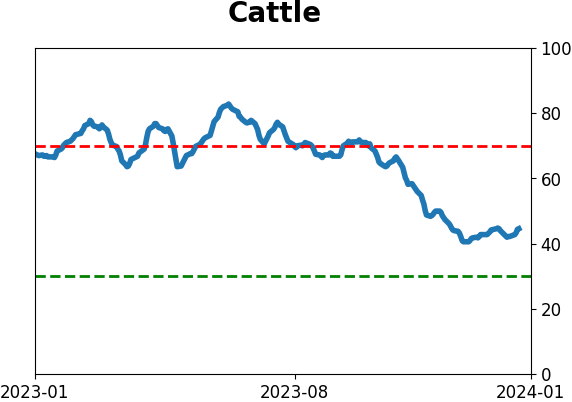
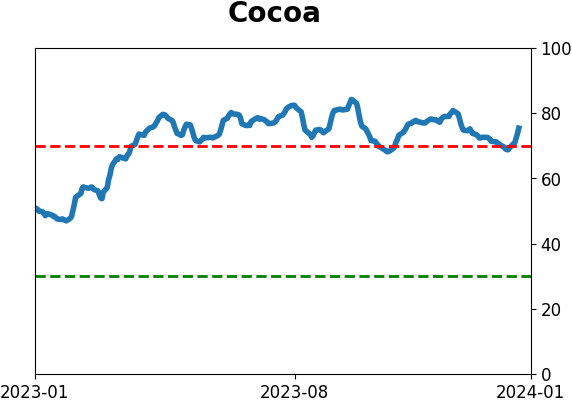
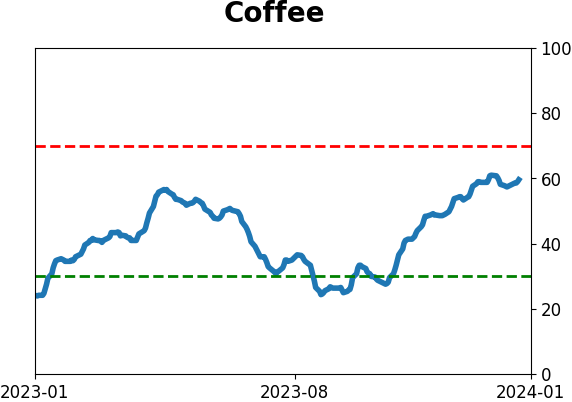
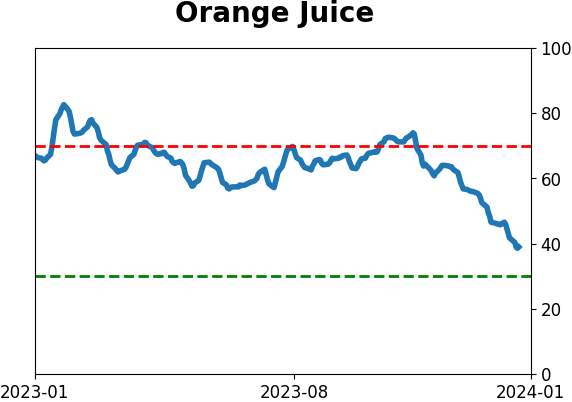
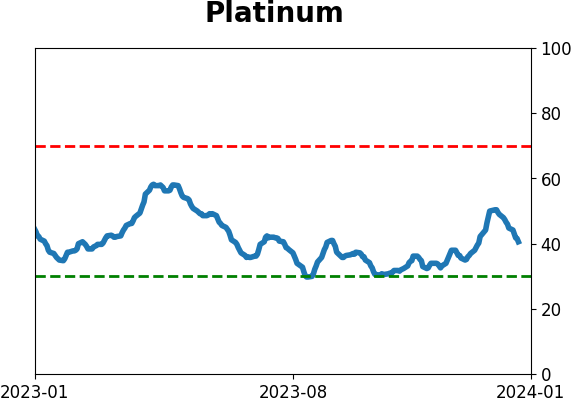
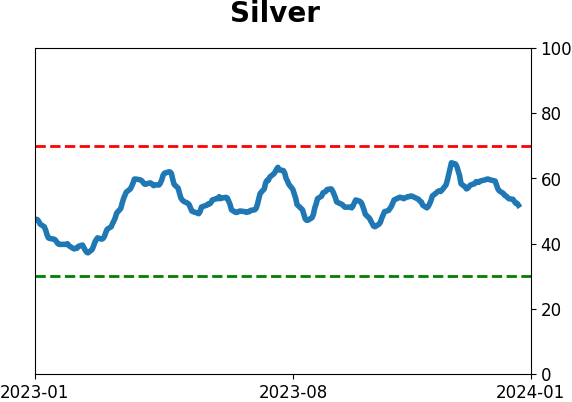
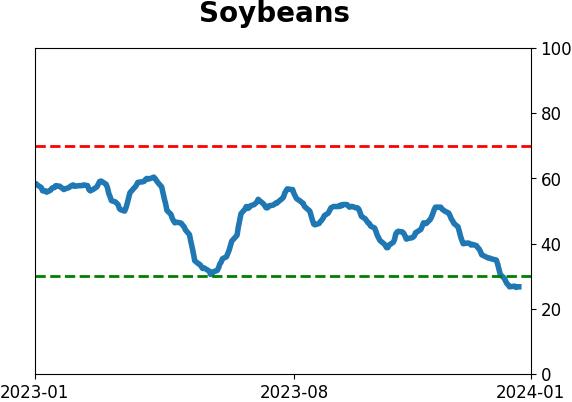
Optimism Index Thumbnails
|
|
|
|
|
|
|
|
|
|
|
|
|
|
|
|
|
|
|
|
|