Headlines
|
|
Sentiment turns risk-off as the market environment sours:
More and more indicators are showing deteriorating conditions under the surface, and it's contributing to a general risk-off attitude among investors. When this is the case, stocks tend to struggle until a pessimistic extreme is reached.
|
Smart / Dumb Money Confidence
|
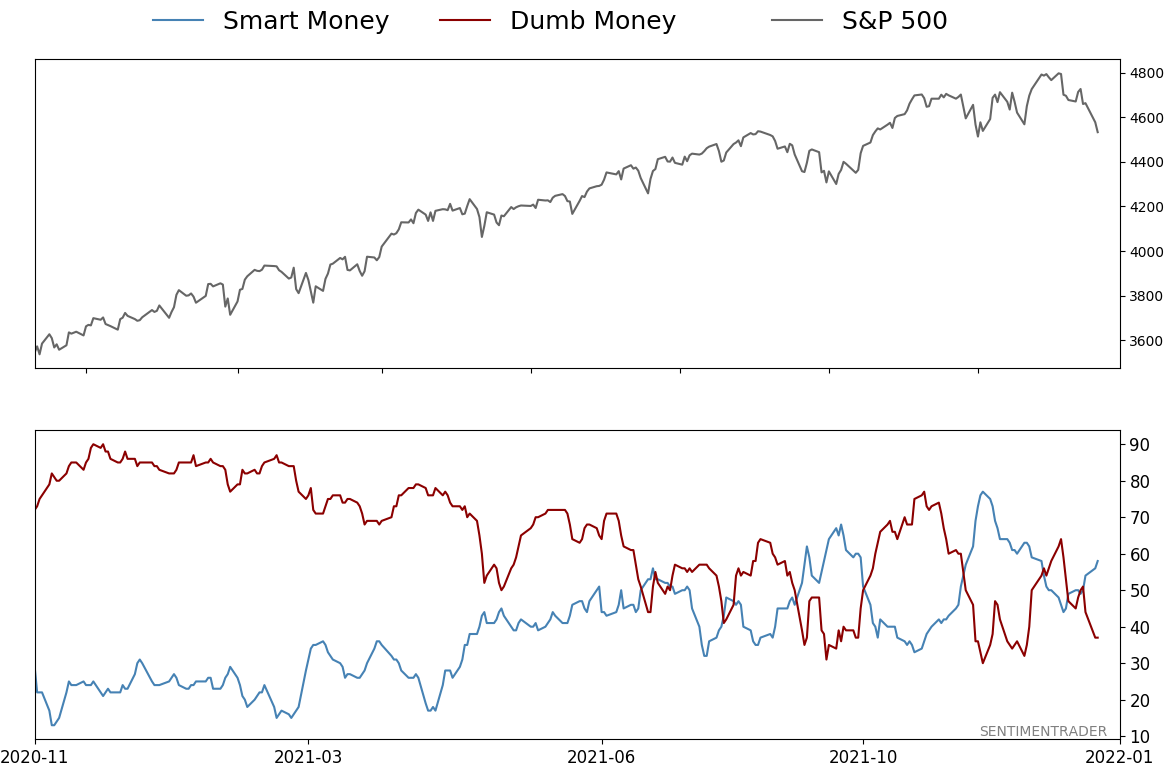
Smart Money Confidence: 58%
Dumb Money Confidence: 37%
|
|
Risk Levels
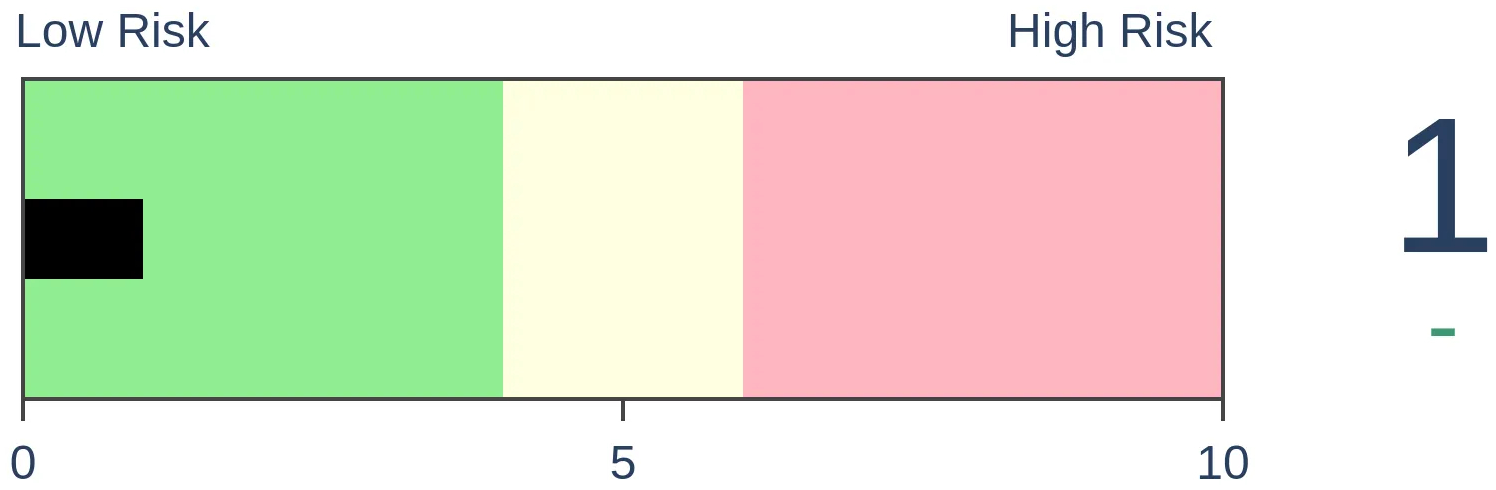
Stocks Short-Term
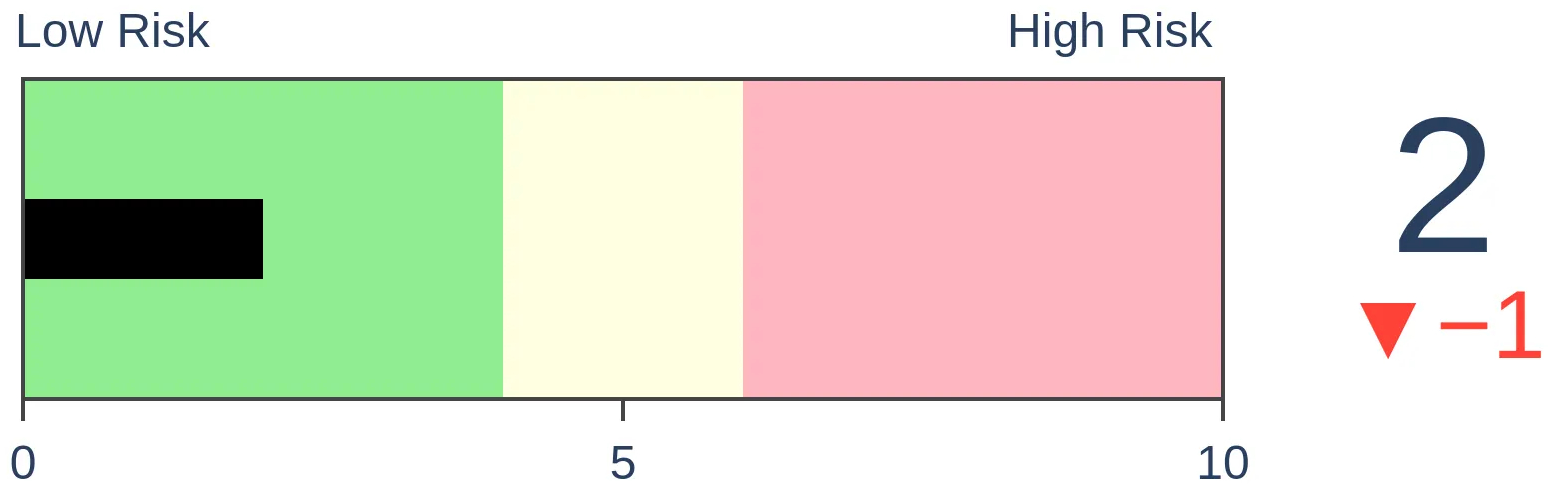
|
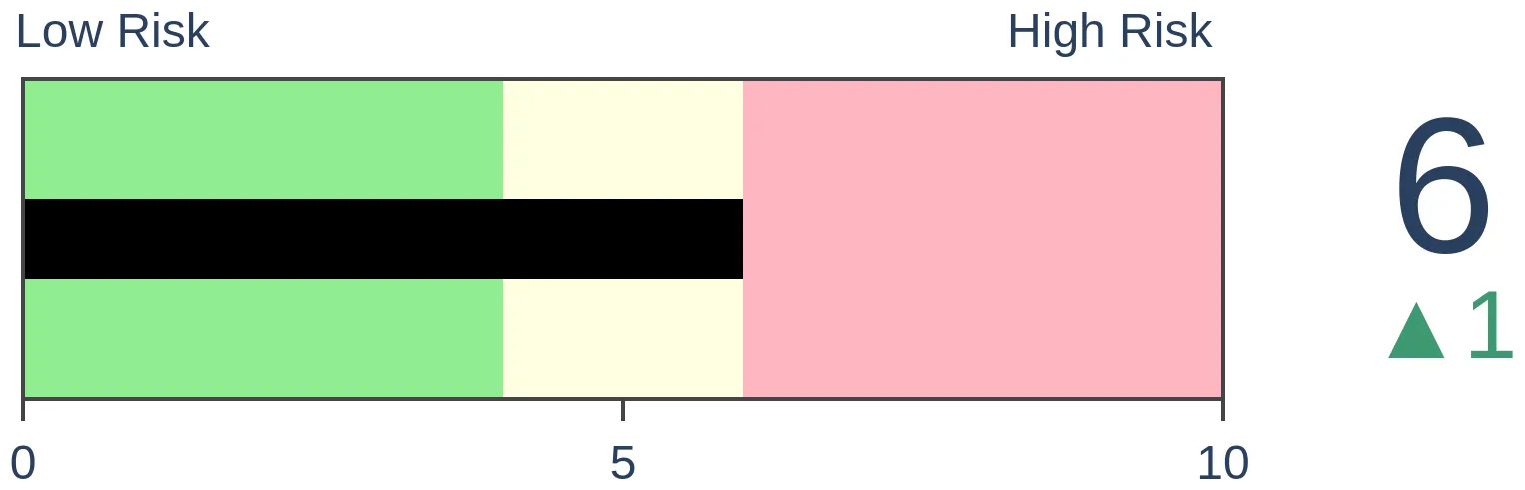
Stocks Medium-Term

|
|
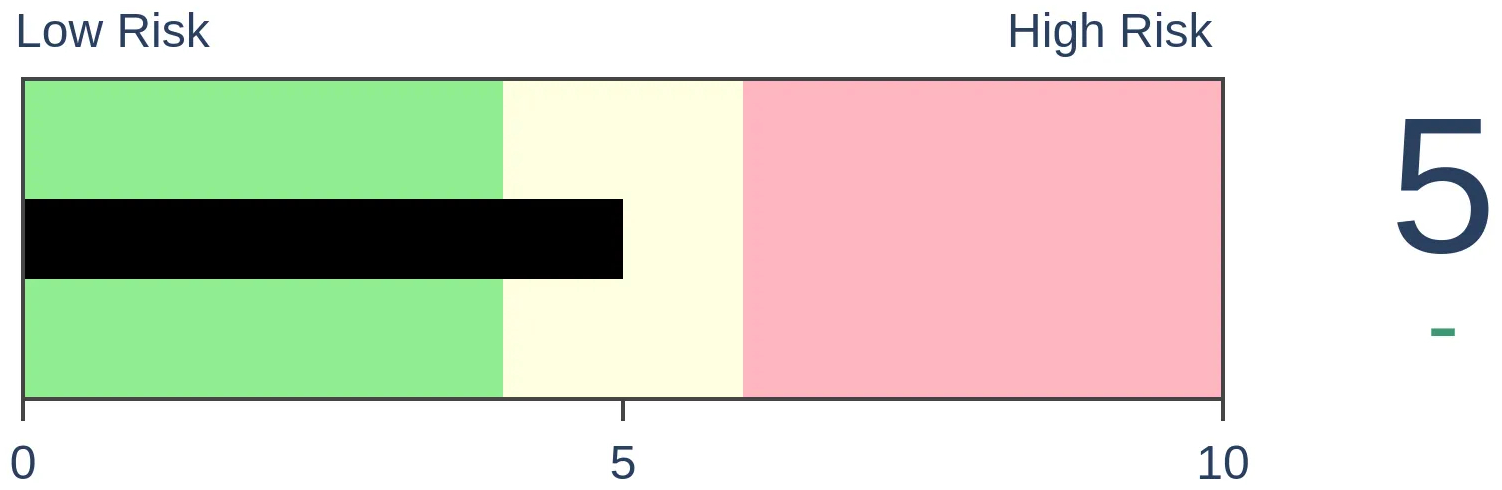
Bonds
|
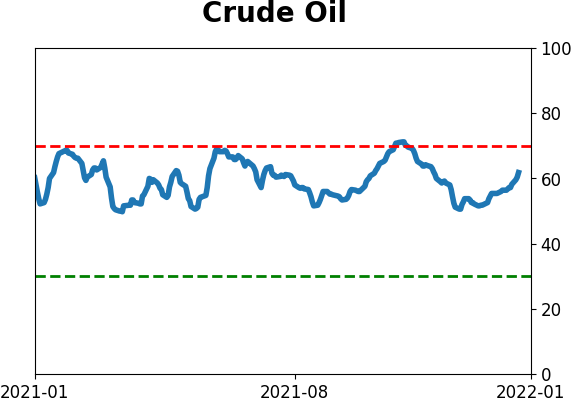
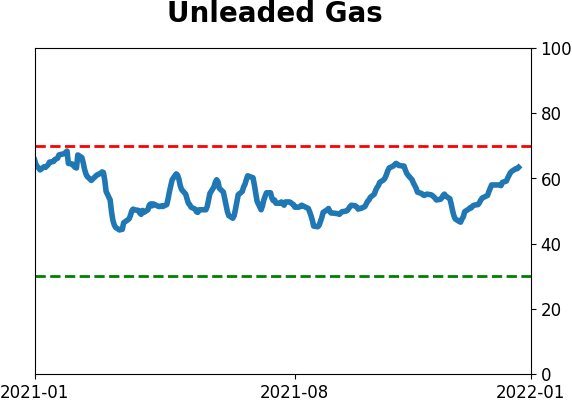
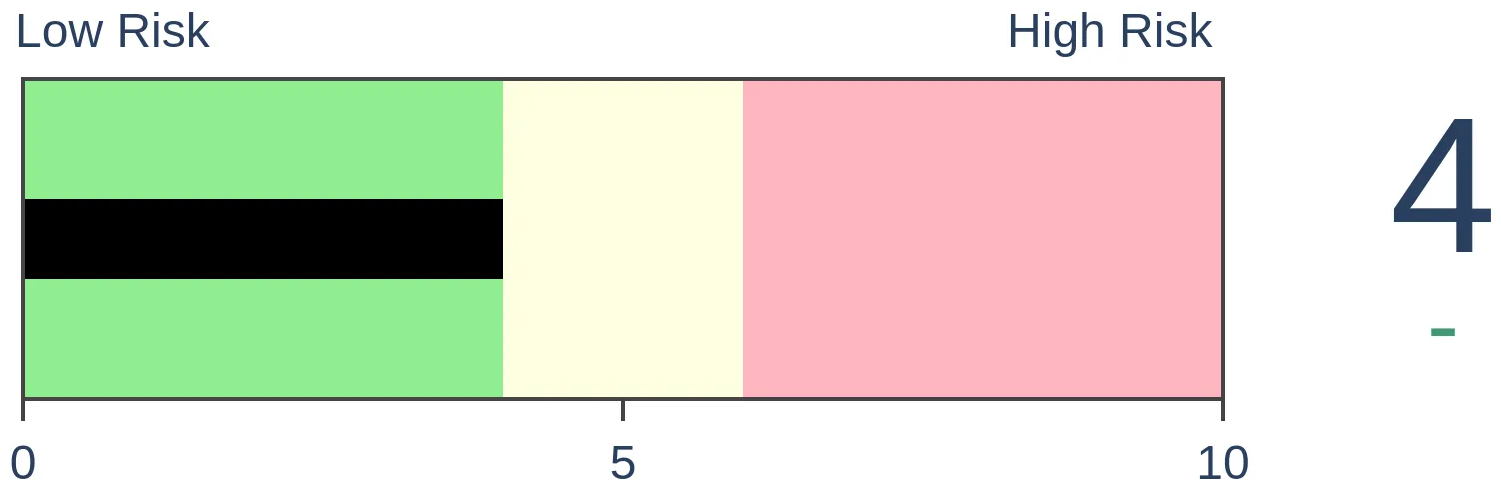
Crude Oil
|
|
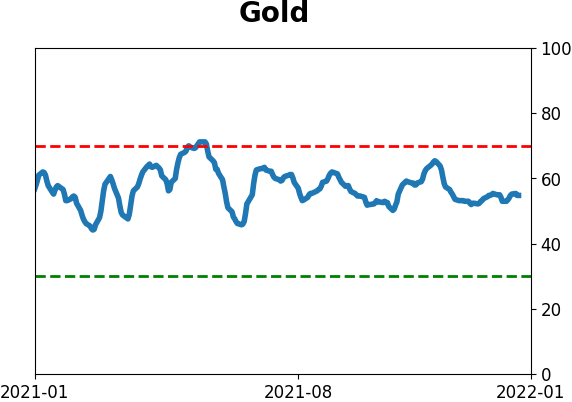
Gold
|
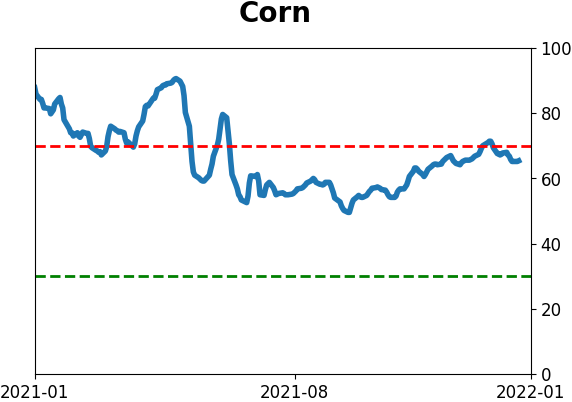
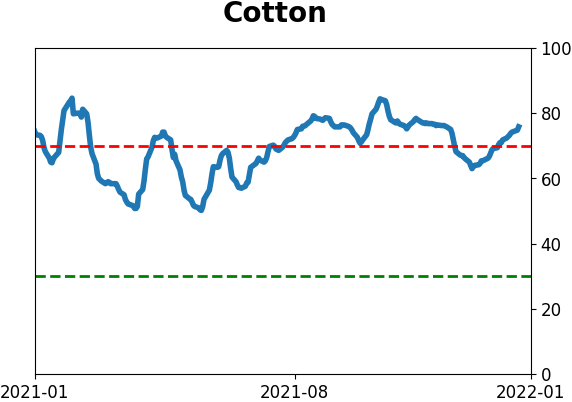
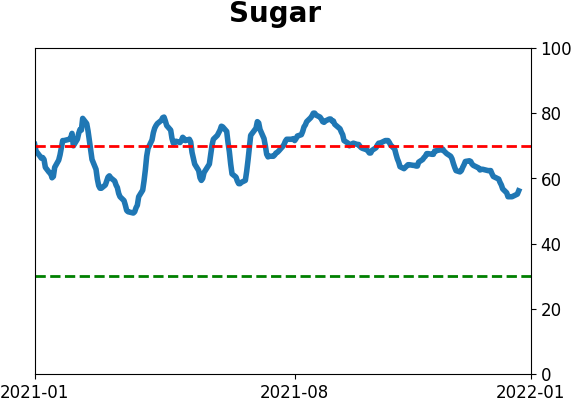
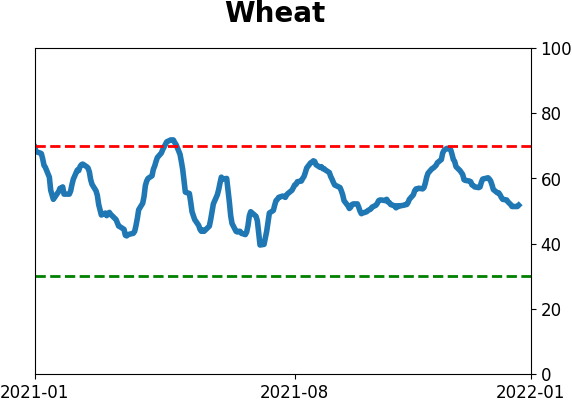
Agriculture
|
|
Research
By Jason Goepfert
BOTTOM LINE
More and more indicators are showing deteriorating conditions under the surface, and it's contributing to a general risk-off attitude among investors. When this is the case, stocks tend to struggle until a pessimistic extreme is reached.
FORECAST / TIMEFRAME
None
|
Key points:
- More indicators are showing a lack of enthusiasm on rallies
- At the same time, even small dips are generating high anxiety
- This can be a contrary indicator, but generally, it shows a troubling risk-off attitude
A general sense of unease
There have been some worrying signs lately. Rallies are being met with less and less enthusiasm, while declines, even tiny ones, are greeted with high anxiety.
On the surface, this could be a good thing and sometimes is. Knee-jerk contrarianism can work, especially in solid trends. But we've seen an extended period now where good news is being met with a collective yawn, or even aggressive selling pressure, while bad news is being exaggerated and extrapolated.
In the first week of the New Year, there was a thrust in short-term positive trends in the S&P 500. Instead of generating even more positive momentum as more buyers got sucked in, we've seen almost nothing but selling pressure. This runs counter to most of the other signals and has been a warning shot that we might be in a different environment to which we've become accustomed. A massive build-up of technical warning signs isn't helping.
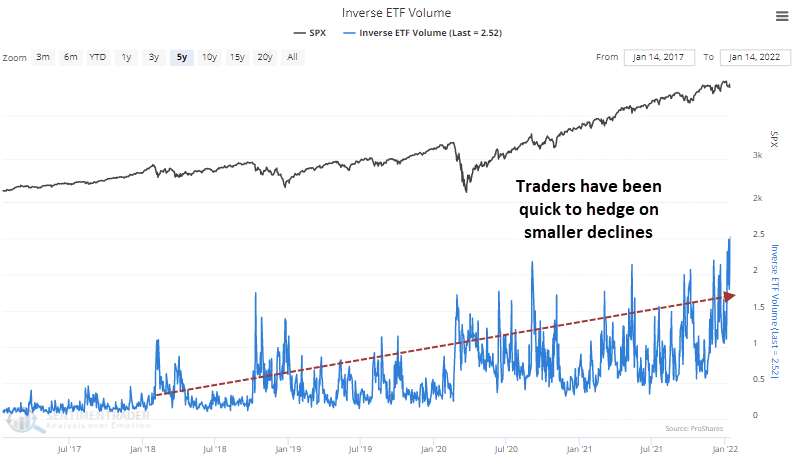
The anxiety has reached a point where inverse ETF volume, funds that profit when stocks decline, reached a record high on Friday. The 5-day average is now 20% higher than the previous peak from October 2021. Each successive dip has coincided with higher and higher anxiety. We can blame the new cadre of retail traders, but it's deeper than that.
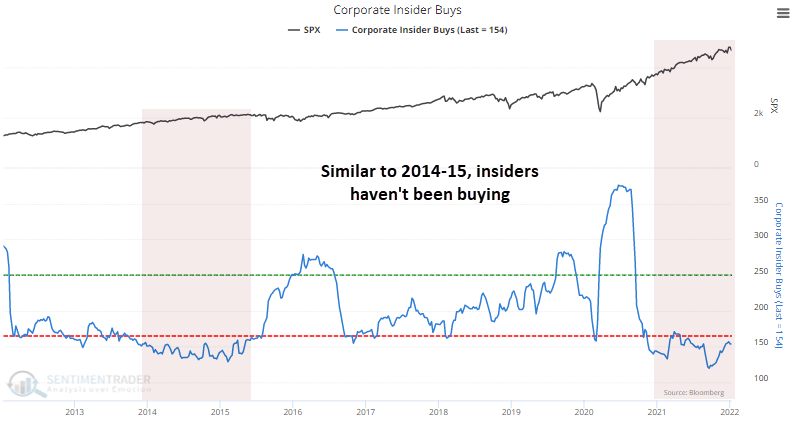
Corporate insiders have not been interested in buying stock in their own companies. Granted, they're not selling heavily, either. There has been significant buying interest in some sectors (even technology).
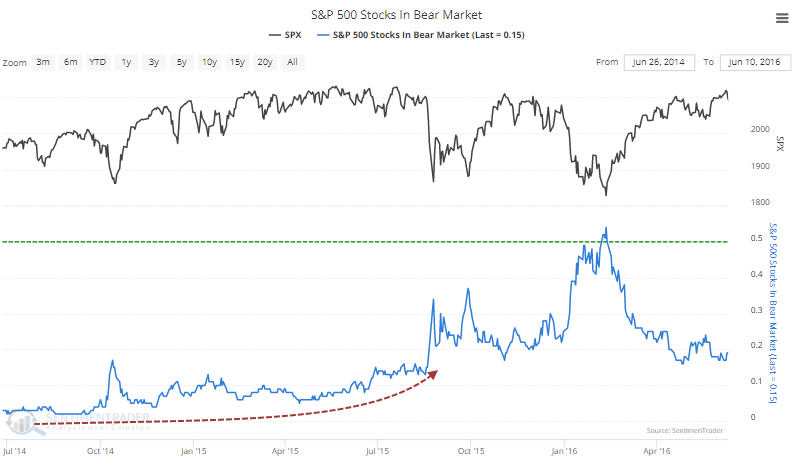
A couple of weeks ago, we saw that a record number of securities on the Nasdaq exchange had been cut in half, relative to how little the Nasdaq Composite has declined from its peak. While not nearly as dramatic, within the S&P 500, there has been a steady uptick in the percentage of companies mired in bear markets.
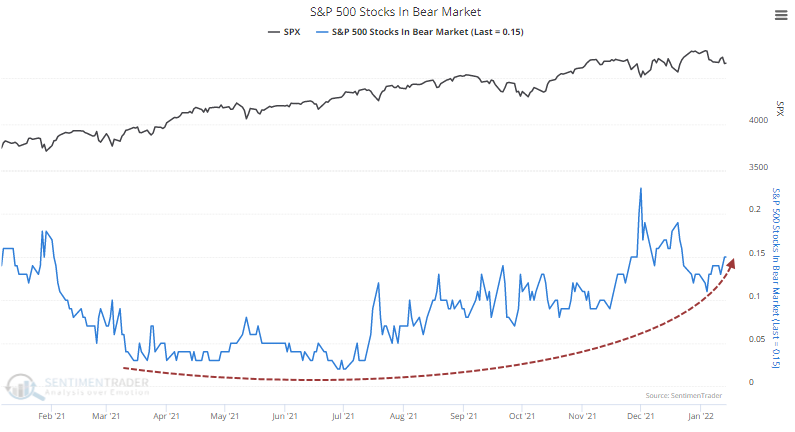
This is similar to what happened in 2014-15 when a steadily rising number of stocks were getting sold heavily while the index made new highs. It didn't bottom until half of all stocks were in bear markets.
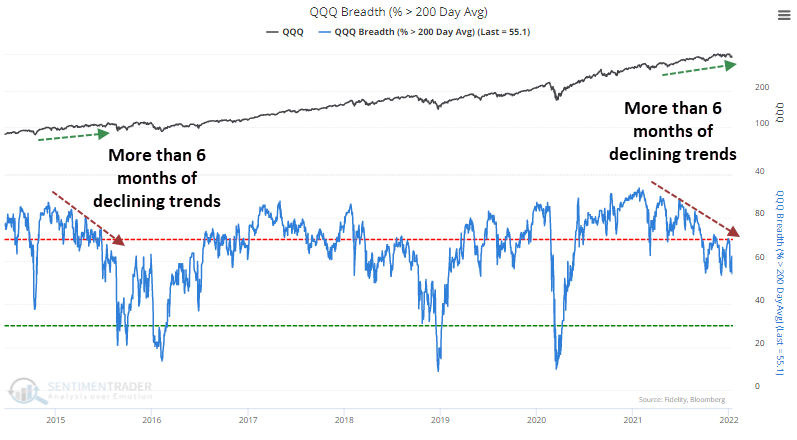
That also happened to be the last time we saw so few technology stocks trading above their 200-day moving averages, even as the Nasdaq 100 index hit one new high after another. Divergences are inconsistent predictors and extremely poor for timing, but they can effectively highlight improving/declining environments.
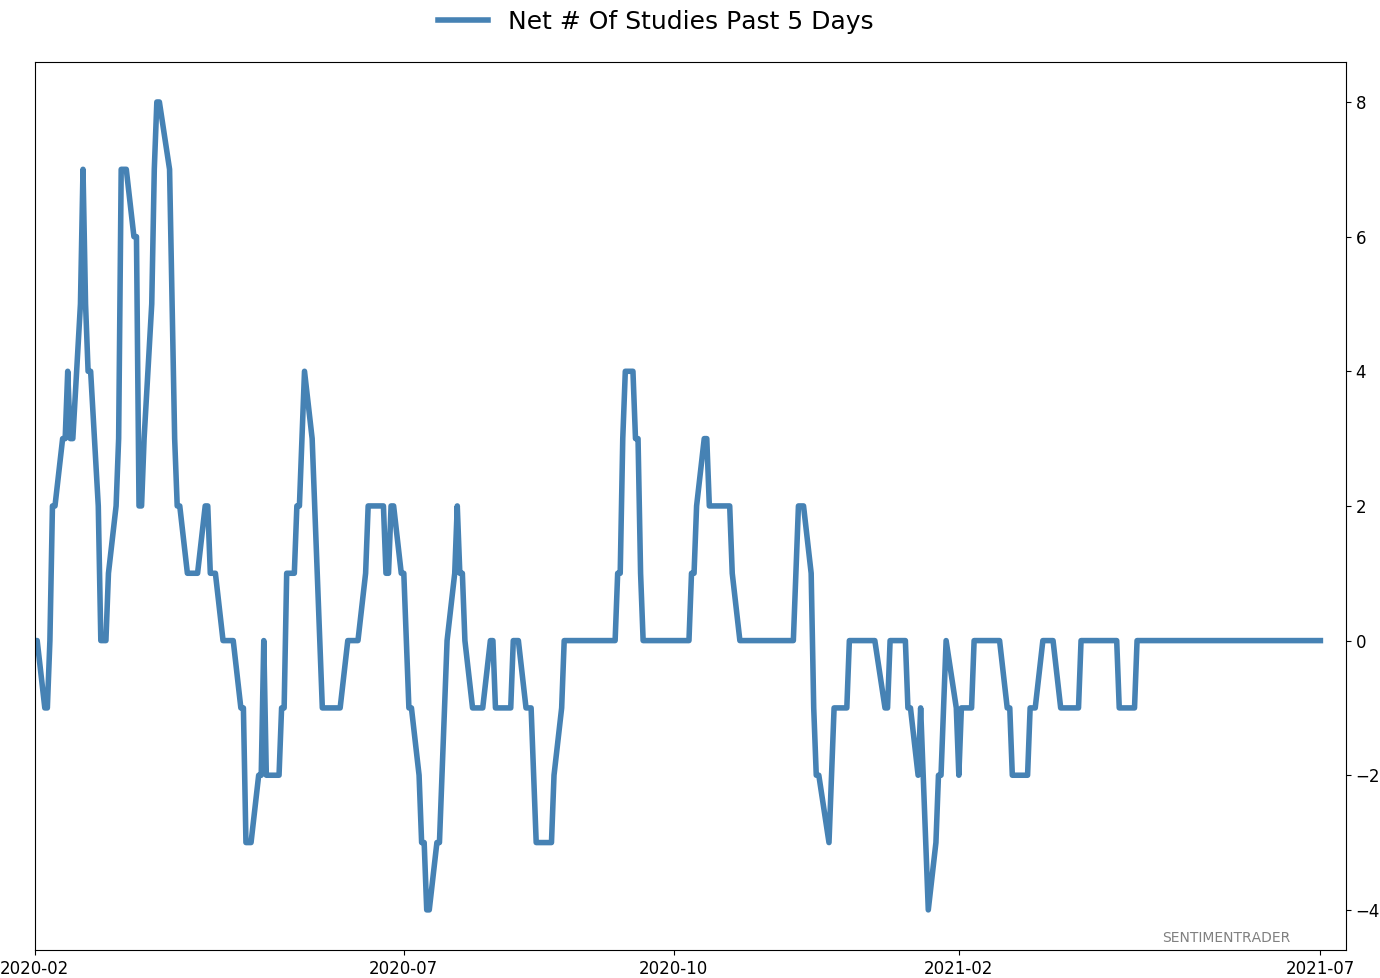
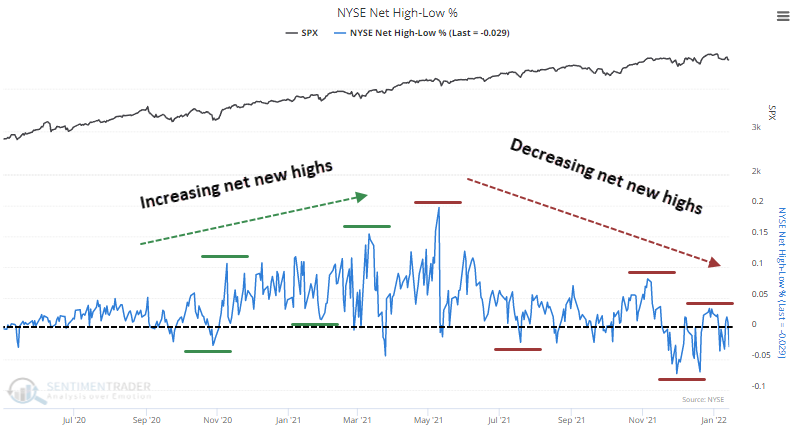
The lack of enthusiasm is evident in the percentage of securities on the NYSE reaching 52-week highs versus those sinking to 52-week lows. In the aftermath of the pandemic panic bottom, there was a steady rise in the net number of securities reaching new highs. That peaked last spring, and subsequent rallies in the S&P 500 have seen fewer new highs. It's now negative again.
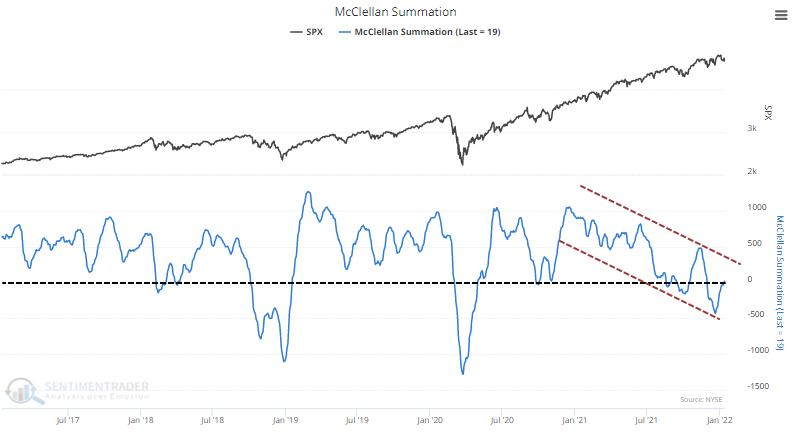
The long-term McClellan Summation Index briefly turned positive but it was weak. It's already back below zero and declining. It's been in a negative channel for a year, with lower highs and lower lows.
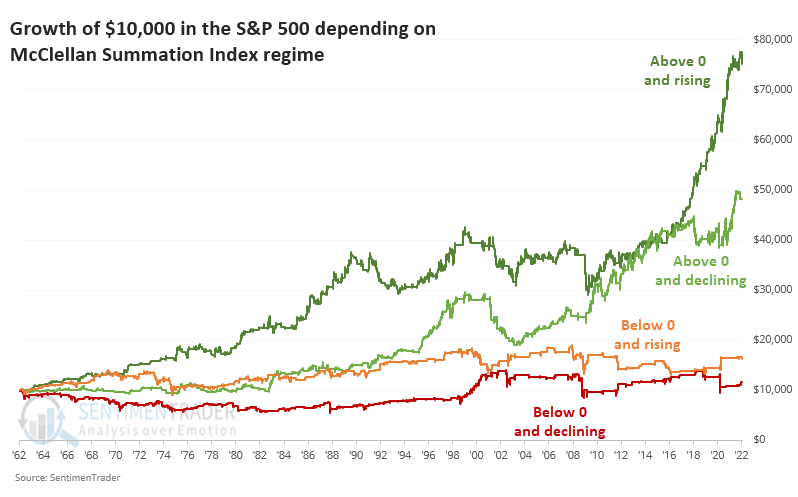
The fact that the Summation Index is below zero and declining is a worry. This is the worst possible regime for the indicator. The chart below shows the growth of $10,000 invested in the S&P 500 (using next-day returns) depending on the behavior of the Summation Index. Returns are far and away better when it's above zero, preferably also rising.
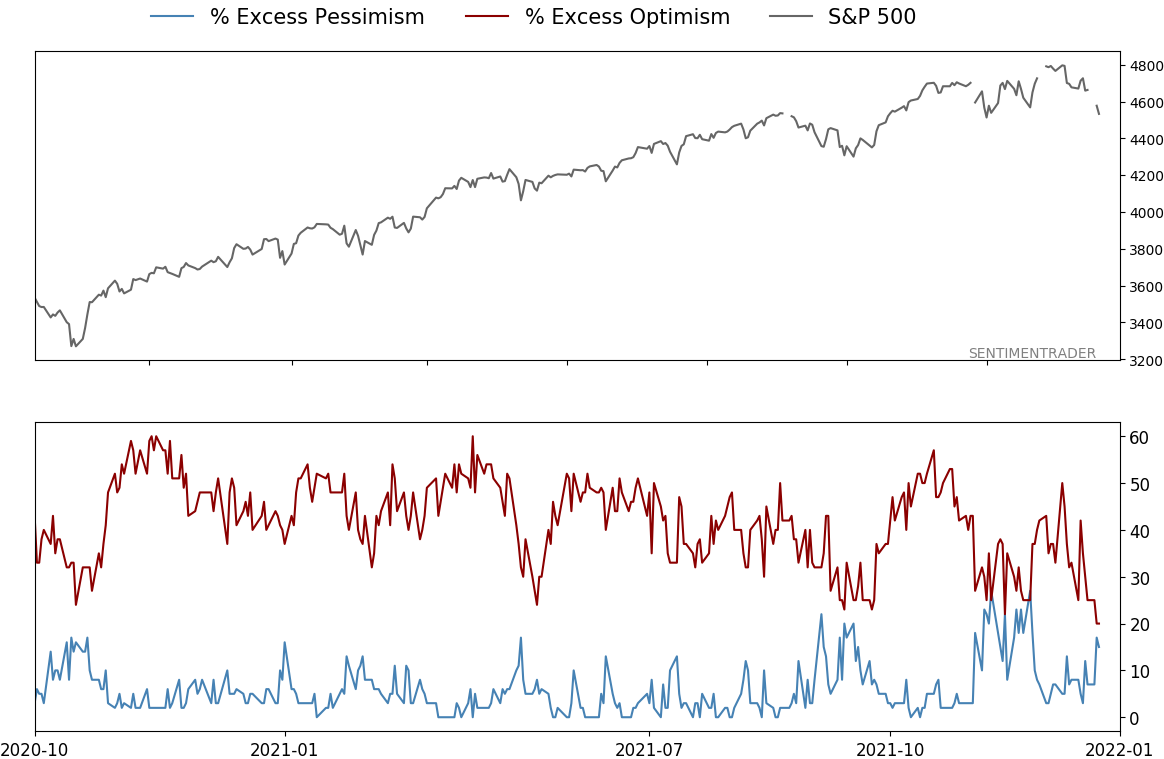
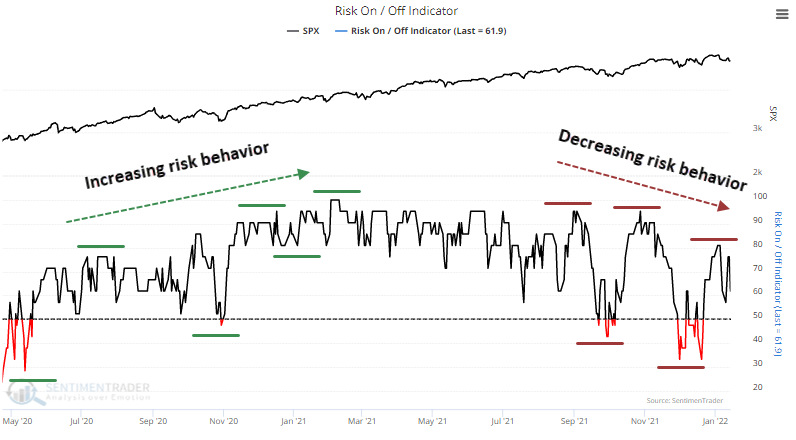
All of this can be seen in the increasingly hesitant amount of risk behavior. Since September, the Risk-On / Risk-Off Indicator has had a series of lower highs and lower lows.
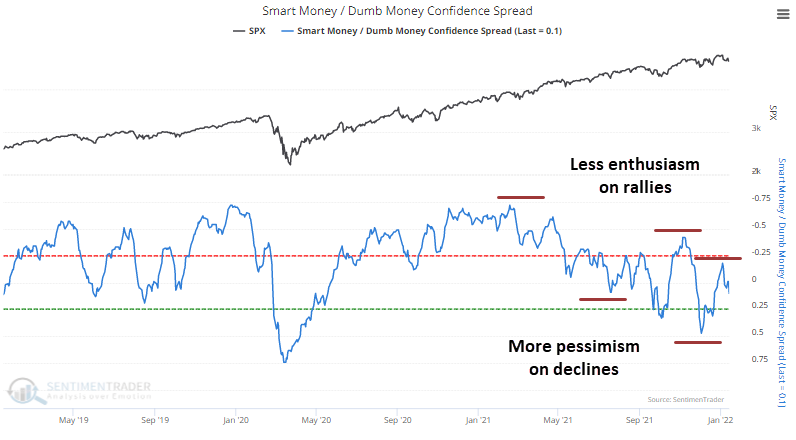
Not surprisingly, this sentiment is also reflected in the spread between Smart Money and Dumb Money Confidence. Rallies are met with less enthusiasm, while selloffs are greeted with high anxiety. Maybe the pessimism in December was enough for a medium-term low, but this kind of behavior is not healthy on a long-term basis.
What the research tells us...
Most of the above charts have a subjective interpretation, which we usually shy from in lieu of historical testing when possible. But it sometimes pays to step back and look at what's happening and how it "looks." And right now, it's not looking great. The lack of follow-through after recent breadth thrusts is troubling, as is the general risk-off attitude. It hasn't cycled down to a pessimistic extreme and is looking more and more like a trading range type of market at best. That means waiting for deeper pessimistic extremes than we've seen since the summer of 2020.
Active Studies
| Time Frame | Bullish | Bearish | | Short-Term | 2 | 0 | | Medium-Term | 13 | 2 | | Long-Term | 13 | 5 |
|
Indicators at Extremes
Portfolio
| Position | Description | Weight % | Added / Reduced | Date | | Stocks | RSP | 19.9 | Reduced 16% | 2022-01-18 | | Bonds | 32.7% BND, 7.1% SCHP | 40.1 | Added 8.3% | 2021-10-26 | | Commodities | GCC | 2.4 | Reduced 2.1%
| 2020-09-04 | | Precious Metals | GDX | 4.6 | Reduced 4.2% | 2021-05-19 | | Special Situations | 8.1% KWEB, 3.6% XLE, 1.7% PSCE | 13.4 | Reduced 3.9% | 2022-01-18 | | Cash | | 19.4 | | |
|
Updates (Changes made today are underlined)
Not impressed at all with the market action since there was a breadth thrust at the end of December, with selling pressure hitting consistently since then. The drawdown is beyond what we've typically seen after similar thrusts. More and more indicators are showing risk-off sentiment, and the market environment is sketchy. I've reduced risk because of it. Bond sentiment is trying to recover from a recent bout of pessimism, and gold stocks are doing their thing which is not much at all. They've been flat for six months. Chinese tech stocks were doing exactly what they're supposed to do, then did *not* by plunging to new lows. This is troubling on a shorter-term time frame, but this was never meant for a trade, rather a multi-year investment. Recent behavior is troubling and I will not be adding any exposure as long as that's the case. RETURN YTD: -0.2% 2021: +8.7%, 2020: +8.1%, 2019: +12.6%, 2018: +0.6%, 2017: +3.8%, 2016: +17.1%, 2015: +9.2%, 2014: +14.5%, 2013: +2.2%, 2012: +10.8%, 2011: +16.5%, 2010: +15.3%, 2009: +23.9%, 2008: +16.2%, 2007: +7.8%
|
|
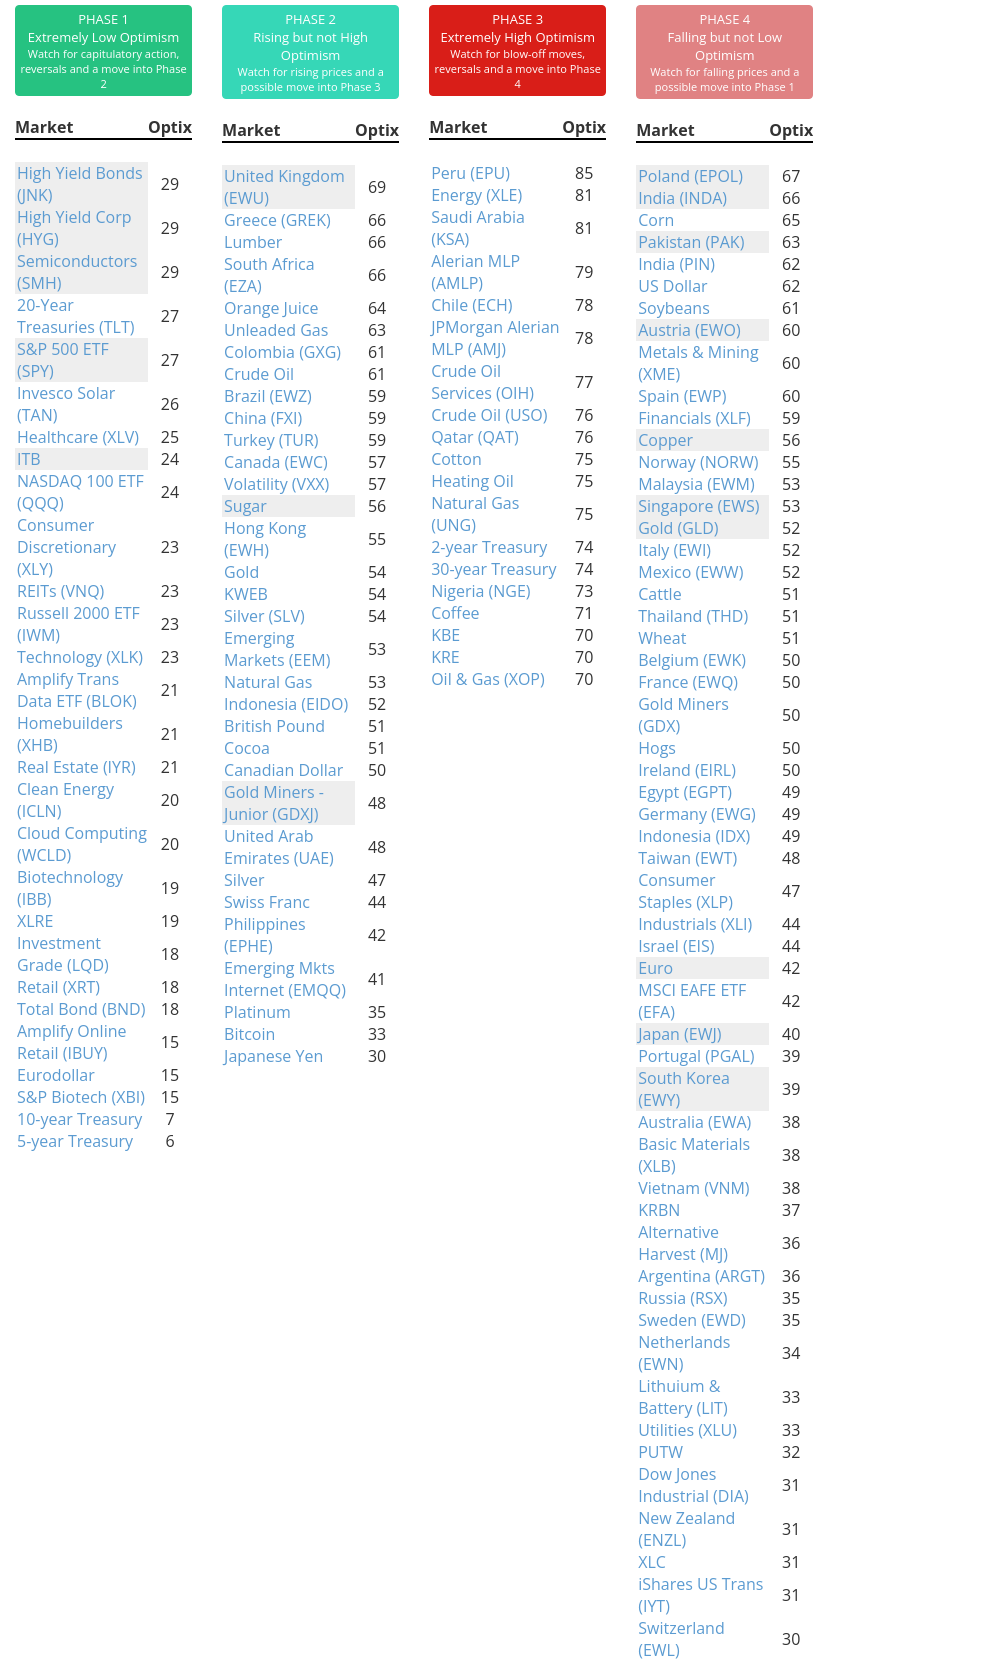
Phase Table
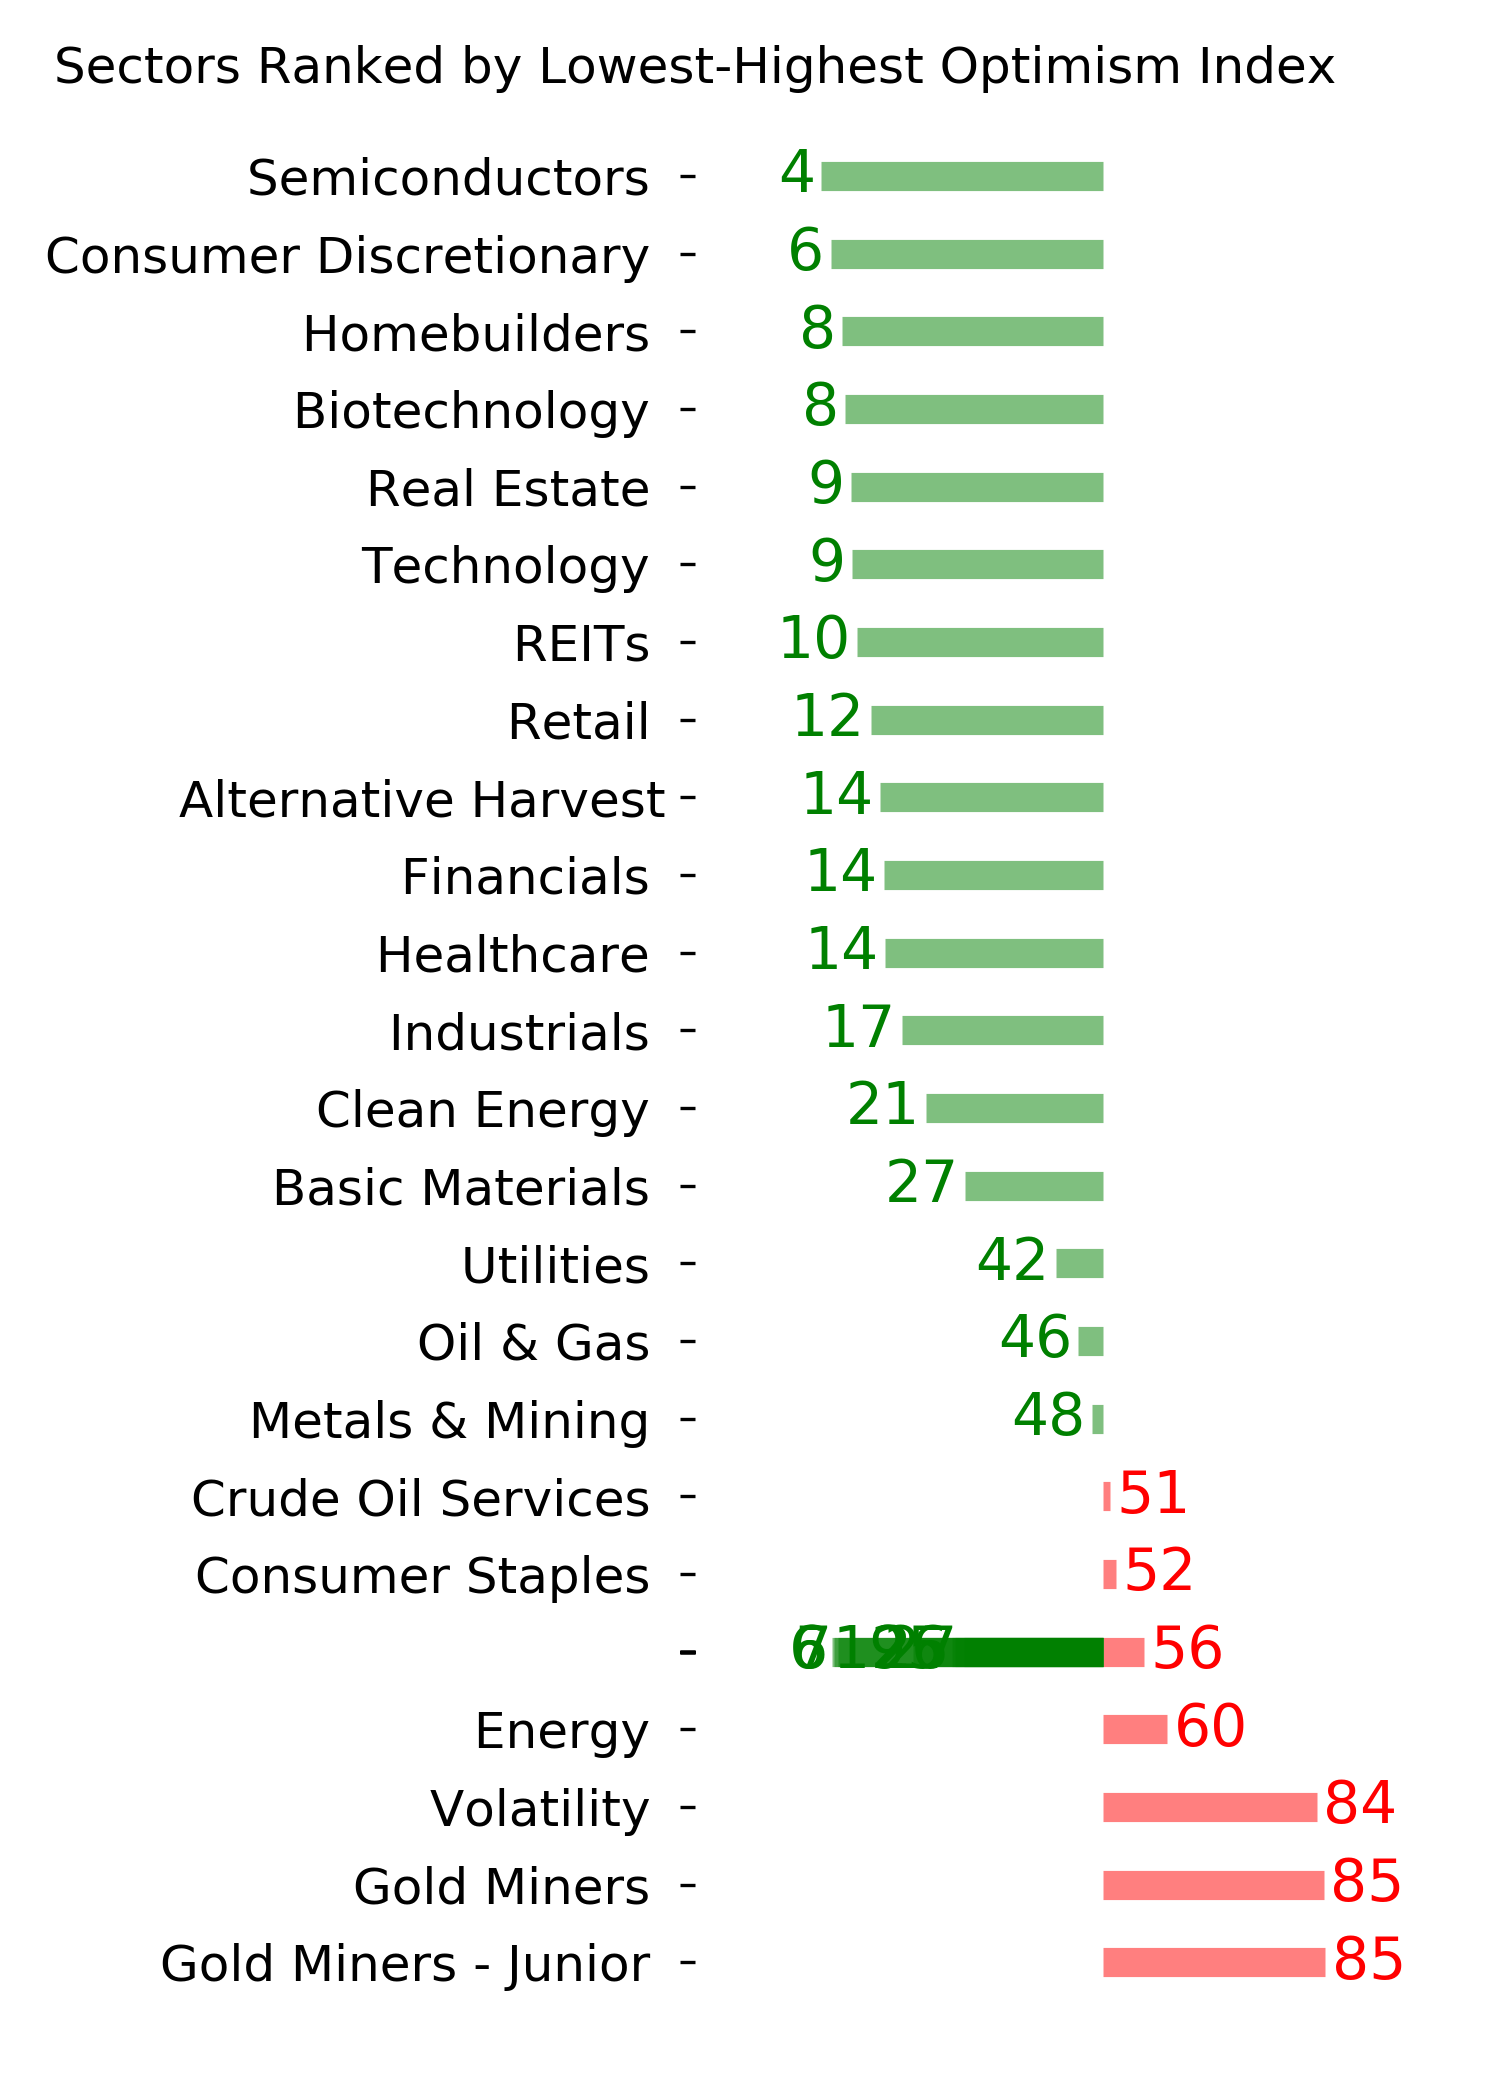
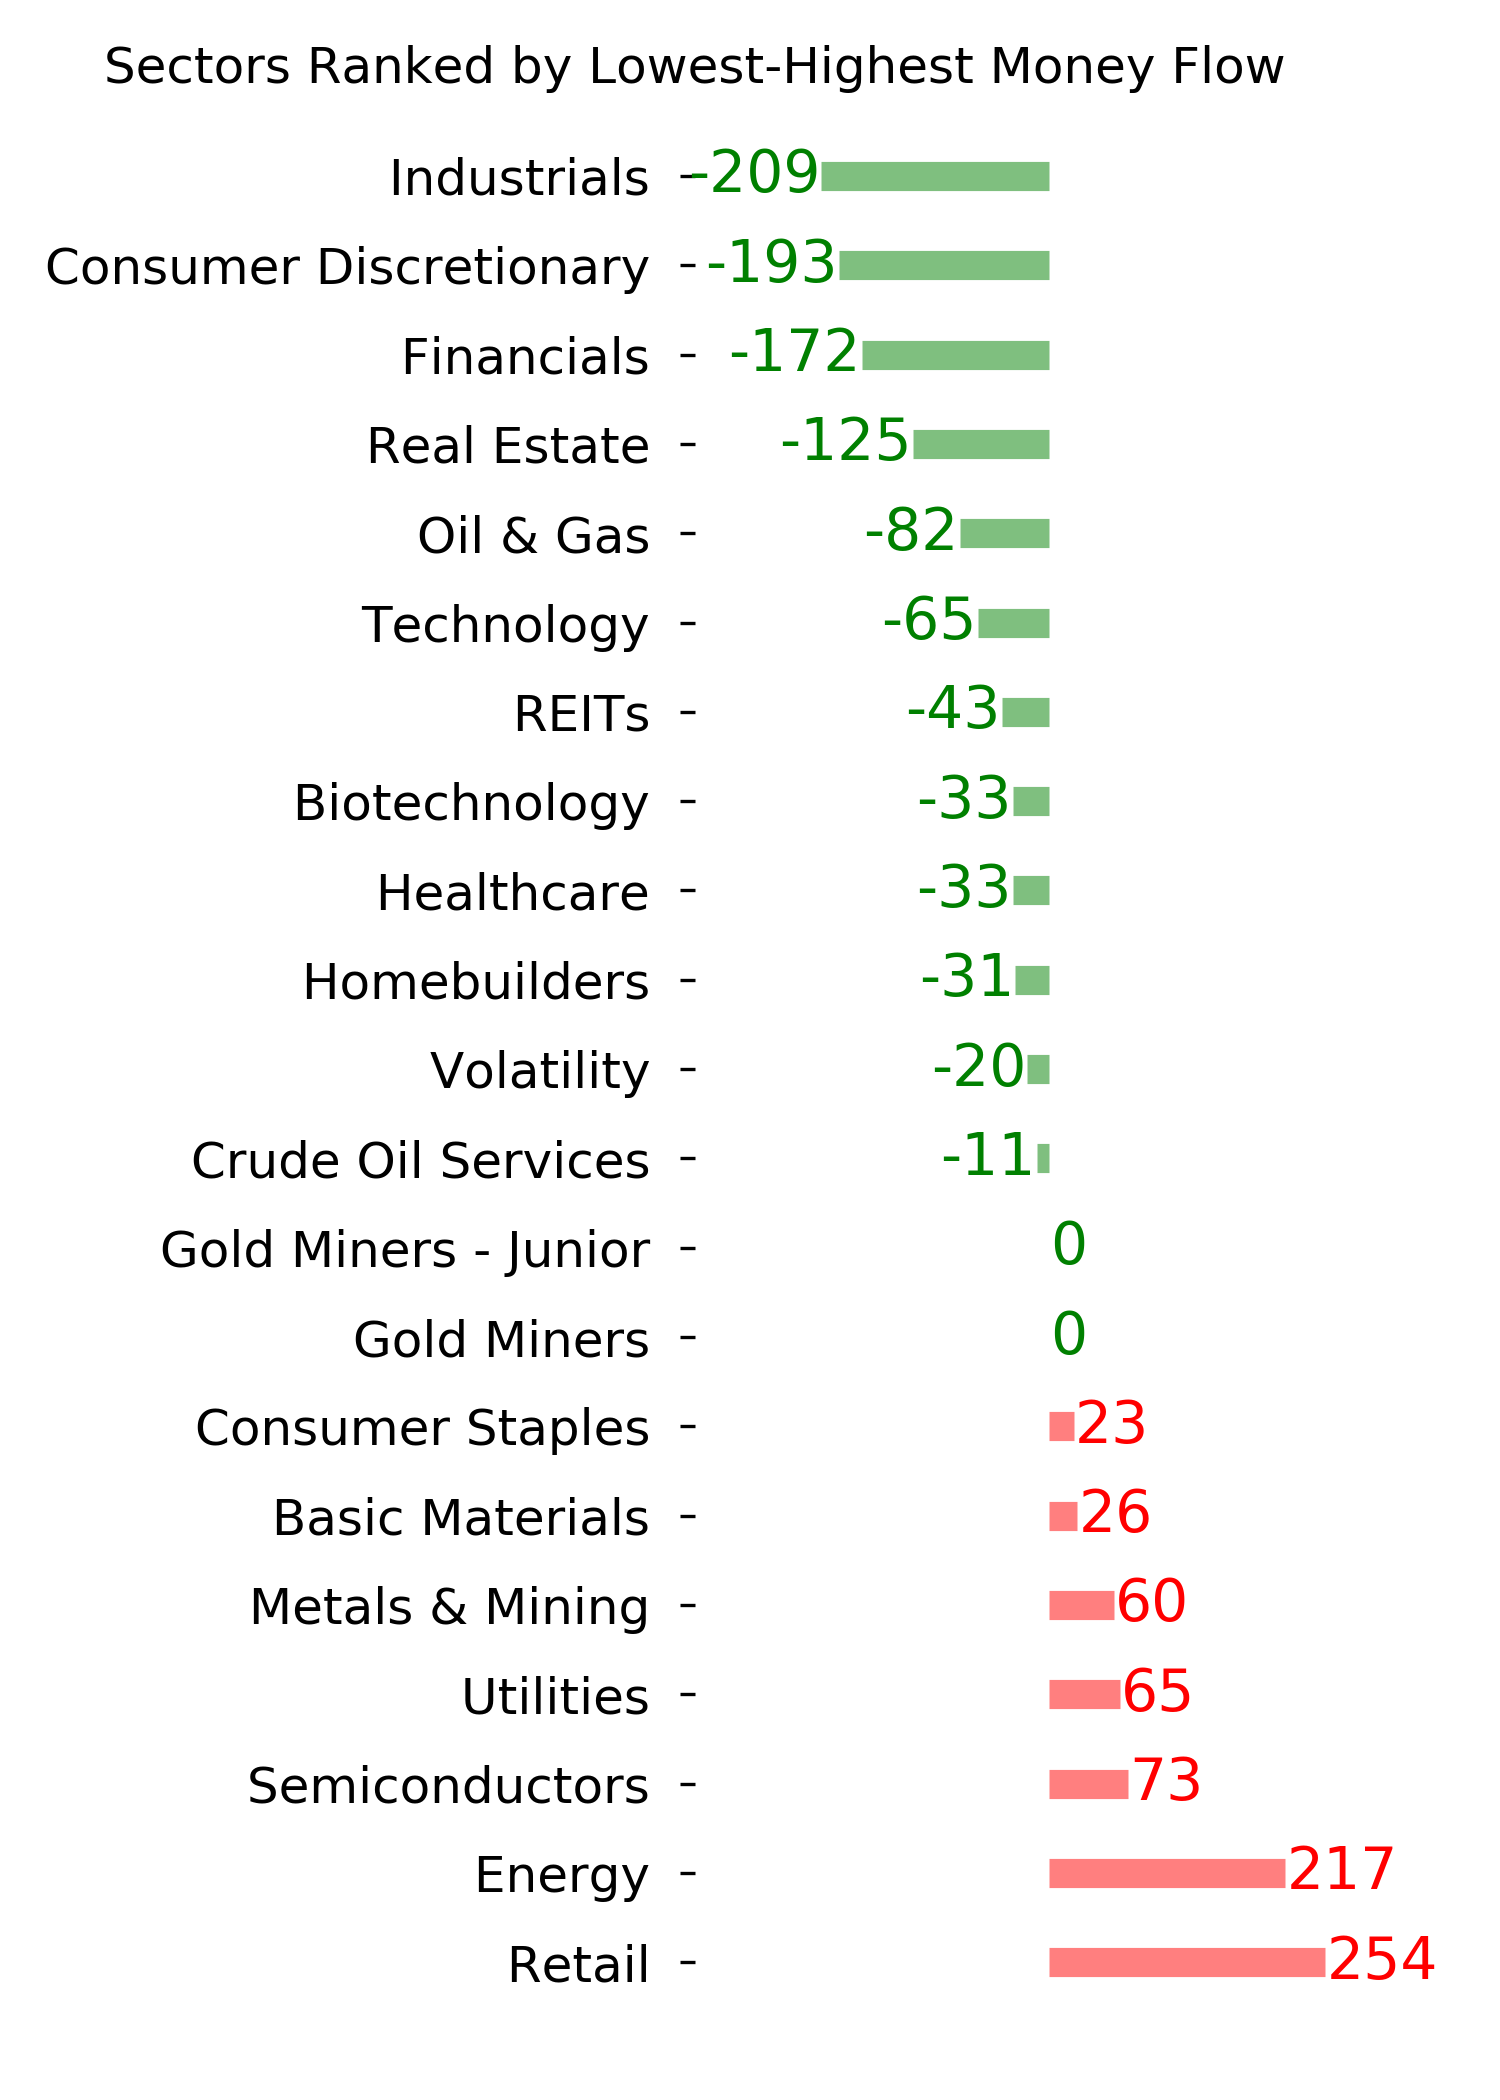
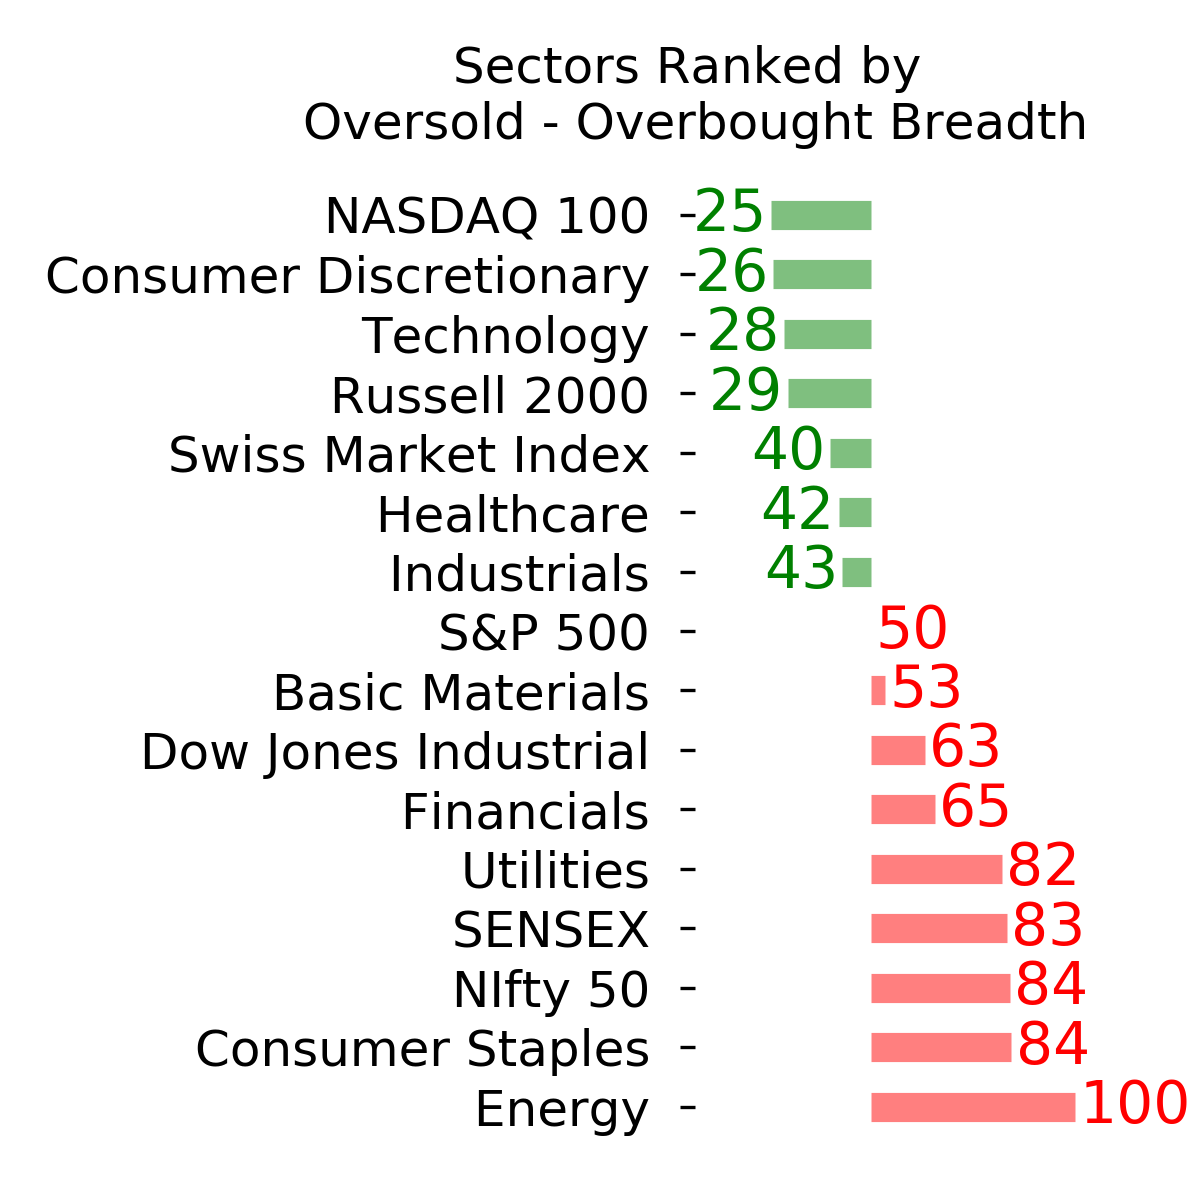
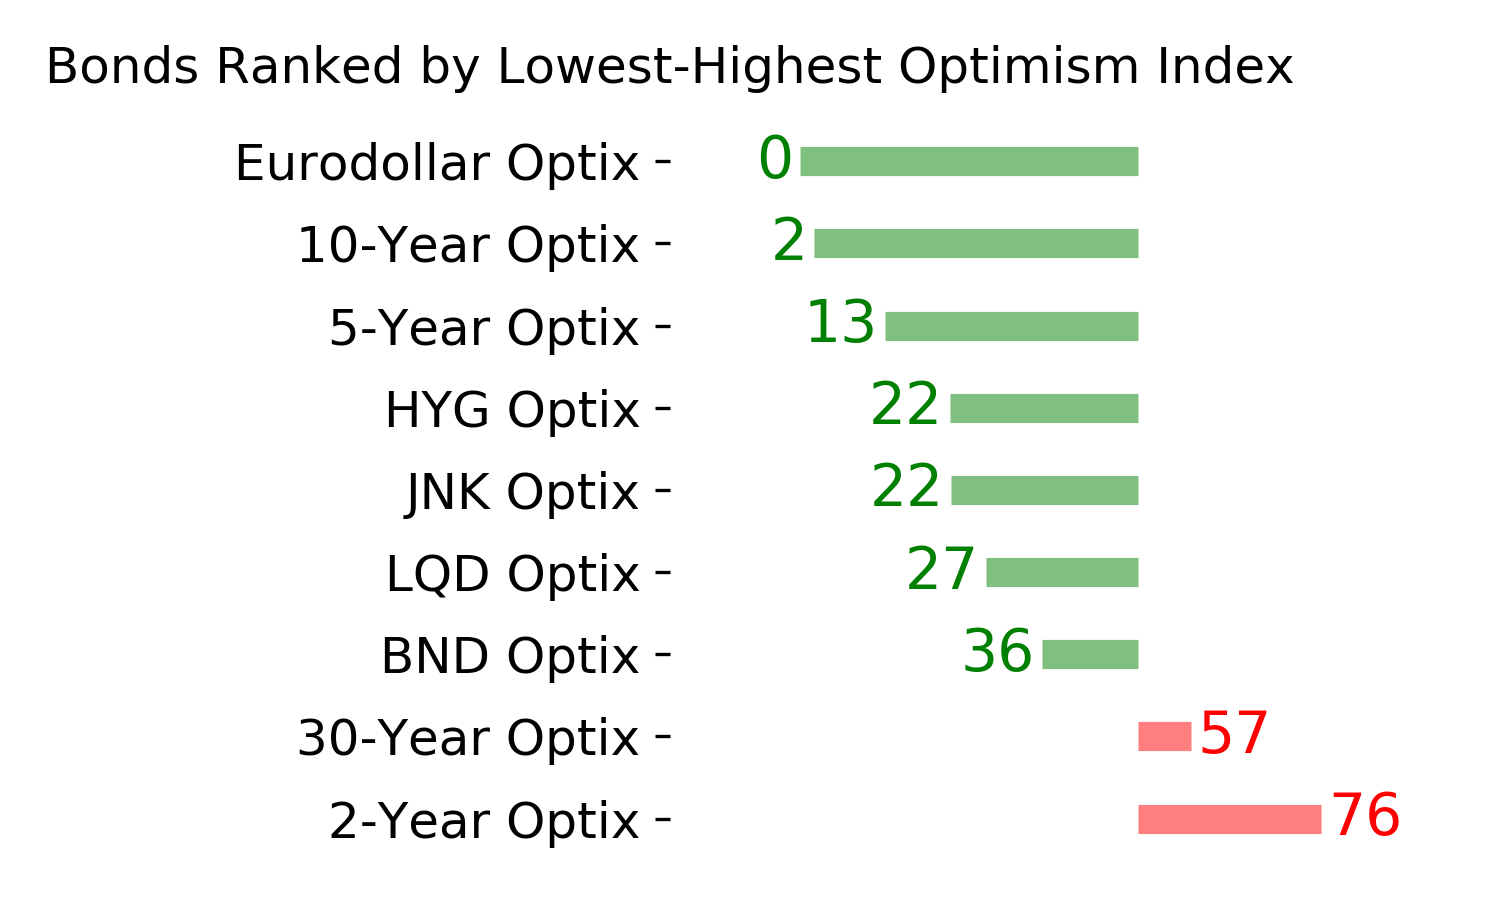
Ranks
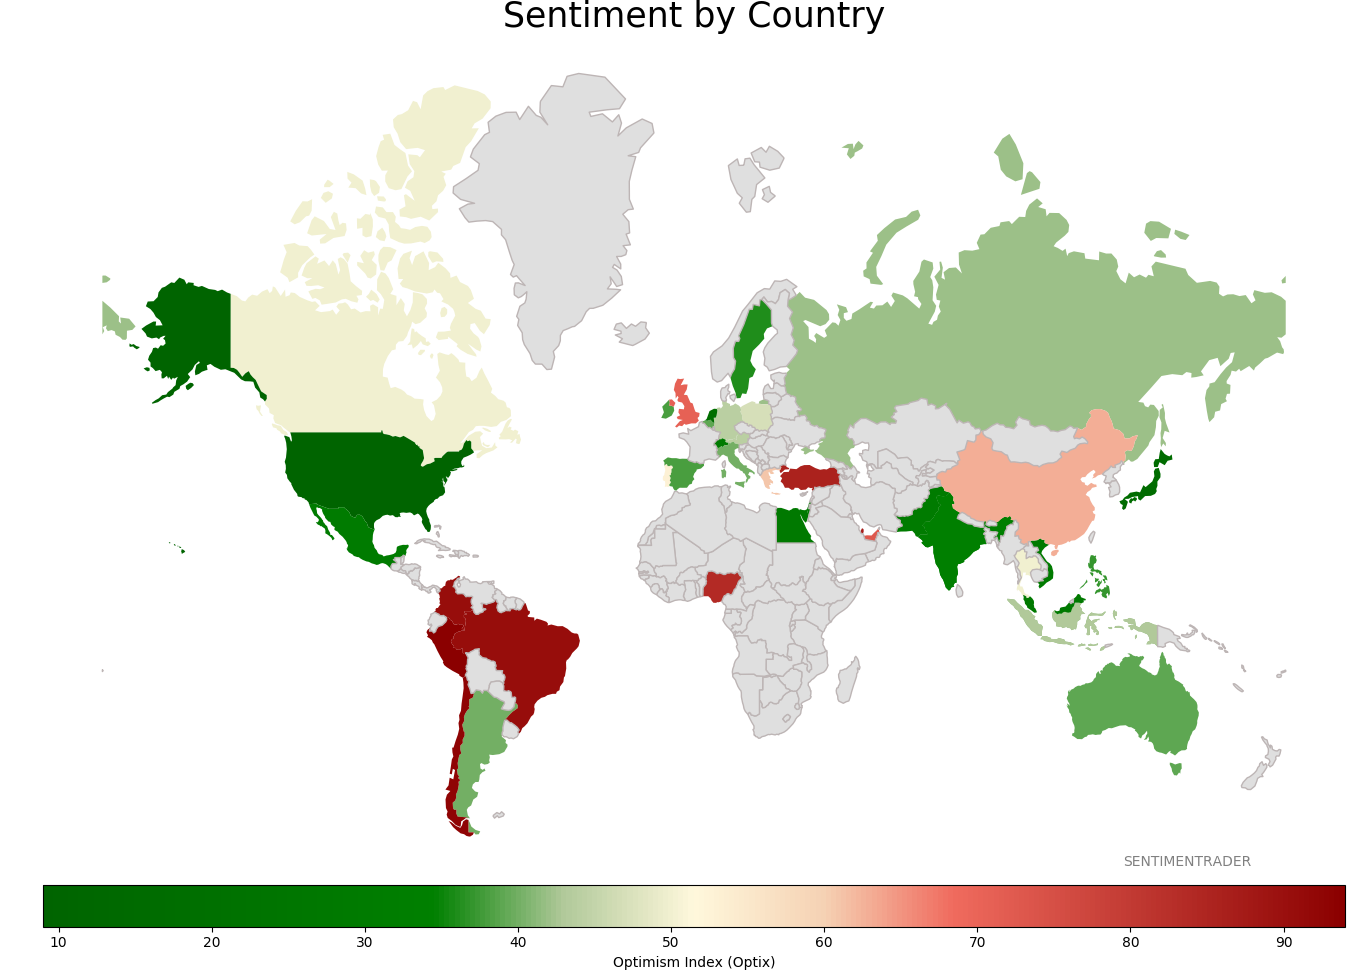
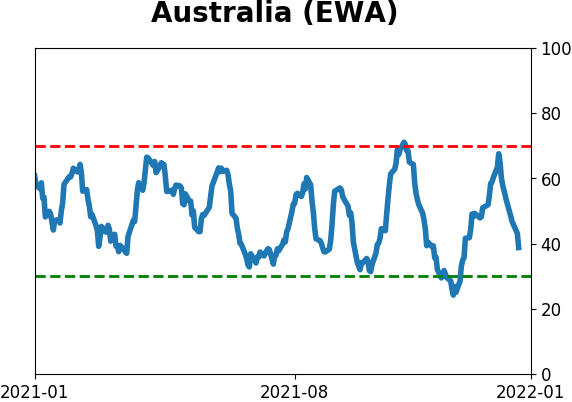
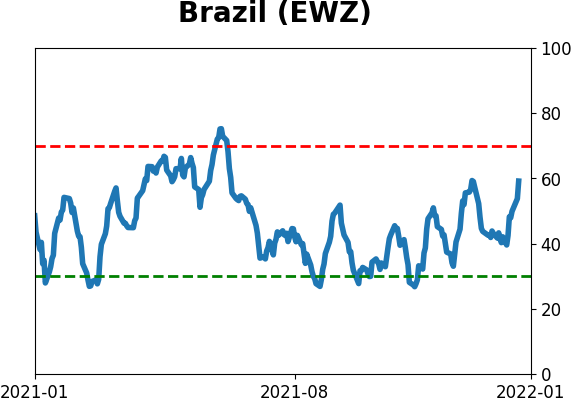
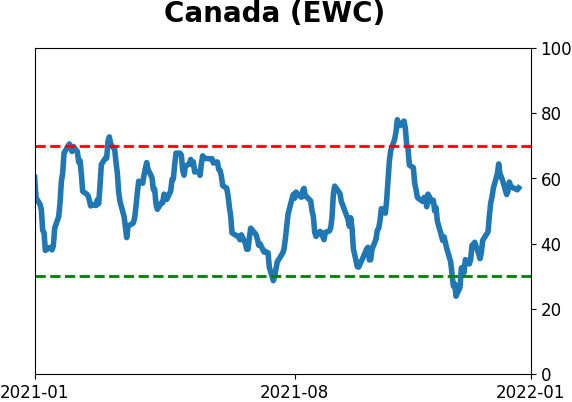
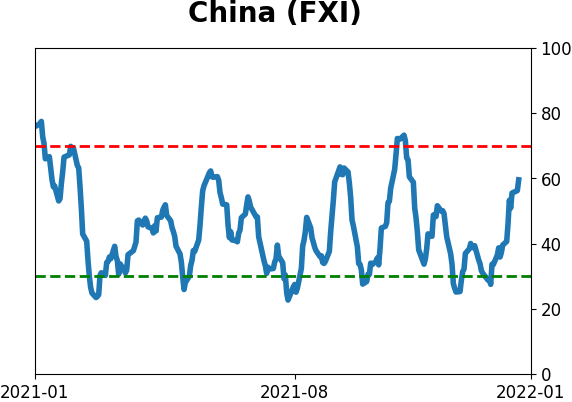
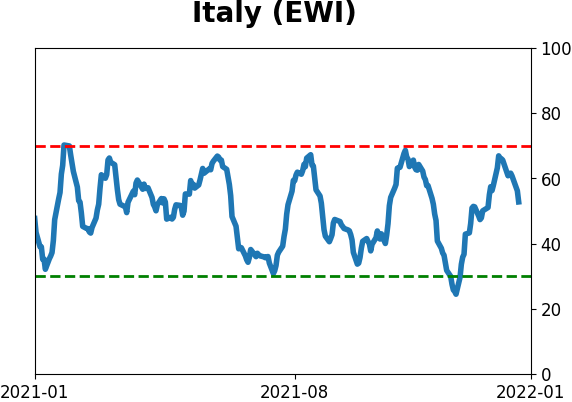
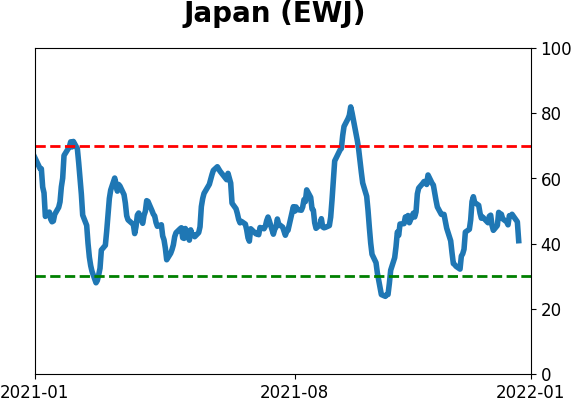
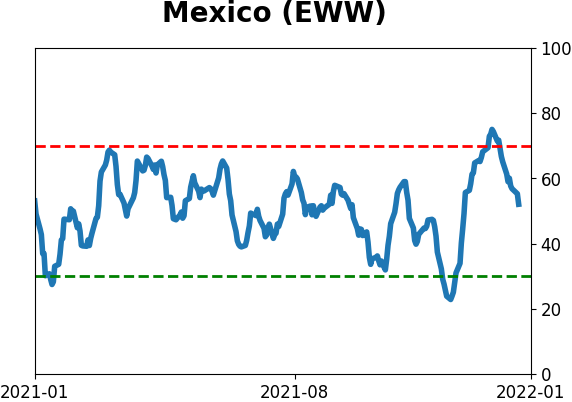
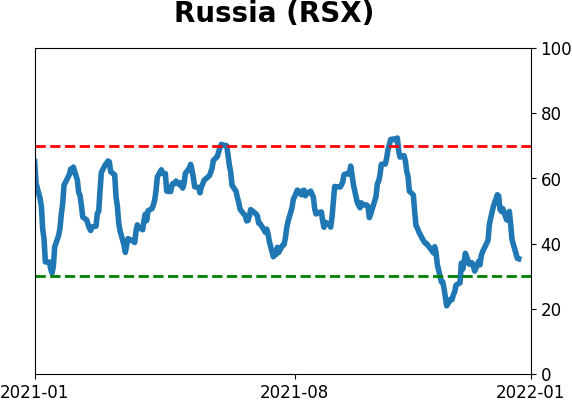
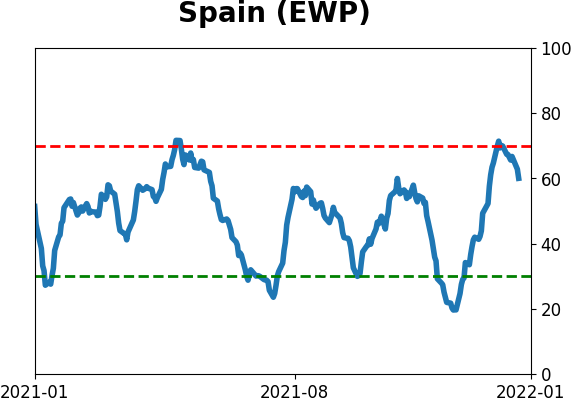
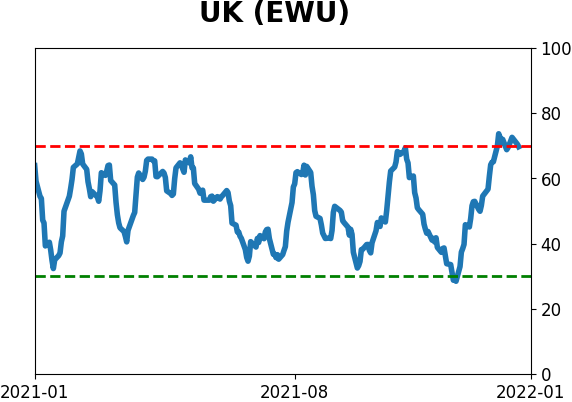
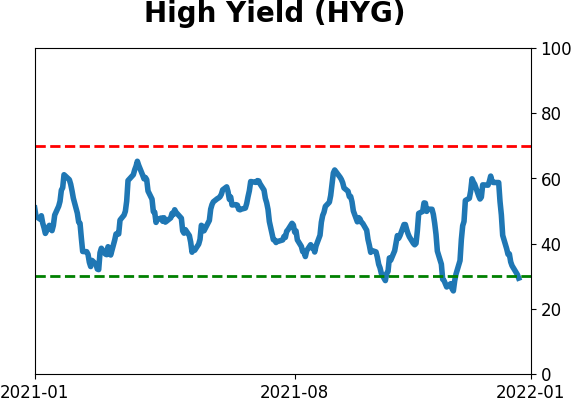
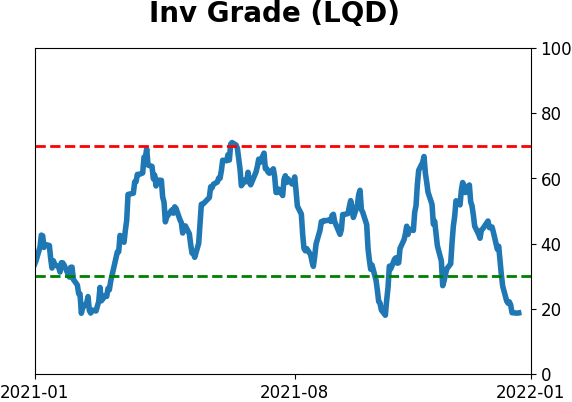
Sentiment Around The World
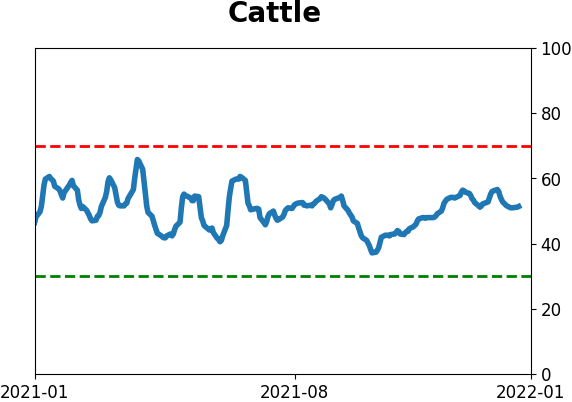
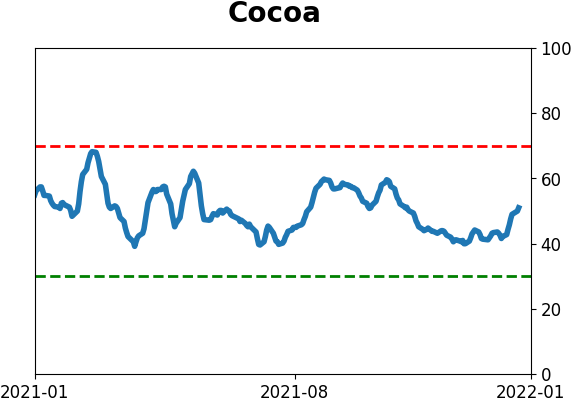
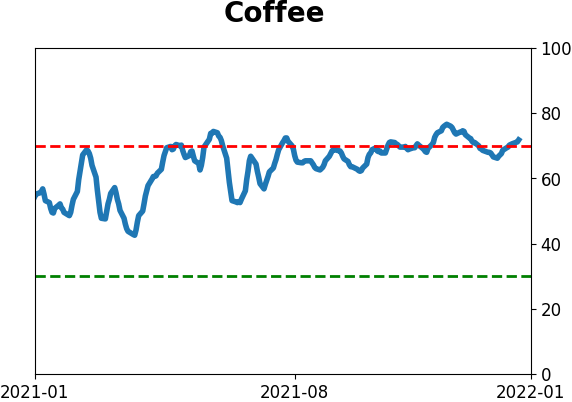
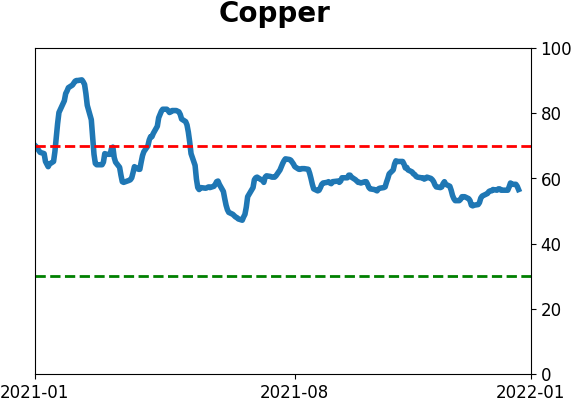
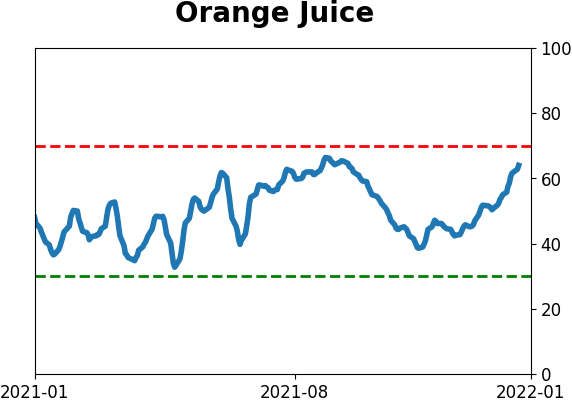
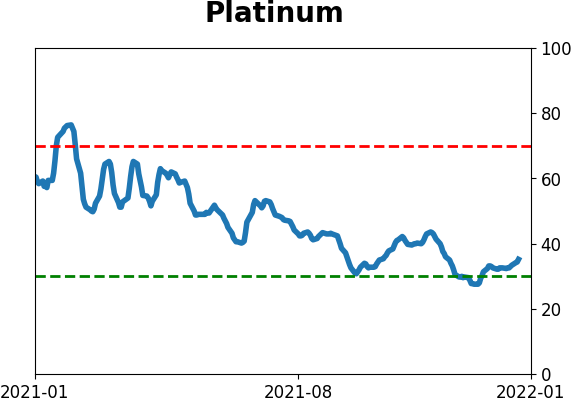
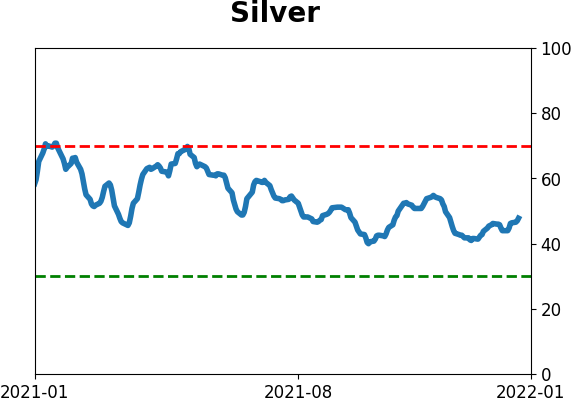
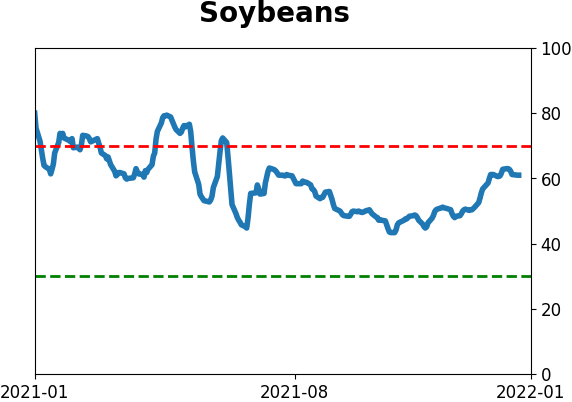
Optimism Index Thumbnails
|
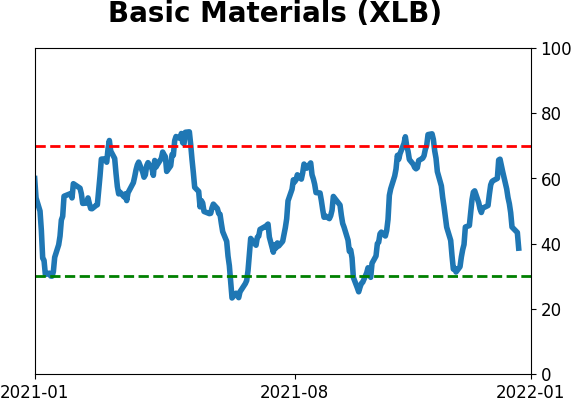
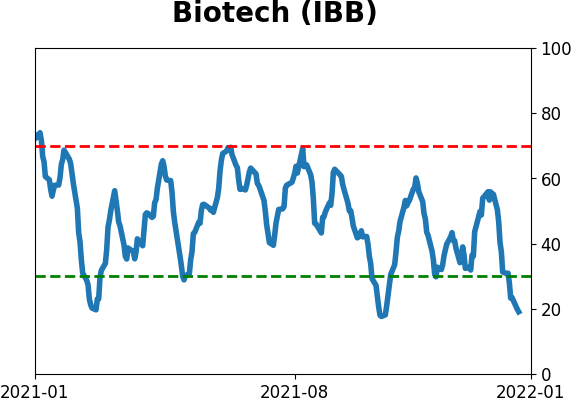
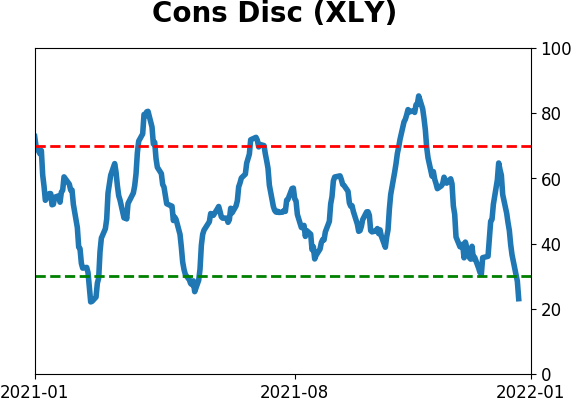
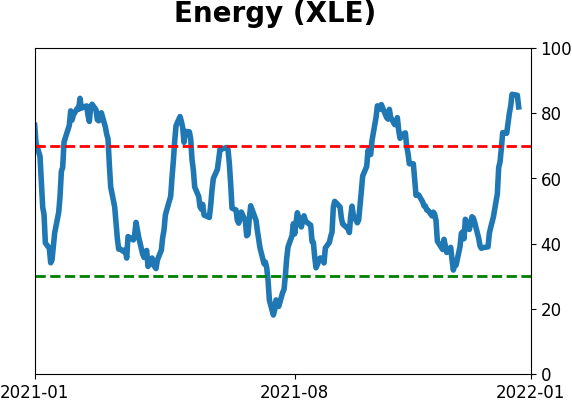
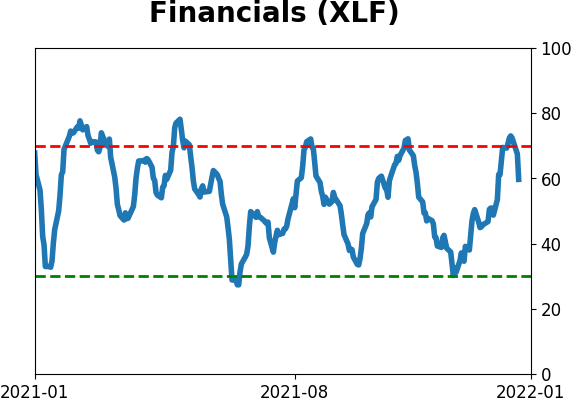
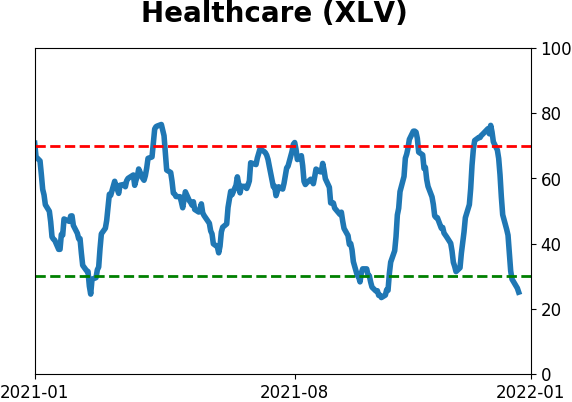
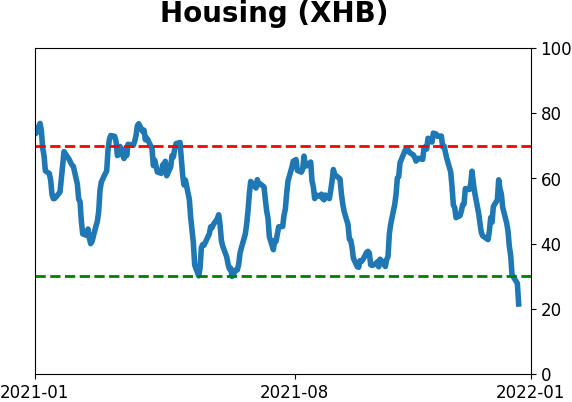
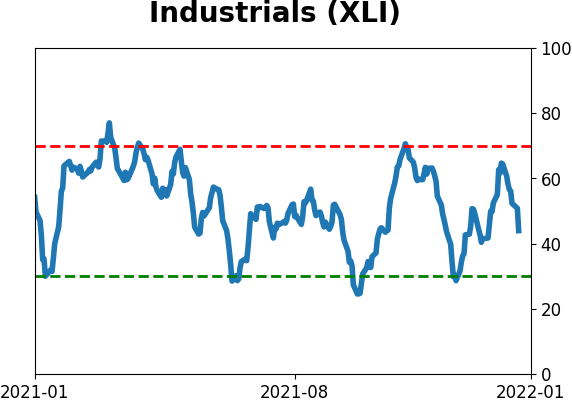
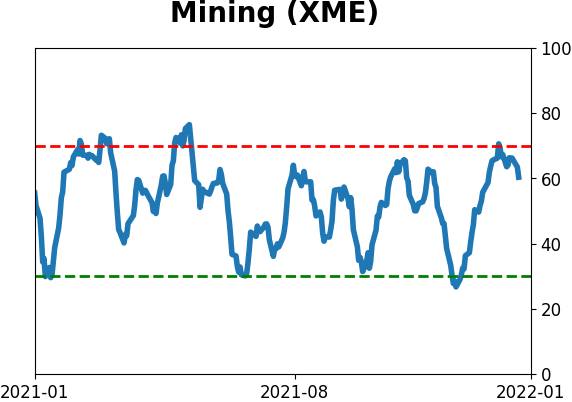
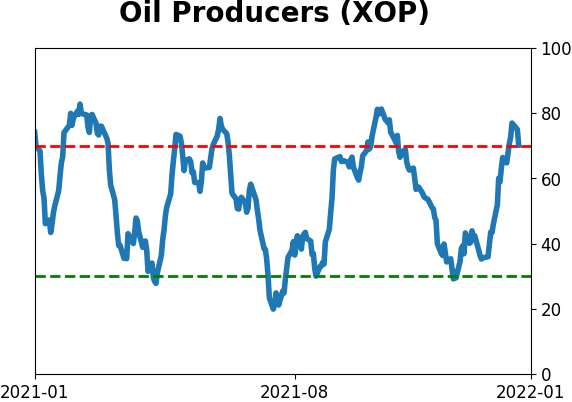
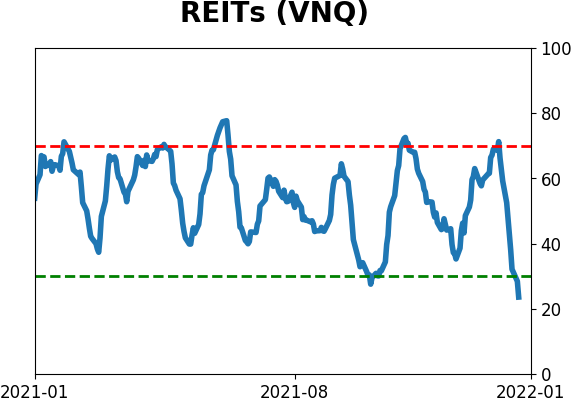
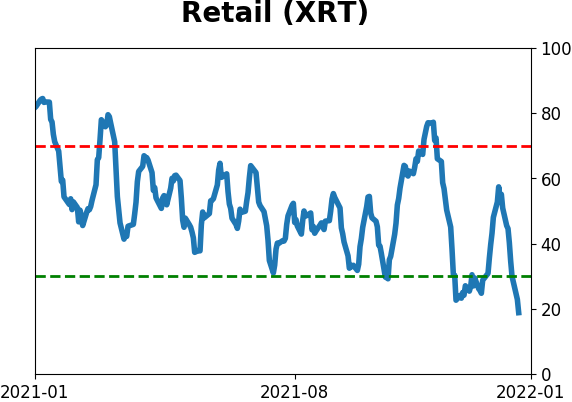
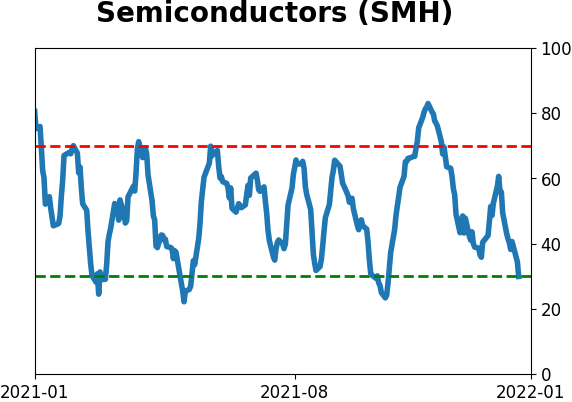
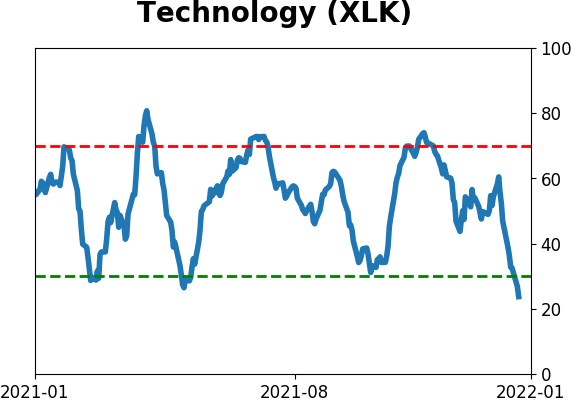
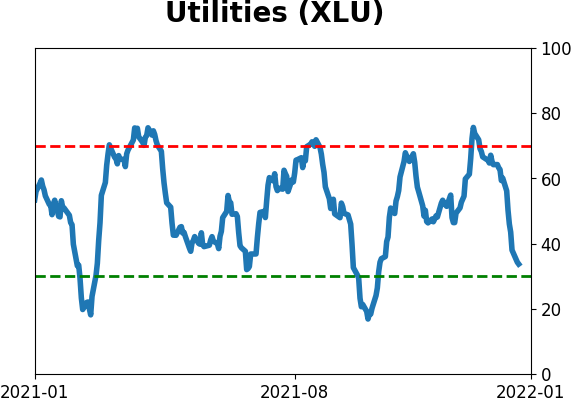
Sector ETF's - 10-Day Moving Average
|
|
|
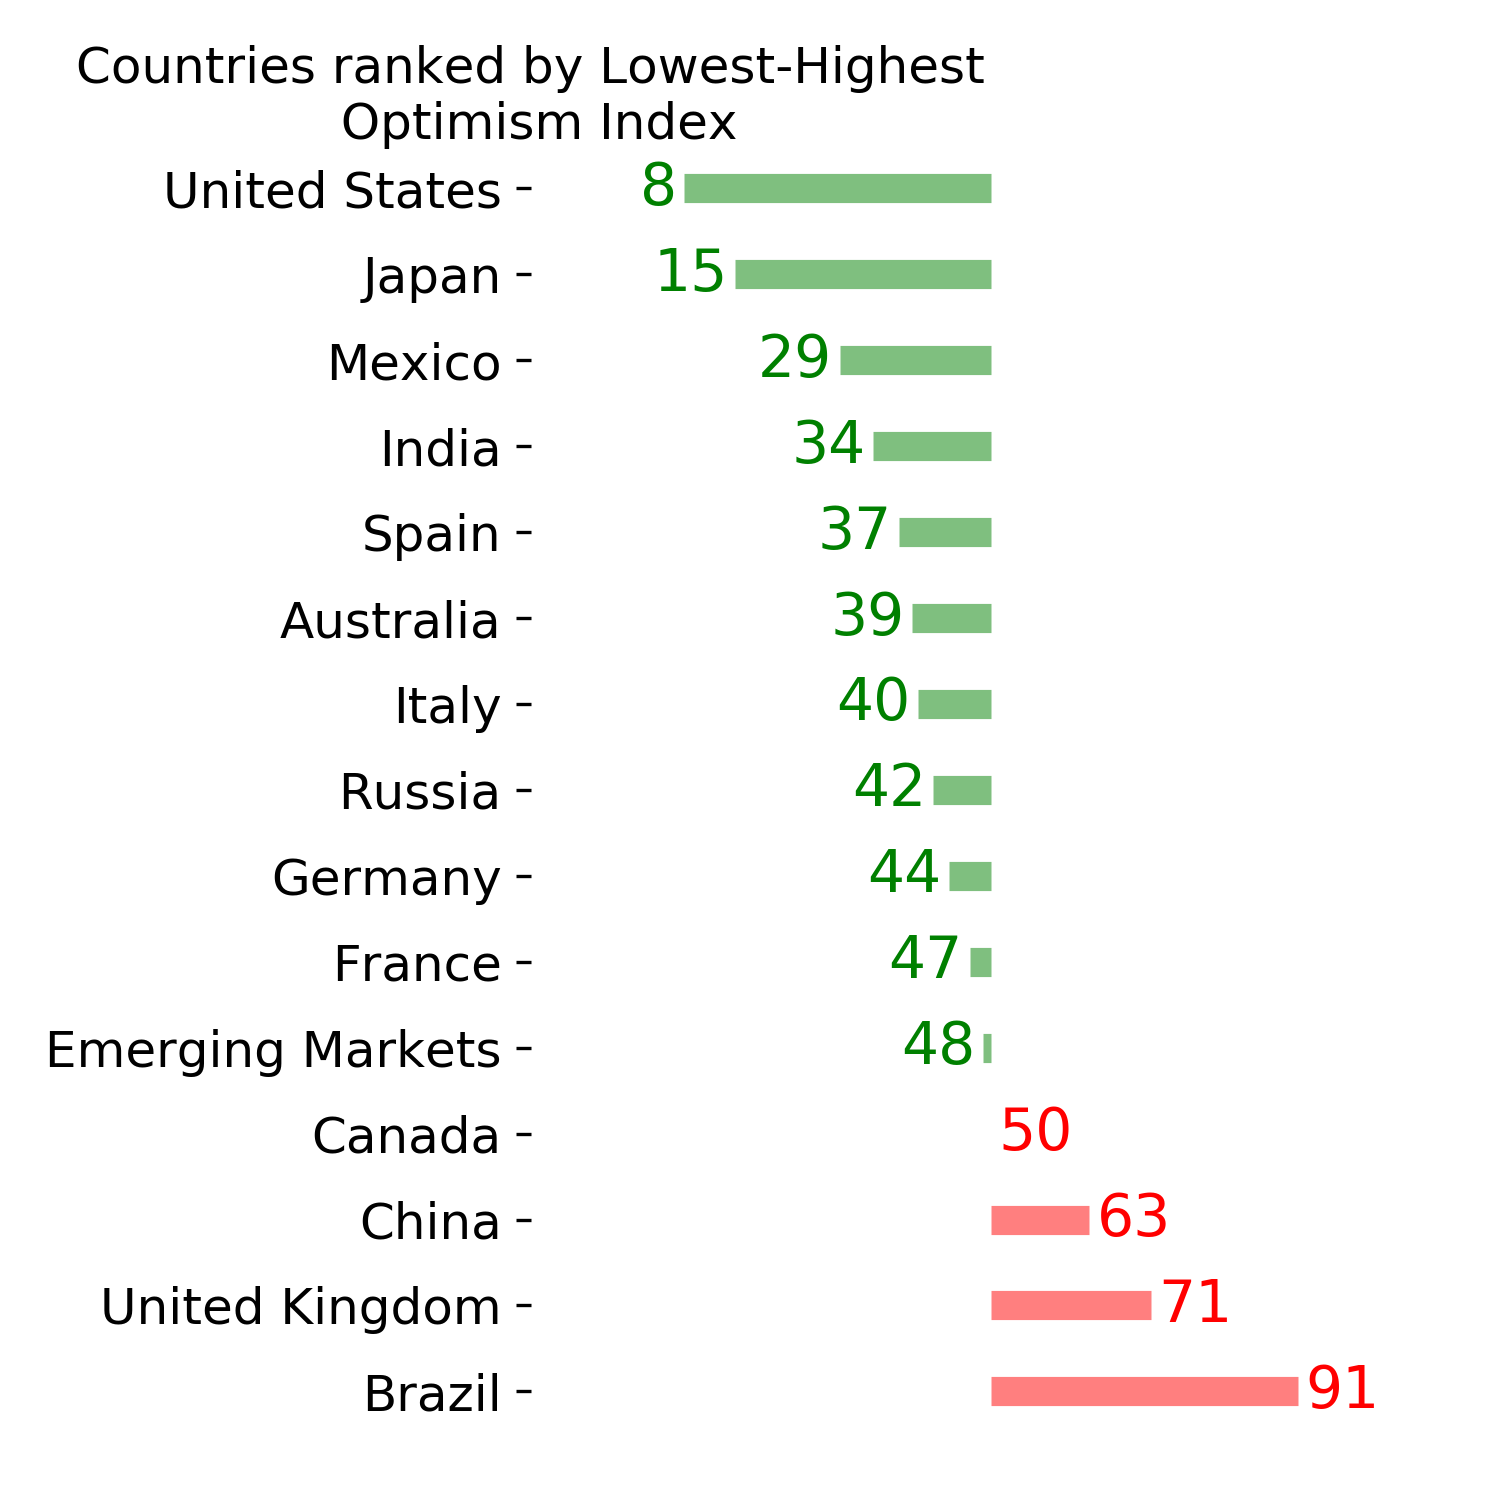
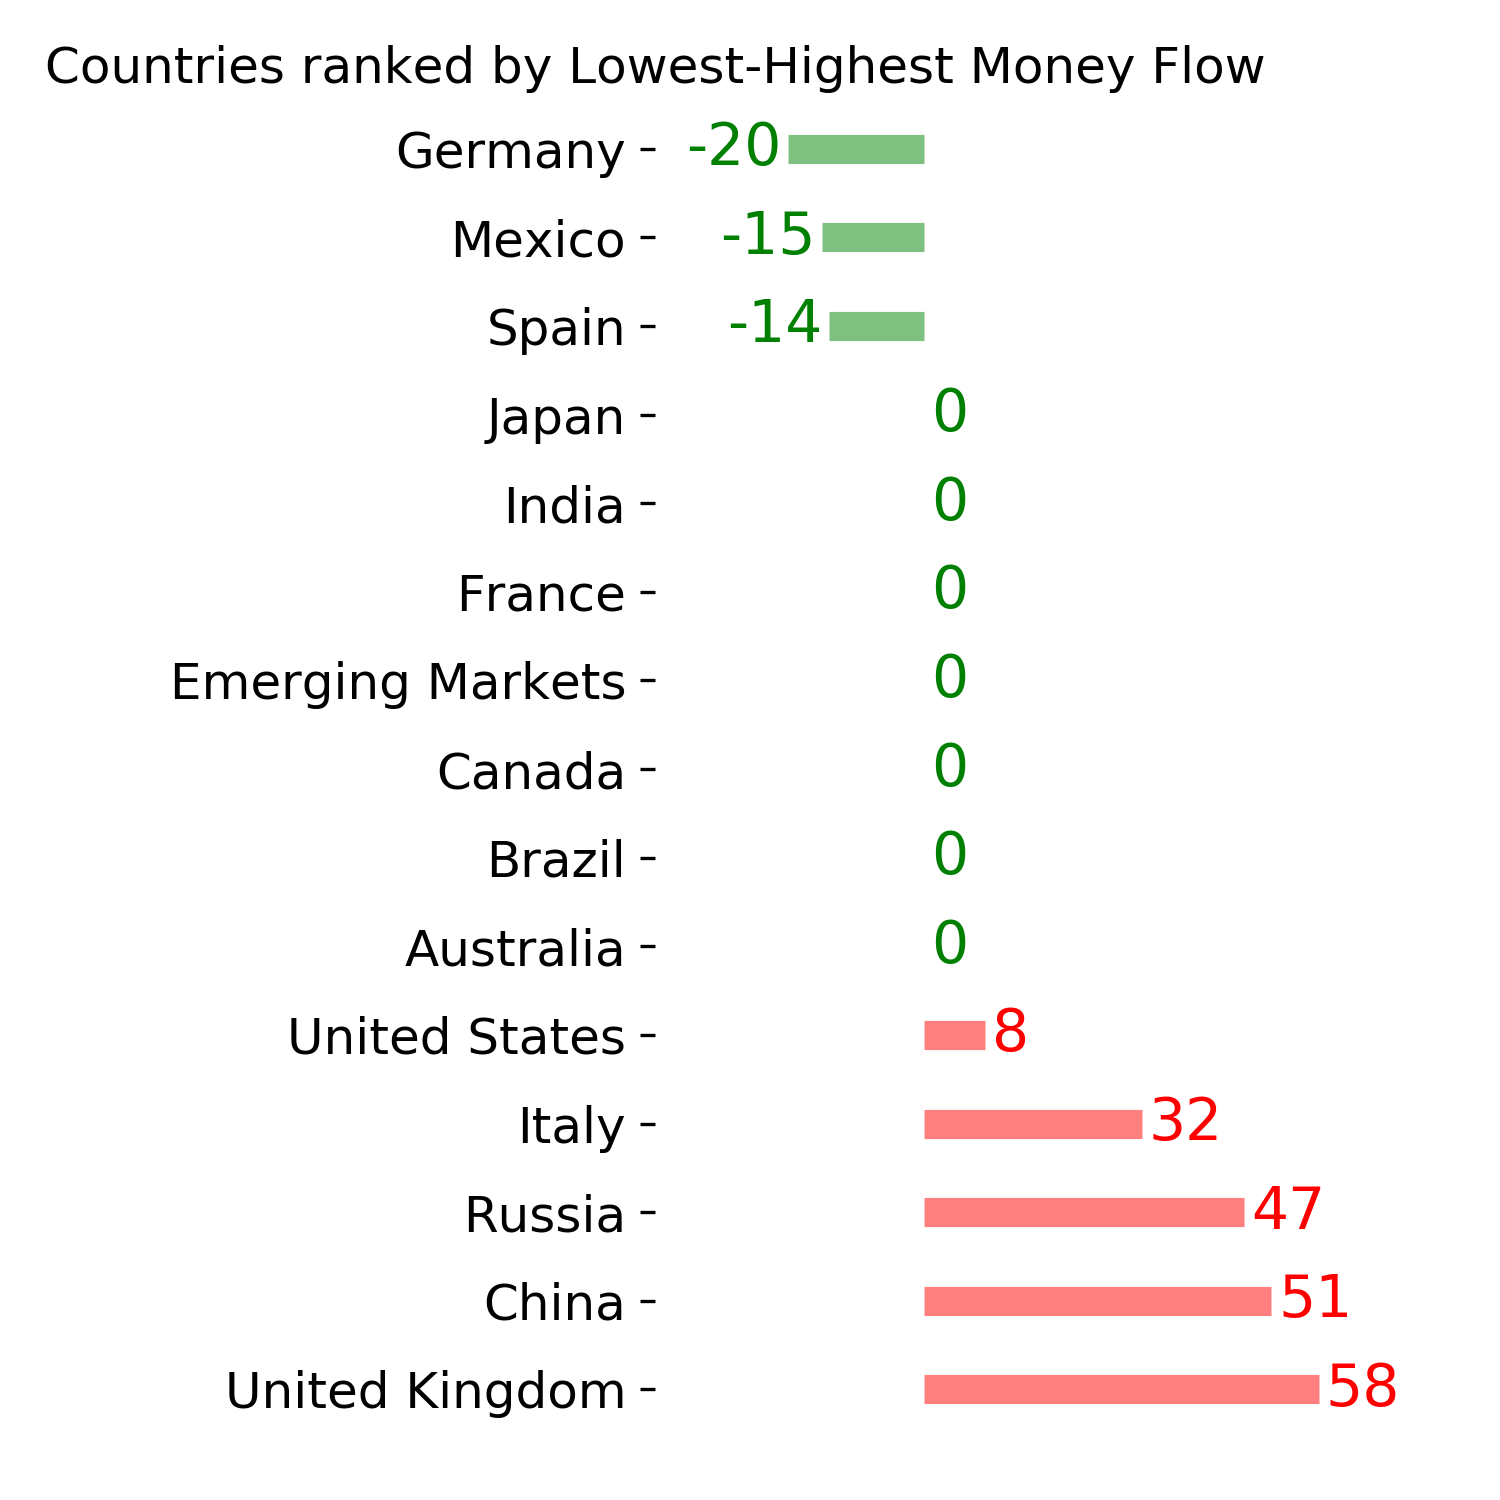
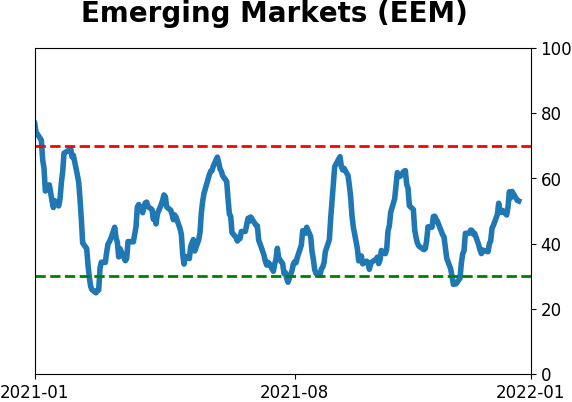
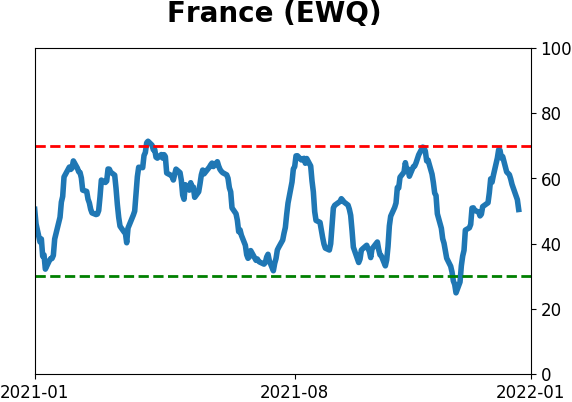
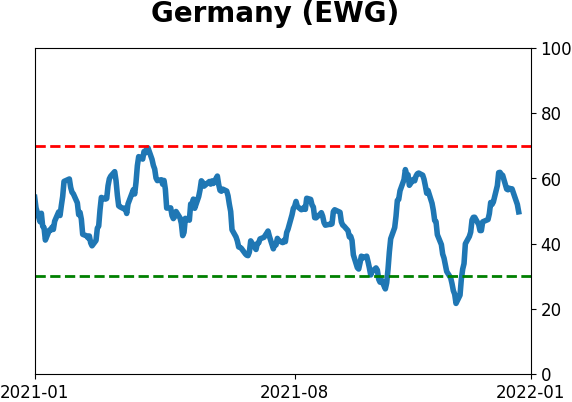
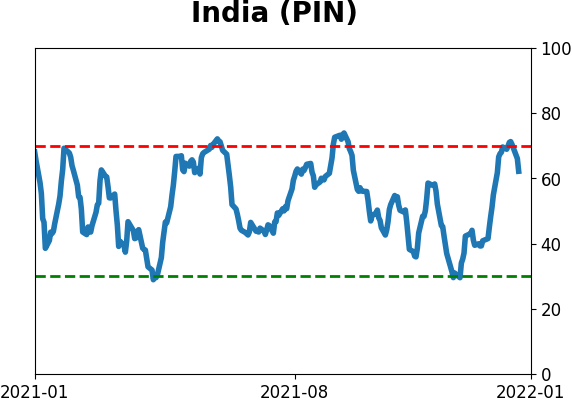
Country ETF's - 10-Day Moving Average
|
|
|
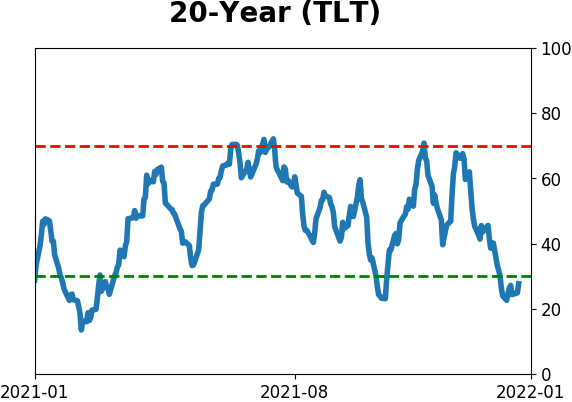
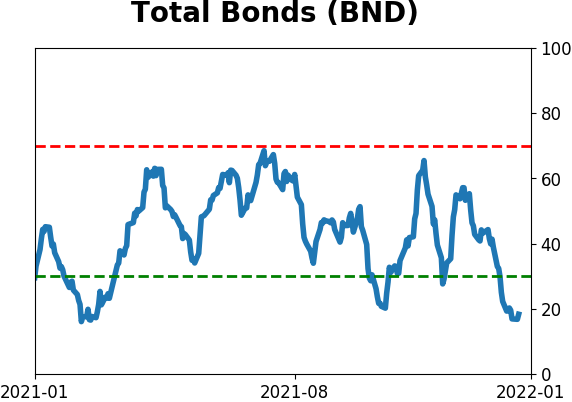
Bond ETF's - 10-Day Moving Average
|
|
|
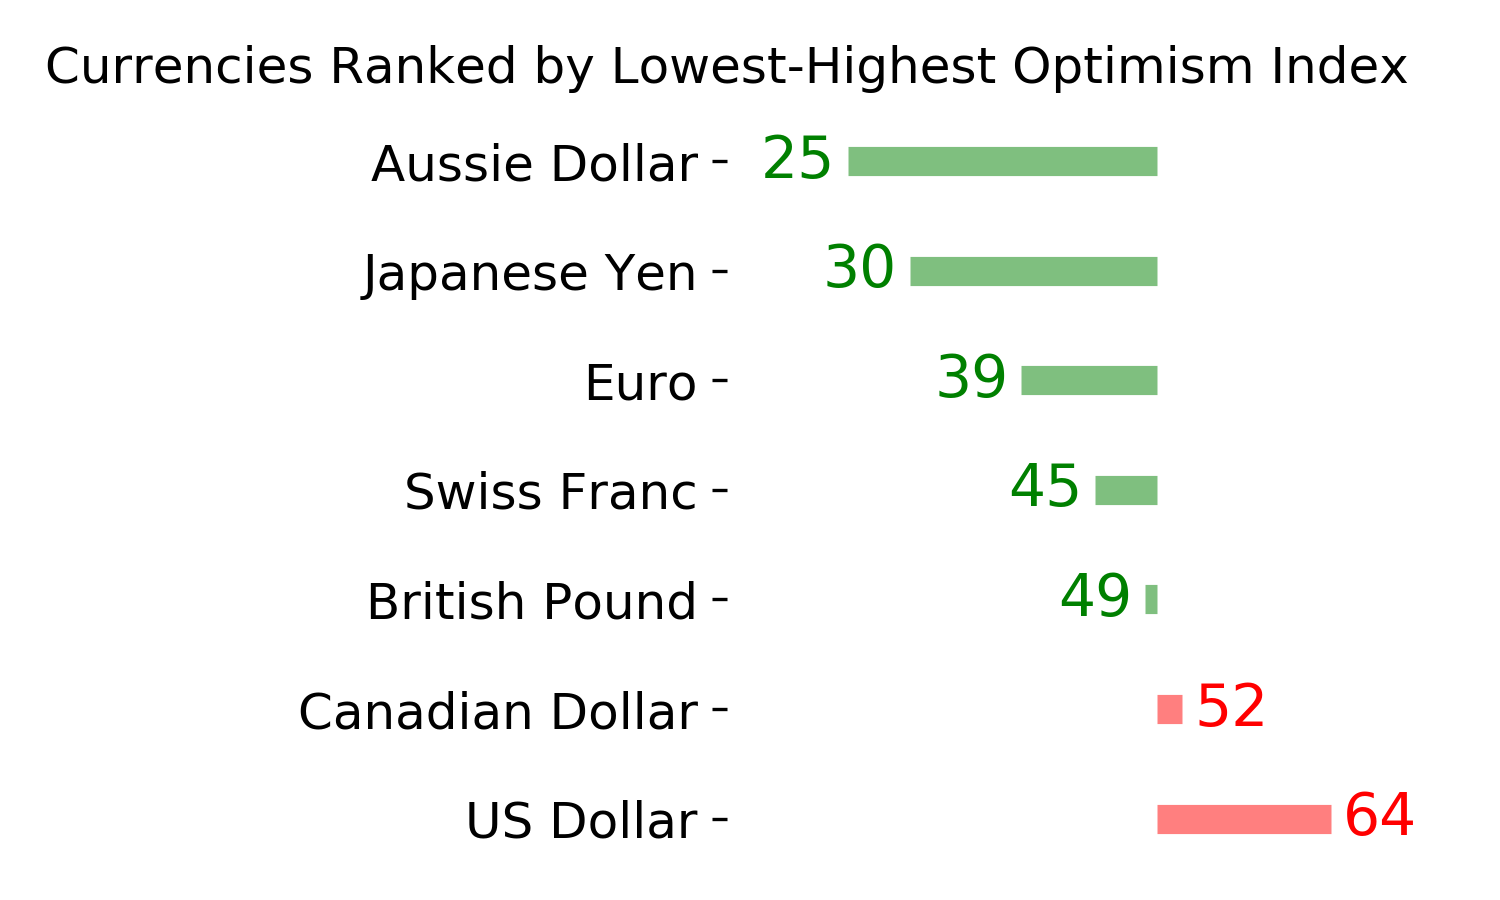
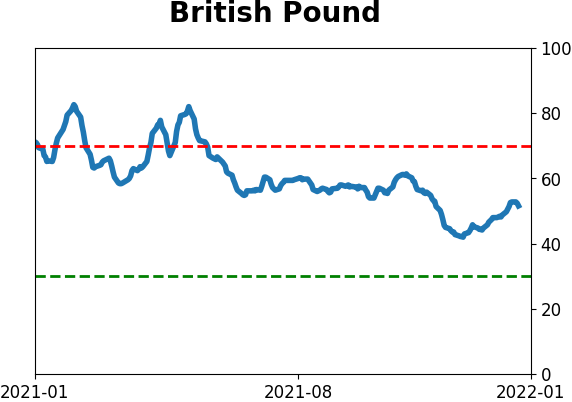
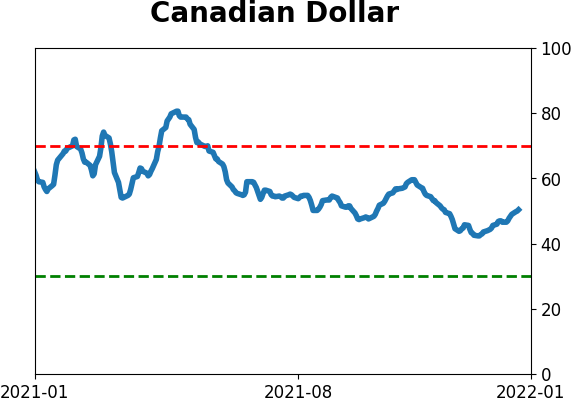
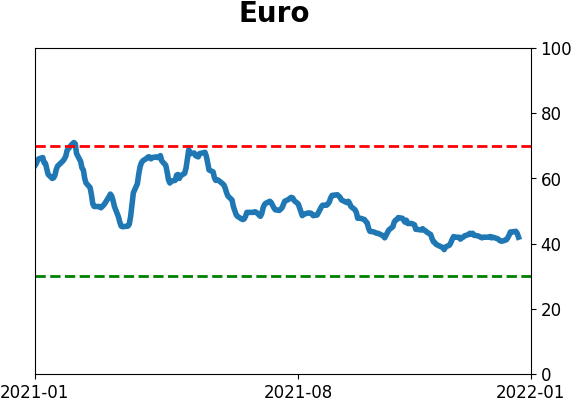
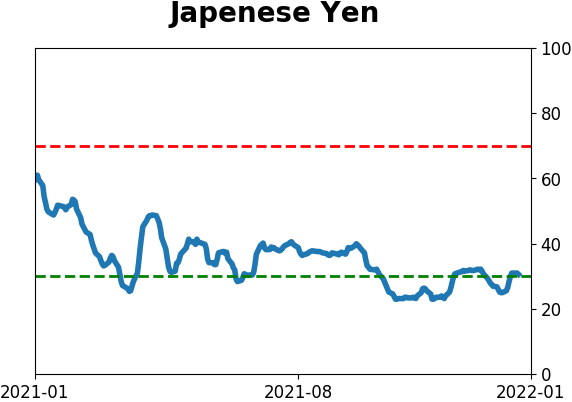
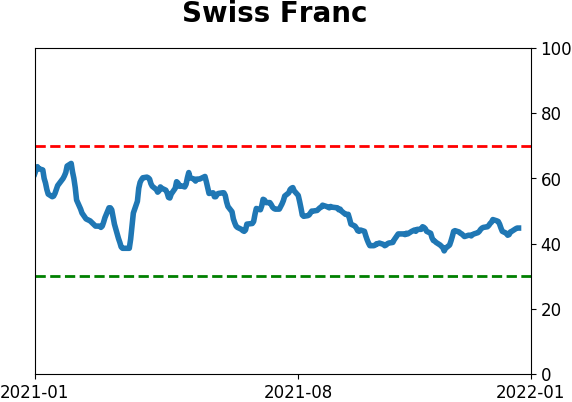
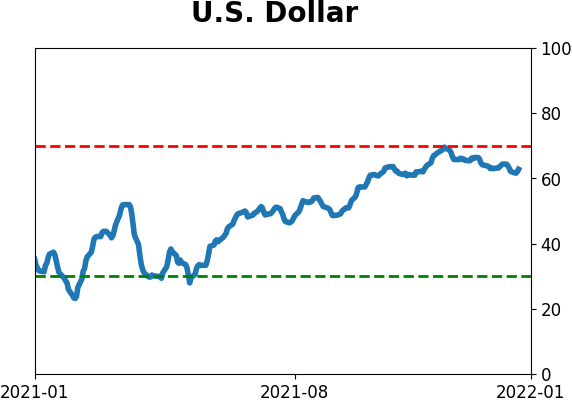
Currency ETF's - 5-Day Moving Average
|
|
|
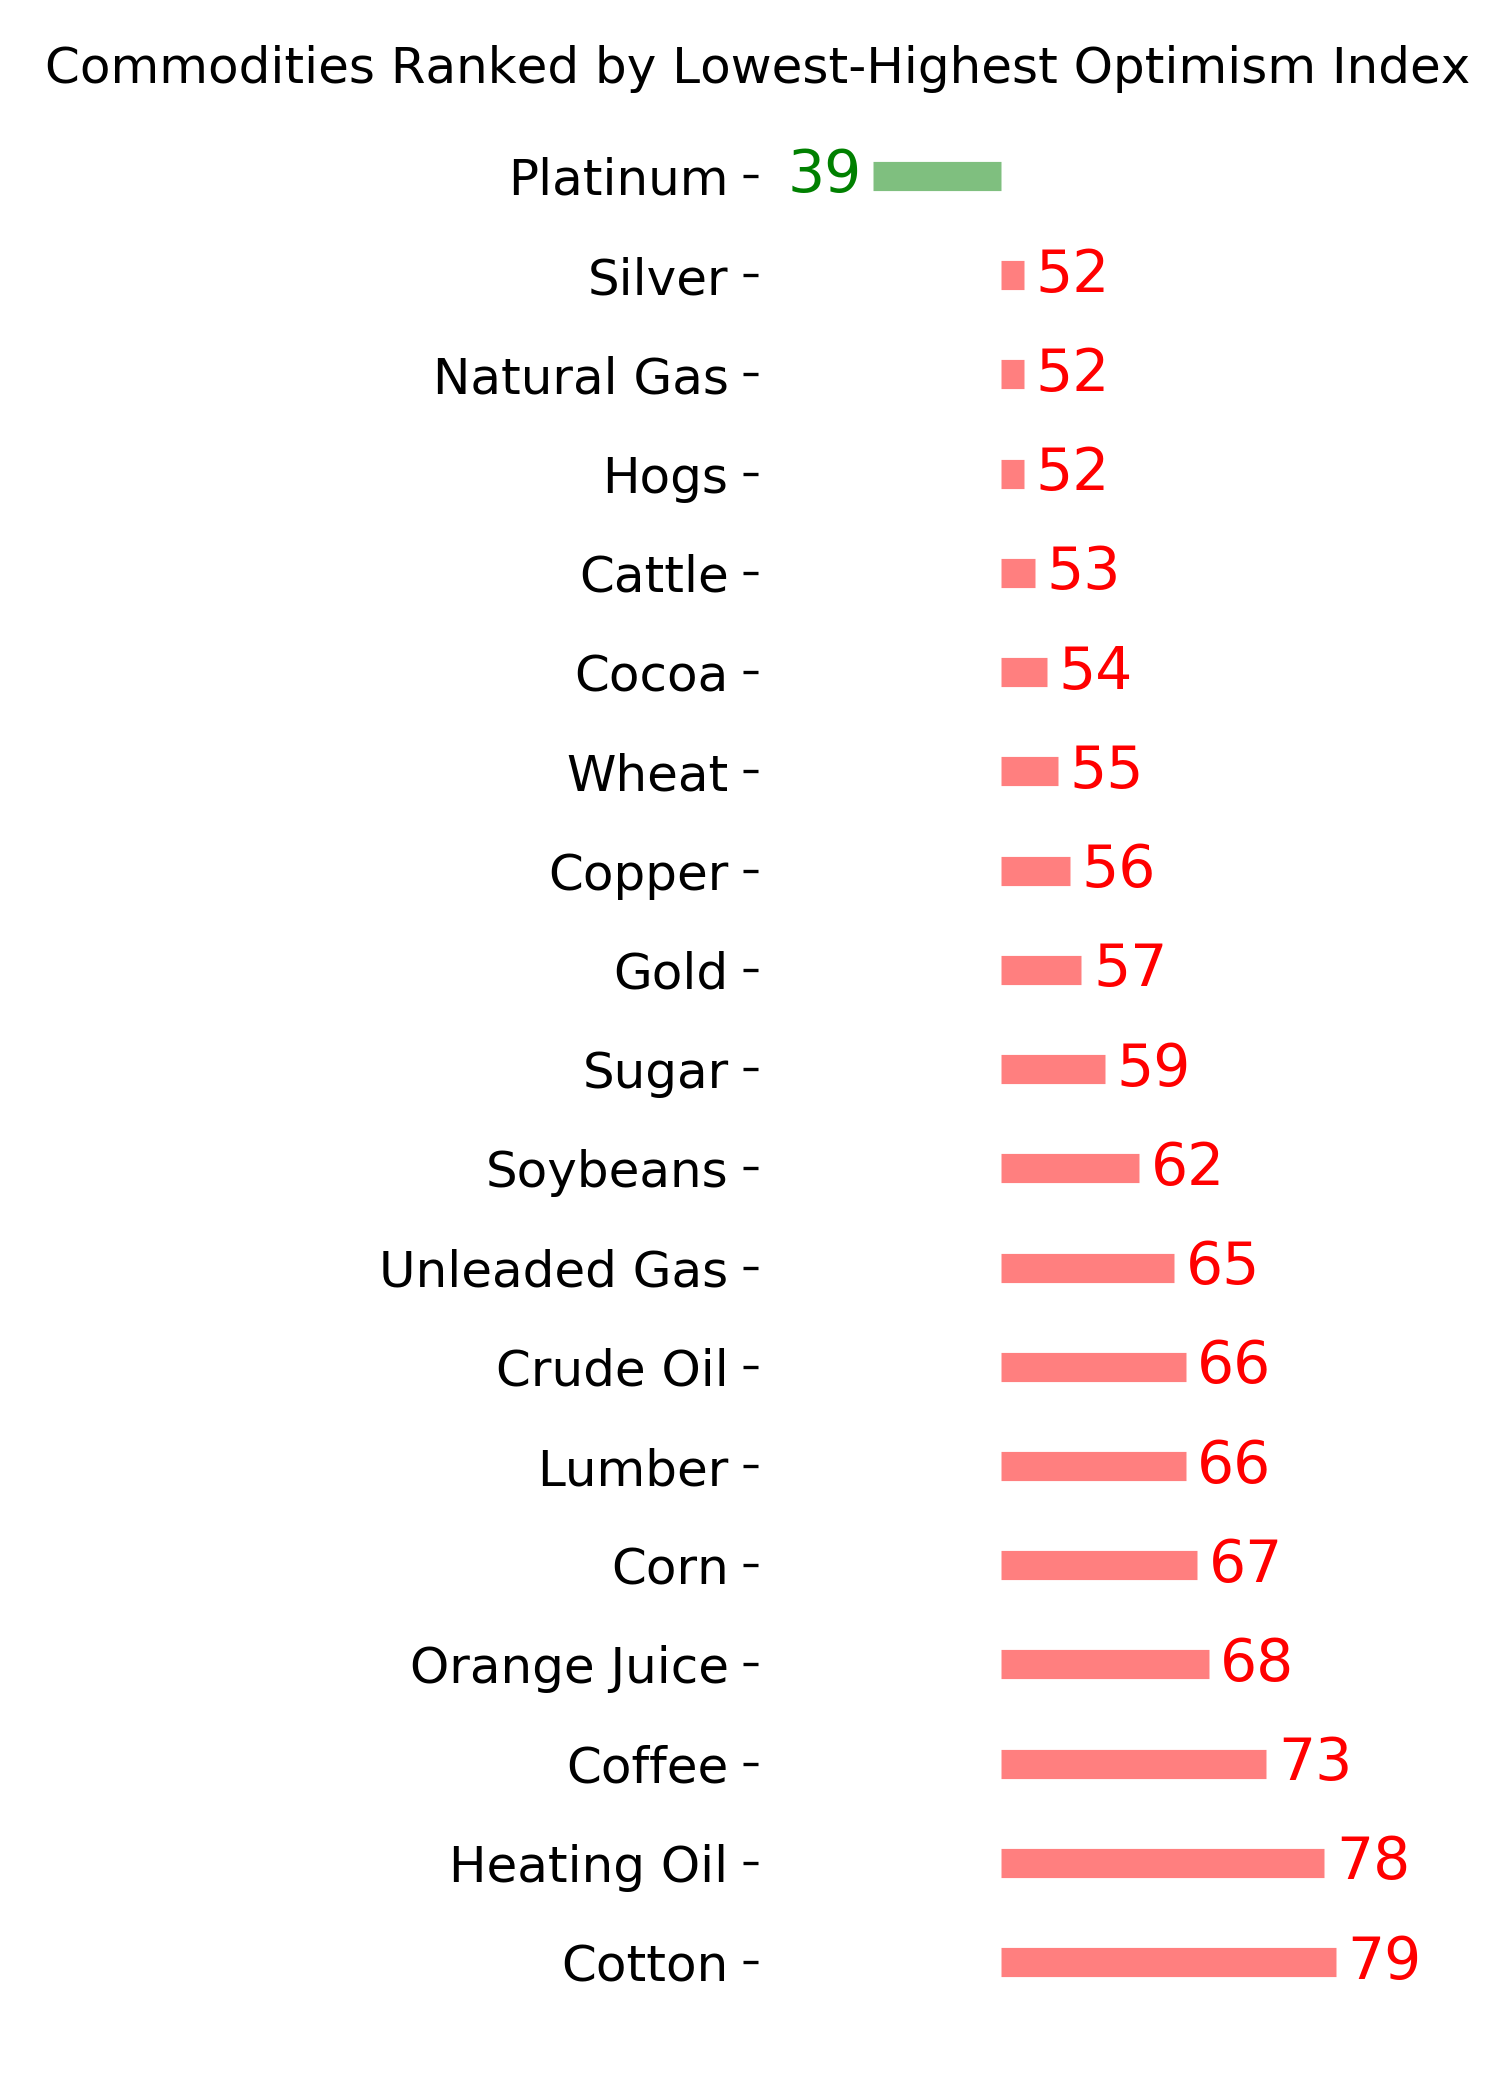
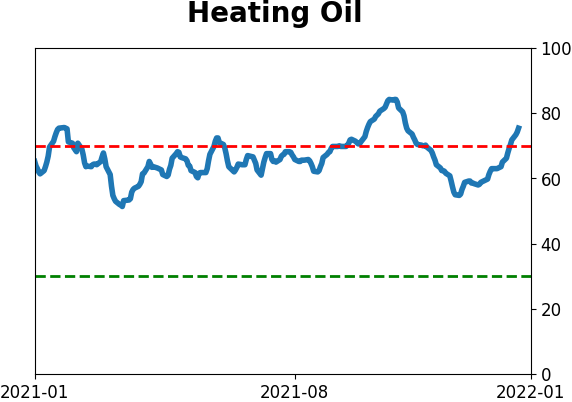
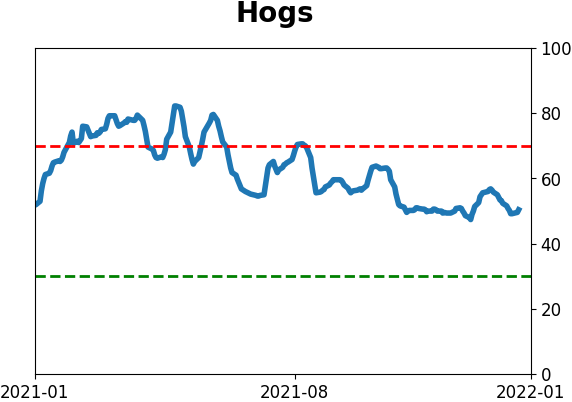
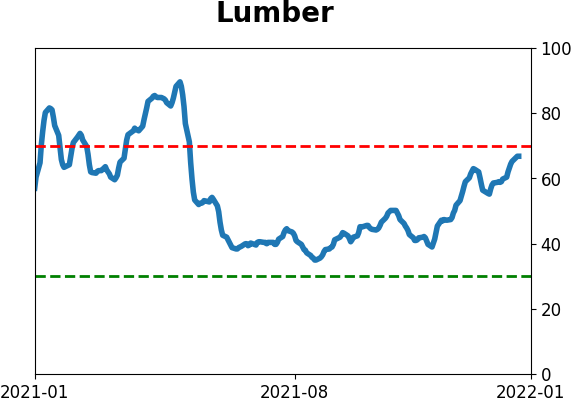
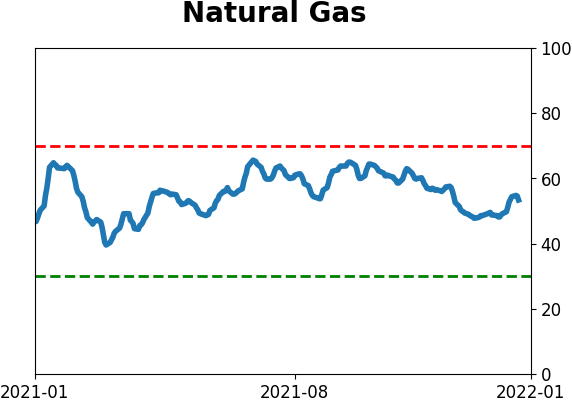
Commodity ETF's - 5-Day Moving Average
|
|