Headlines
|
|
Should we be concerned about the decline in industrial metals :
After achieving a 3-month high, an Industrial metals index declined in 11 out of the last 15 sessions. Following similar patterns, metals widely used in cyclical industries displayed a negative outlook over the following six and twelve months. However, broad equity indices like the S&P 500 experienced gains, whereas commodity-based sectors, particularly Materials, encountered challenges.
|
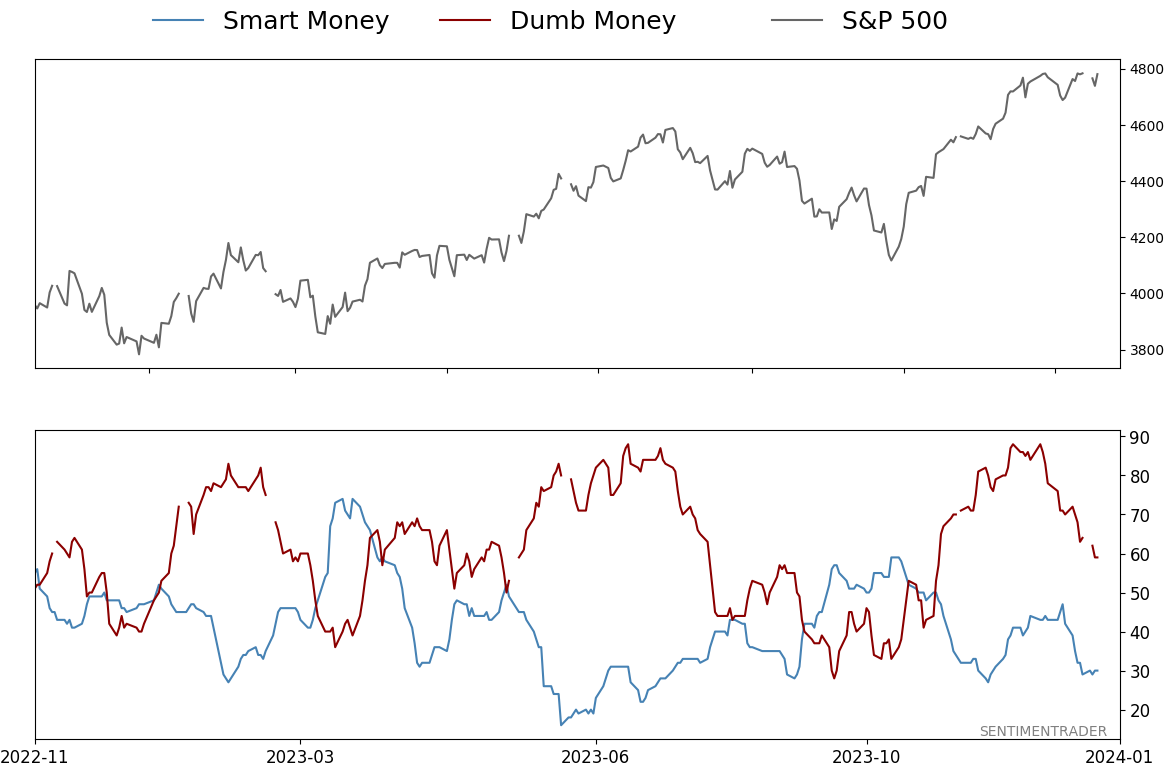
Smart / Dumb Money Confidence
|
Smart Money Confidence: 30%
Dumb Money Confidence: 59%
|
|
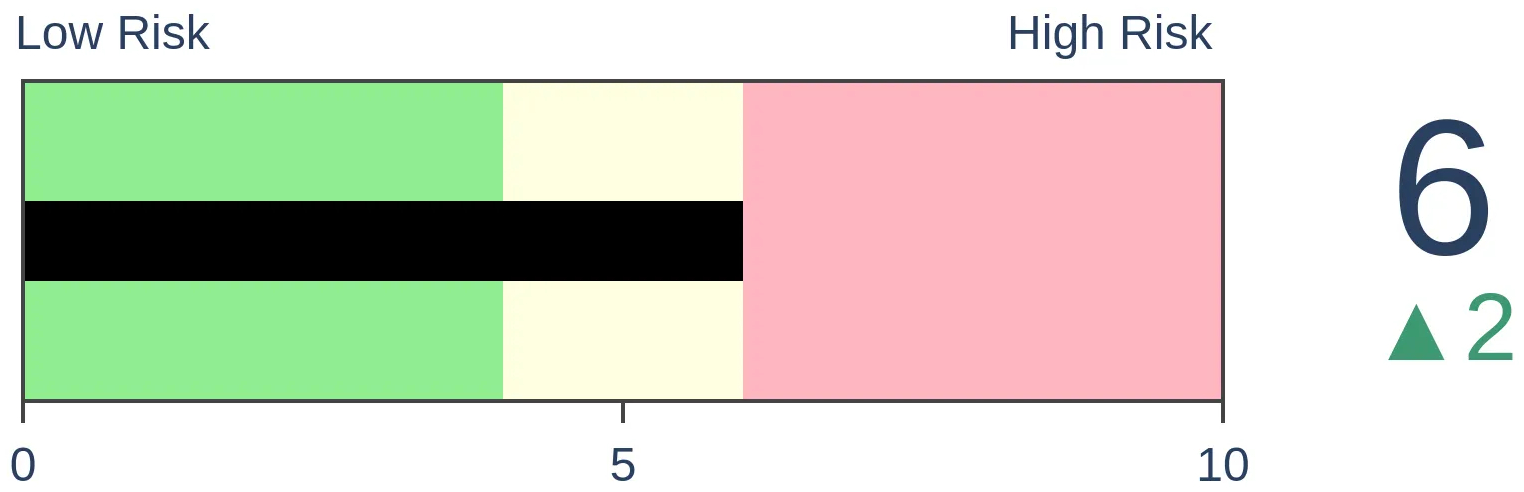
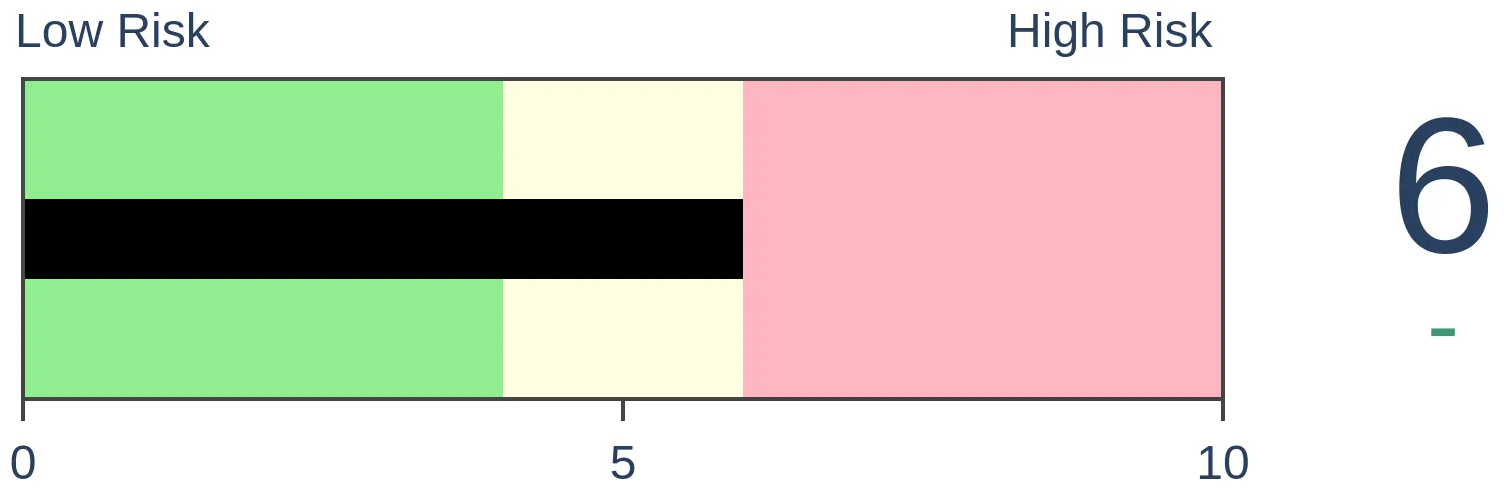
Risk Levels
Stocks Short-Term
|
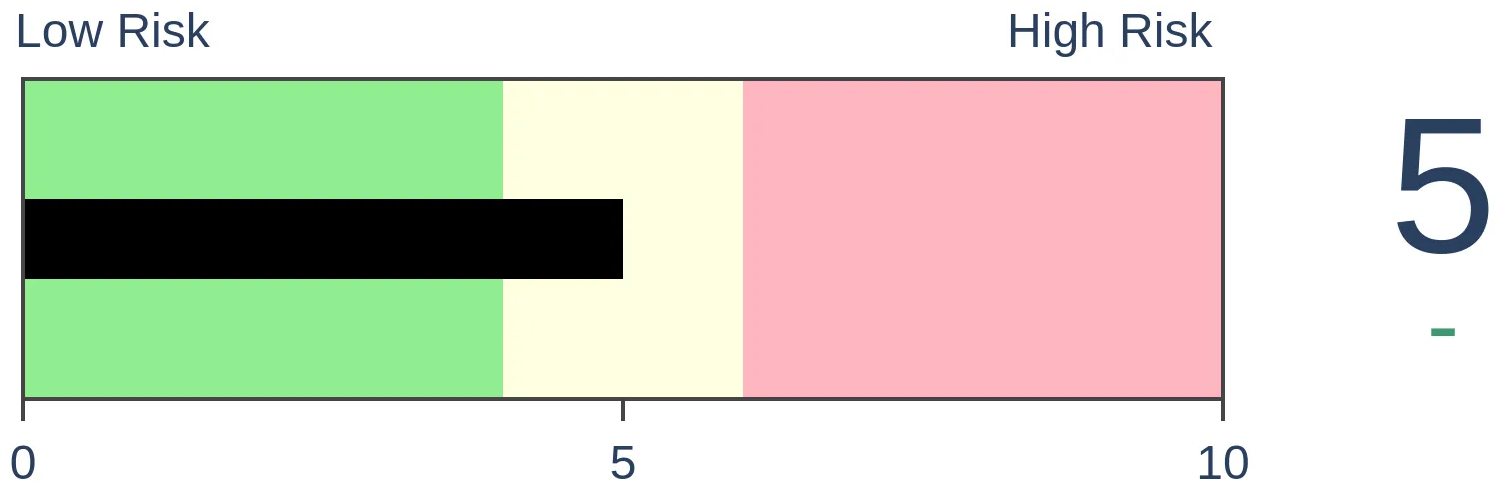
Stocks Medium-Term
|
|
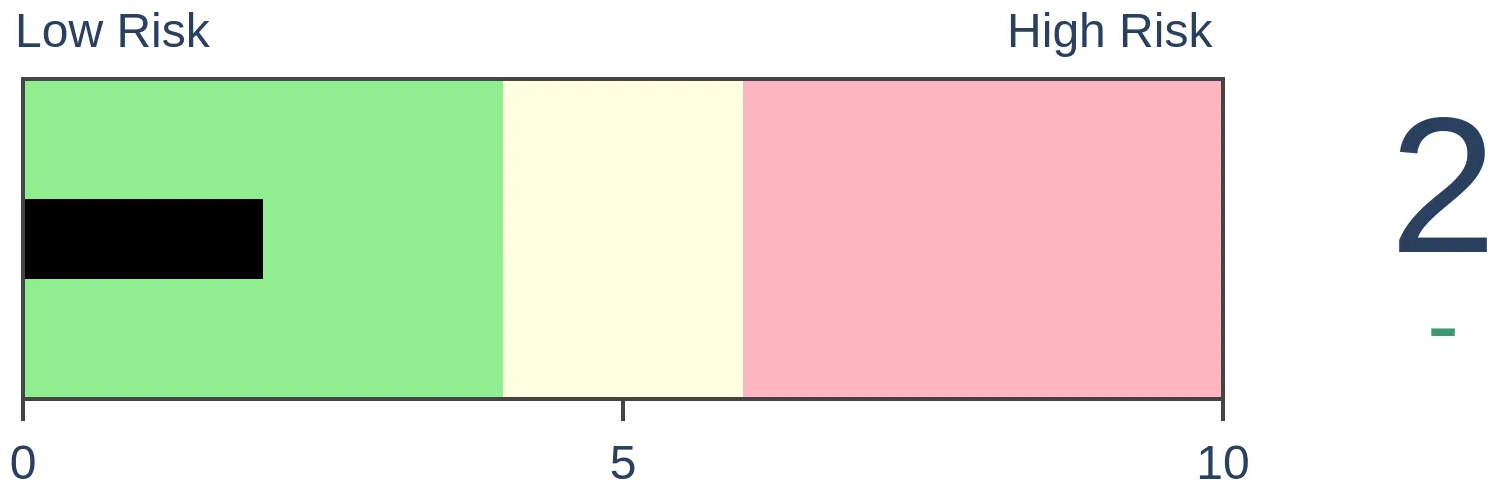
Bonds
|
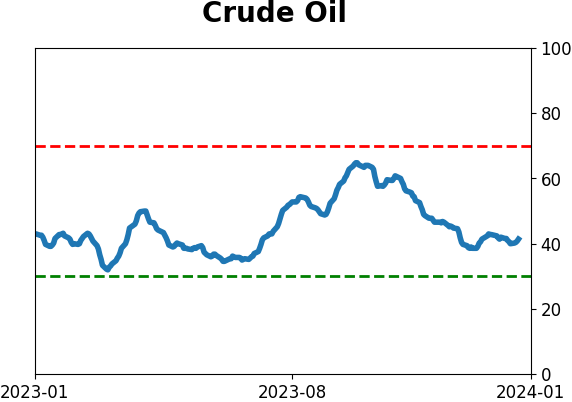
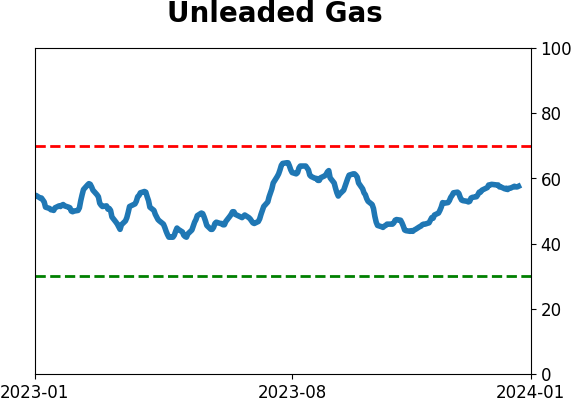
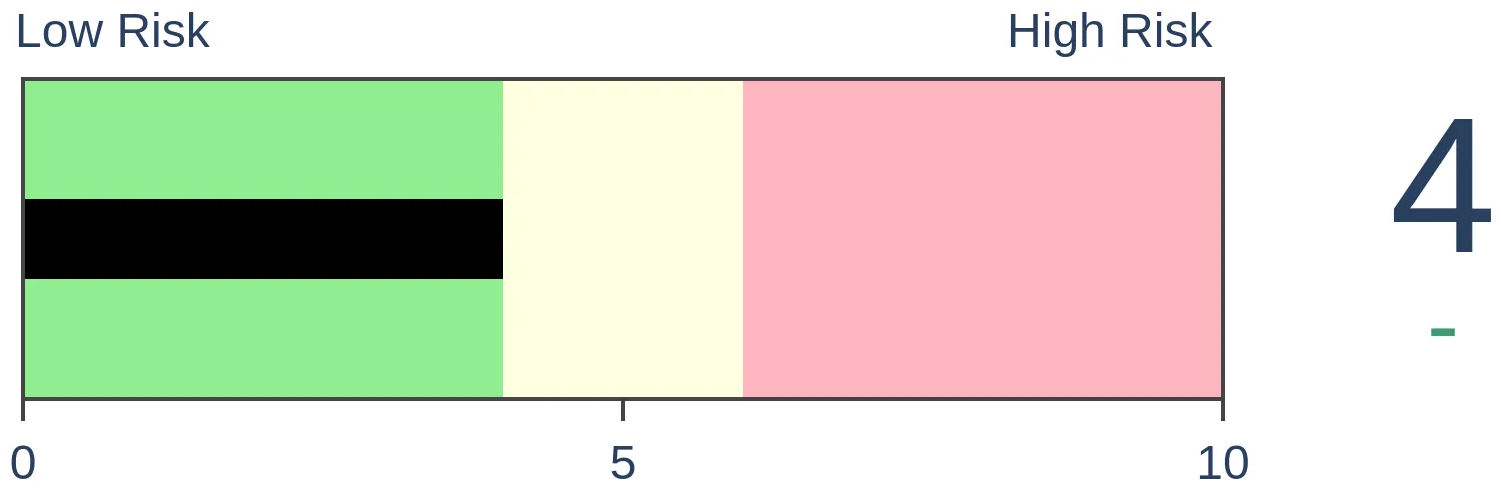
Crude Oil
|
|
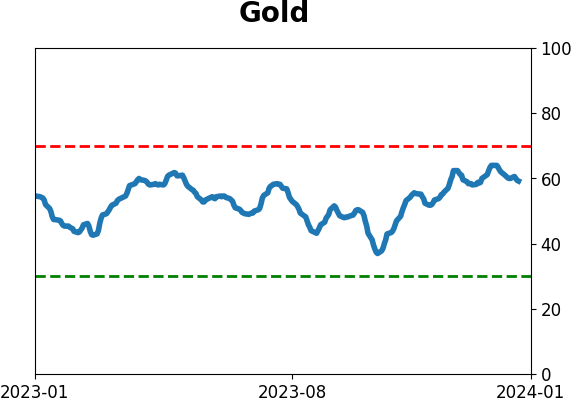
Gold
|
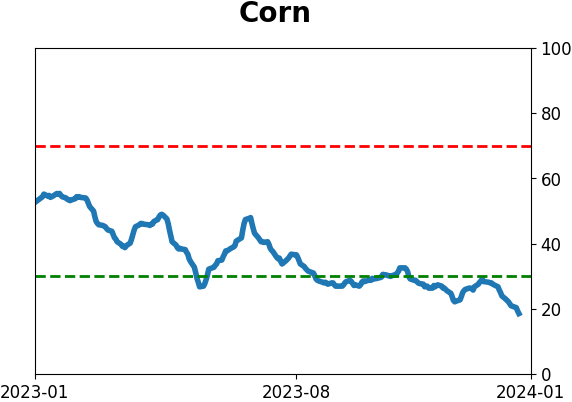
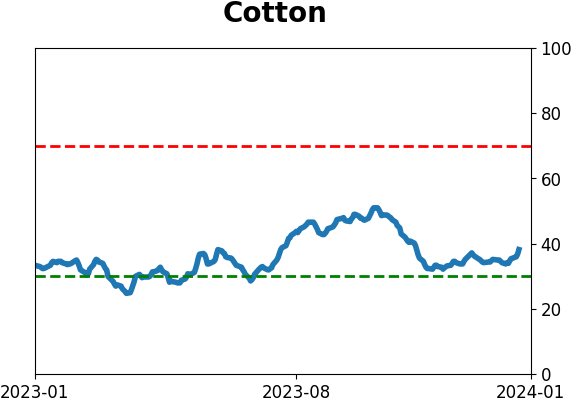
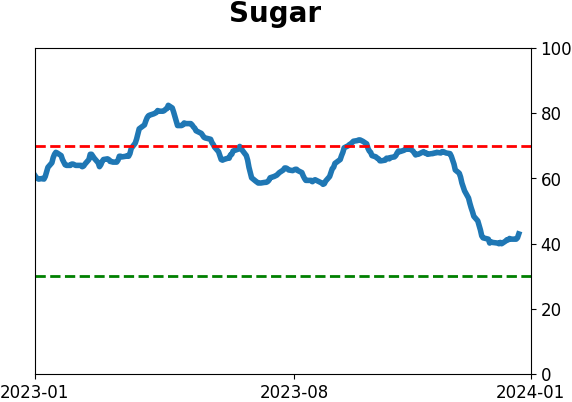
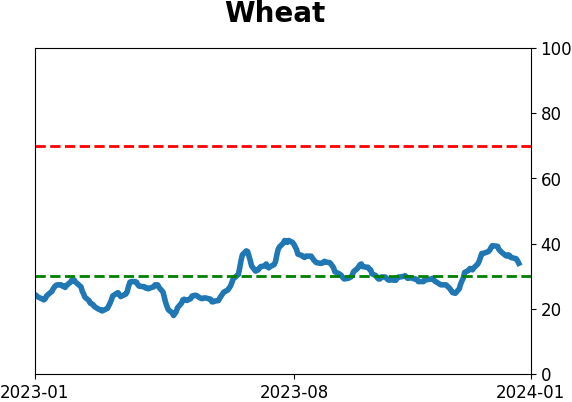
Agriculture

|
|
Research
By Dean Christians
BOTTOM LINE
After achieving a 3-month high, an Industrial metals index declined in 11 out of the last 15 sessions. Following similar patterns, metals widely used in cyclical industries displayed a negative outlook over the following six and twelve months. However, broad equity indices like the S&P 500 experienced gains, whereas commodity-based sectors, particularly Materials, encountered challenges.
FORECAST / TIMEFRAME
DBB -- Down, Long-Term
|
Key points:
- An Industrial metals index declined in 11 out of the last 15 sessions from a 3-month high
- Comparable price patterns suggest the downtrend in metals widely used in cyclical industries will persist
- While the S&P 500 shrugs off the downturn in metals, the Materials sector struggles
Are Industrial metals signaling a problem for stocks?
I highlighted a notable divergence between the S&P 500 and a commodity index in a research report published last week. One of the conclusions from that note was that the disconnect observed between these two assets did not substantially impact the broader equity market. However, the study did indicate potential challenges for commodity-focused sectors, like Energy and Materials.
With the S&P GSCI Industrial Metals Index, a commodity basket containing Aluminum, Copper, Lead, Nickel, and Zinc, declining in 11 out of 15 sessions from a 3-month high, let's assess the outlook for the metals index and stocks after similar precedents.
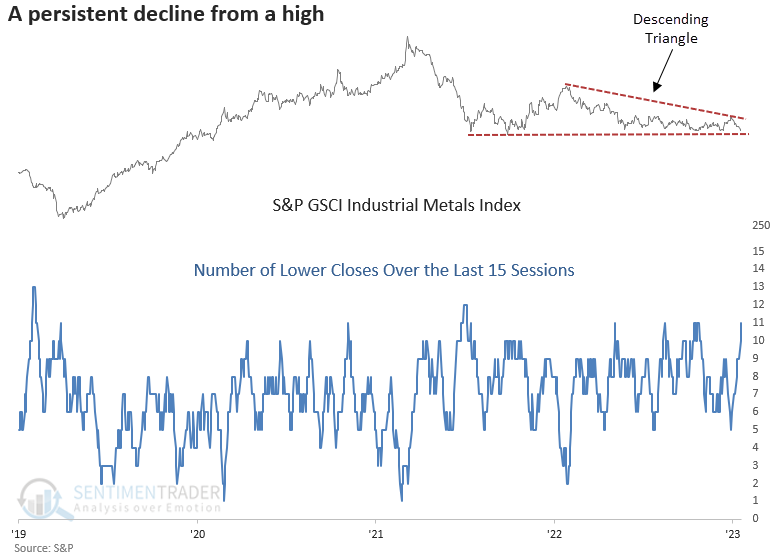
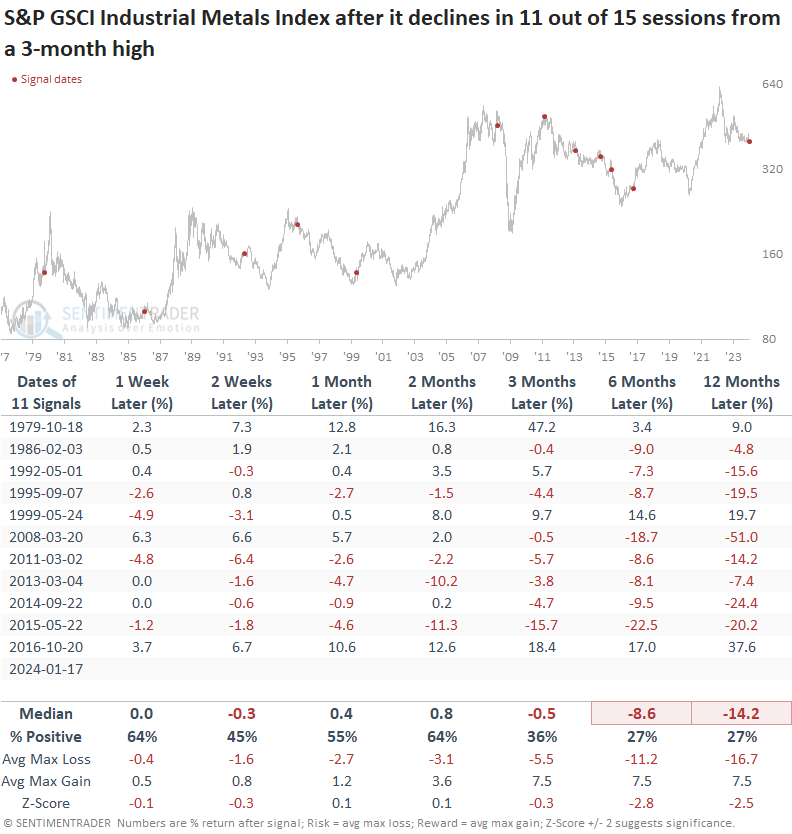
Comparable price patterns produced a negative long-term outlook
Whenever the S&P GSCI Industrial Metals Index declined in 11 out of 15 sessions from a 3-month high, returns were stagnant over the subsequent two months. The outlook over the following six and twelve months suggests any bounce should be sold.
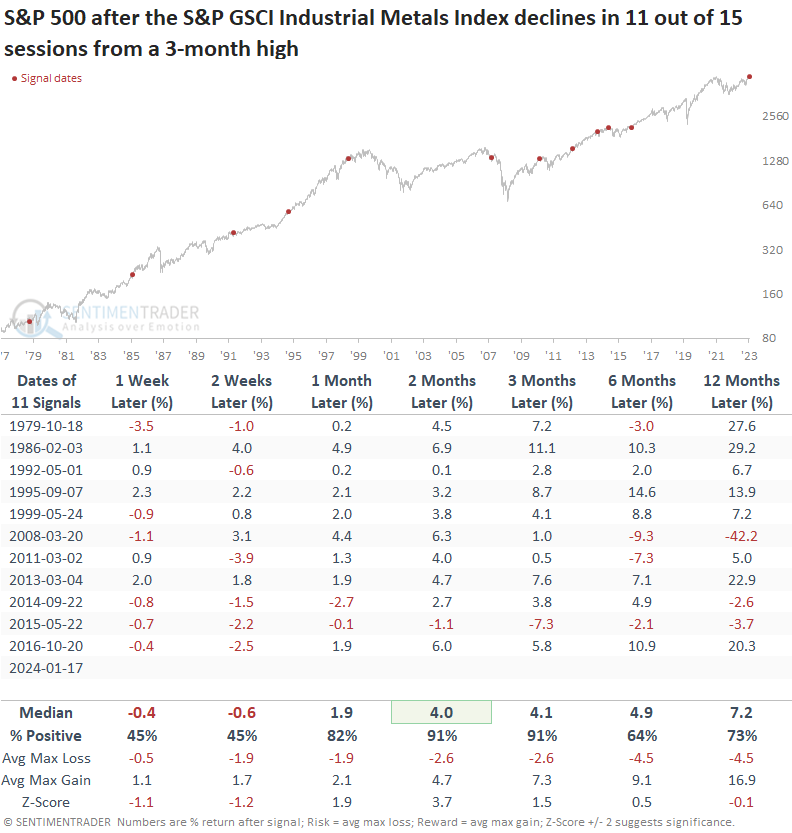
What about stocks?
The persistent downturn in industrial metals impacted stocks in the short term, yet they shrugged off the worry, and the S&P 500 showed gains in all but one instance over the following two months.
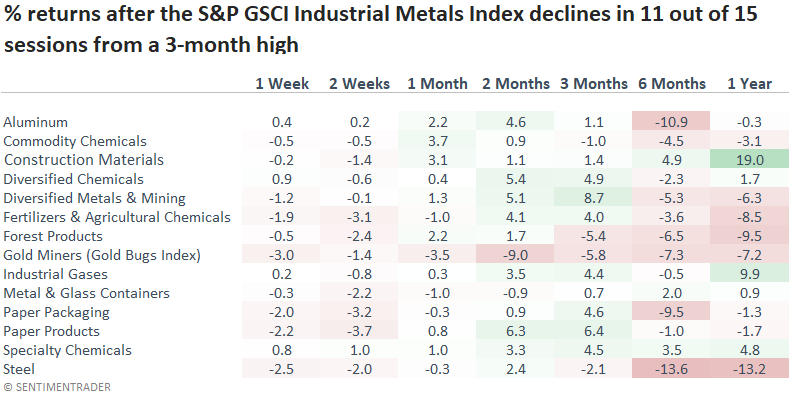
While most sectors follow the same return pattern as the S&P 500 in the near term, the Materials sector, which contains companies involved in the extraction and processing of metals, underperforms most groups over the following year.
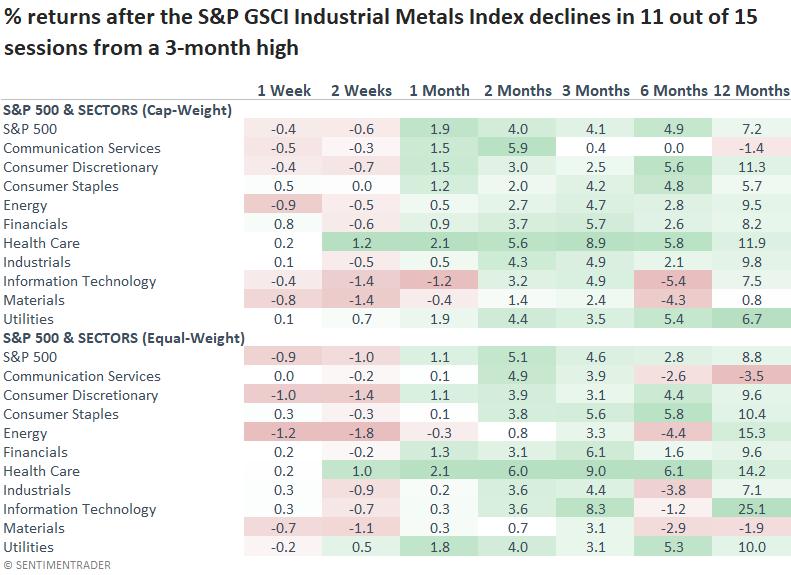
The return profile for sub-industry groups within Materials looks similar to sectors in the first few months. However, the outlook turned considerably more unfavorable six and twelve months later. That was especially the case for Aluminum and Steel.
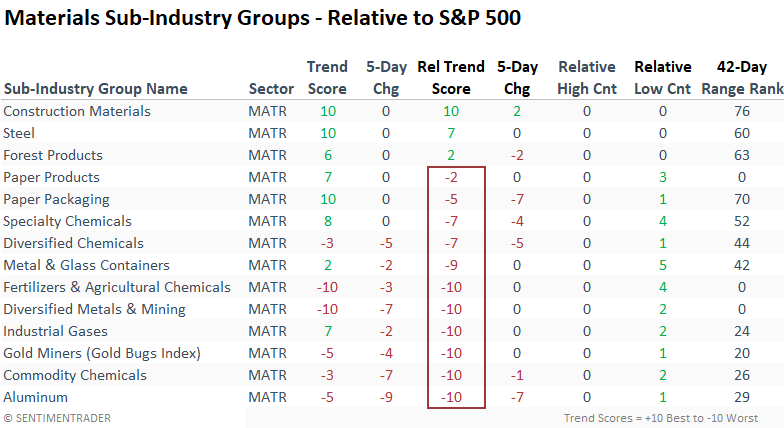
Absolute and relative strength trends for sub-industry groups within Materials
As one might expect, absolute and relative trend scores within sub-industry groups linked to industrial metals, such as Aluminum and Diversified Metals and Mining, exhibit unfavorable trends.
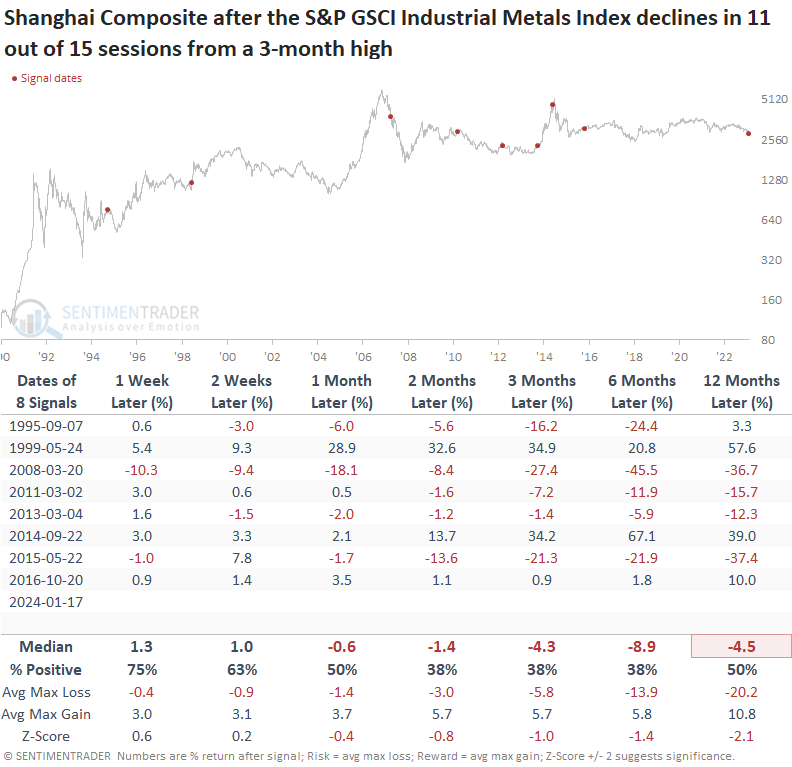
Commodities and China
China is known as the world's manufacturing hub. Therefore, any increase or decrease in output can impact the demand for industrial metals.
While the Shanghai Composite may not be an ideal index to measure, and historical data limits the analysis to two fewer signals, given the ongoing bear market in Chinese equities, I figured some perspective was better than none.
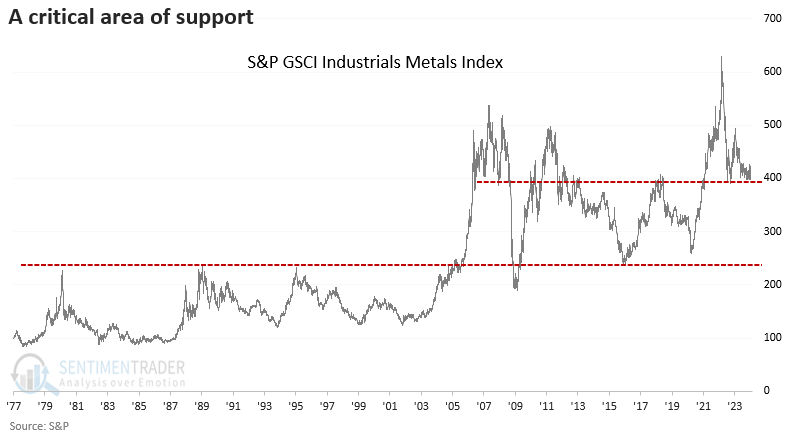
The big picture
With a negative outlook based on today's study, the odds of the S&P GSCI Industrials Metals Index holding support don't look good.
What the research tells us...
Industrial metals, like most commodities, are in a long-term downtrend. After a short-lived bounce, the S&P GSCI Industrial Metals Index turned down from a 3-month high, closing lower in 11 of the last 15 sessions. After similar precedents, the index was stagnant for a few months before the negative momentum reasserted itself again. While the perception of declining industrial metals is likely to make good dinner conversation for the macro bears, it did not impact the broader equity market as the S&P 500 rallied 91% of the time over the subsequent two and three-month periods. However, it did impact stocks in the Materials sector, especially companies involved in the extraction and processing of metals. So, investors should avoid the Materials sector and industrial metals stocks until the trend is your friend.
Indicators at Extremes
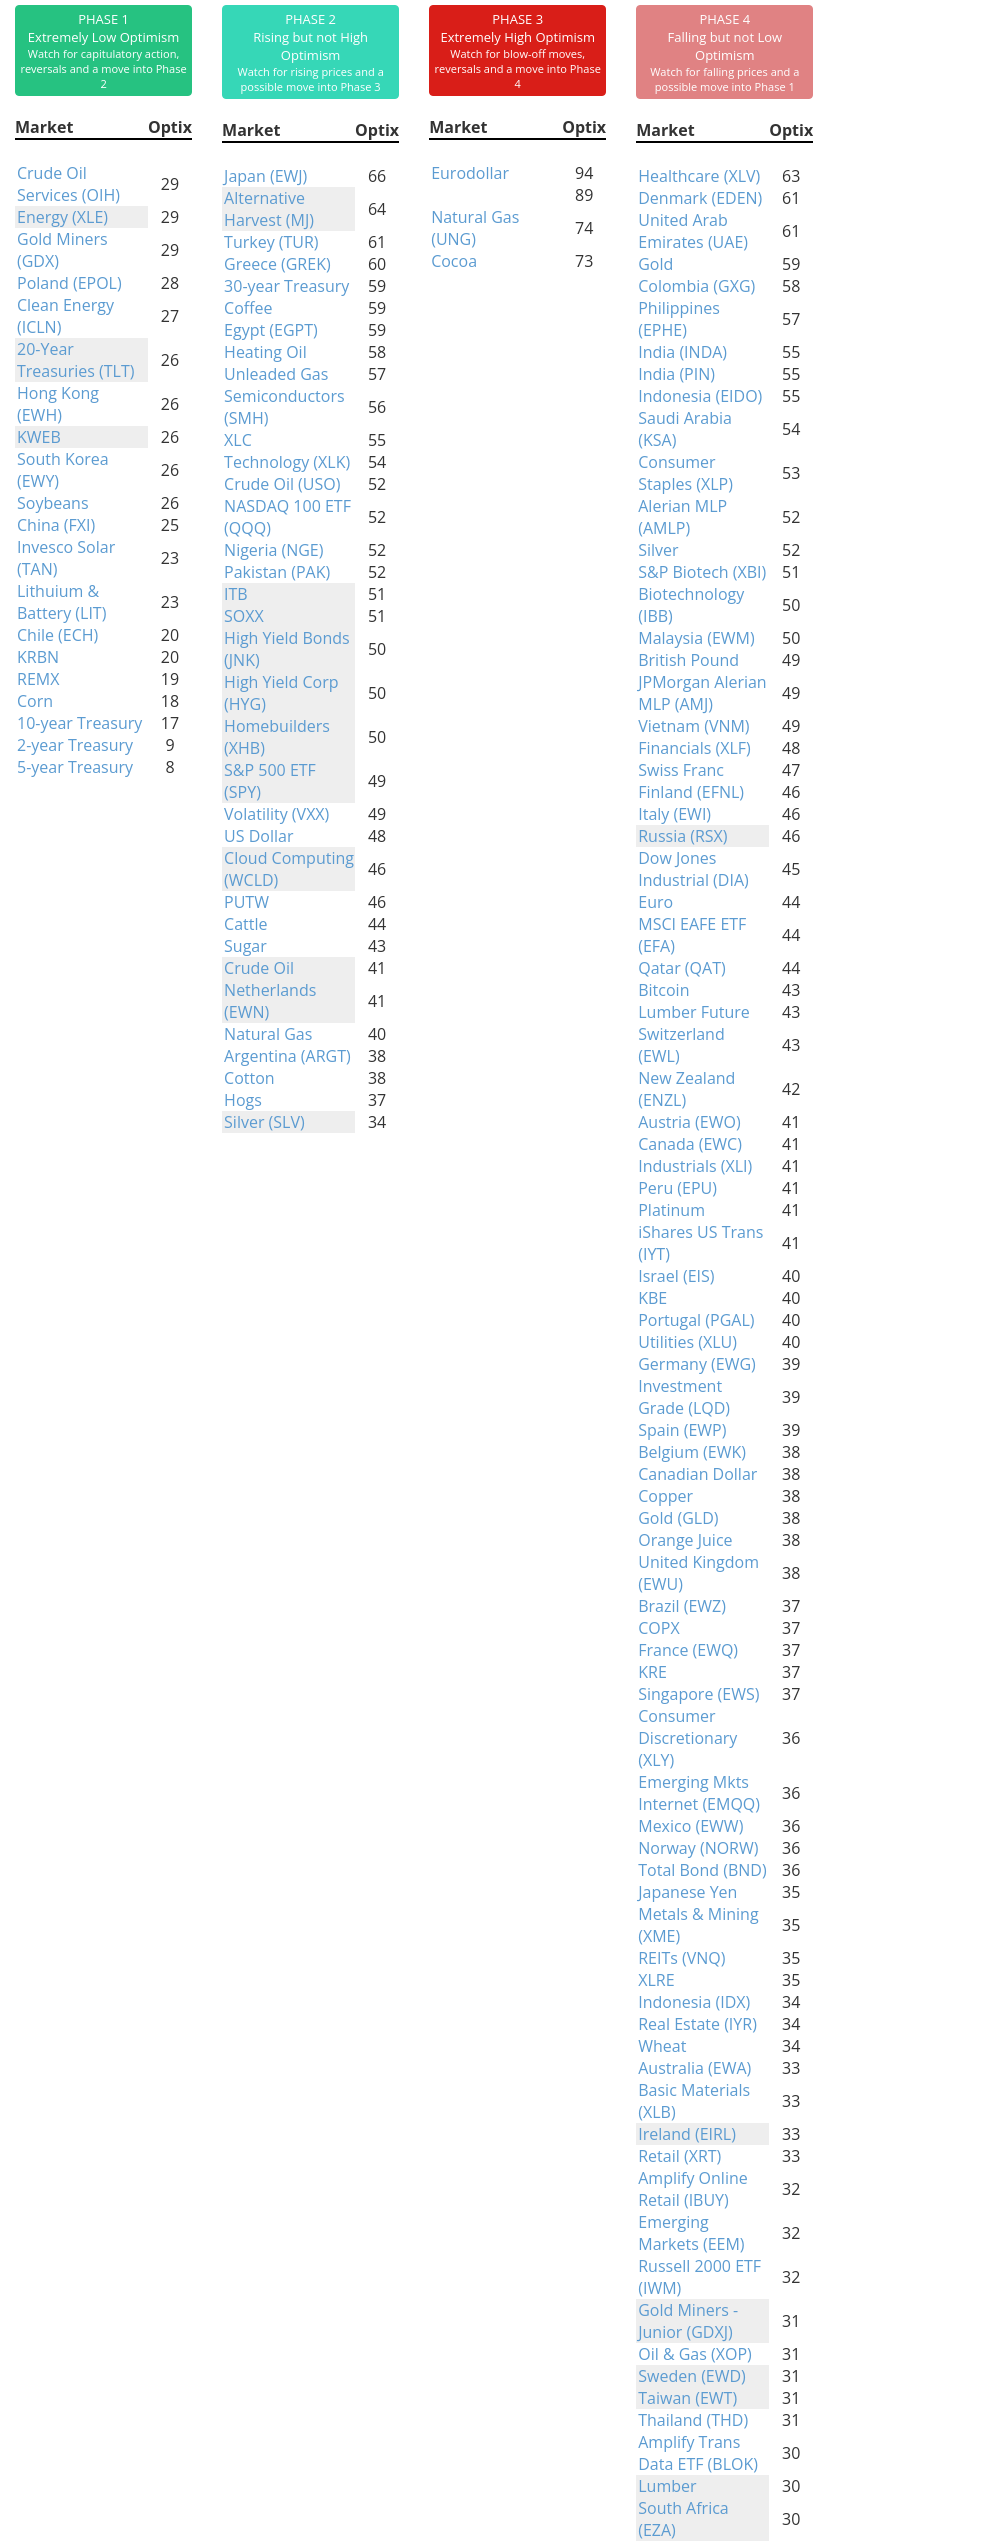
Phase Table
Ranks
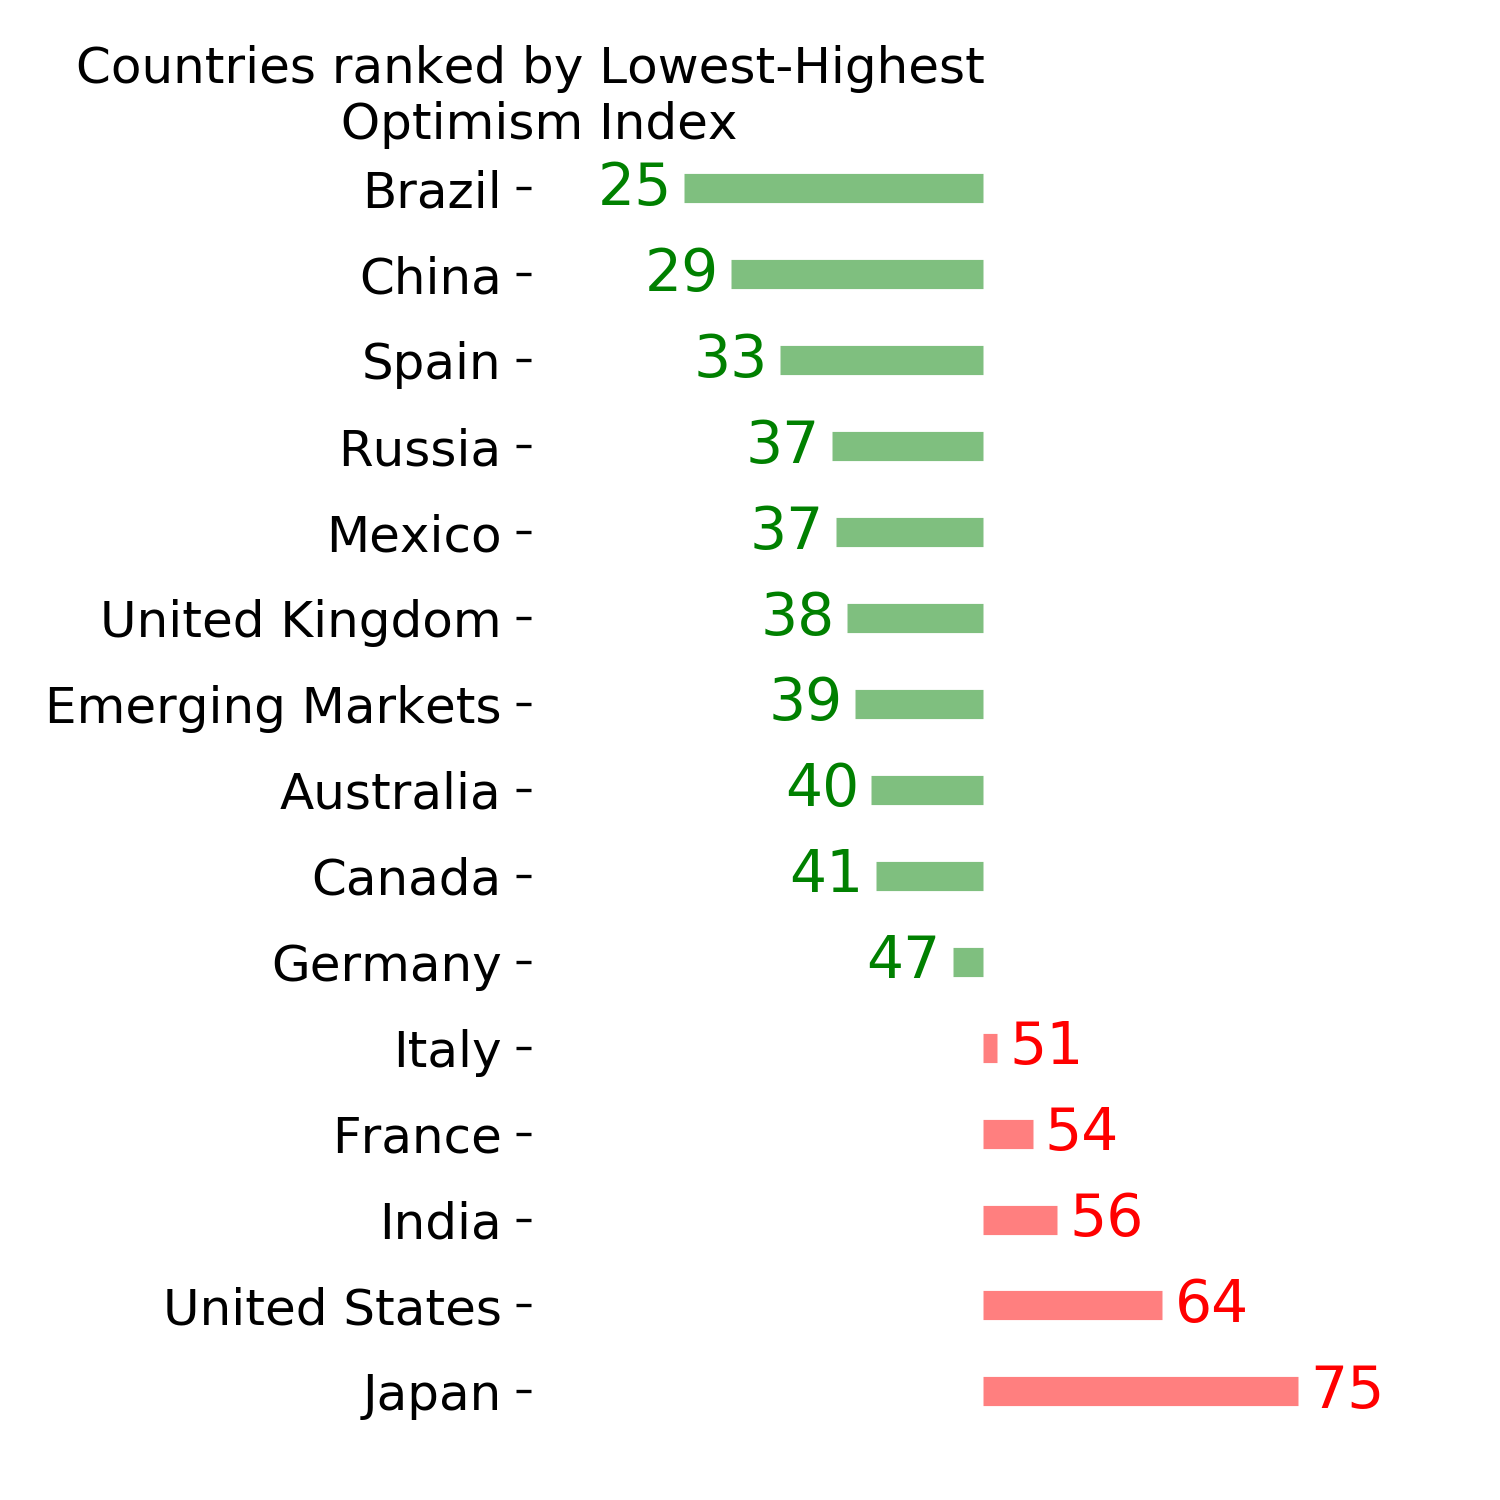
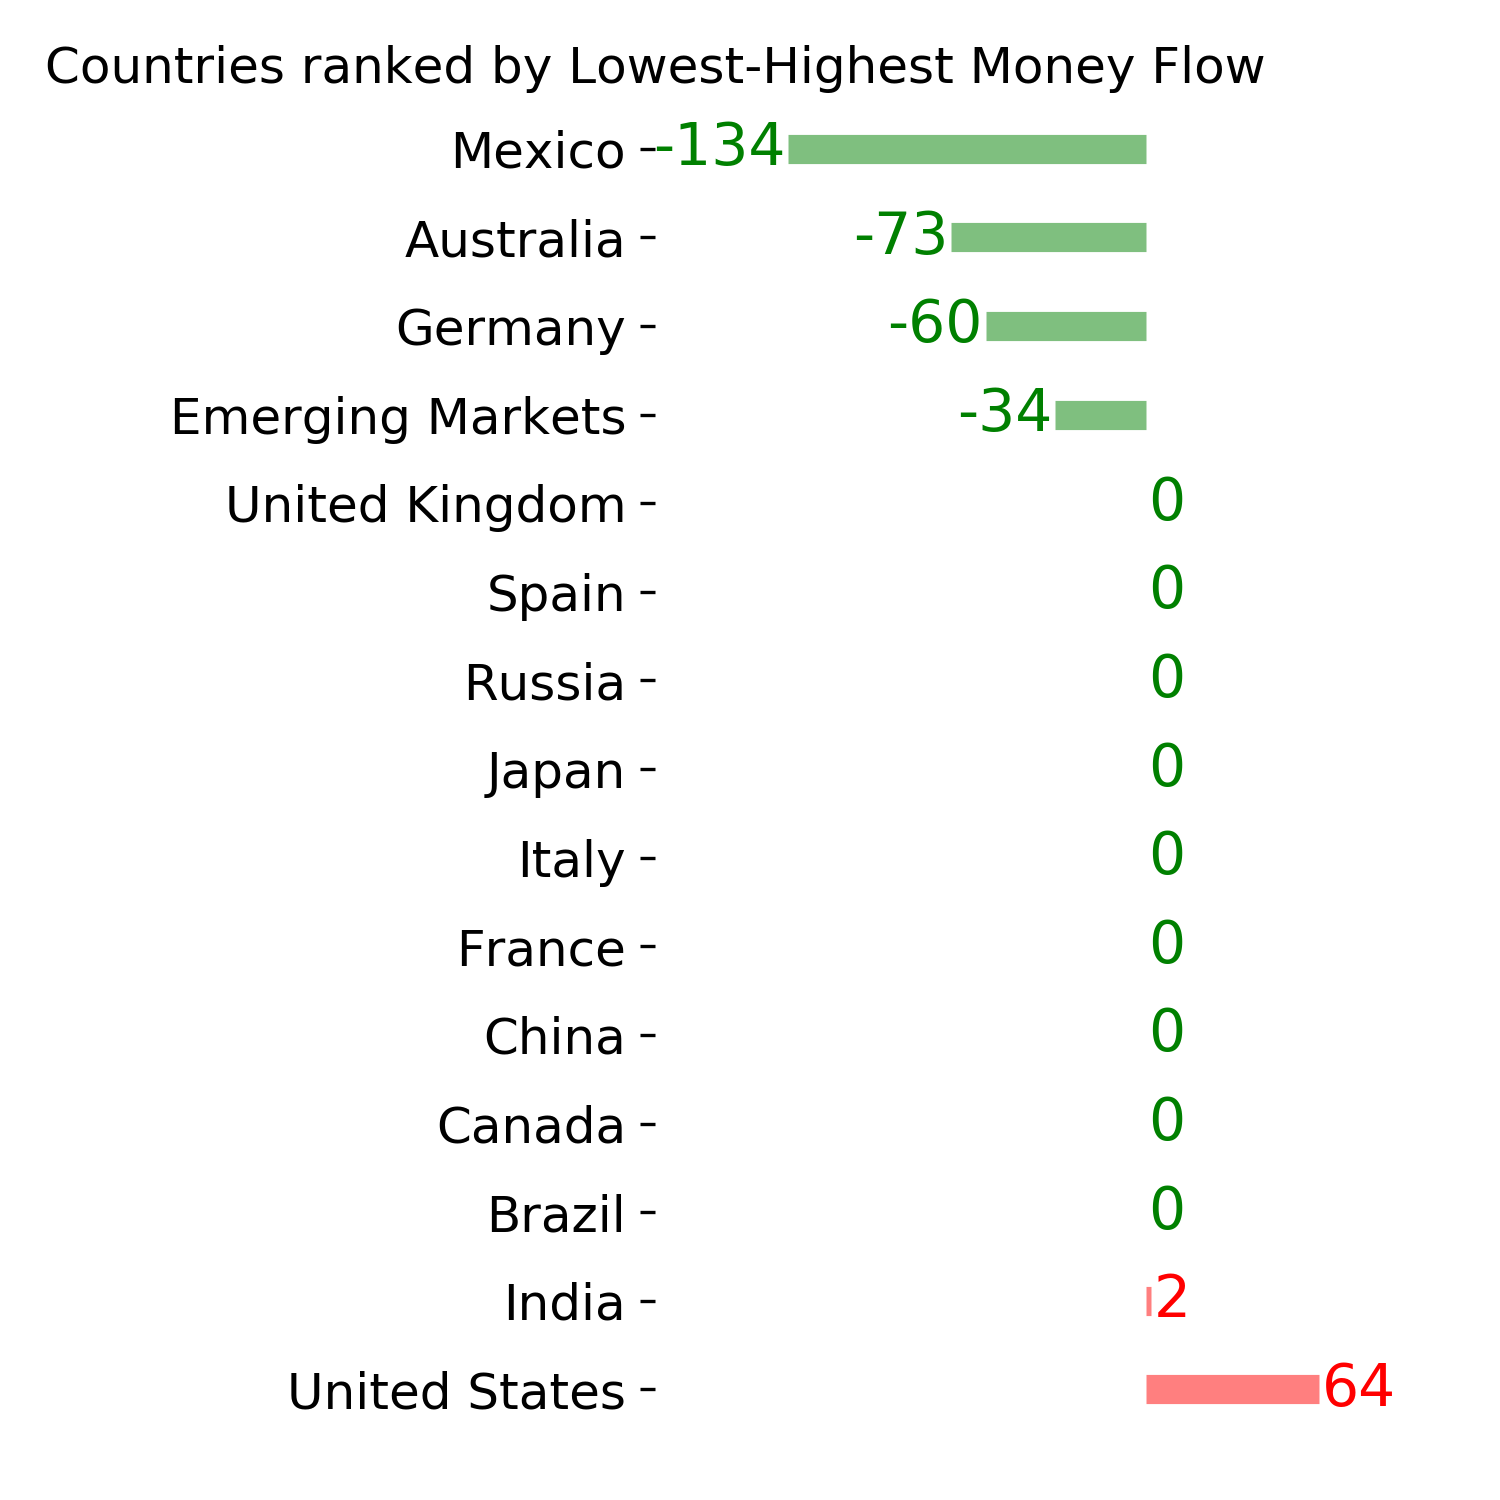
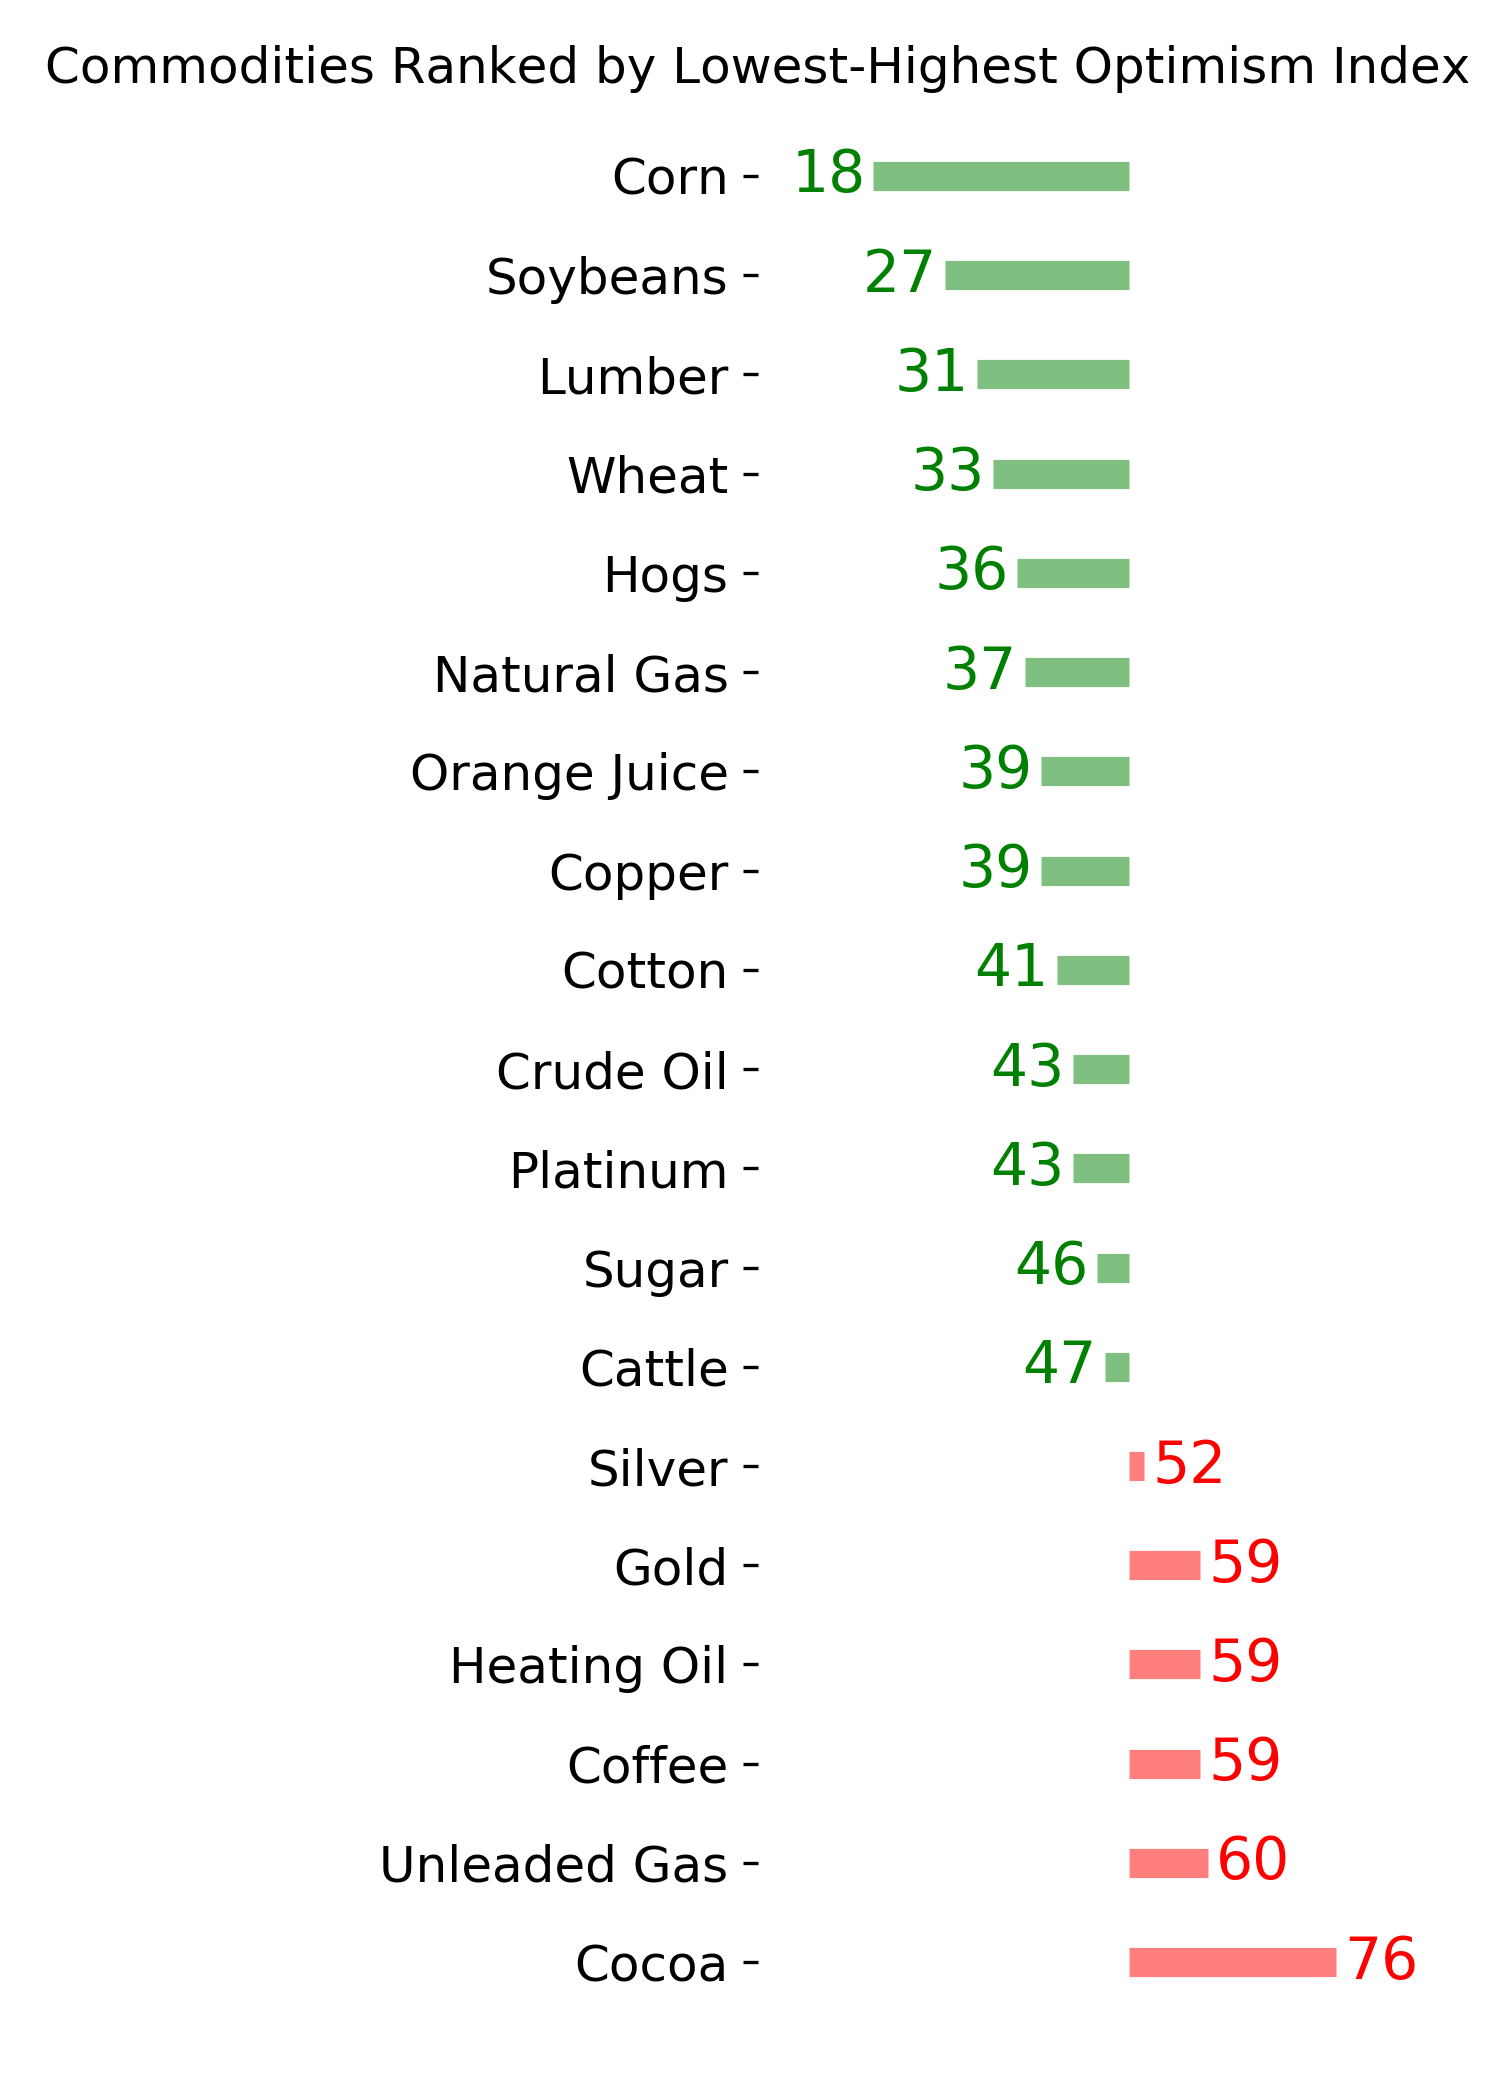
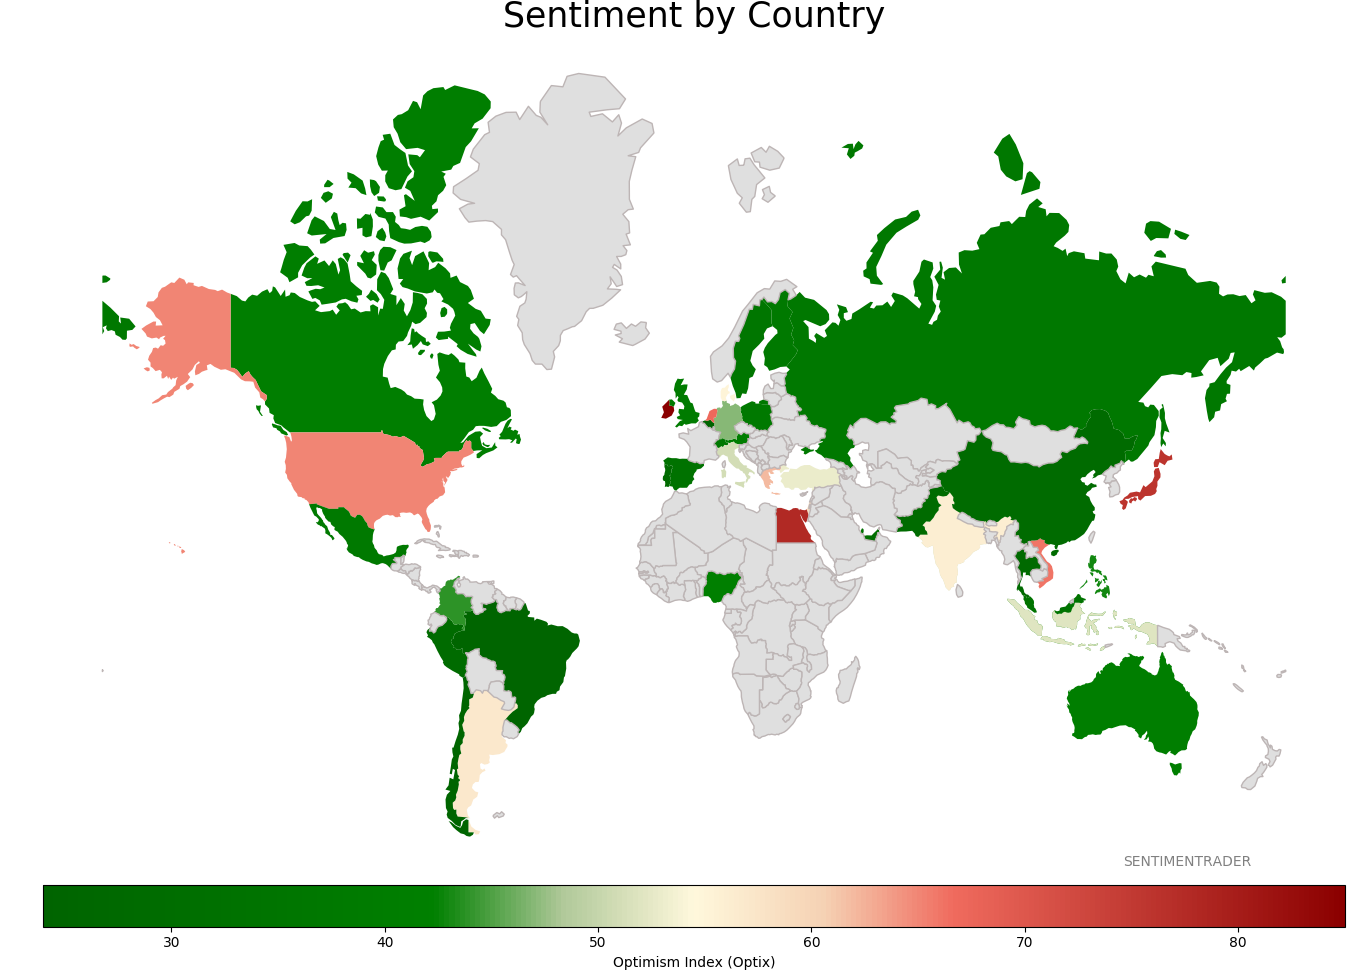
Sentiment Around The World
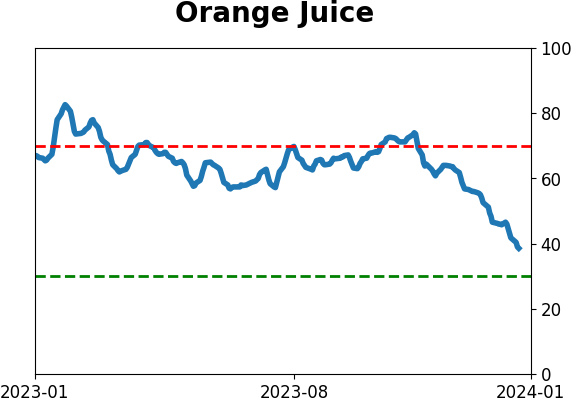
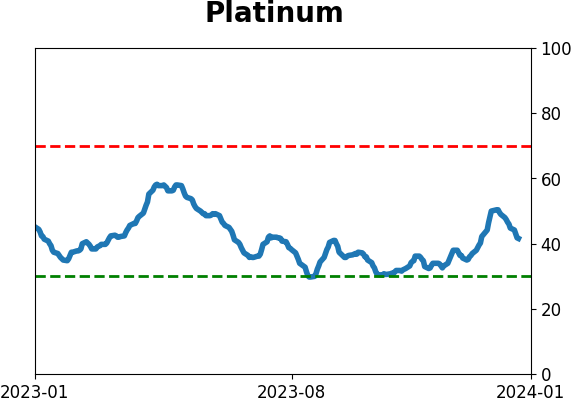
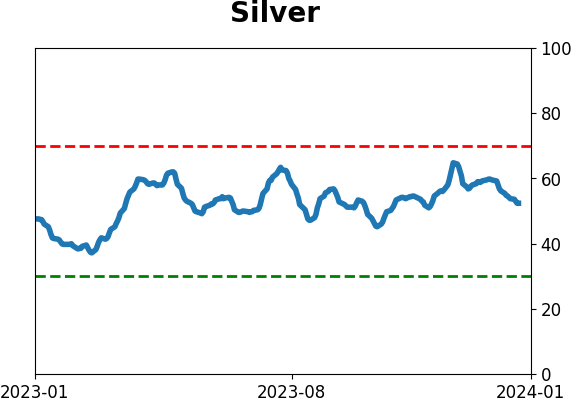
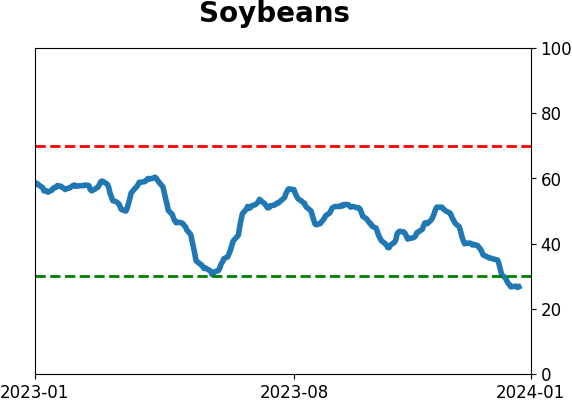
Optimism Index Thumbnails
|
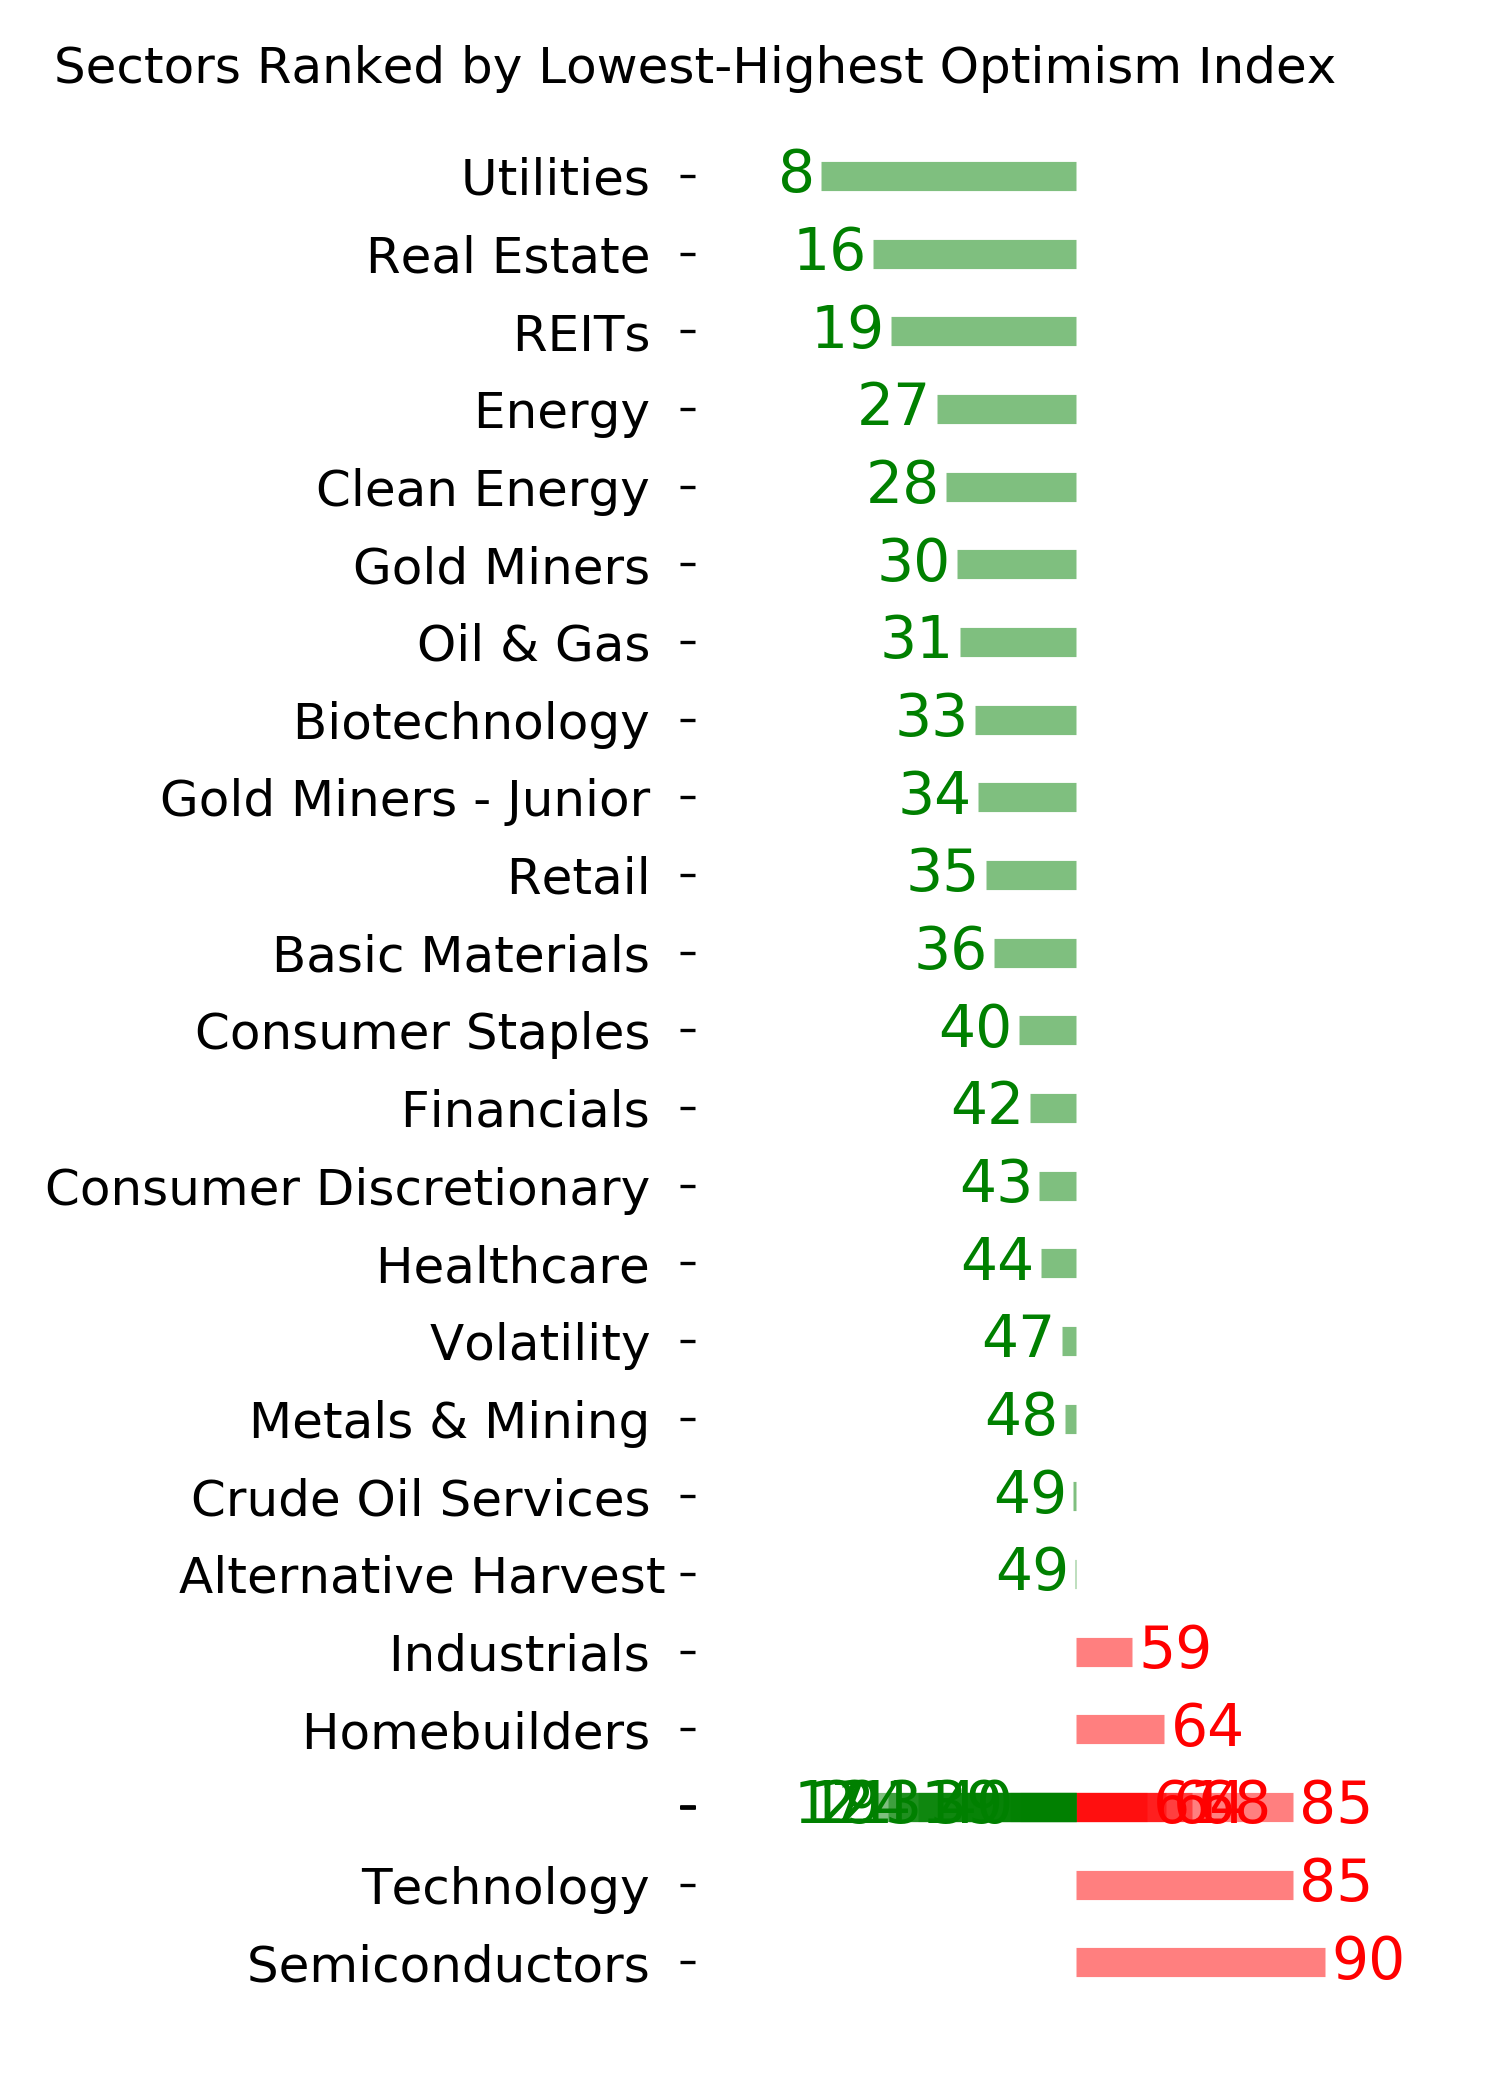
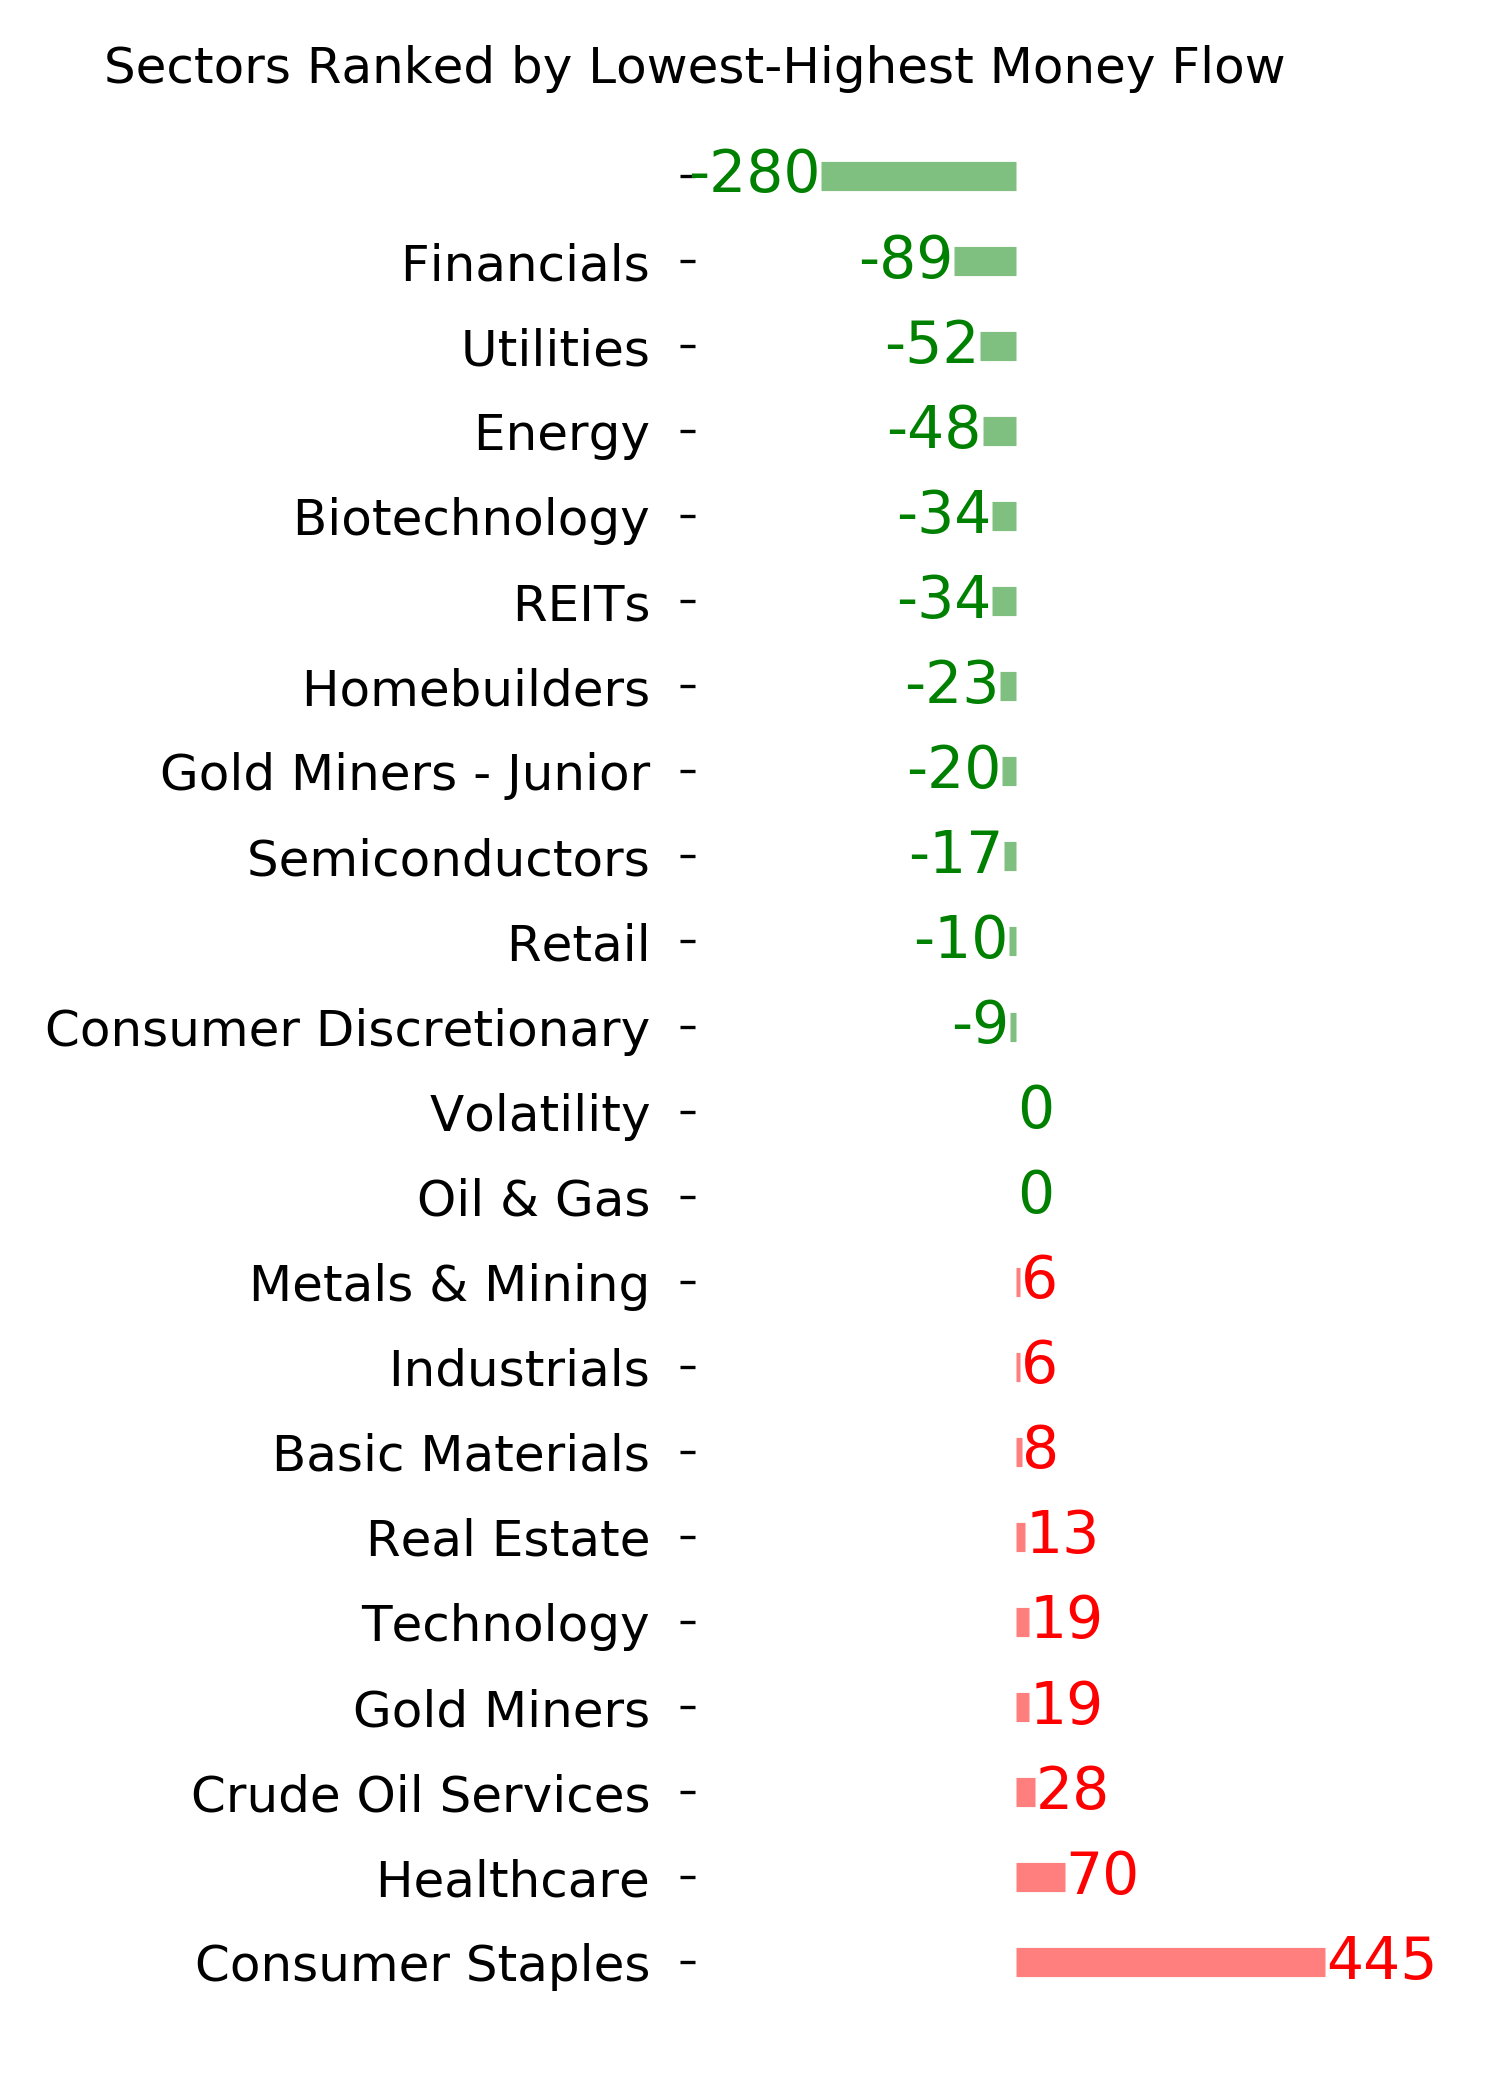
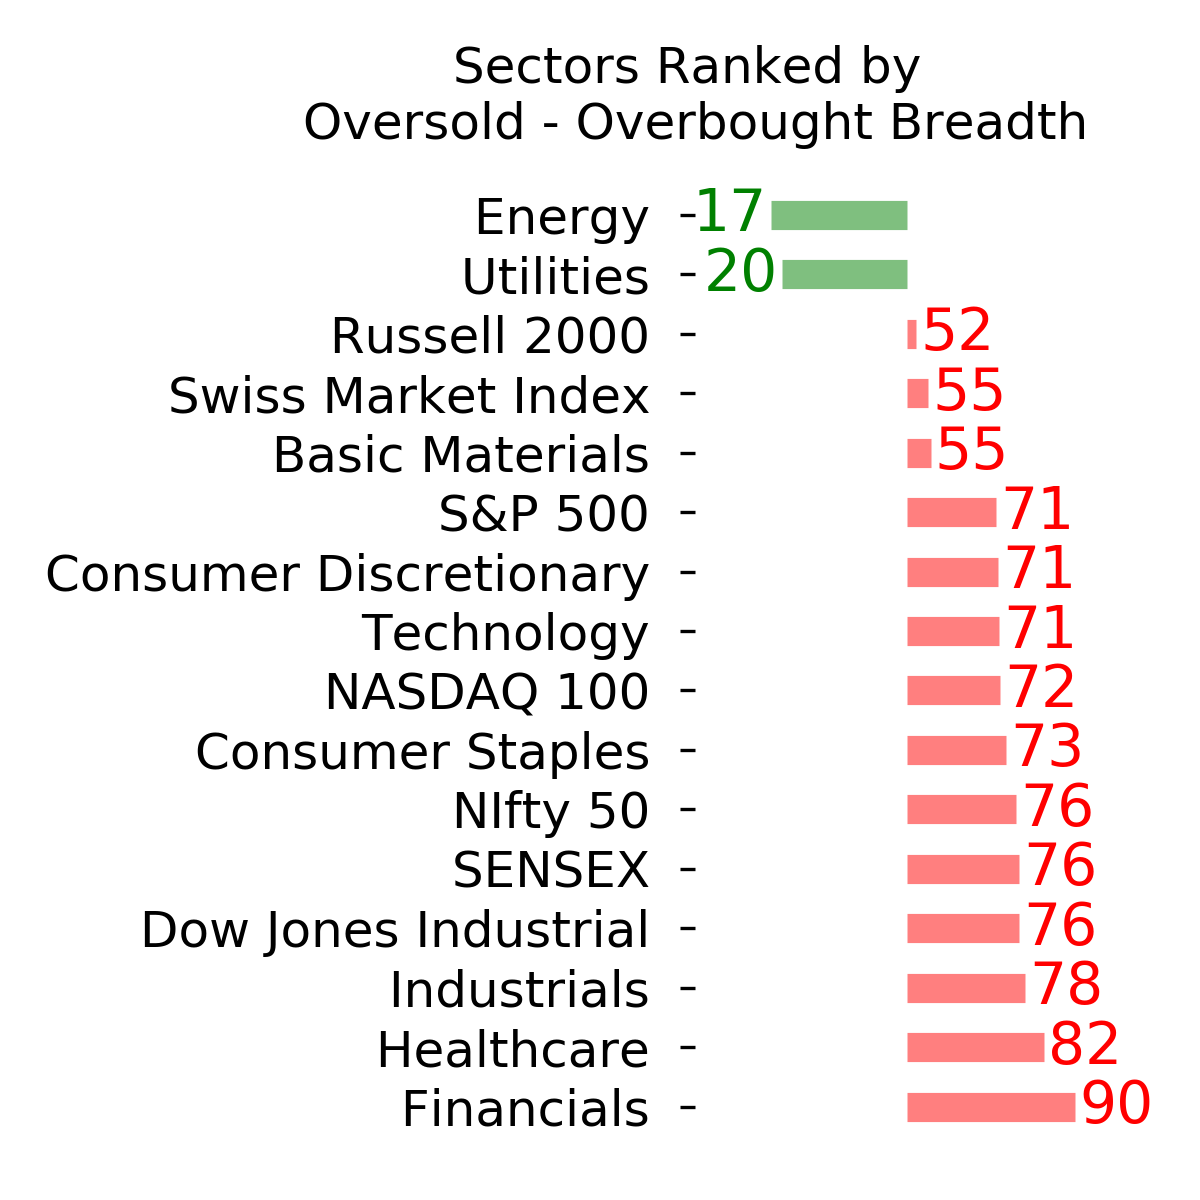
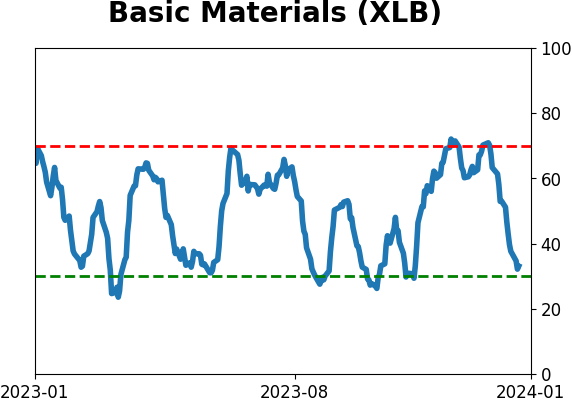
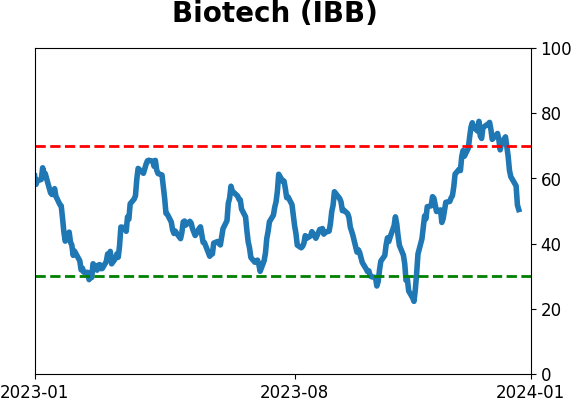
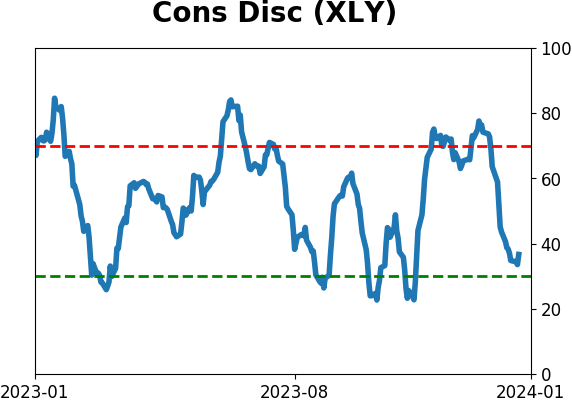
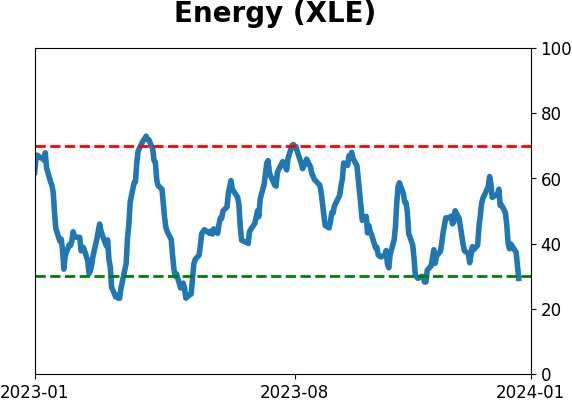
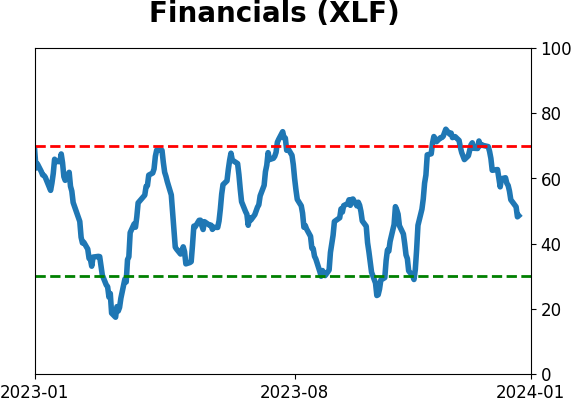
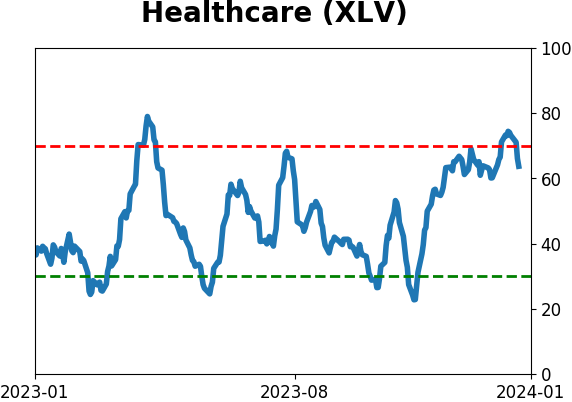
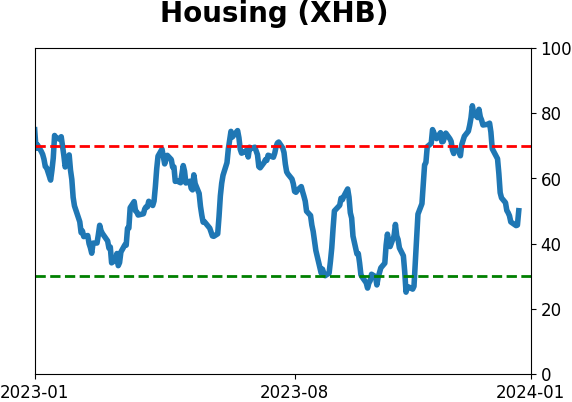
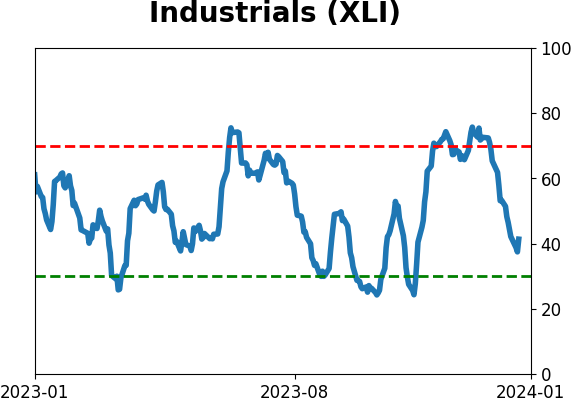
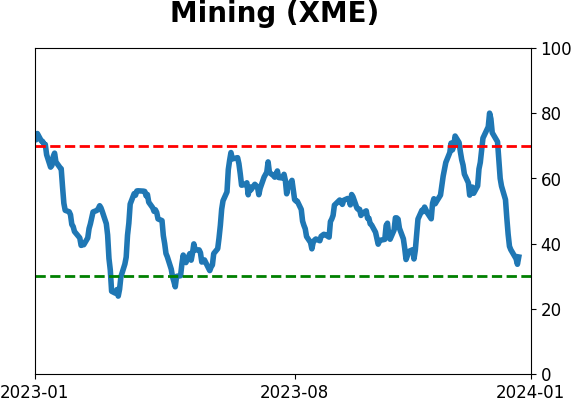
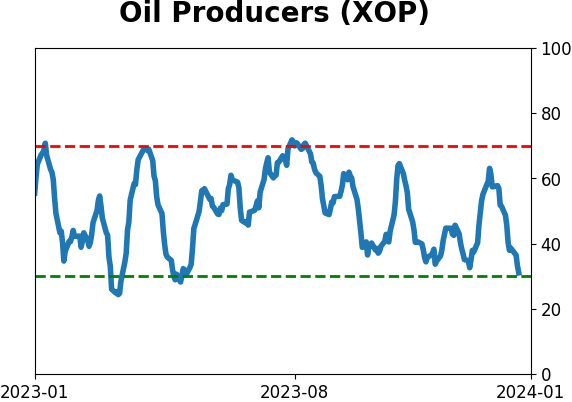
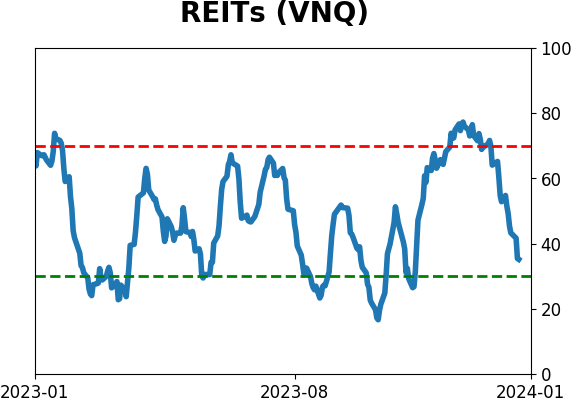
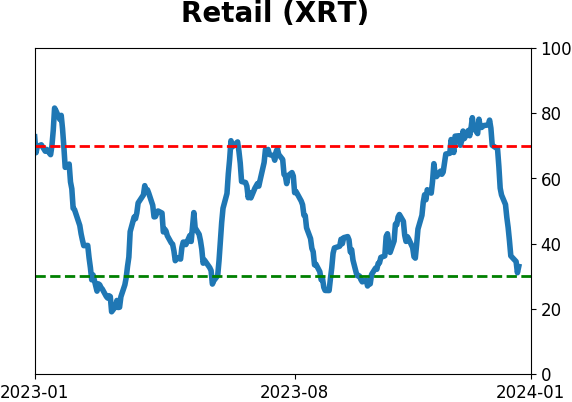
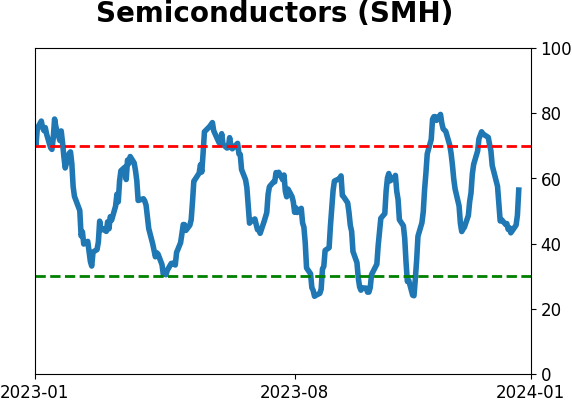
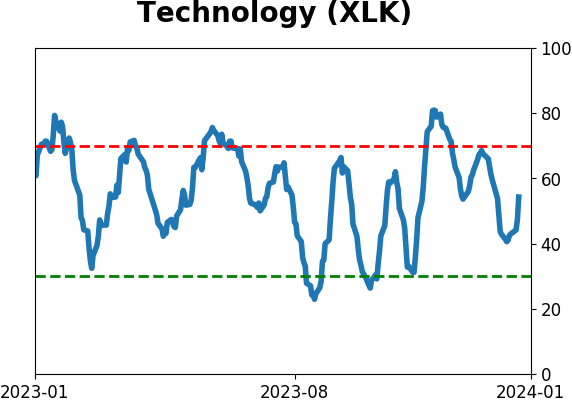
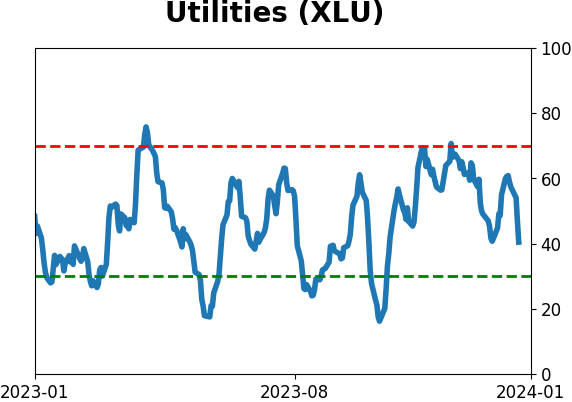
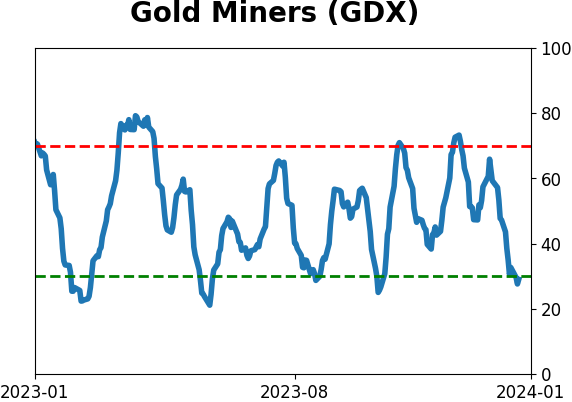
Sector ETF's - 10-Day Moving Average
|
|
|
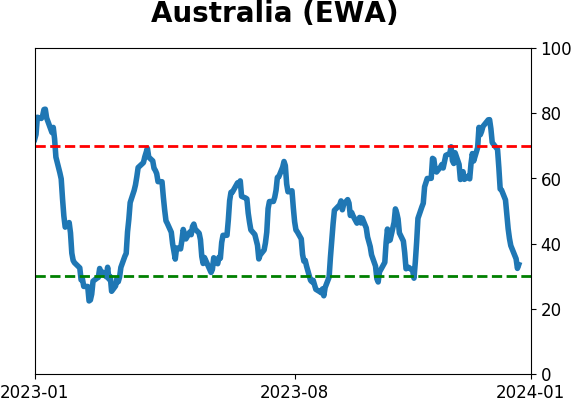
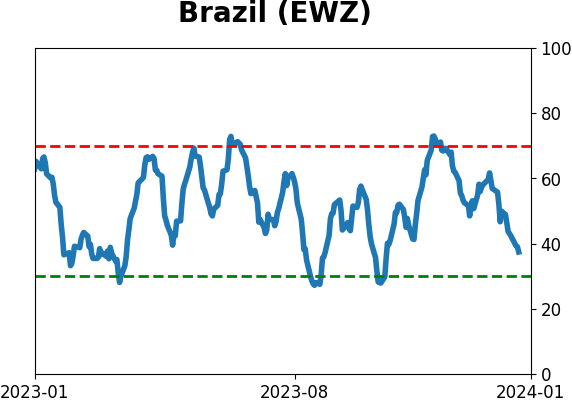
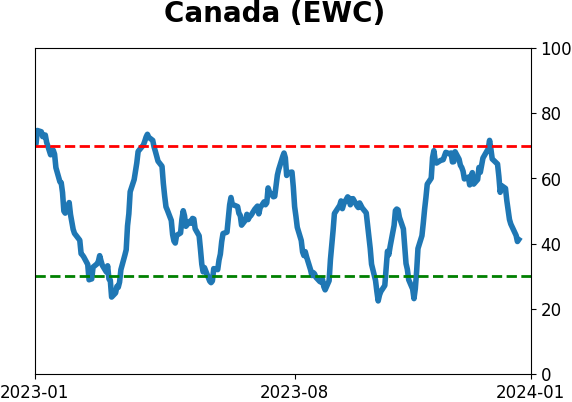
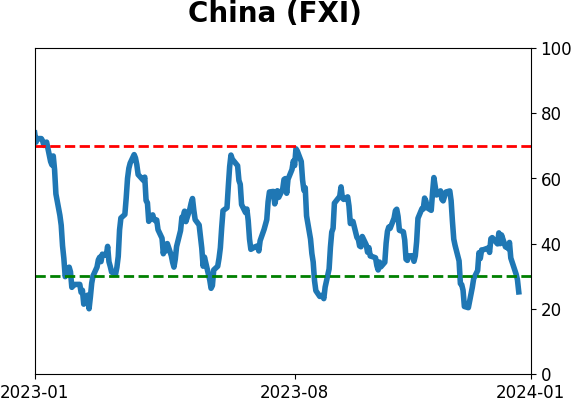
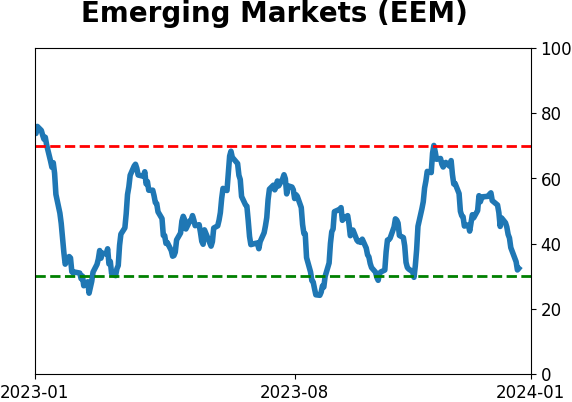
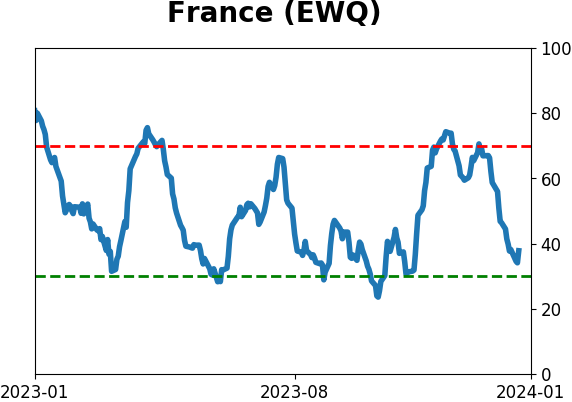
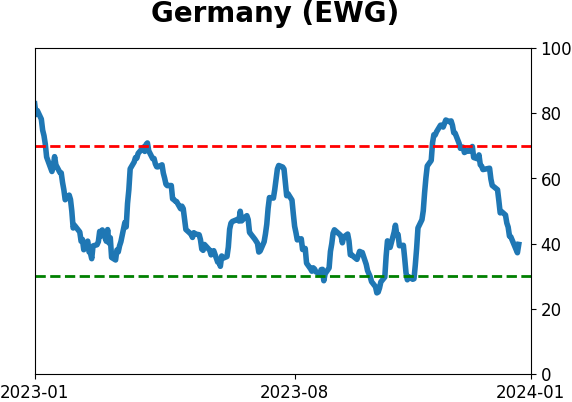
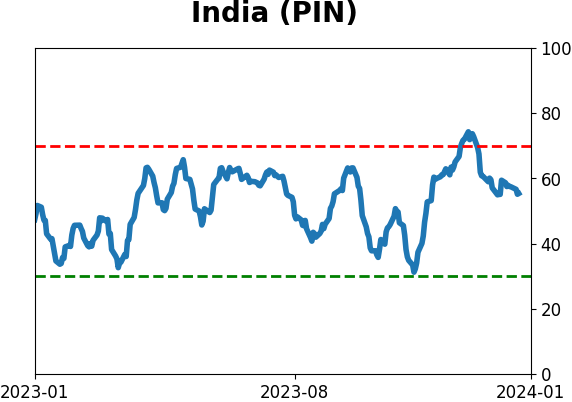
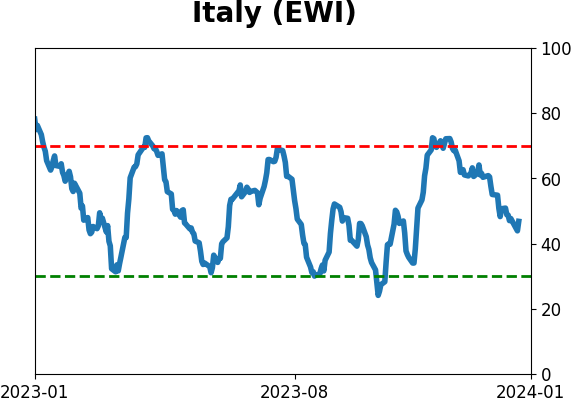
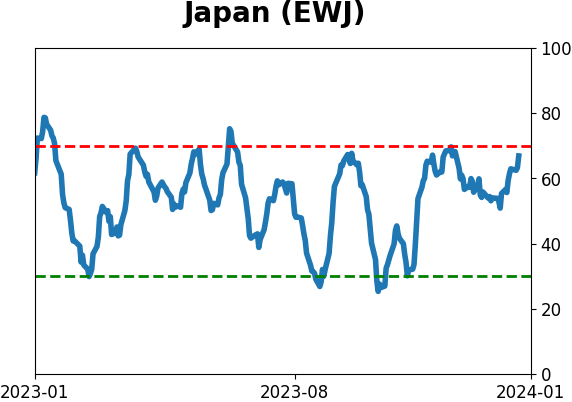
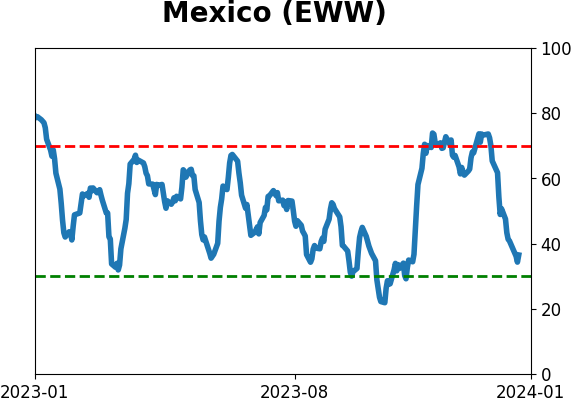
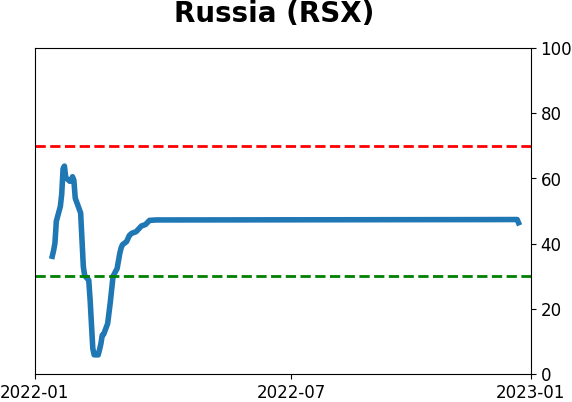
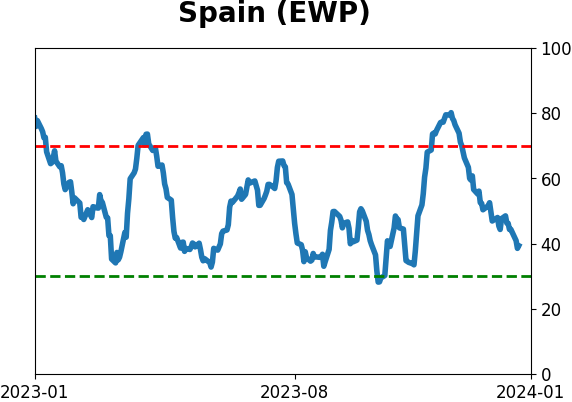
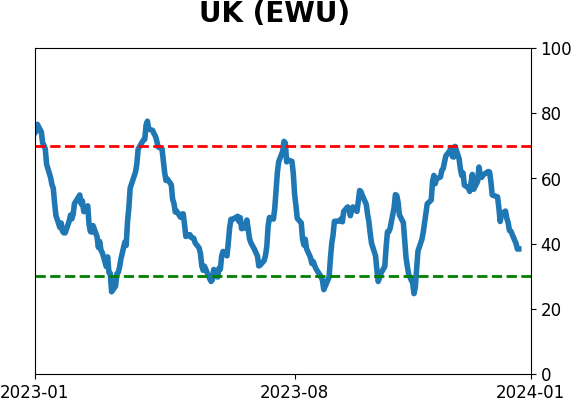
Country ETF's - 10-Day Moving Average
|
|
|
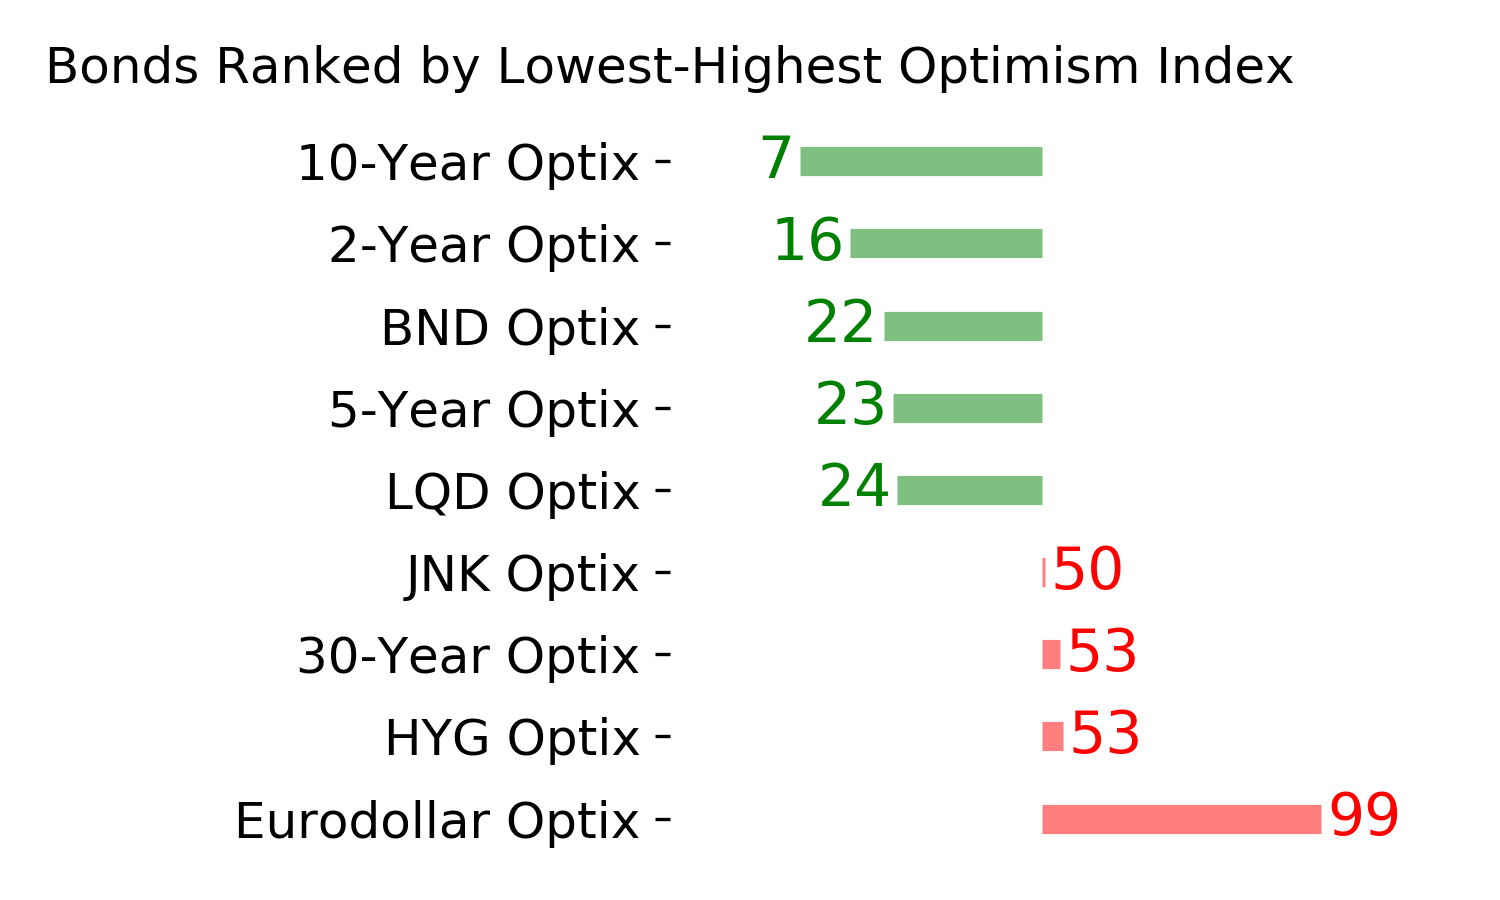
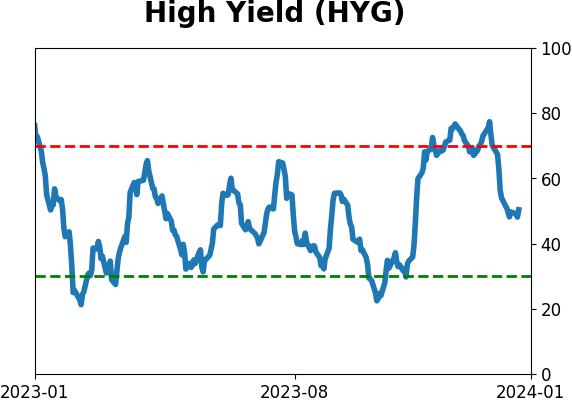
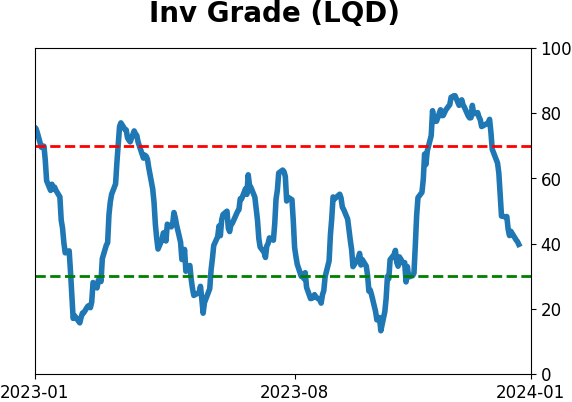
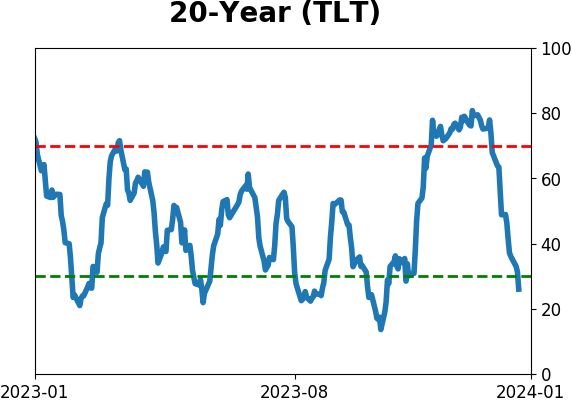
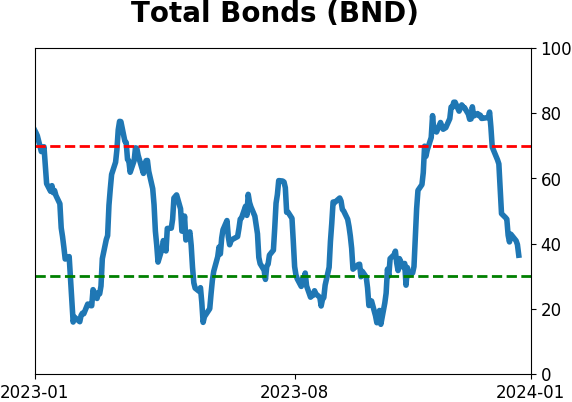
Bond ETF's - 10-Day Moving Average
|
|
|
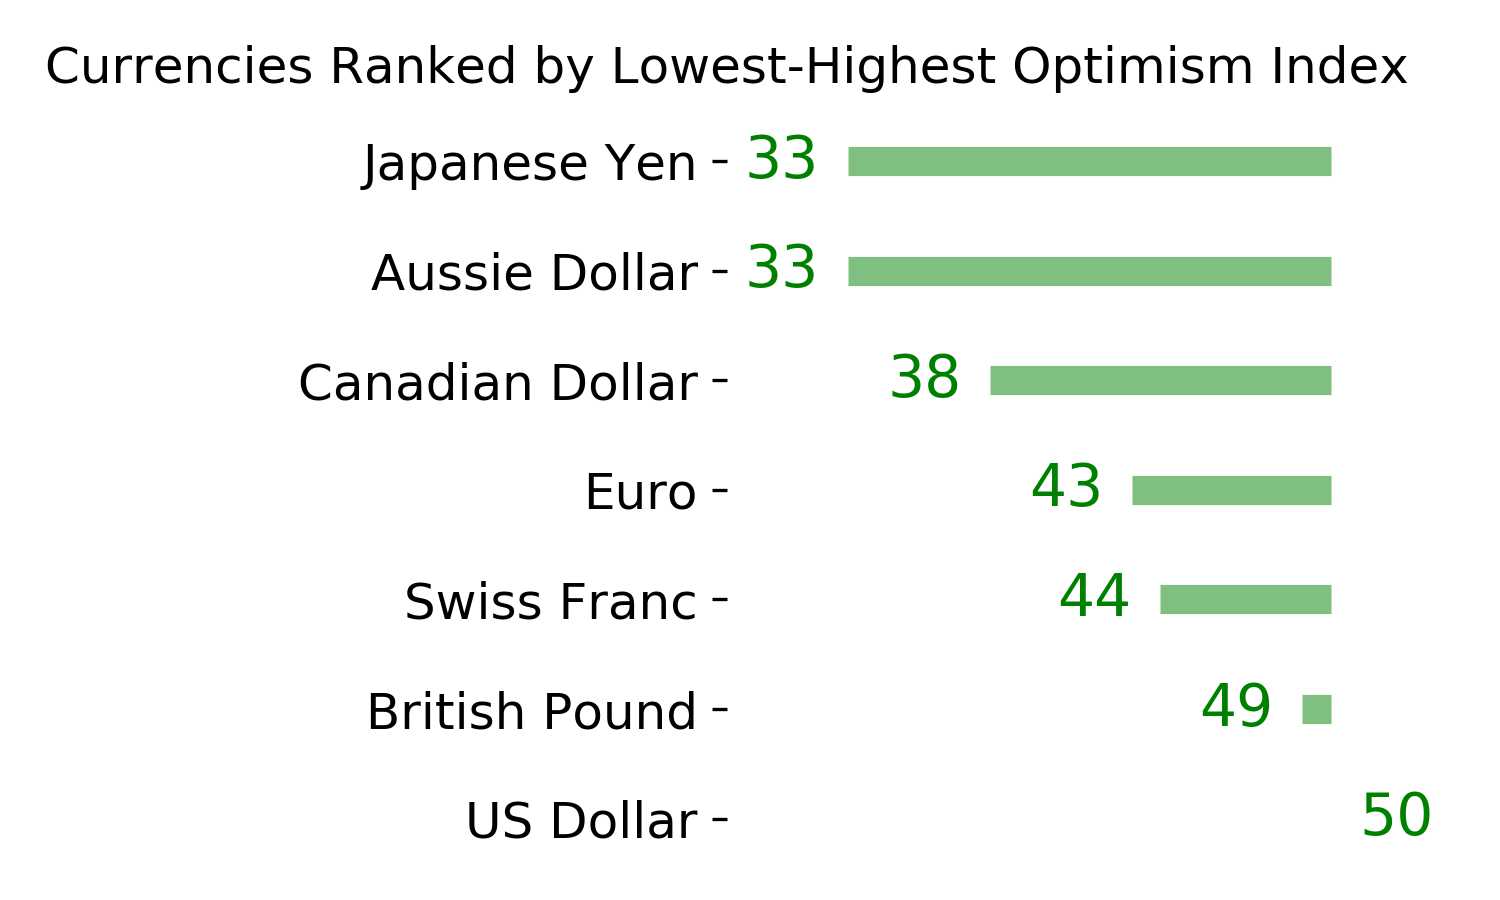
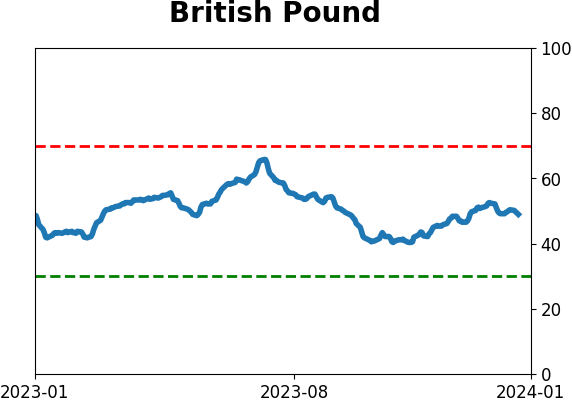
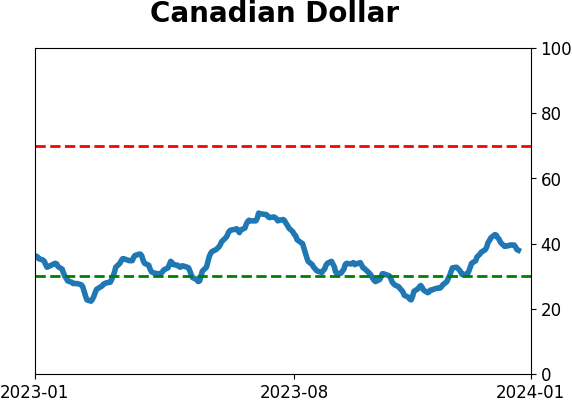
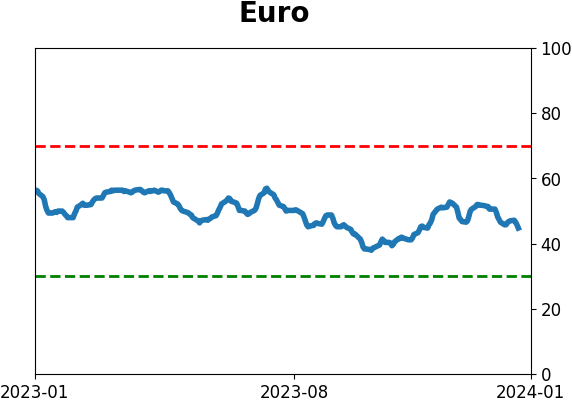
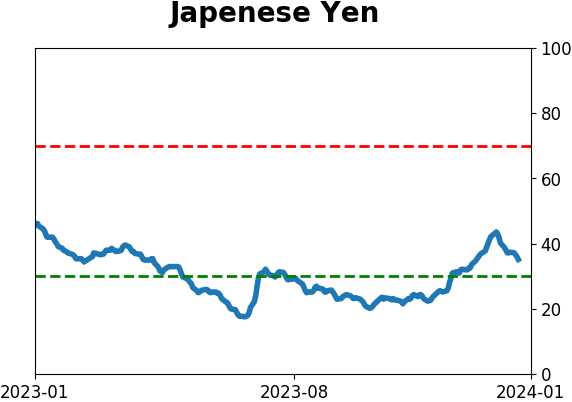
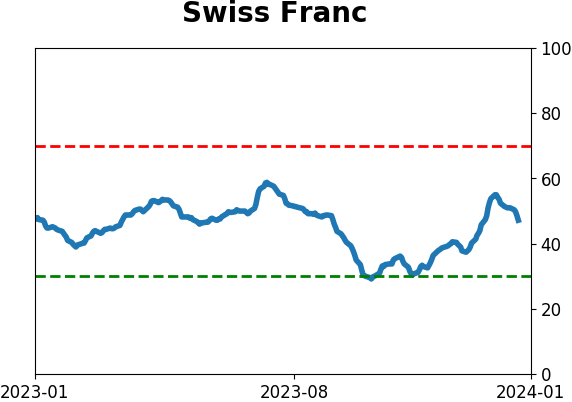
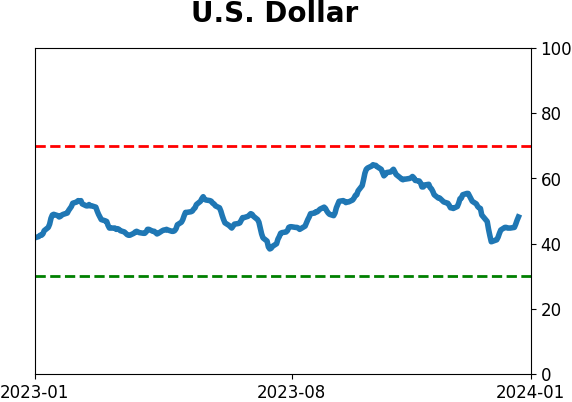
Currency ETF's - 5-Day Moving Average
|
|
|
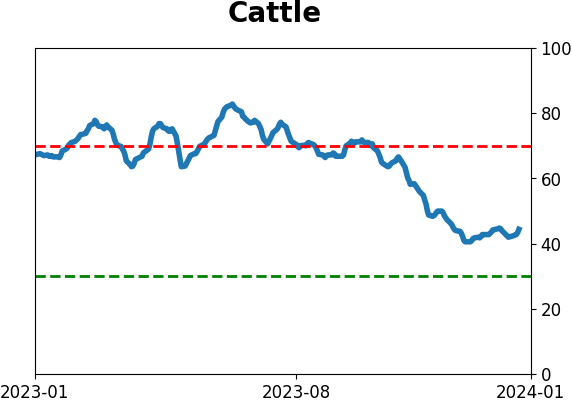
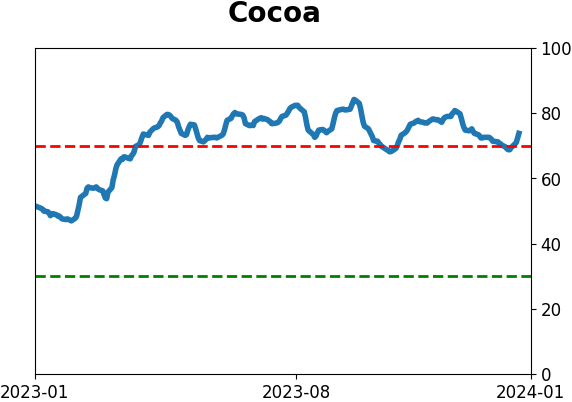
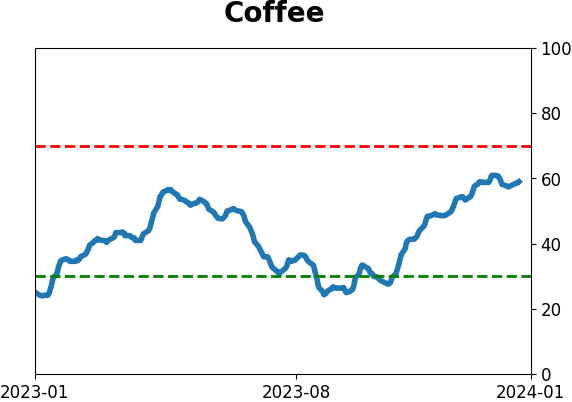
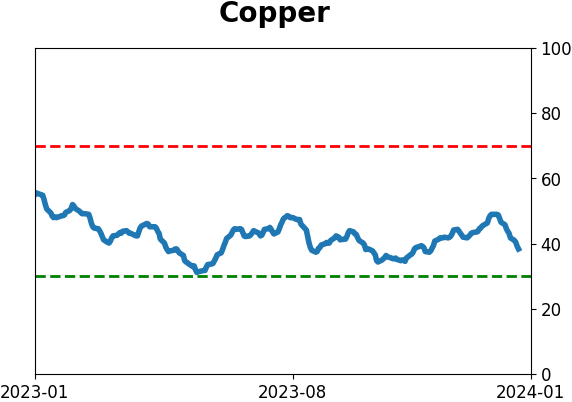
Commodity ETF's - 5-Day Moving Average
|
|