Headlines
|
|
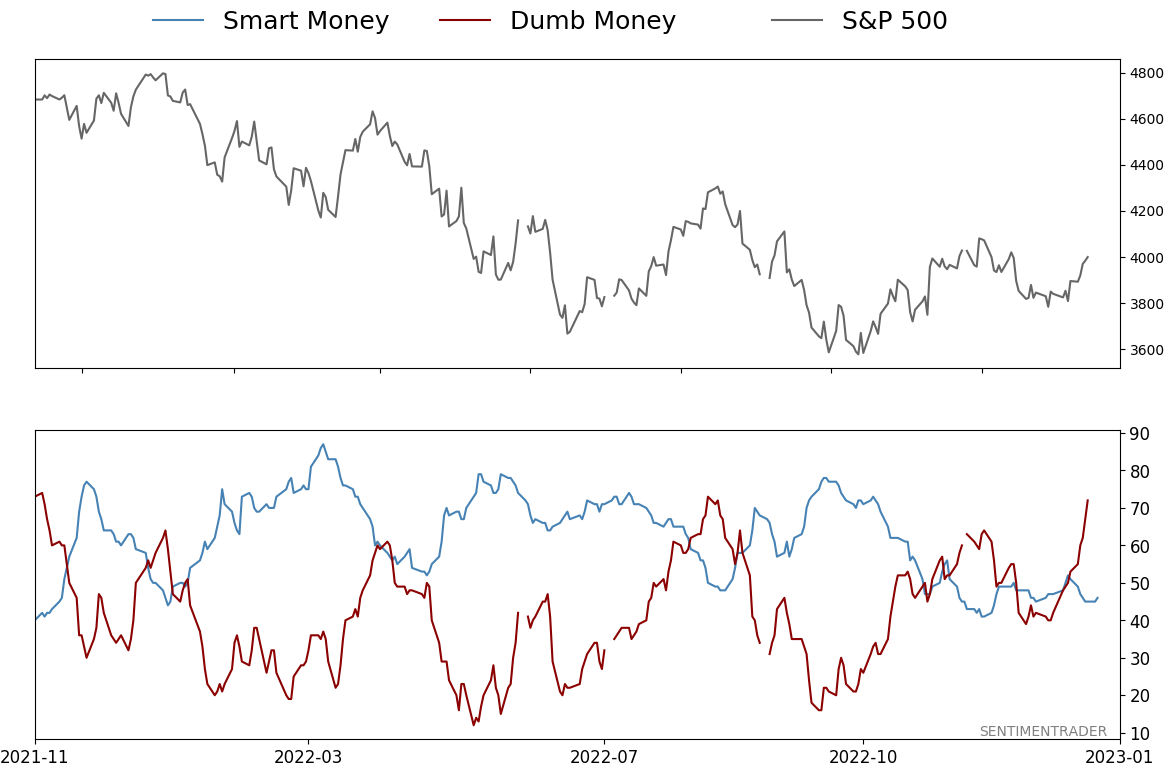
Dumb Money Confidence breaks out:
With a further recovery in stocks, Dumb Money Confidence reached its highest level since November 2021, surpassing its peak from last August. When Confidence breaks out to a one-year high, returns in the S&P 500 tended to be subdued. One difference this time, though, is that it's occurring after a significant decline.
|
Smart / Dumb Money Confidence
|
Smart Money Confidence: 46%
Dumb Money Confidence: 74%
|
|
Risk Levels
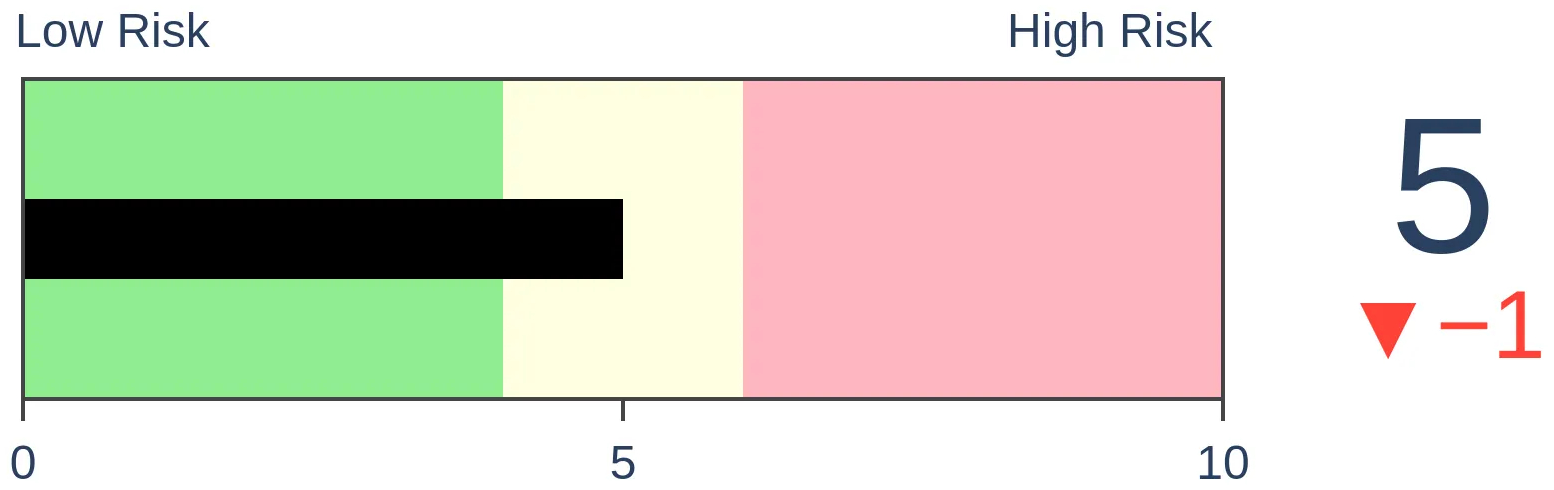
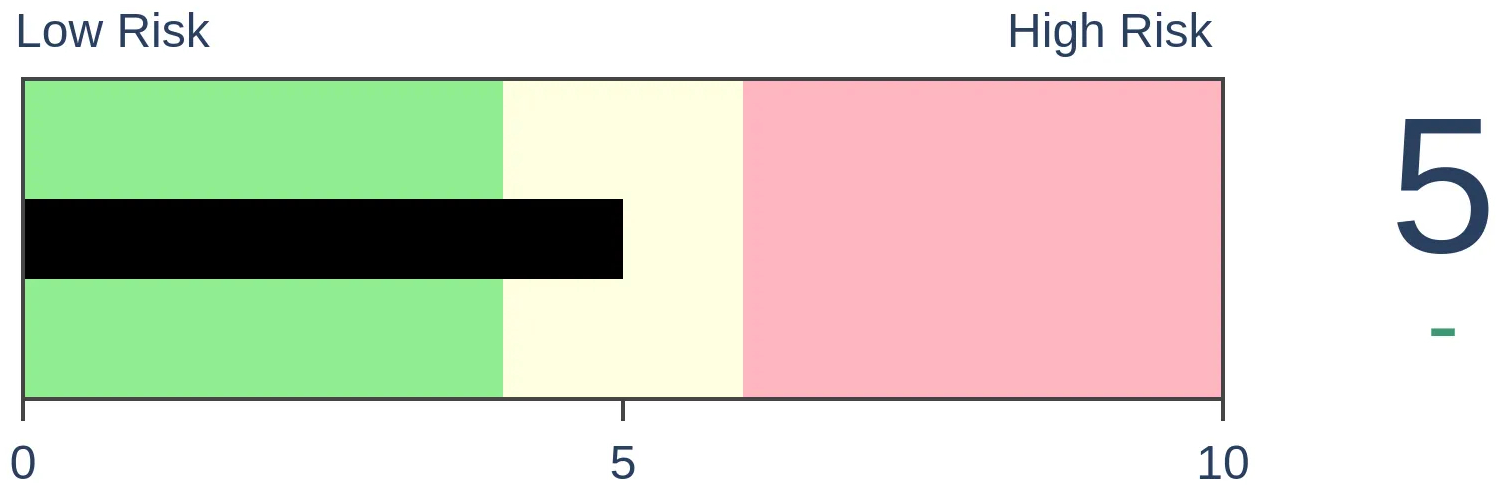
Stocks Short-Term
|
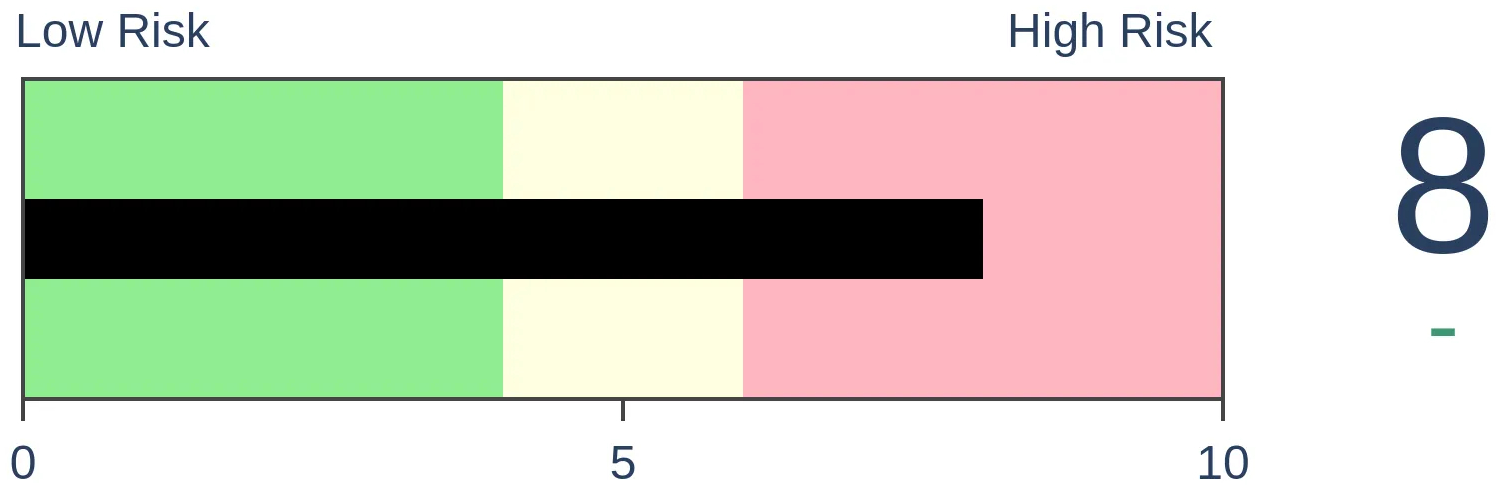
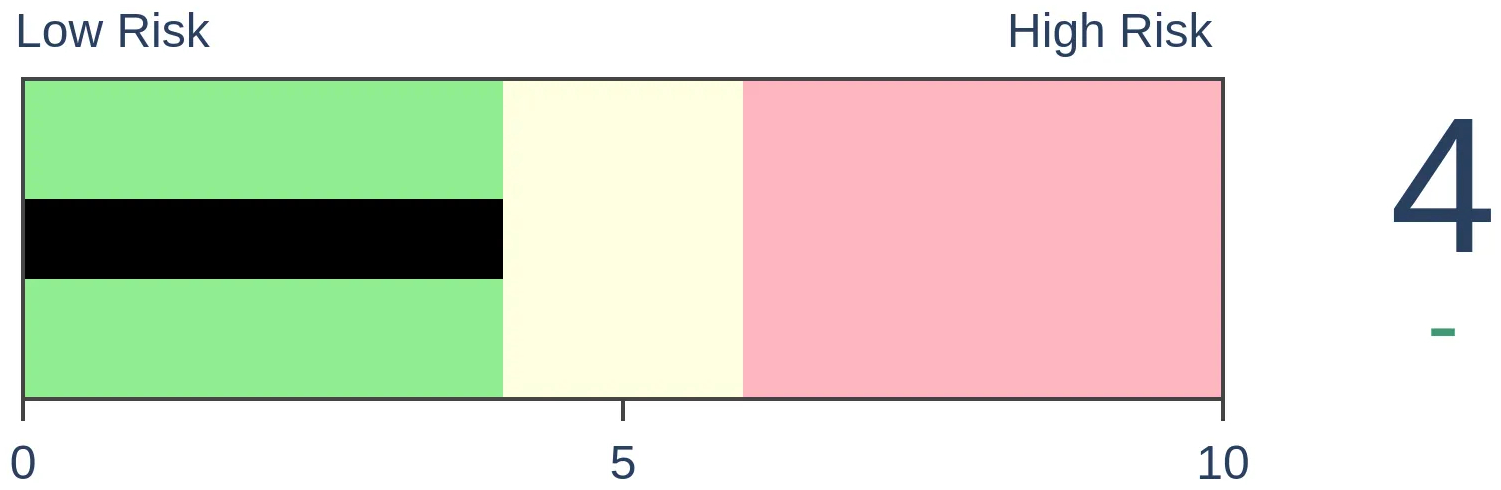
Stocks Medium-Term
|
|
Bonds
|
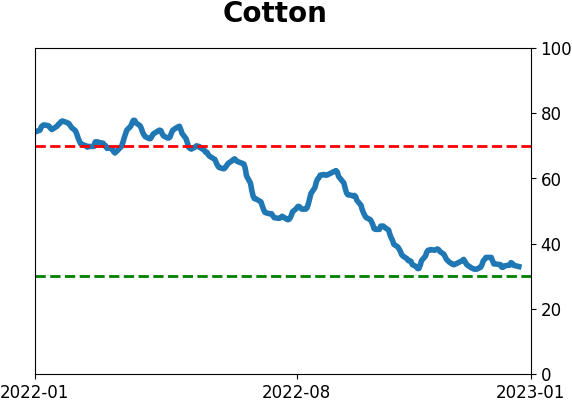
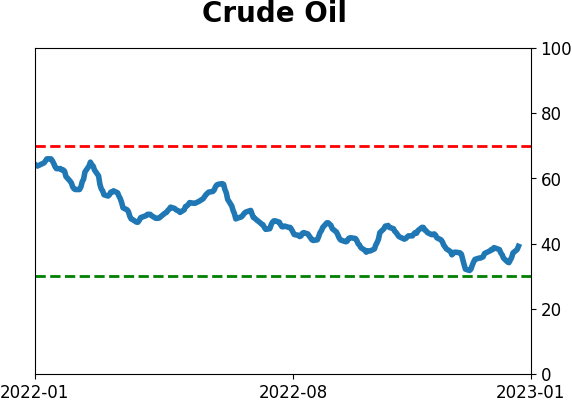
Crude Oil

|
|
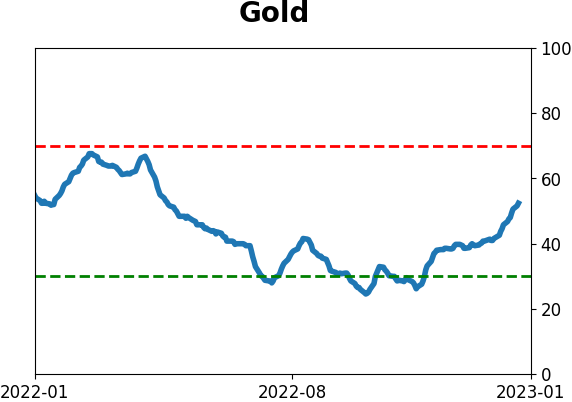
Gold
|
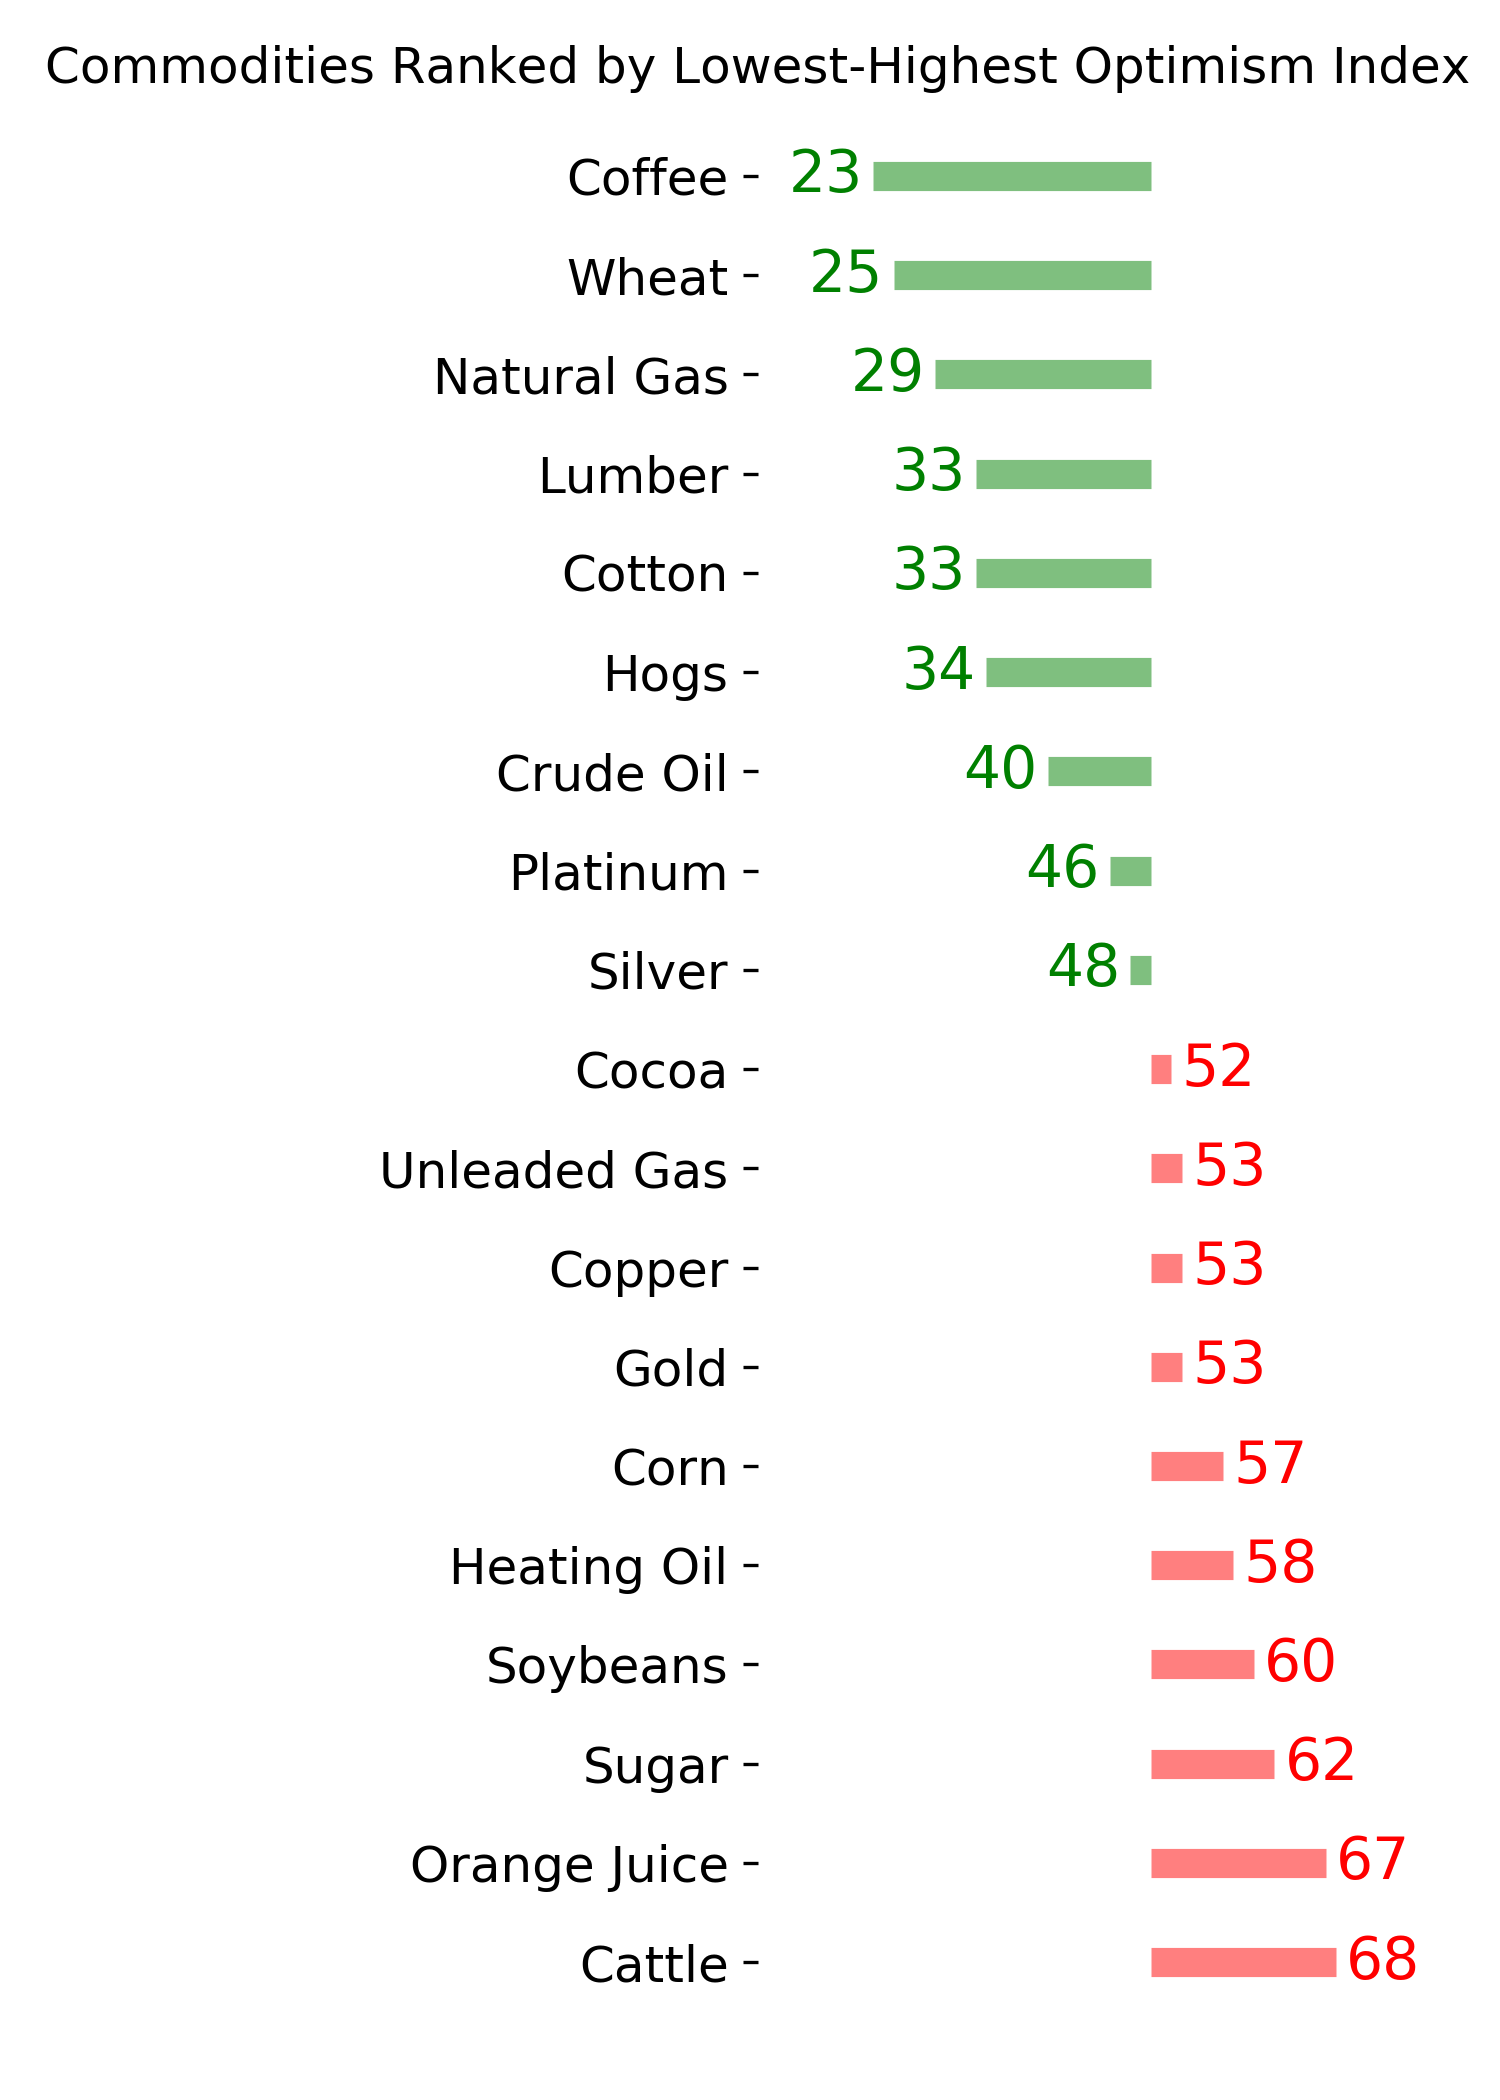
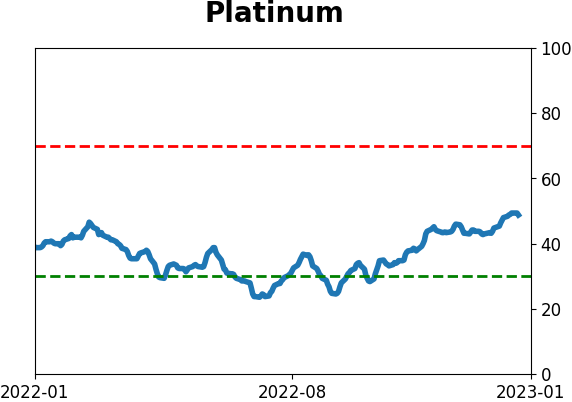
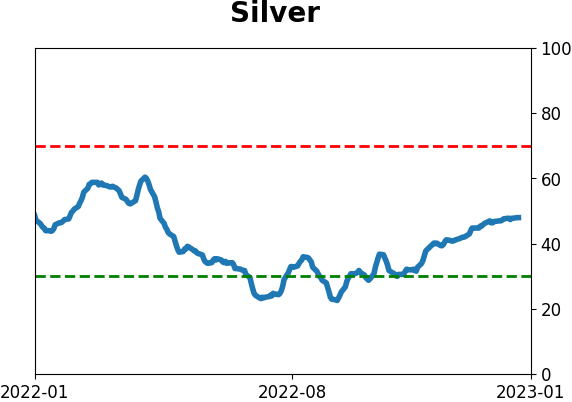
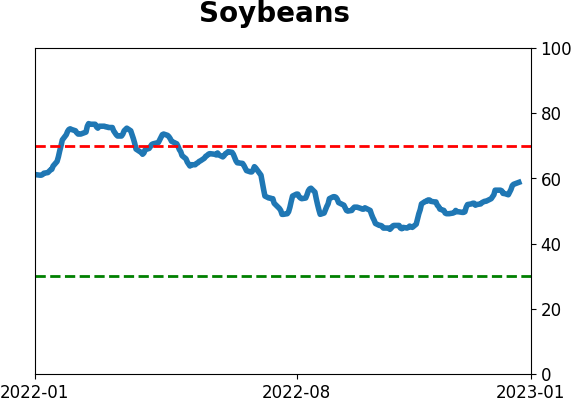
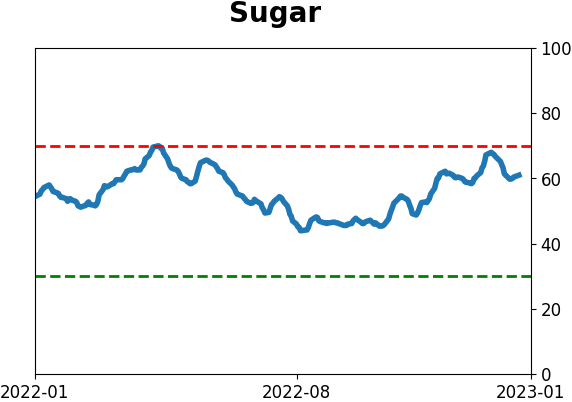
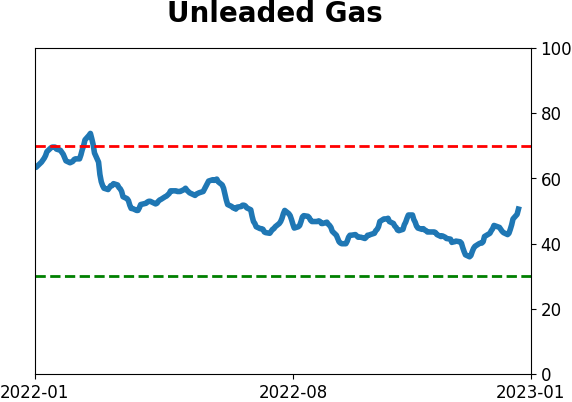
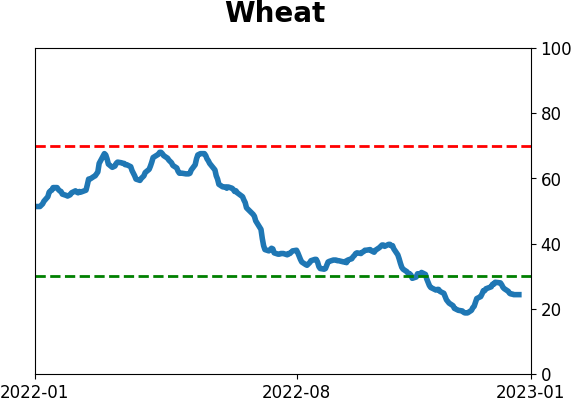
Agriculture

|
|
Research
By Jason Goepfert
BOTTOM LINE
With a further recovery in stocks, Dumb Money Confidence reached its highest level since November 2021, surpassing its peak from last August. When Confidence breaks out to a one-year high, returns in the S&P 500 tended to be subdued. One difference this time, though, is that it's occurring after a significant decline.
FORECAST / TIMEFRAME
None
|
Key points:
- Dumb Money Confidence has reached its highest level since November 2021
- A high level of Confidence in bear markets is often a warning sign, ala last August
- When Confidence recovered strongly after a prolonged downtrend, though, stock returns were consistently positive
Dumb Money Confidence breaks out to a new high
After a promising start following a miserable year, investors are feeling much better. While some metrics disagree, the indicators that constitute Dumb Money Confidence have recovered enough to exceed the peak from last August. Trend-following investors are now the most optimistic they've been in over a year.
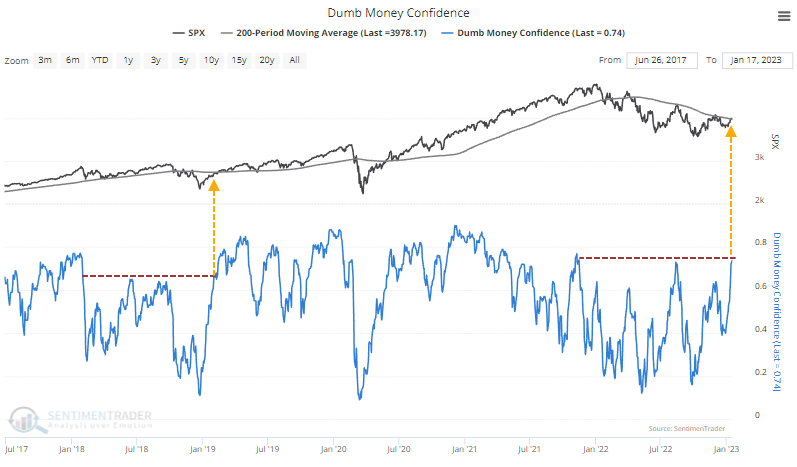
During a bear market, high levels of Confidence are not a good thing. We saw that spectacularly in August. Almost immediately after Dumb Money Confidence exceeded 70%, stocks plunged.
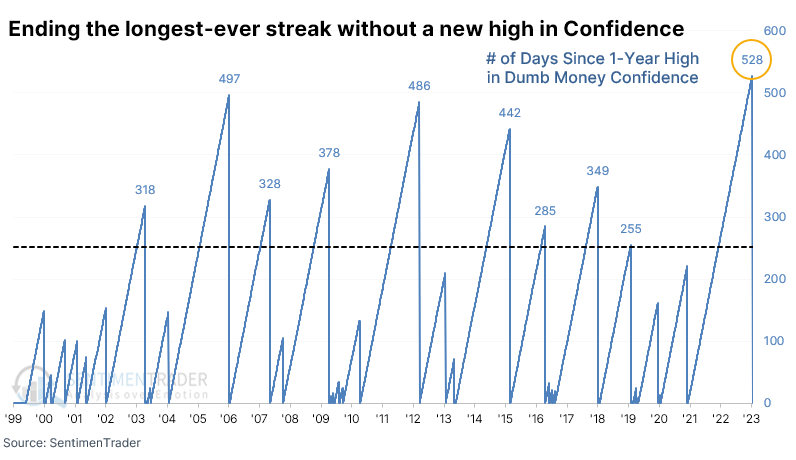
This ended the longest-ever streak without a one-year high in Dumb Money Confidence.
Historically, a breakout to a fresh one-year high in Confidence has preceded mixed results for the S&P 500. Between one and three months later, the index gyrated between positive and negative returns. Longer-term returns were mostly positive simply because that's the base case.
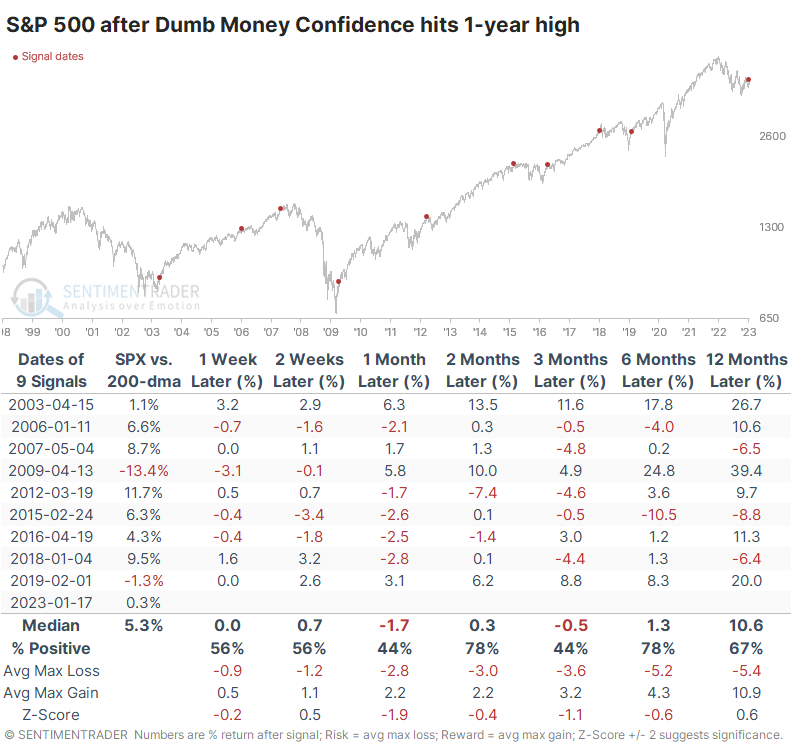
However, if you look more closely at the "SPX vs. 200-dma" column, something should stick out. The most negative returns tended to occur when Confidence became very high and stocks were already doing well. Every time the S&P suffered a loss over the next three months, it had been more than 5% above its 200-day moving average.
Stock and sector returns after periods of struggle
The table below filters the signals to only include those breakouts in Confidence that triggered when the S&P was less than 5% above its 200-day average. There were still some shorter-term losses in the signals, and relying too heavily on a sample size of four is tough. But over 25 years of history, these are the instances that are most similar to our current scenario.
From 3-12 months later, the S&P showed gains every time, with an abnormally positive ratio of risk to reward. The index didn't decline more than 5% at any point within the next year after any of the four signals, and it gained at least 14% after each of them.
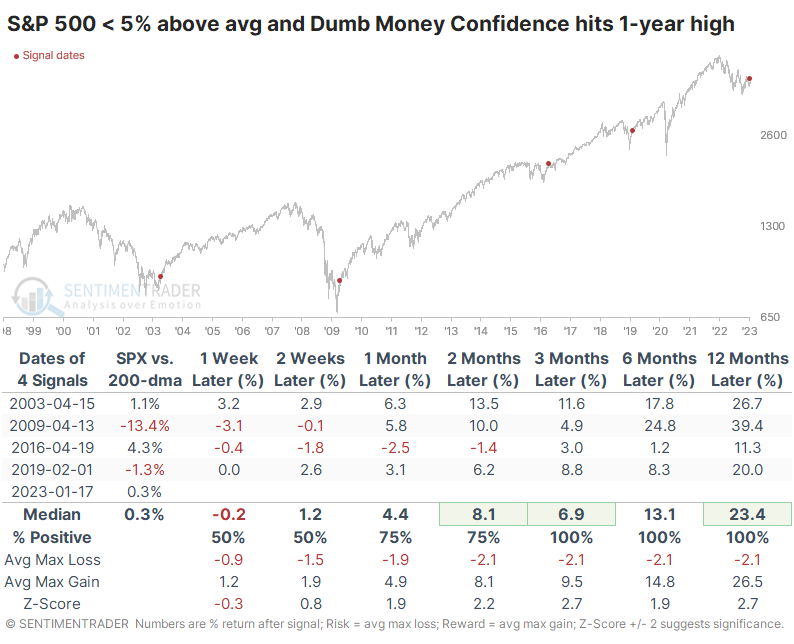
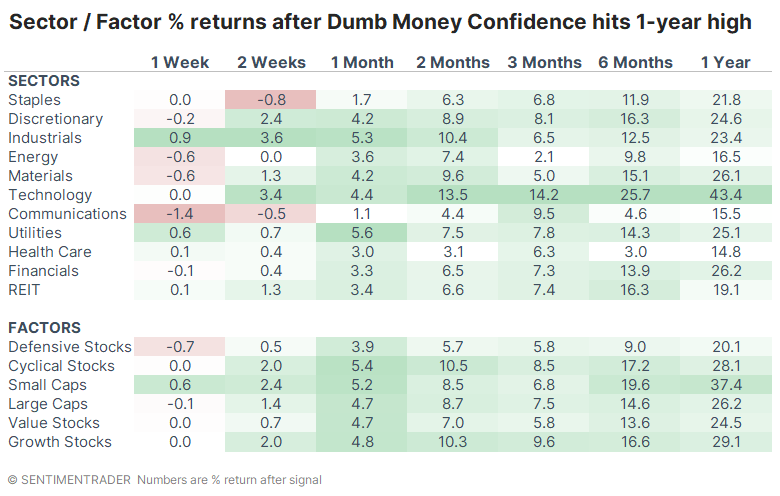
If the current environment looks anything like those signals, then Technology, Discretionary, Industrials, and Small-caps have featured the best returns. Of course, one can argue against this because of Federal Reserve policy now vs. then, but people who make that argument tend to believe the Fed is all-knowing, all-seeing, and all-doing, so nothing else matters, anyway.
What the research tells us...
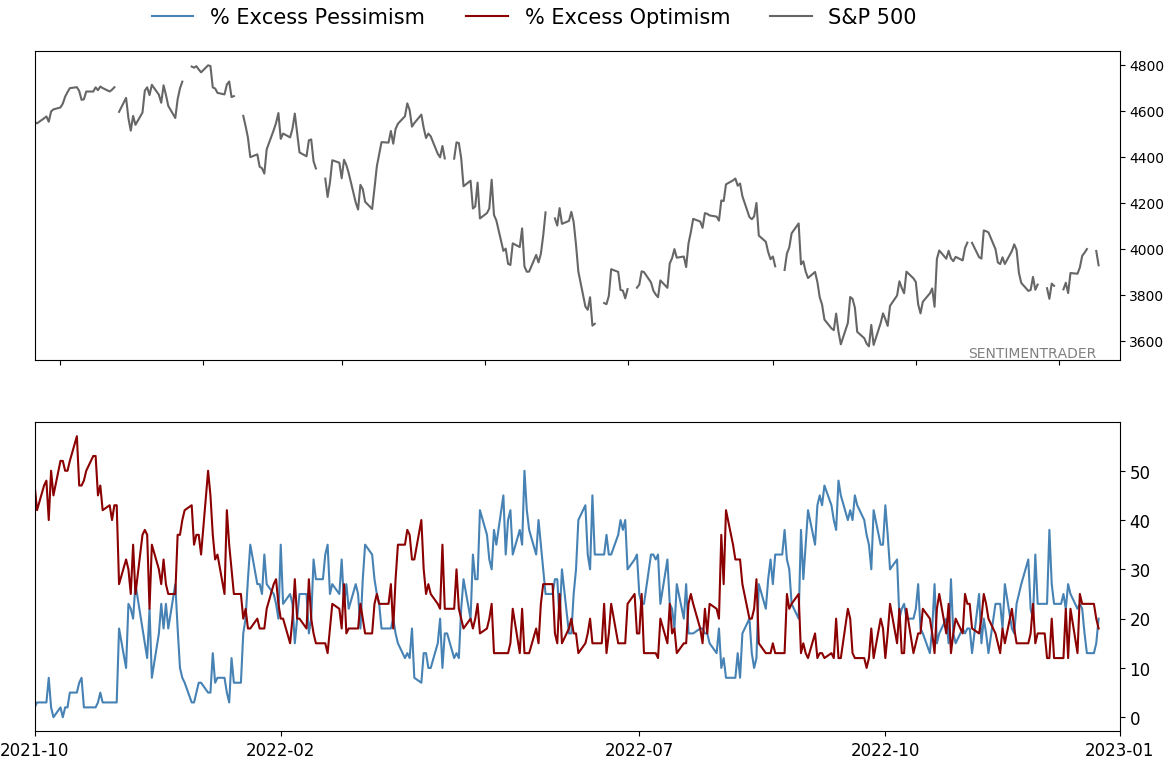
When a confluence of sentiment measures become optimistic during bear markets, it's typically wise to become cautious. That was certainly the case last August when we had a similar setup. Unlike then, various models disagree about the extent of optimism, and over the past couple of weeks, there has been a much more robust round of internal momentum. Combined with the idea that stocks have done quite well when Confidence breaks out after a prolonged period of decline, these arguments suggest that the medium- to long-term outlook remains quite positive.
Indicators at Extremes
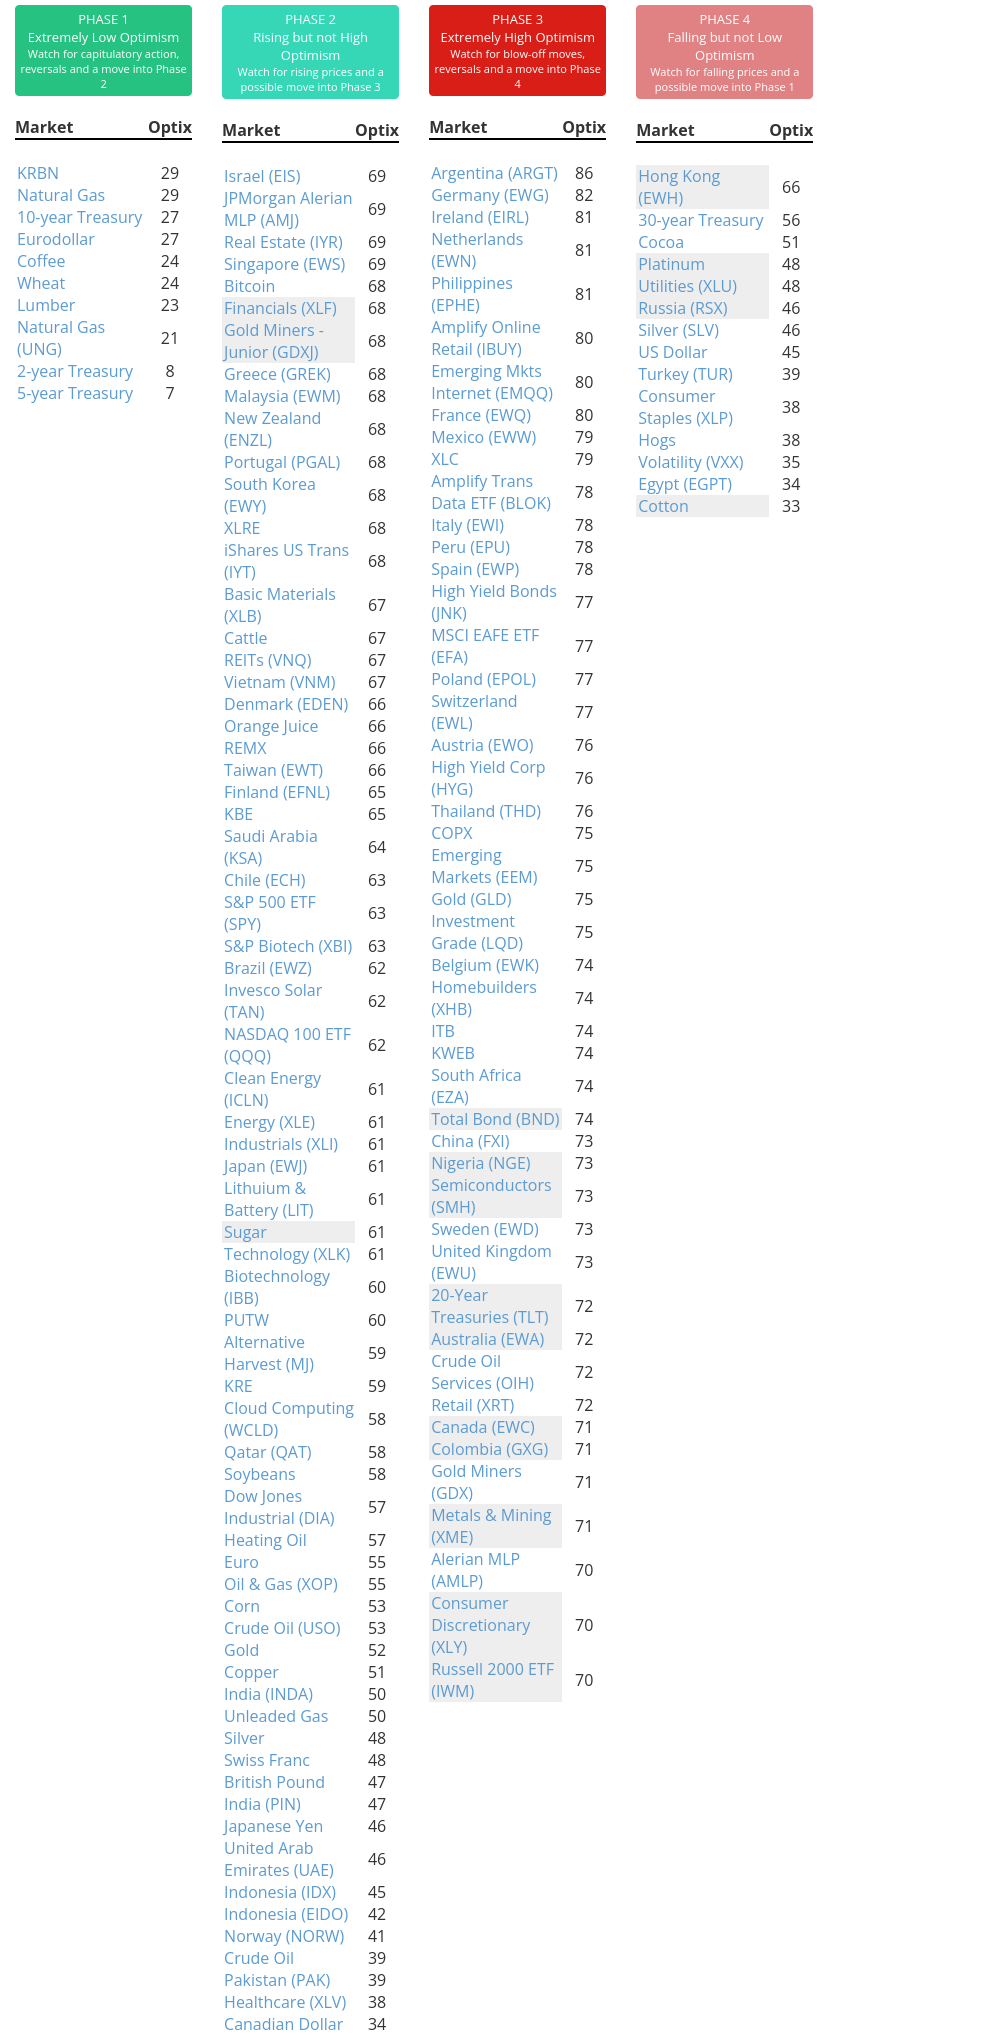
Phase Table
Ranks
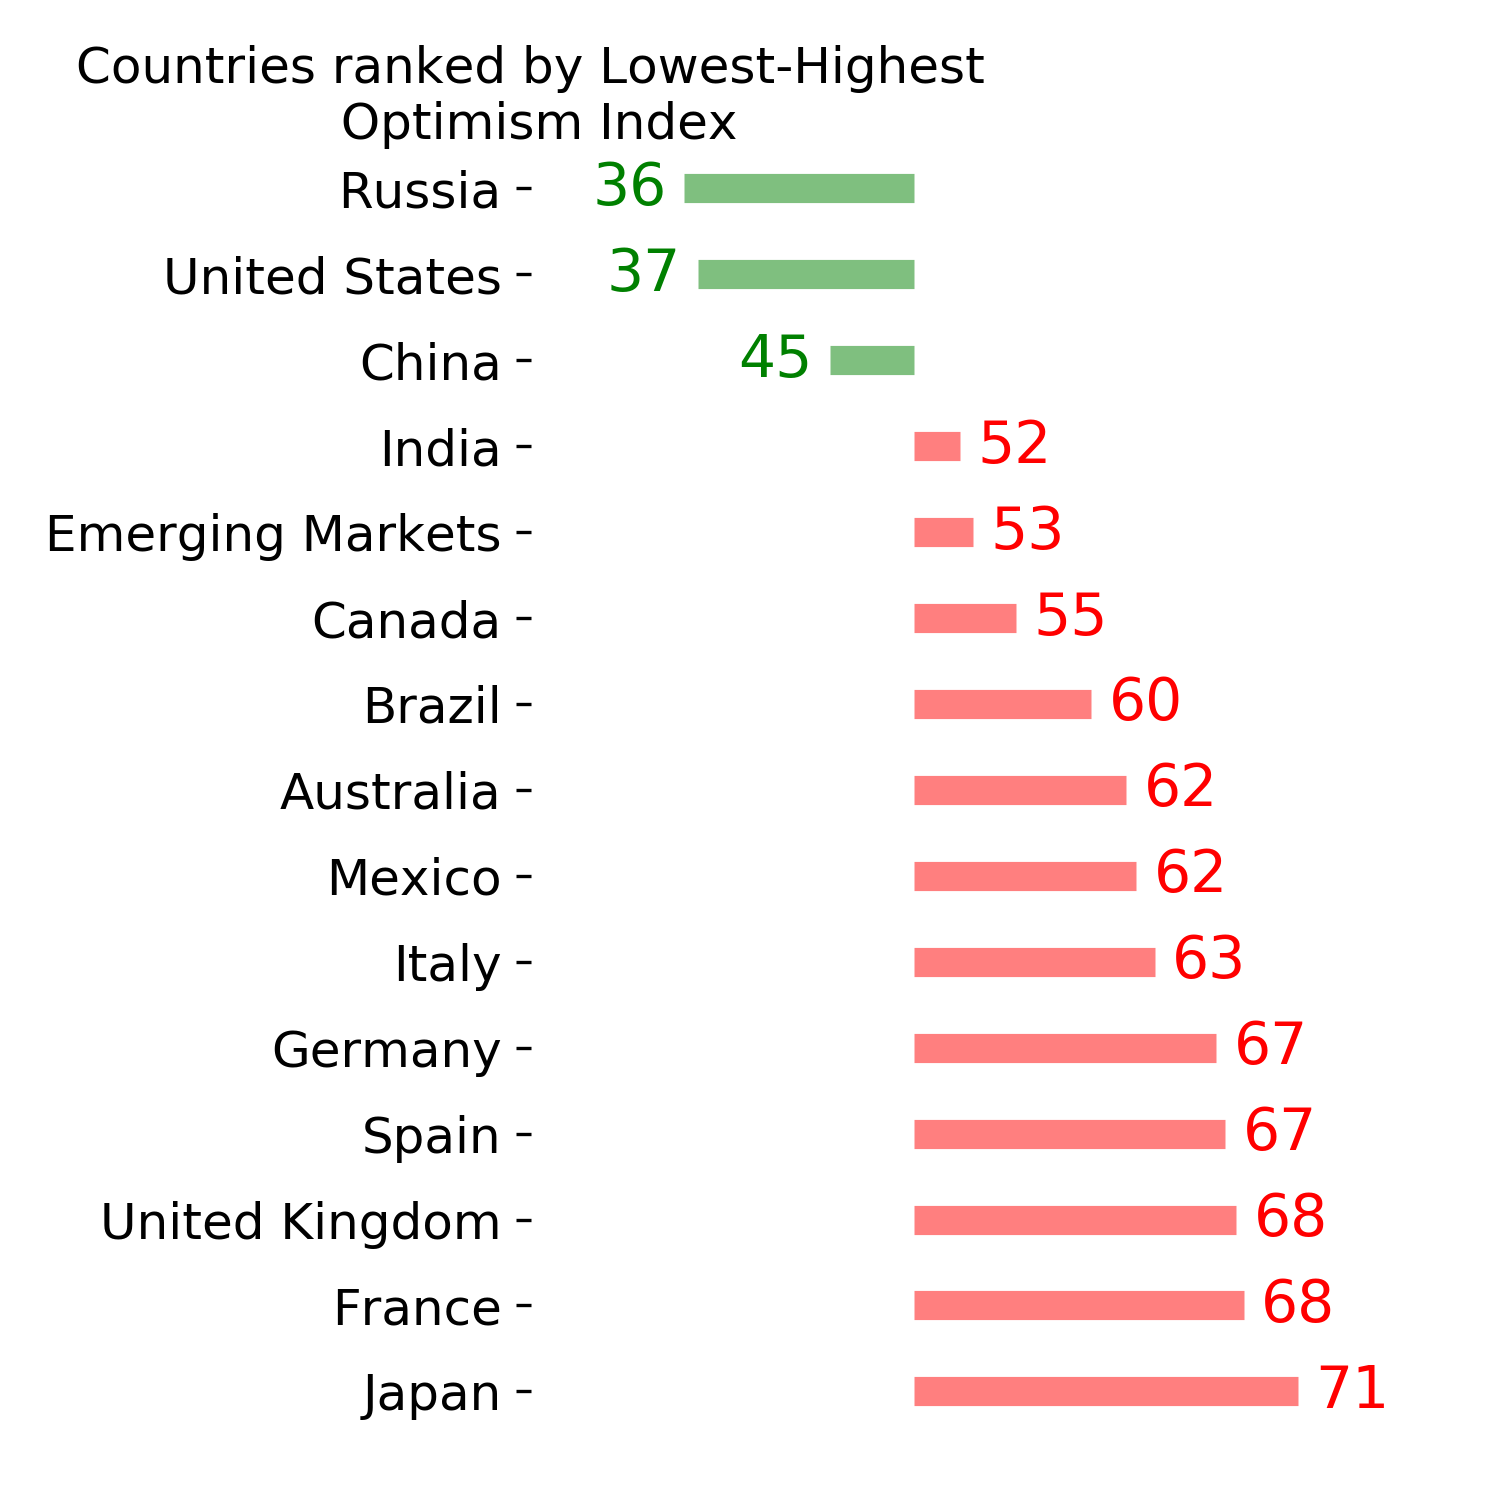
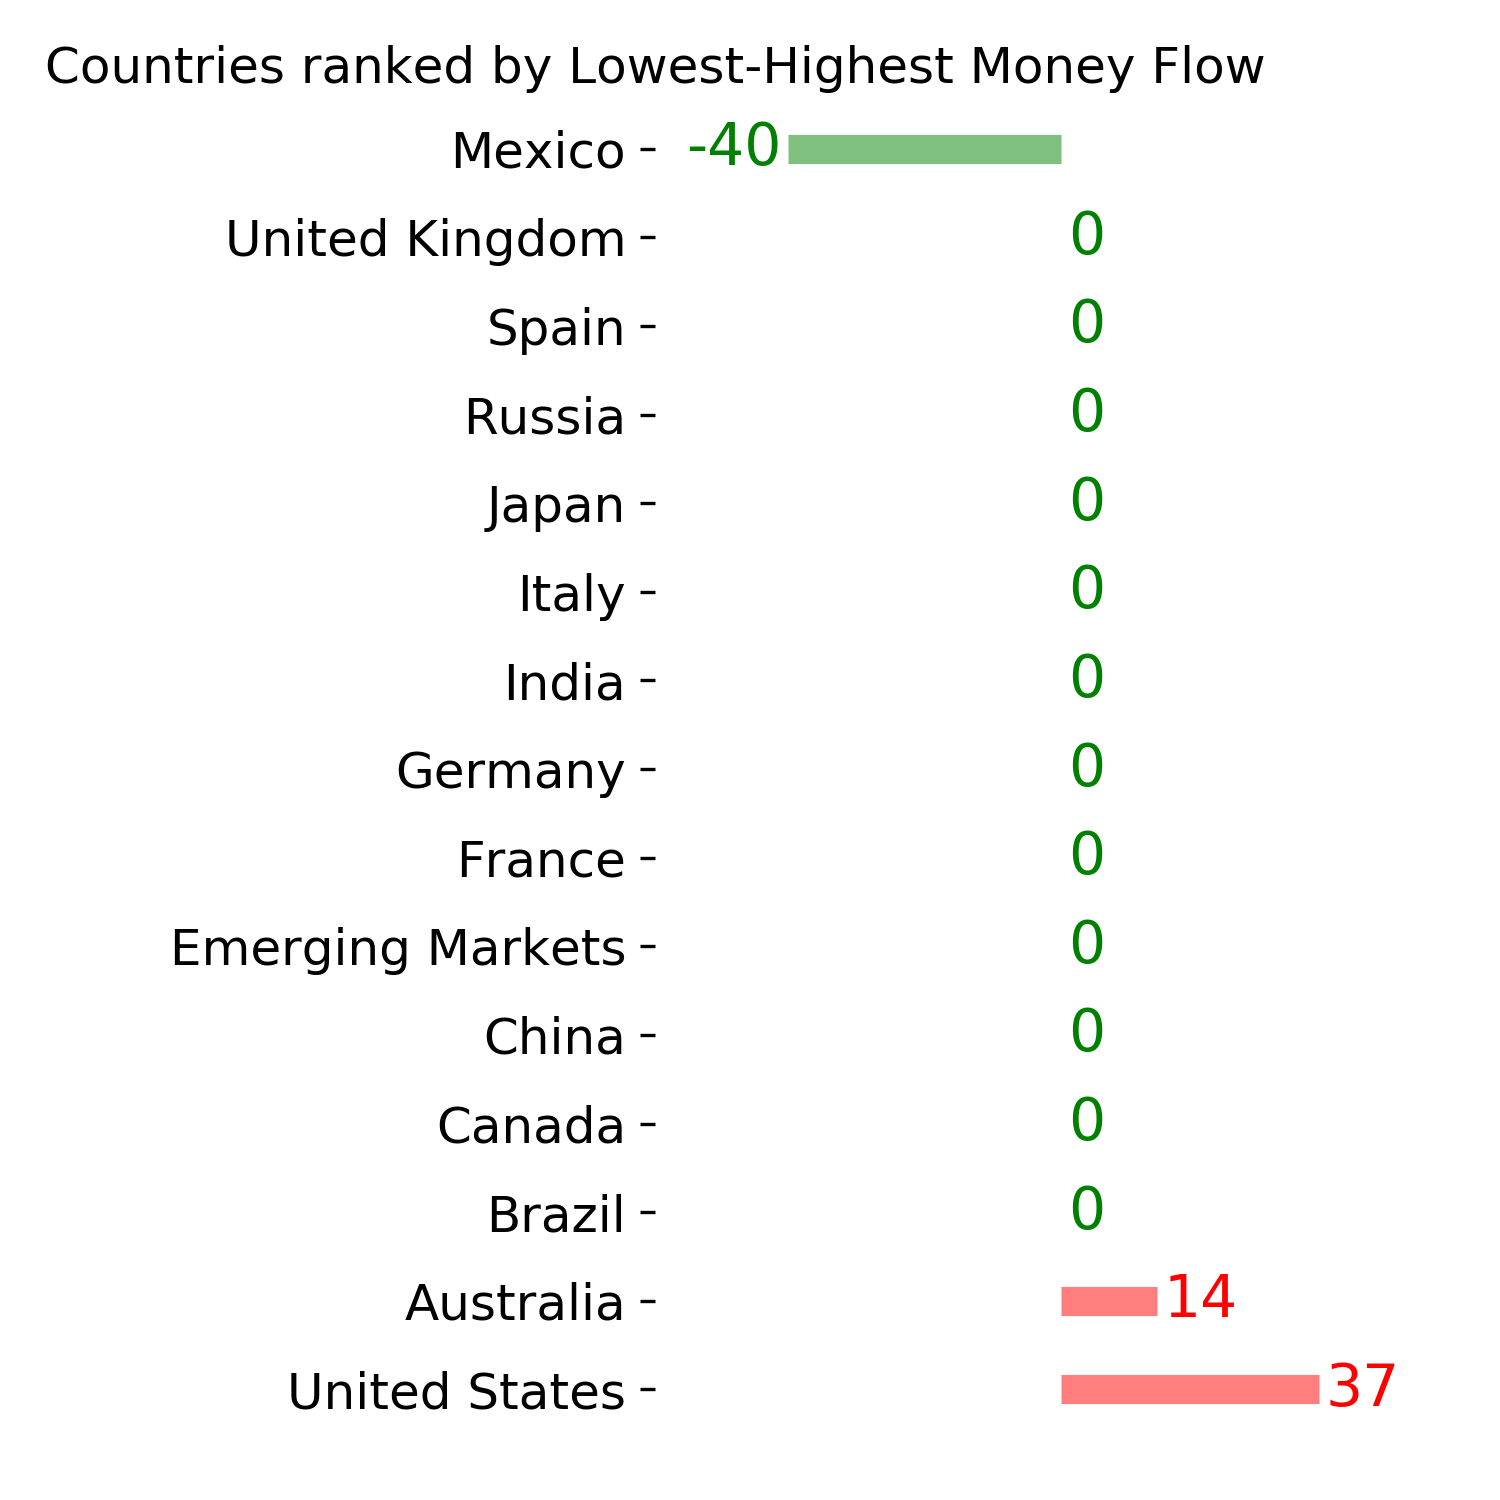
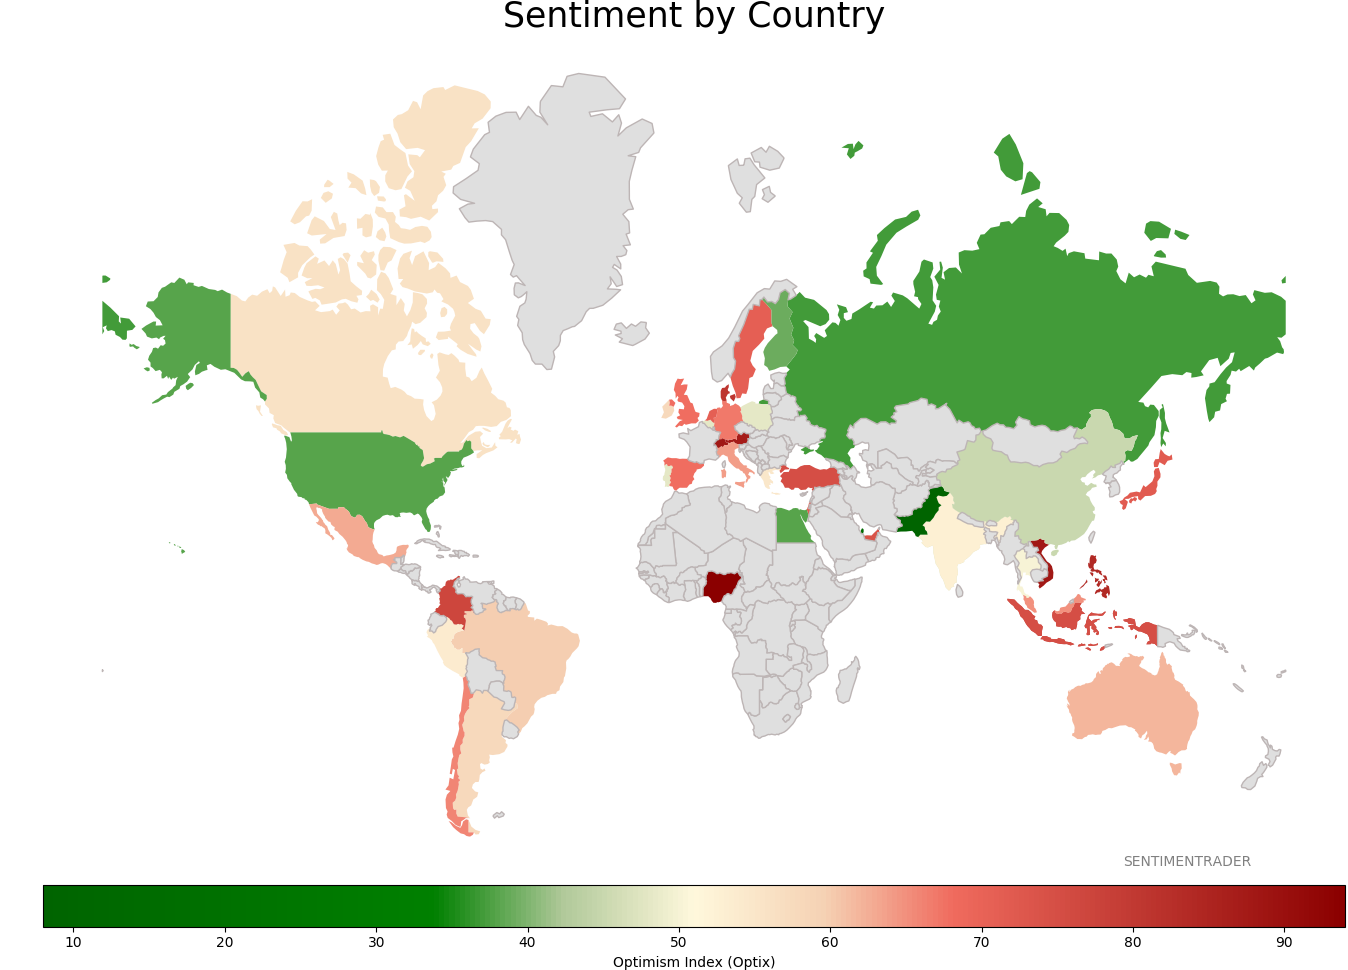
Sentiment Around The World
Optimism Index Thumbnails
|
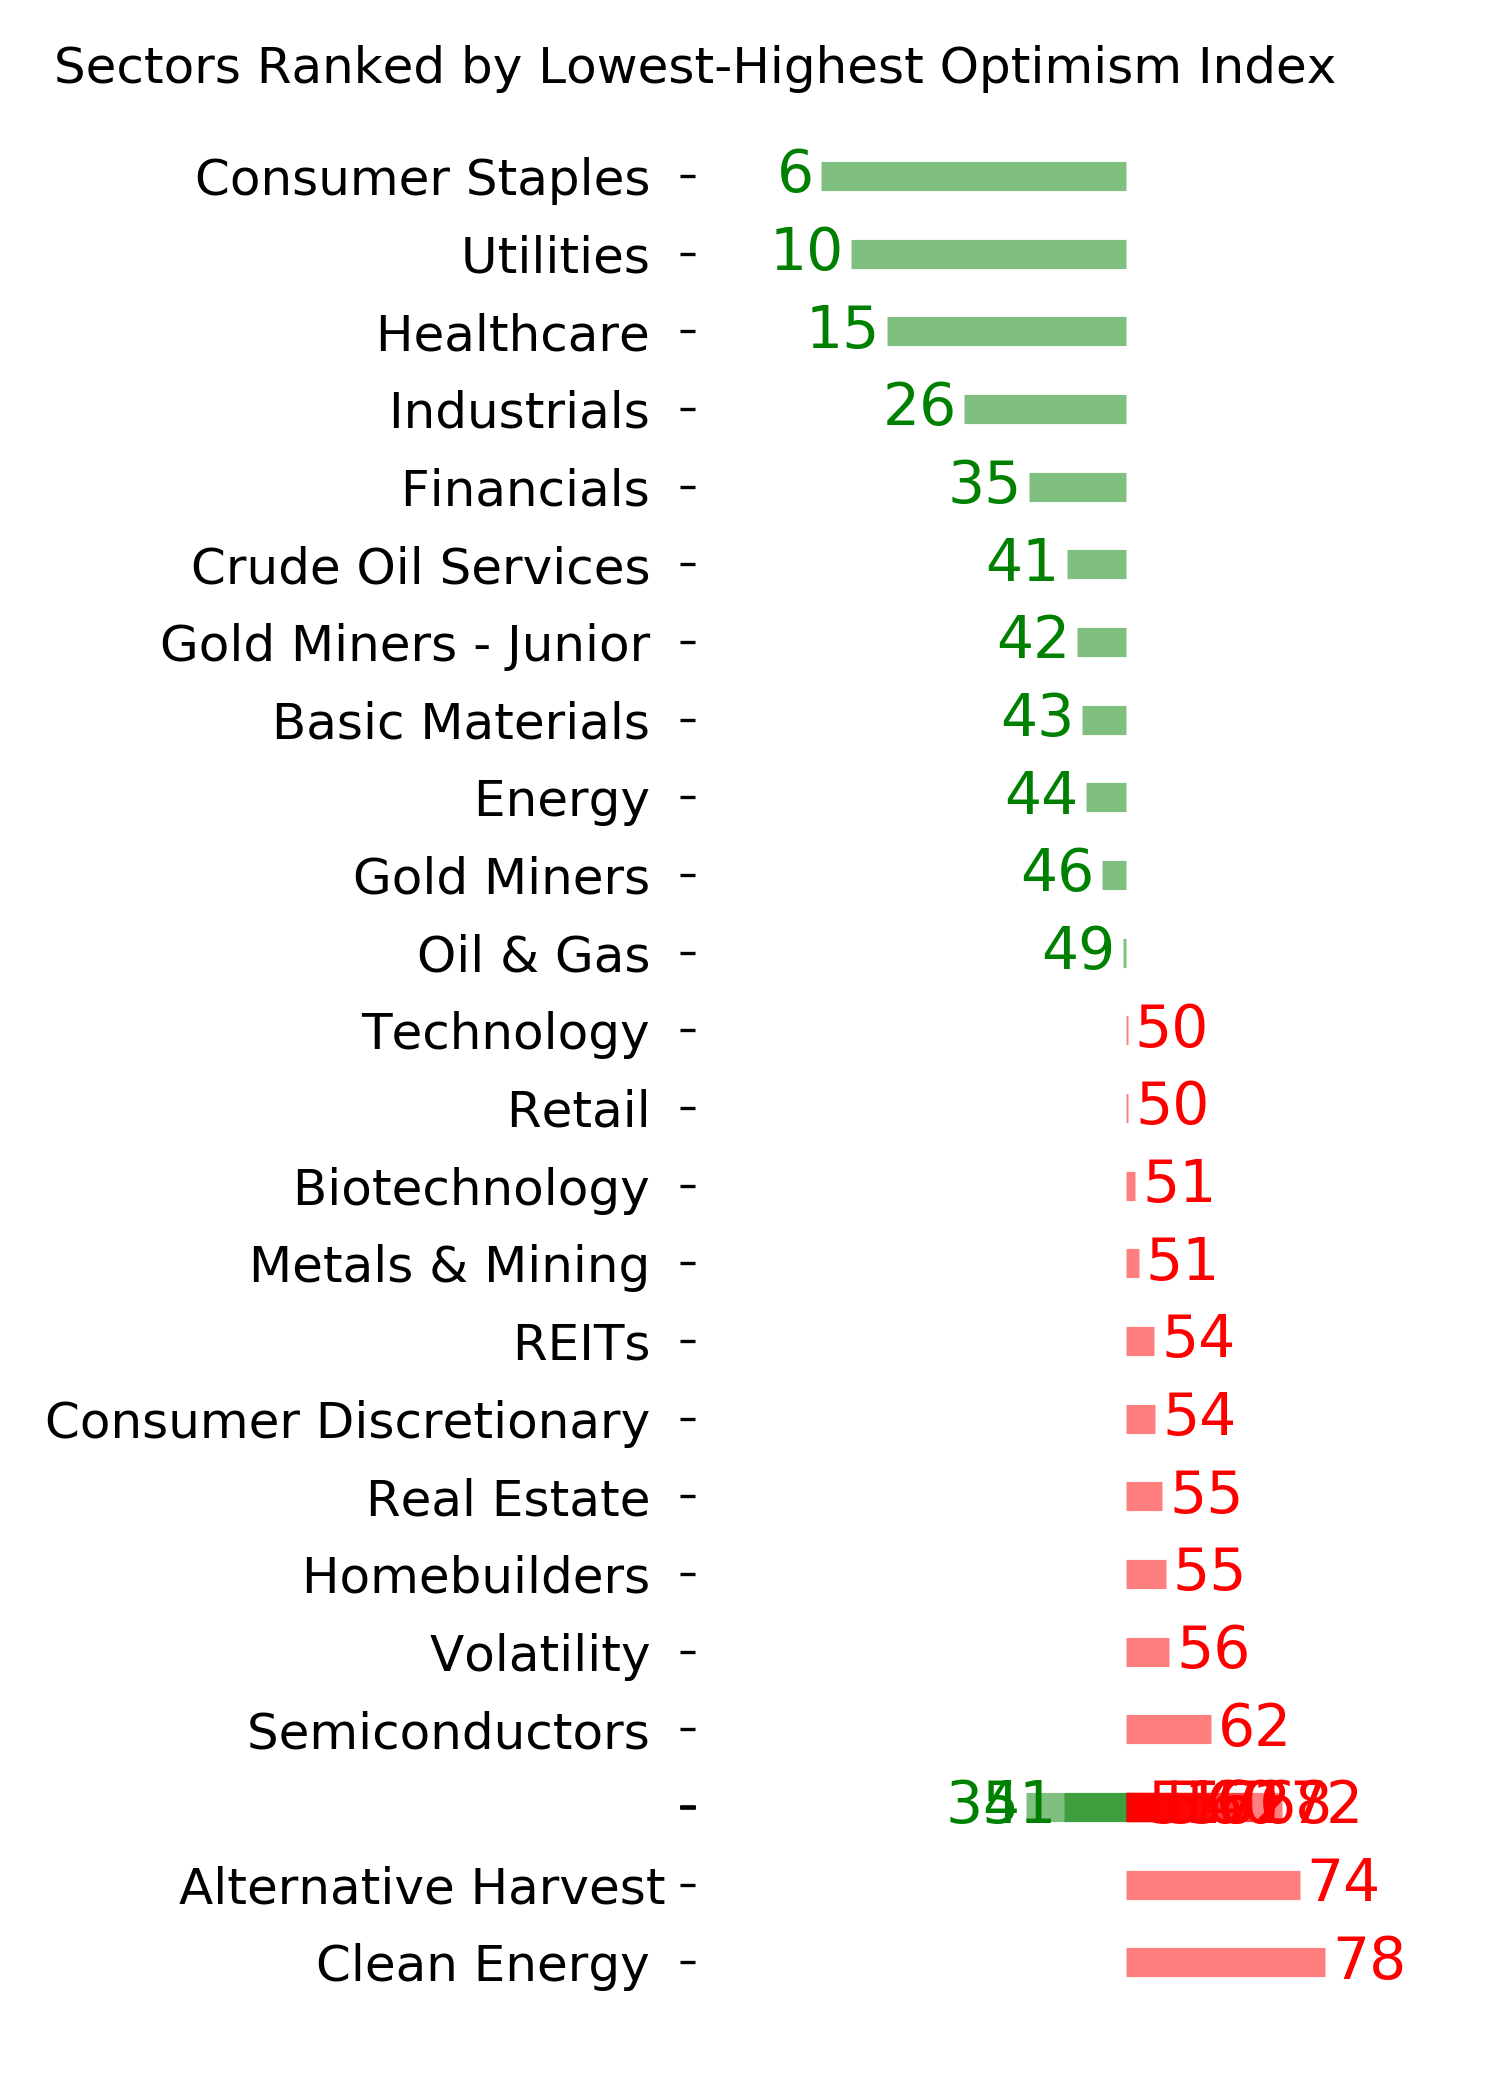
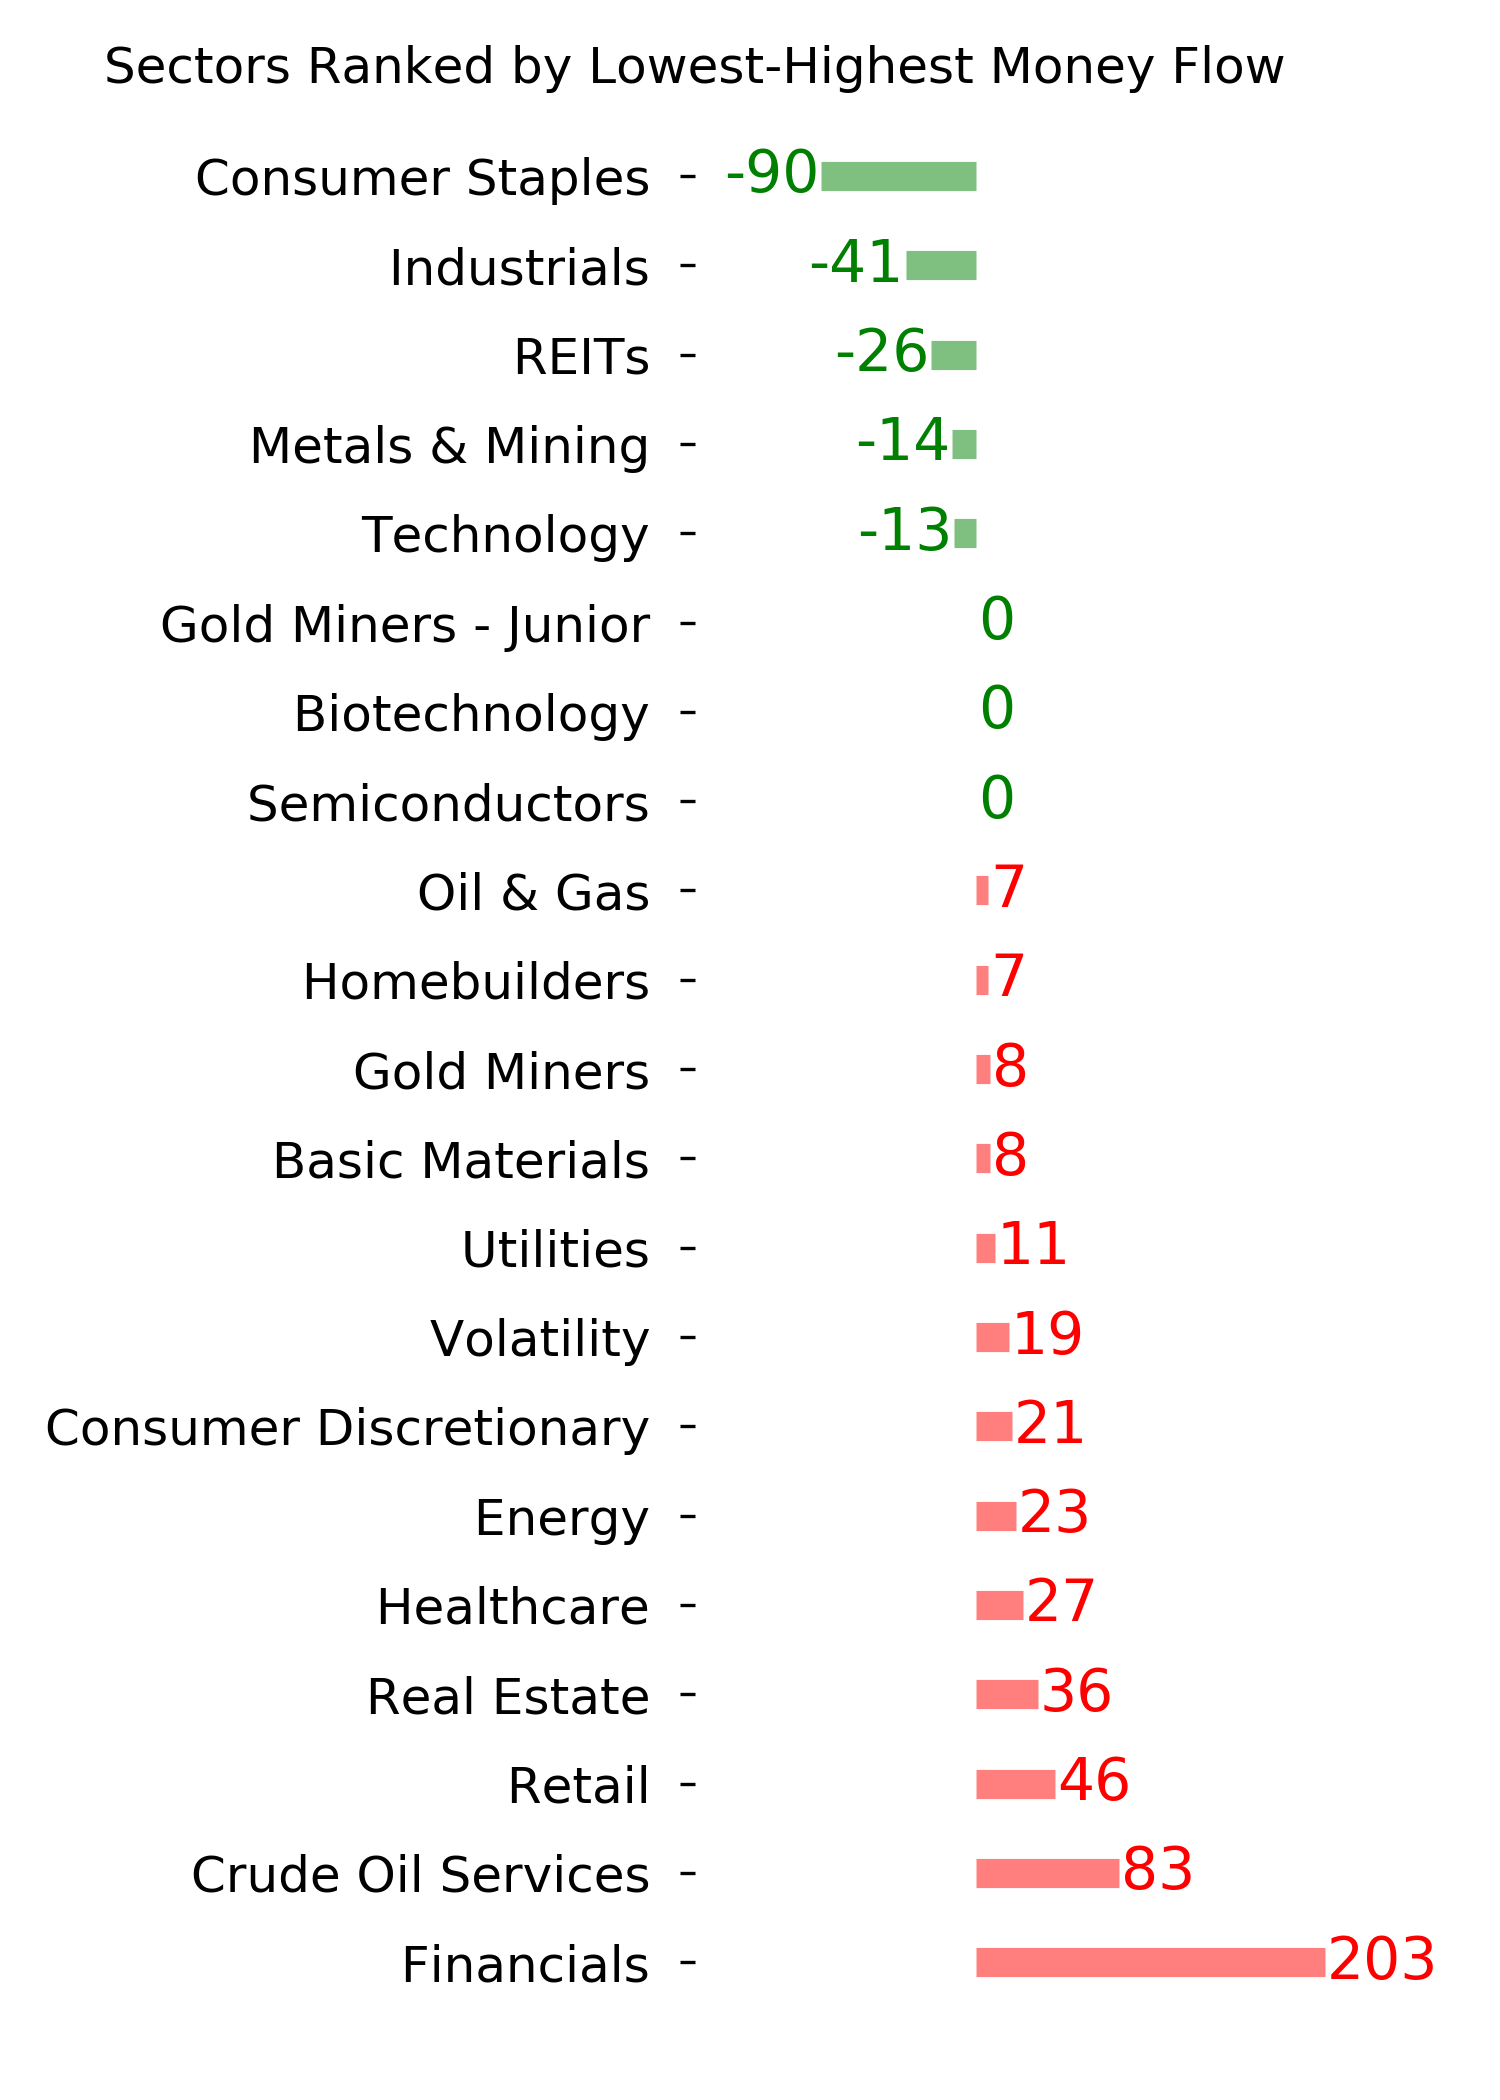
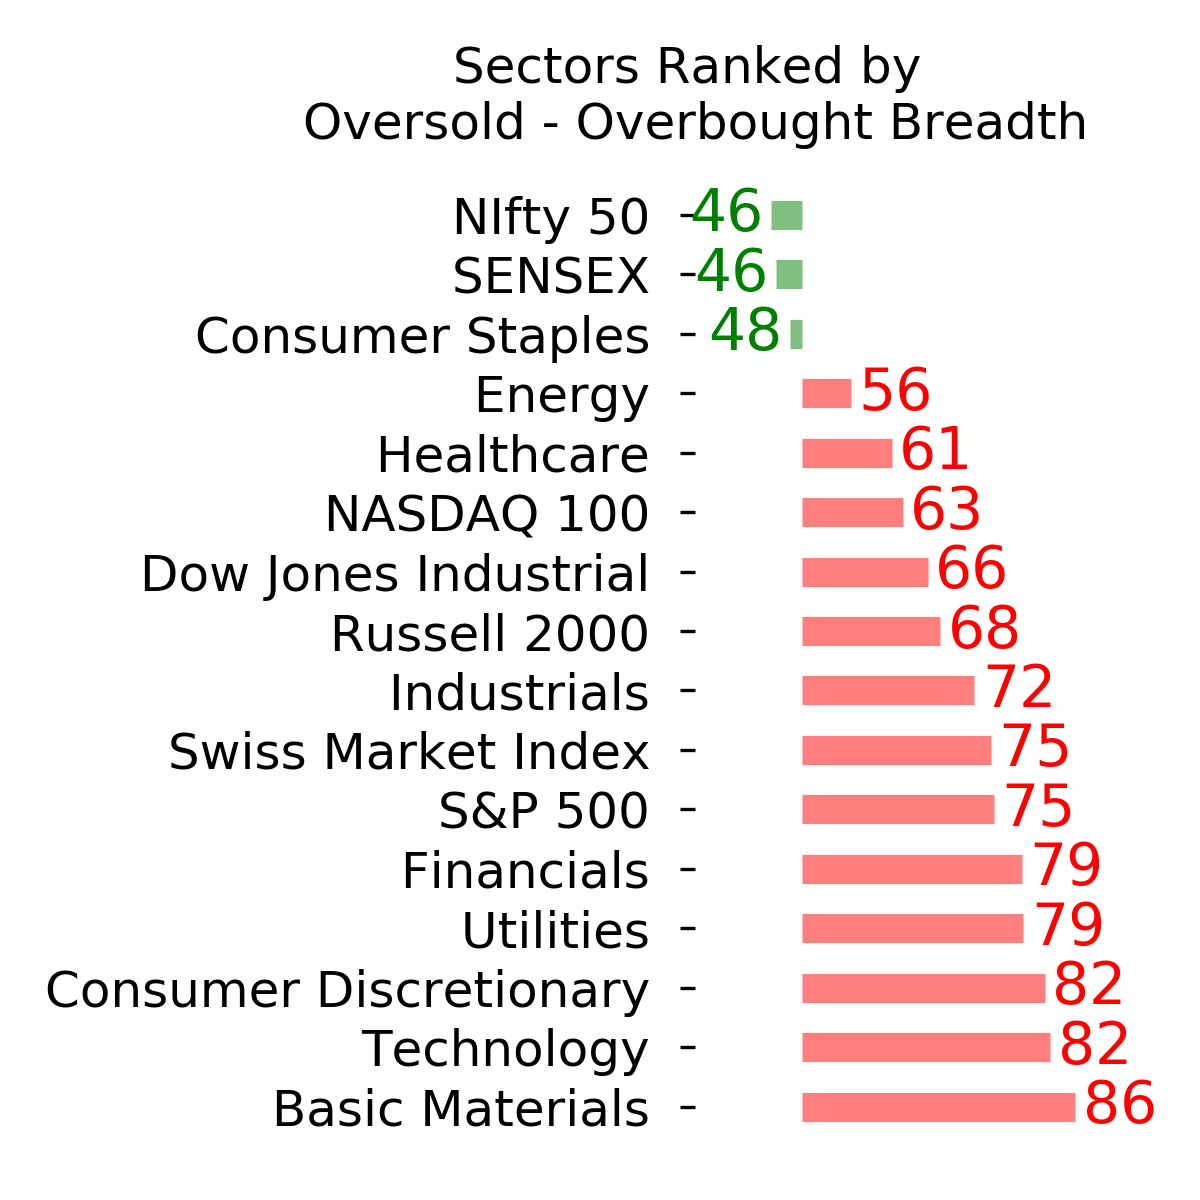
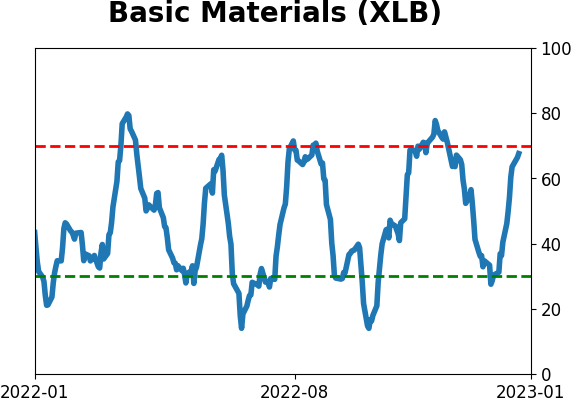
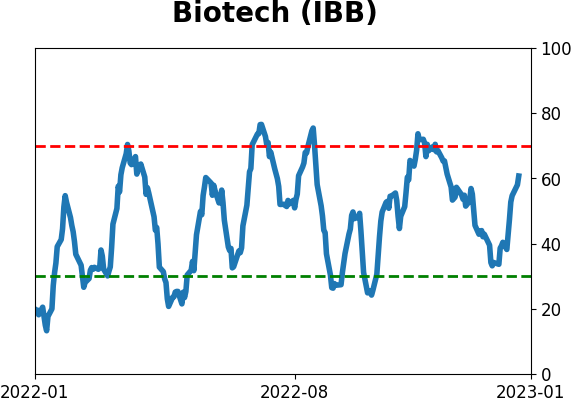
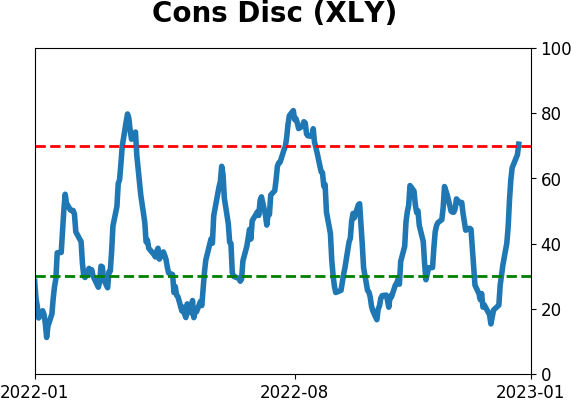
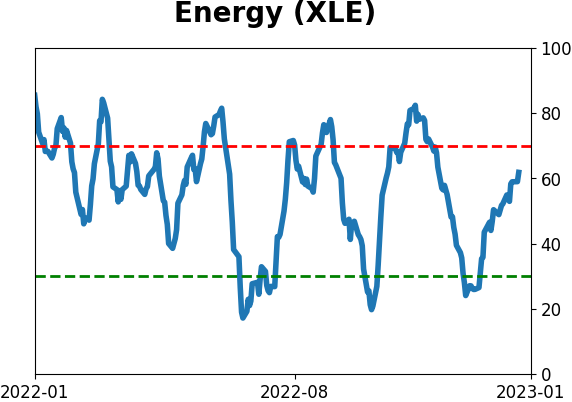
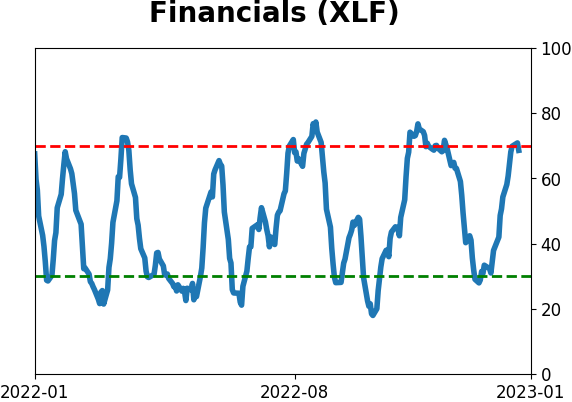
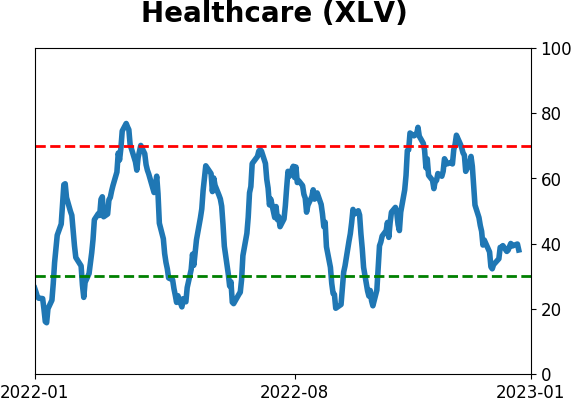
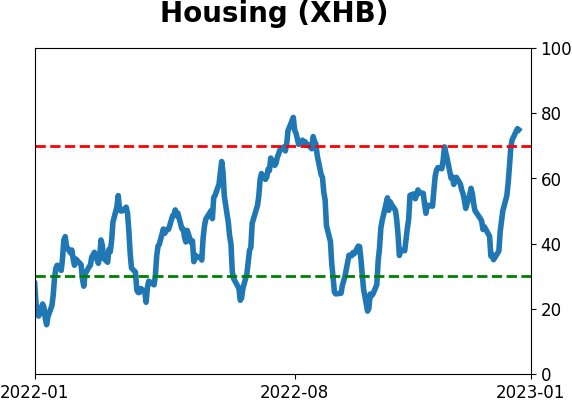
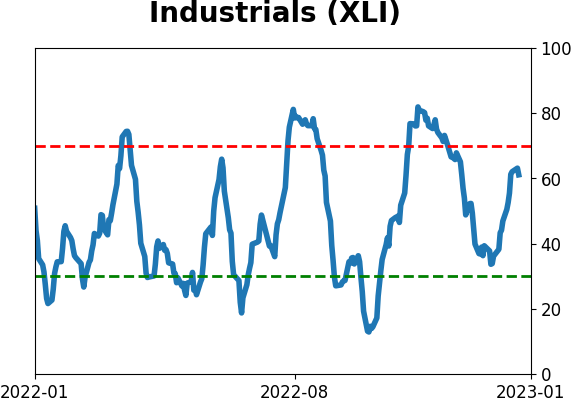
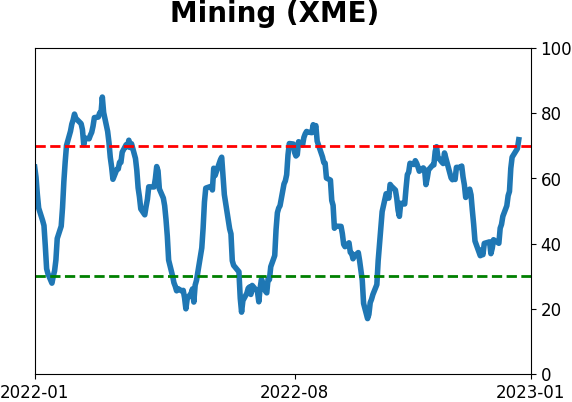
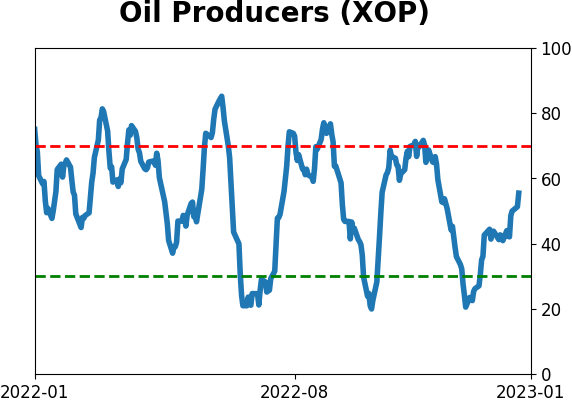
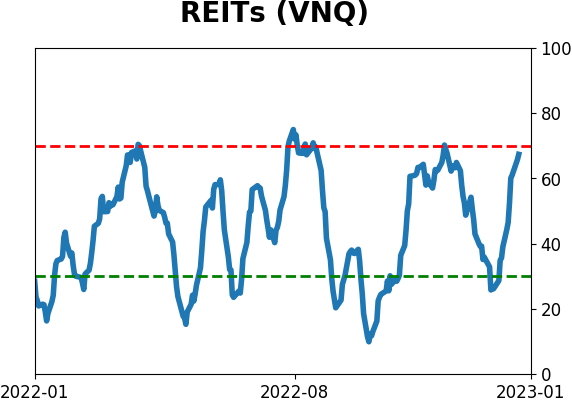
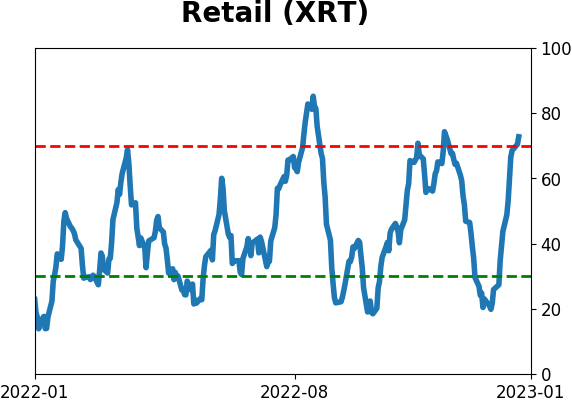
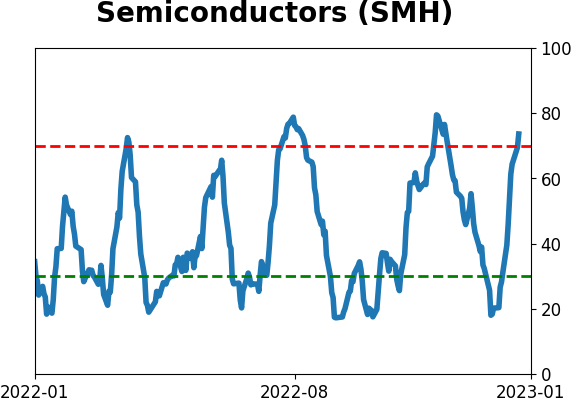
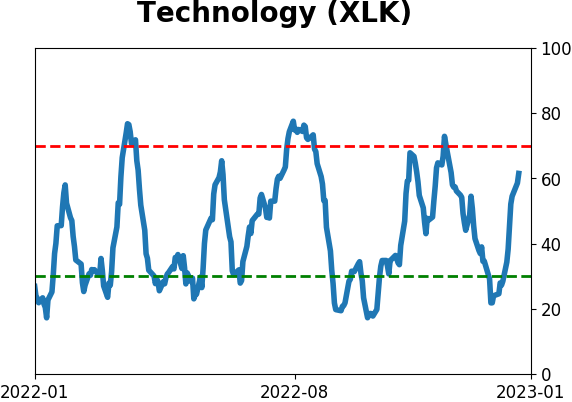
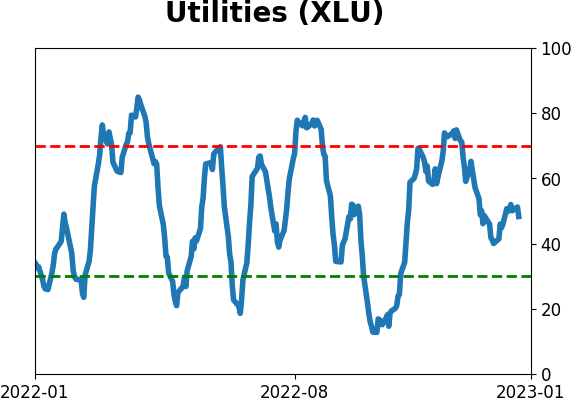
Sector ETF's - 10-Day Moving Average
|
|
|
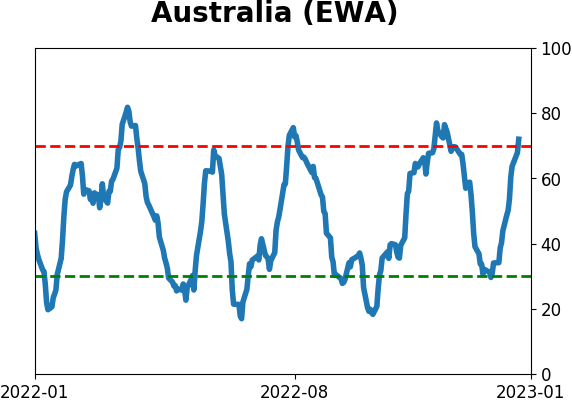
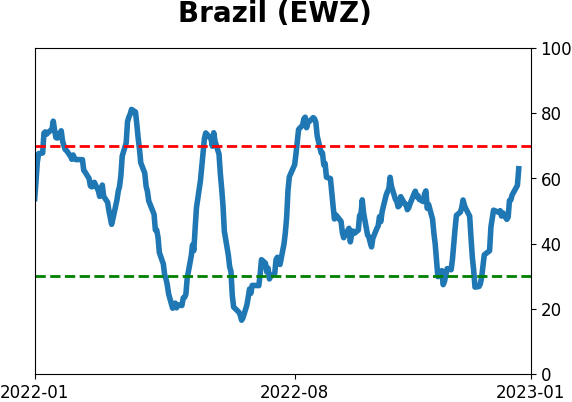
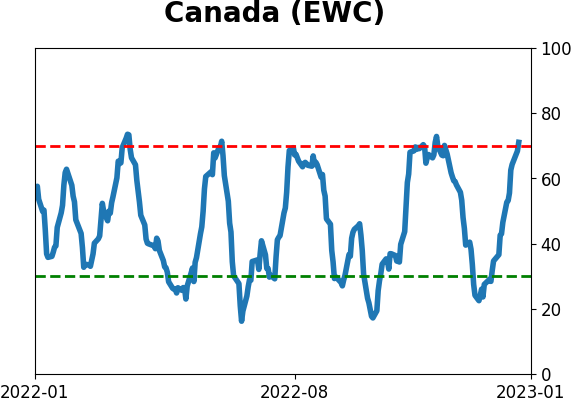
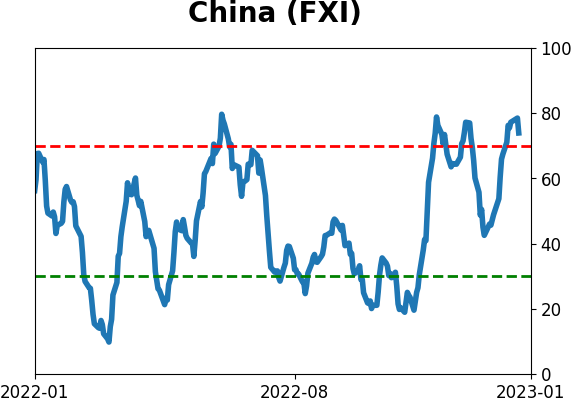
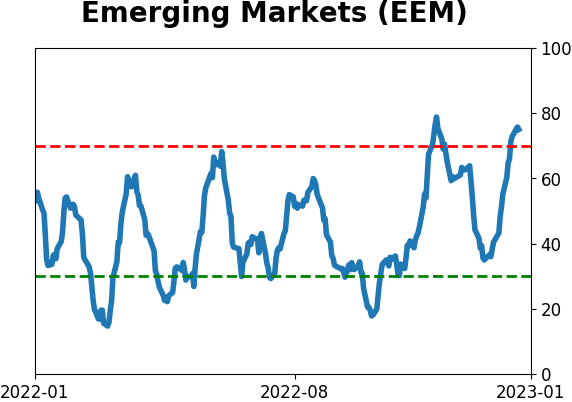
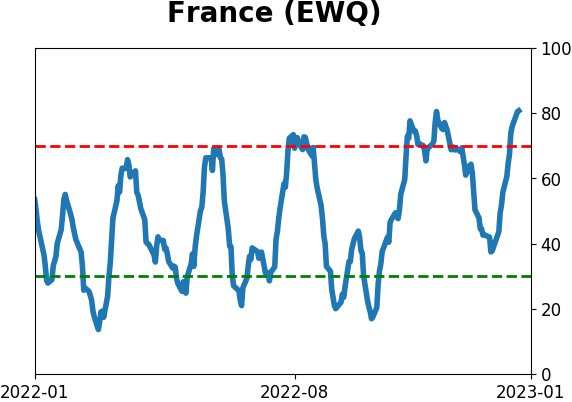
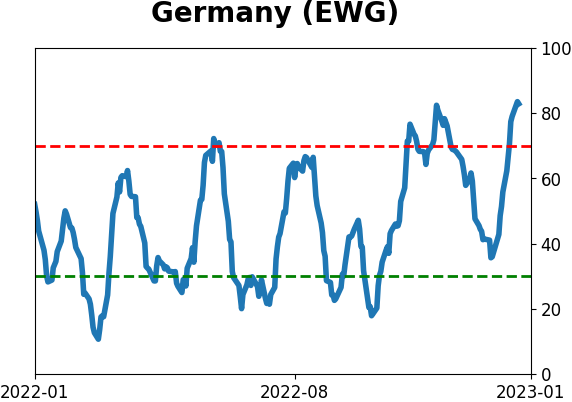
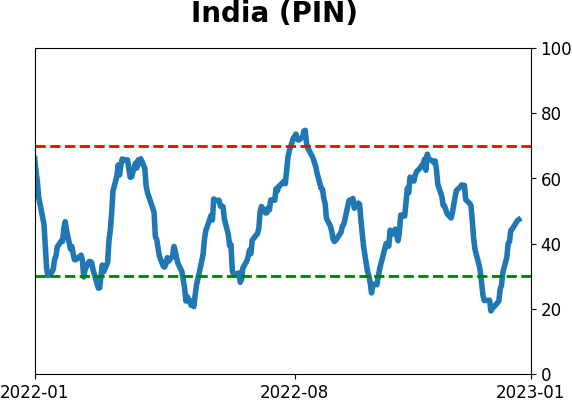
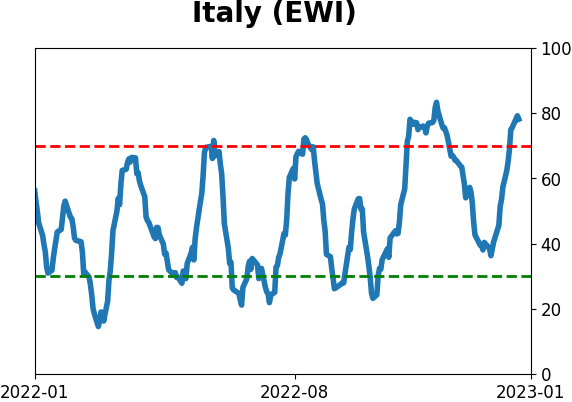
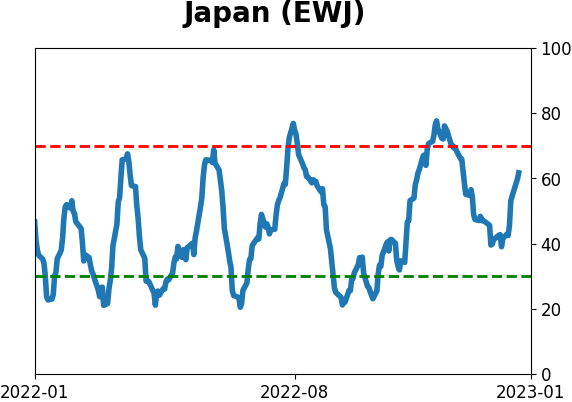
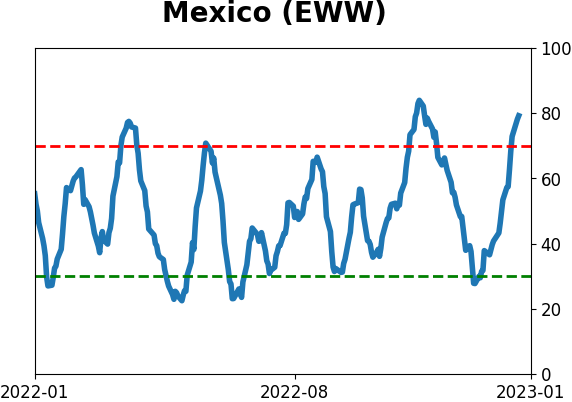
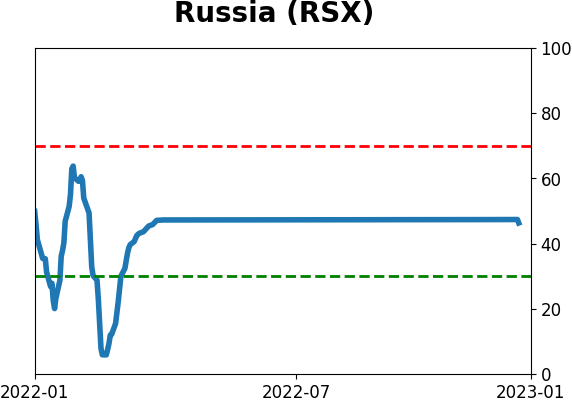
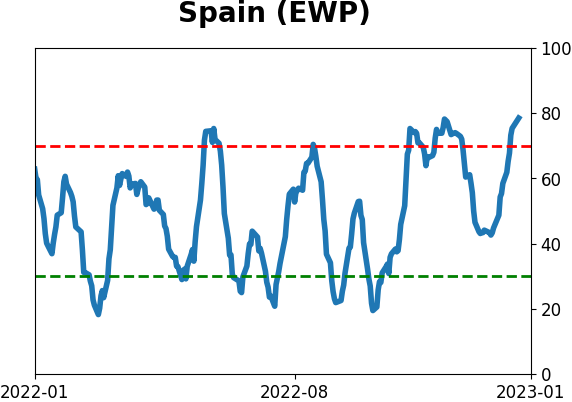
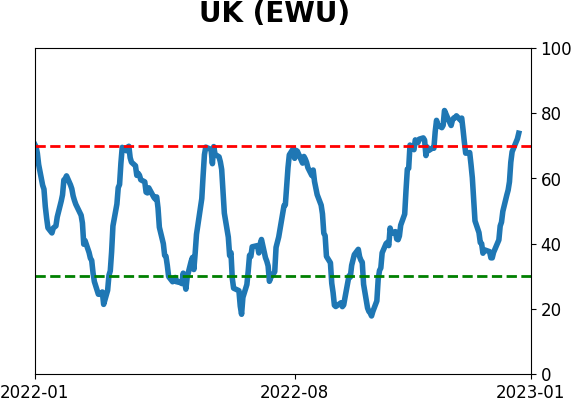
Country ETF's - 10-Day Moving Average
|
|
|
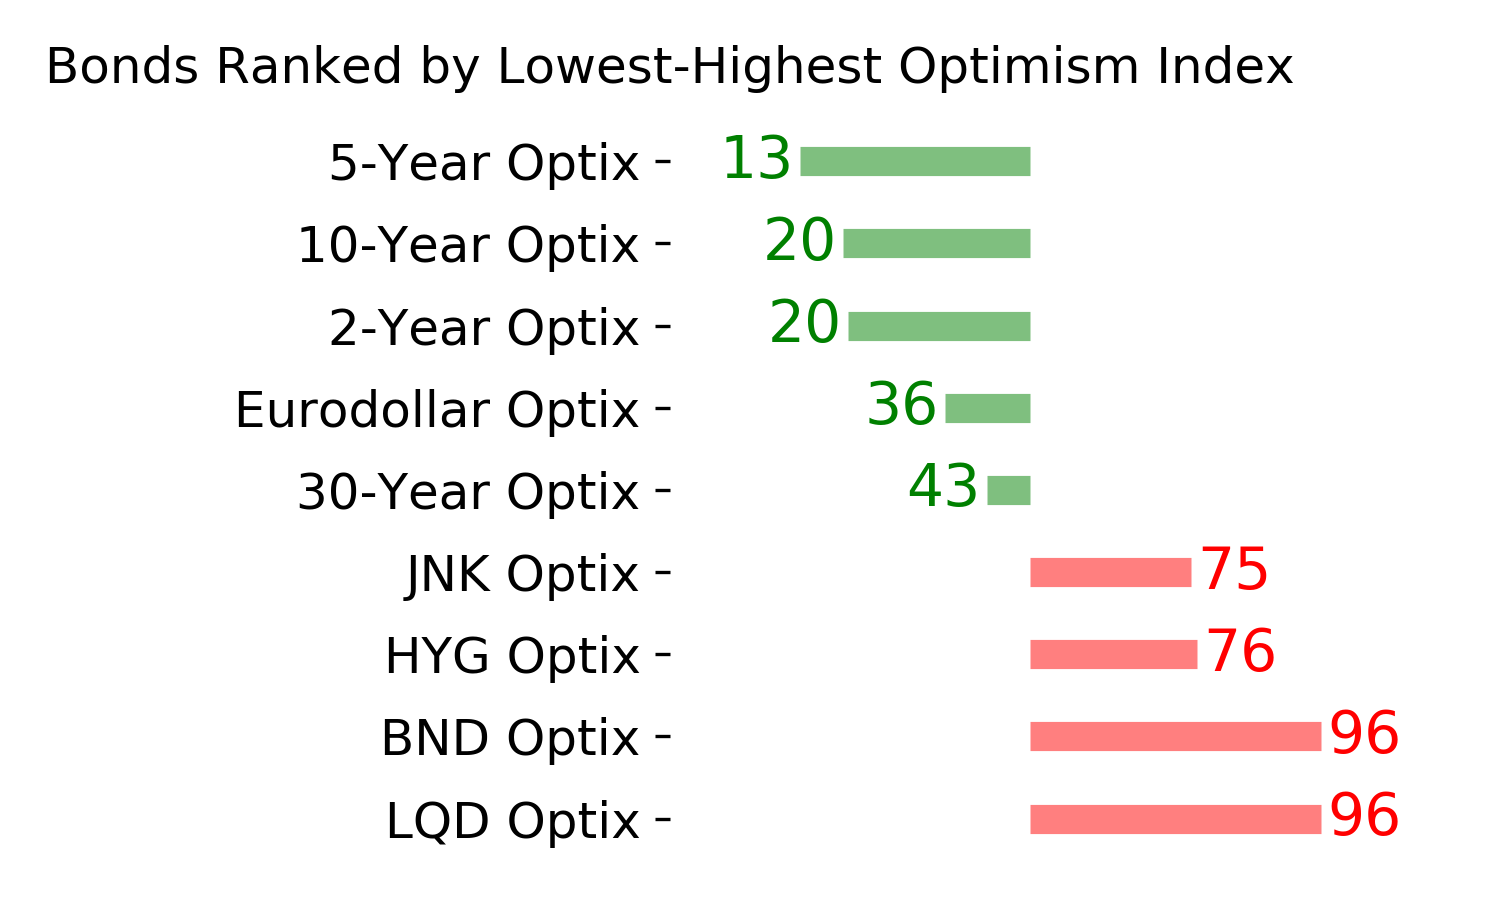
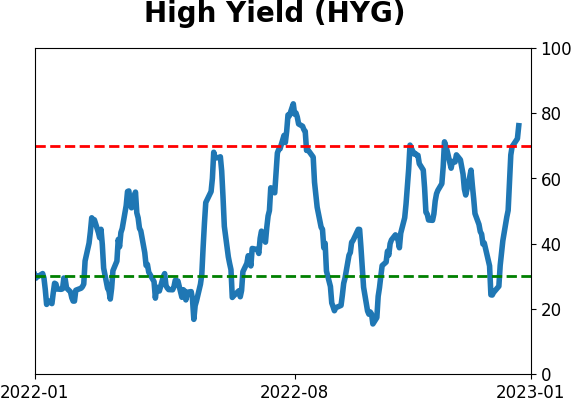
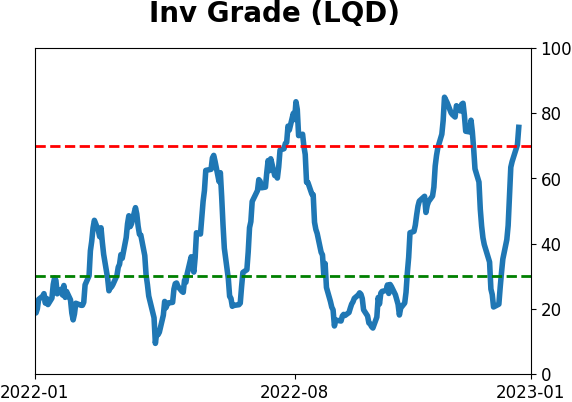
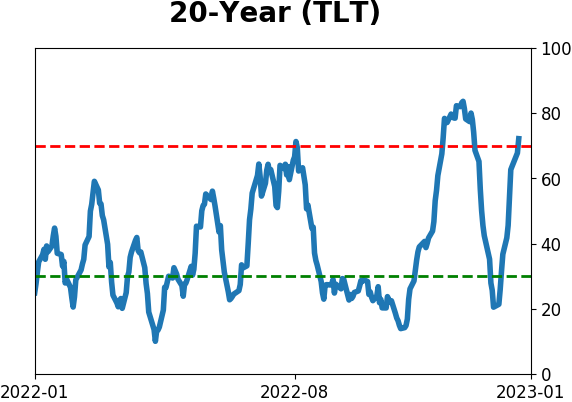
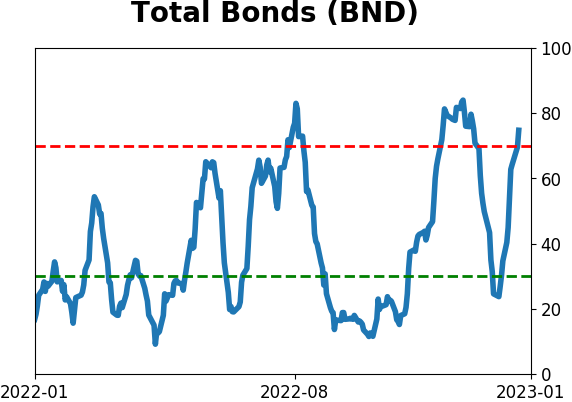
Bond ETF's - 10-Day Moving Average
|
|
|
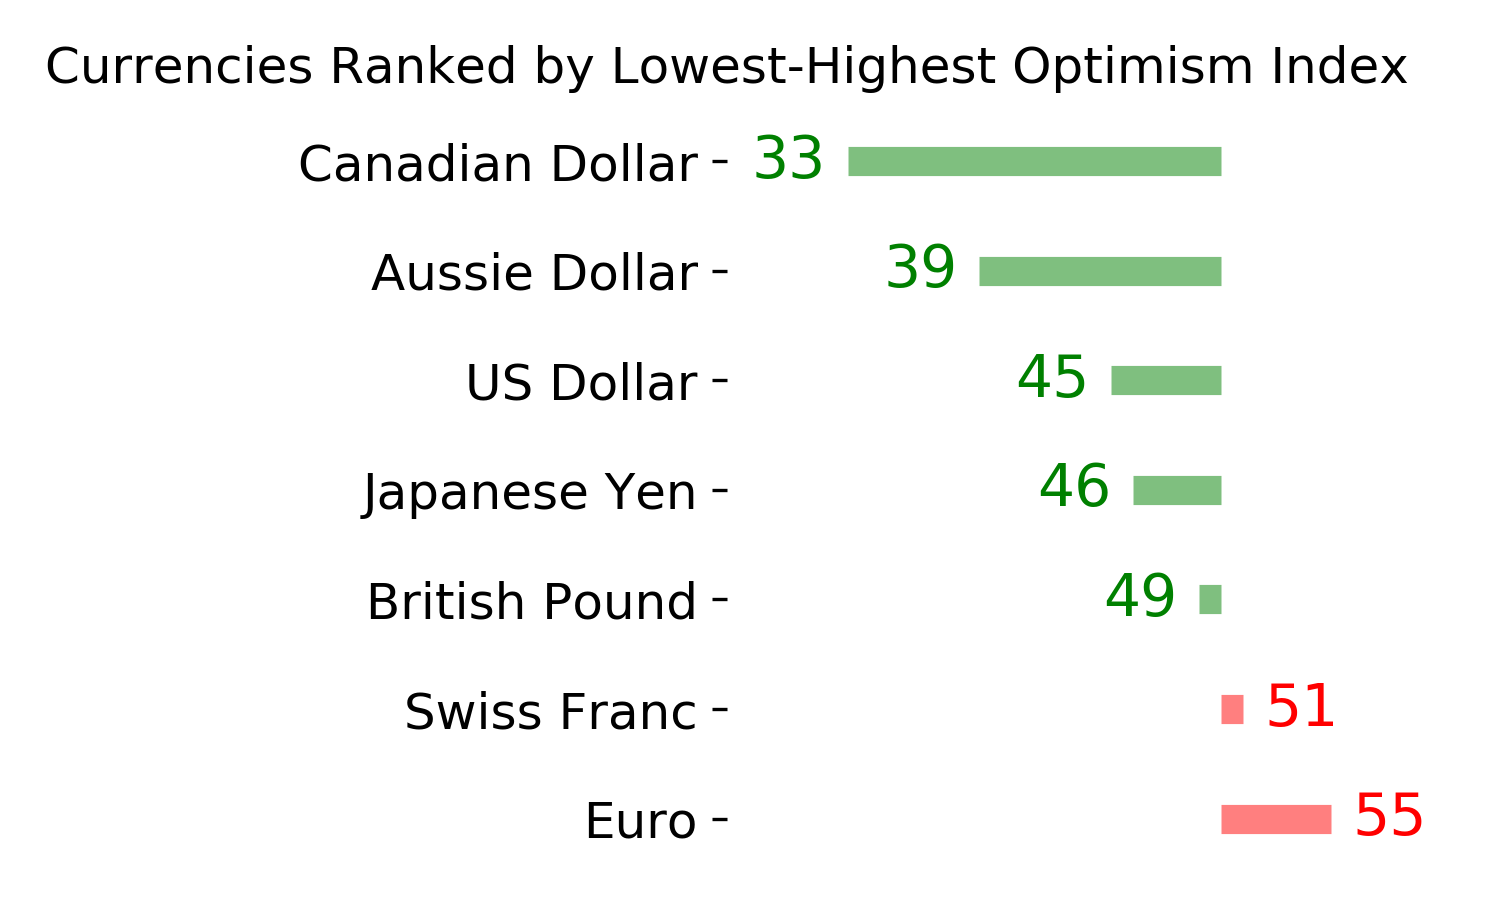
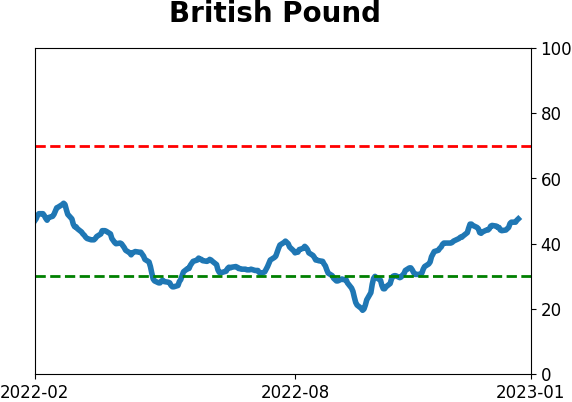
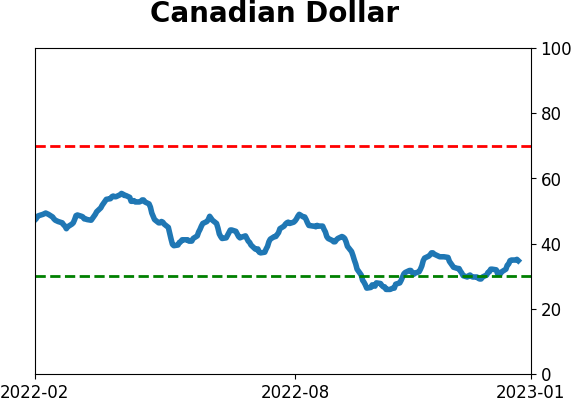
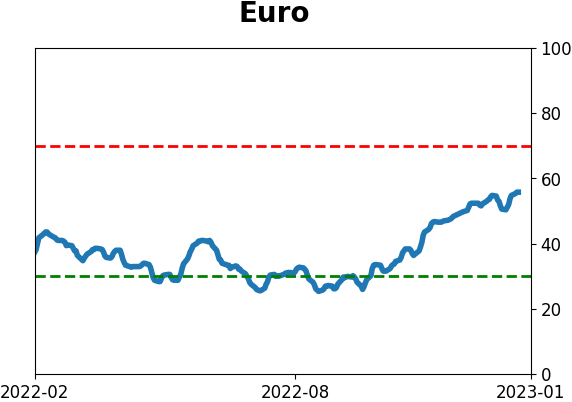
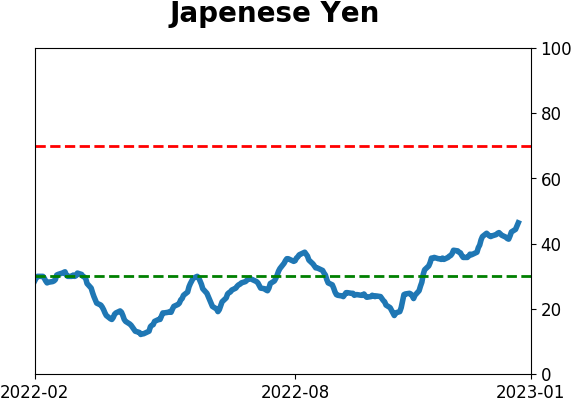
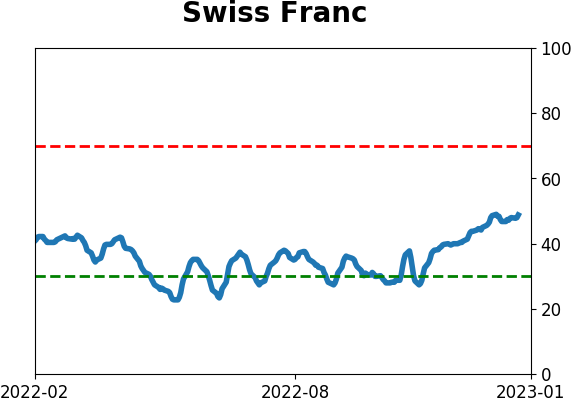
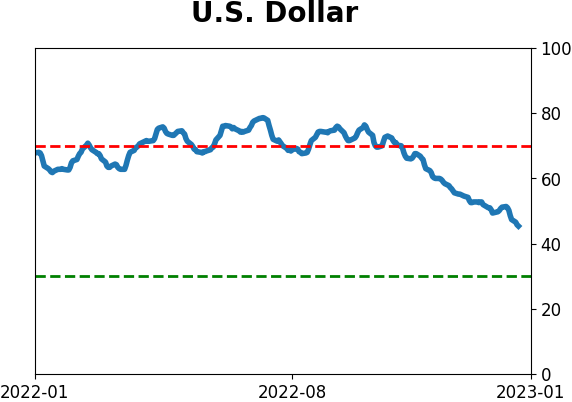
Currency ETF's - 5-Day Moving Average
|
|
|
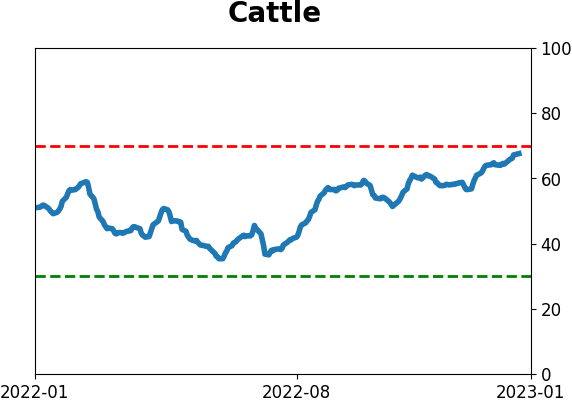
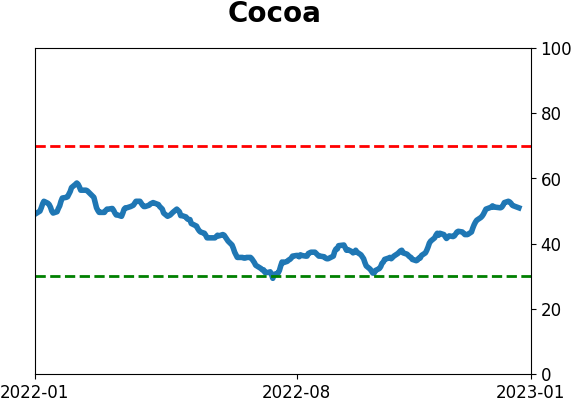
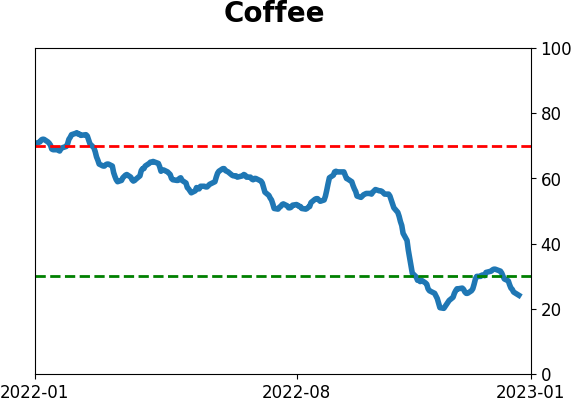
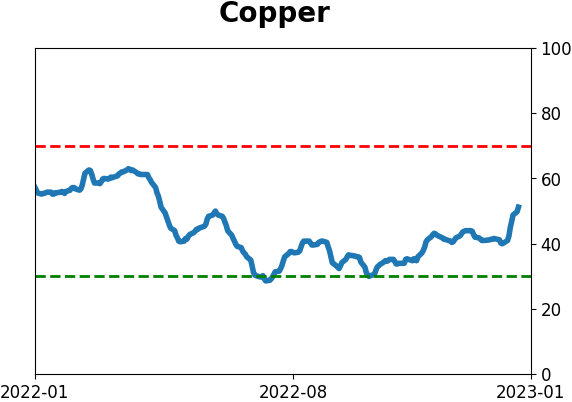
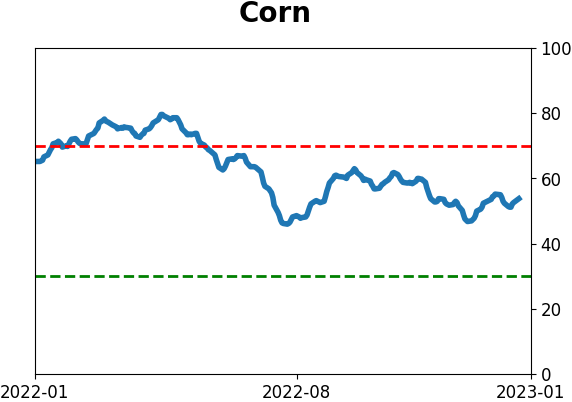
Commodity ETF's - 5-Day Moving Average
|
|