Headlines
|
|
What happens when Greed retreats:
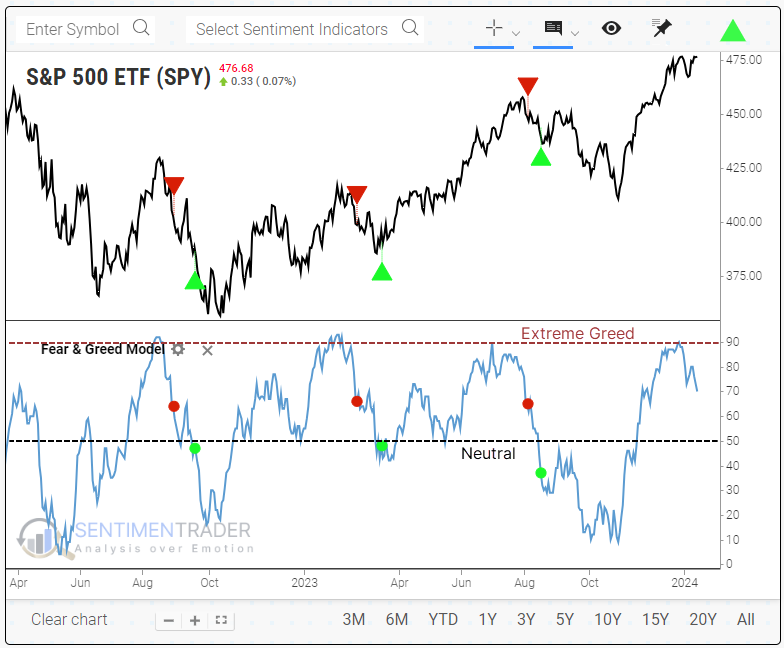
The multi-month rally in stocks ignited Greed in traders, as evidenced by the Fear & Greed Model. It has since started to pull back, which has tended to keep going until the greed has been neutralized. We show a strategy using the new version of the Backtest Engine which tries to profit off the tendency by selling short.
|
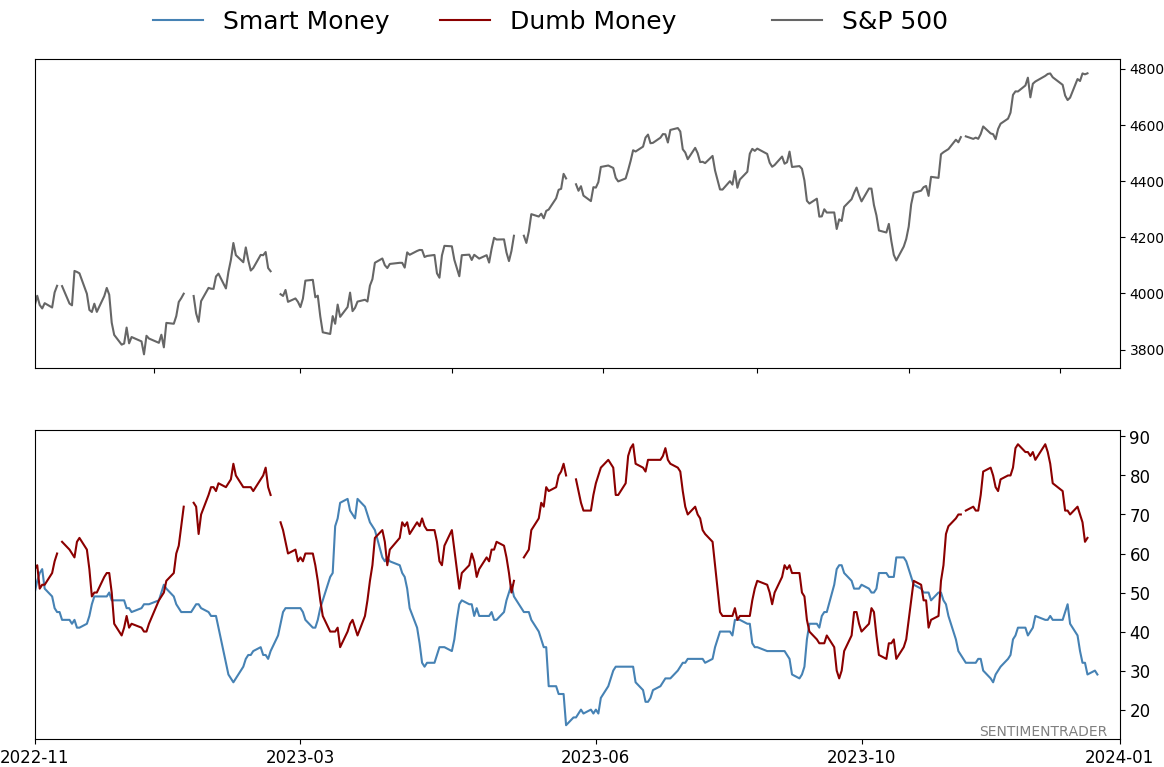
Smart / Dumb Money Confidence
|
Smart Money Confidence: 29%
Dumb Money Confidence: 64%
|
|
Risk Levels
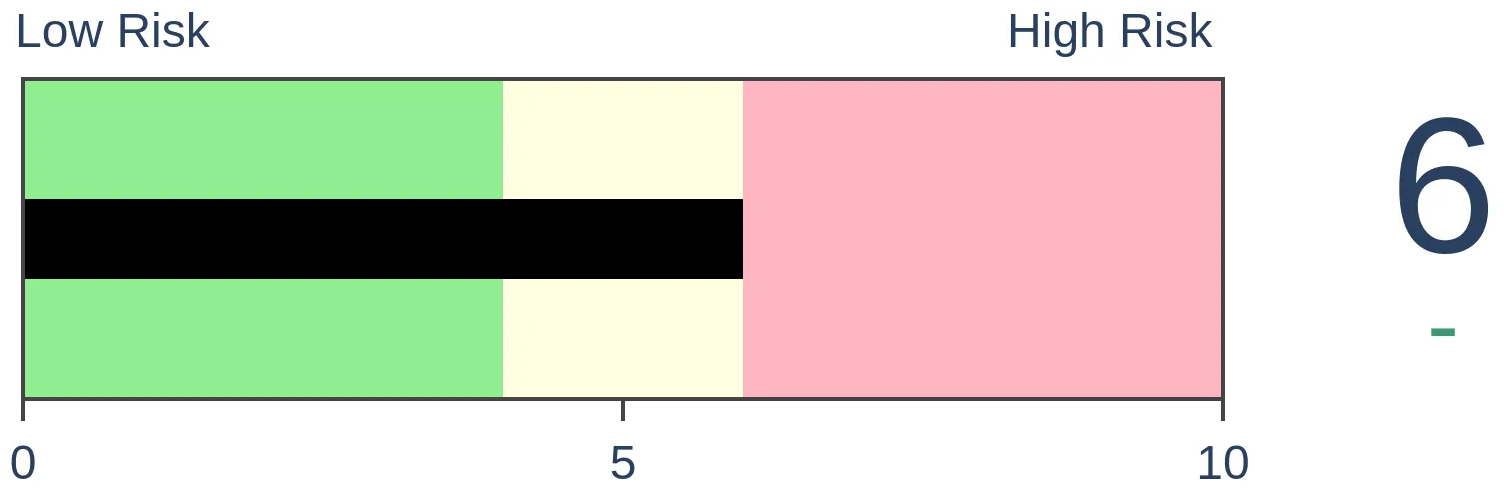
Stocks Short-Term
|
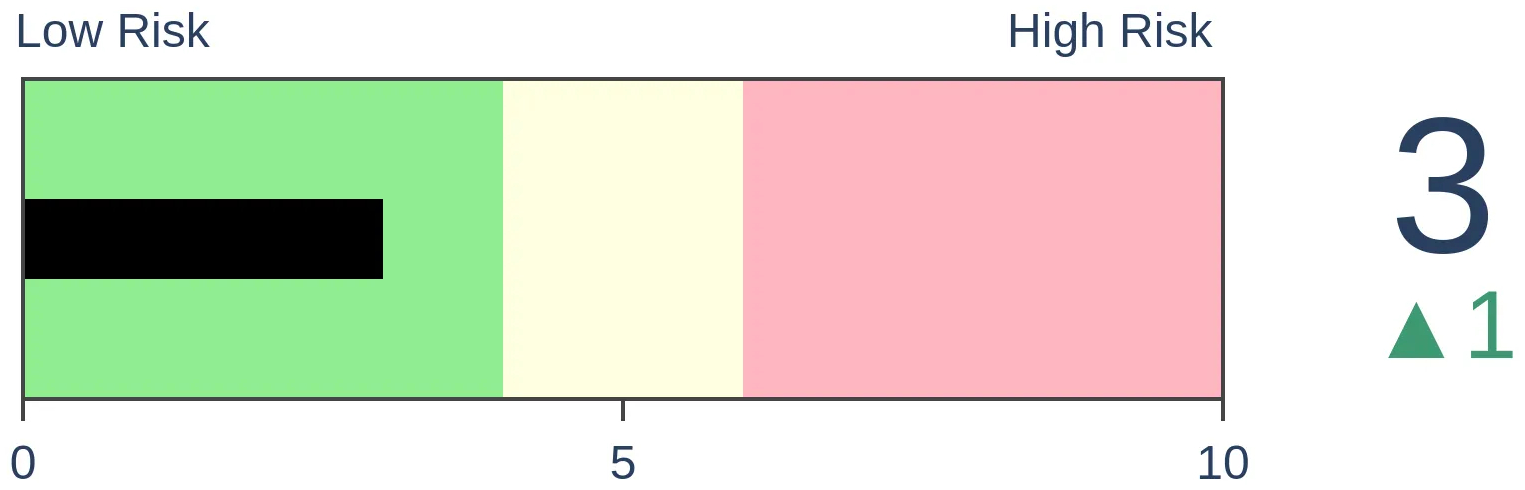
Stocks Medium-Term
|
|
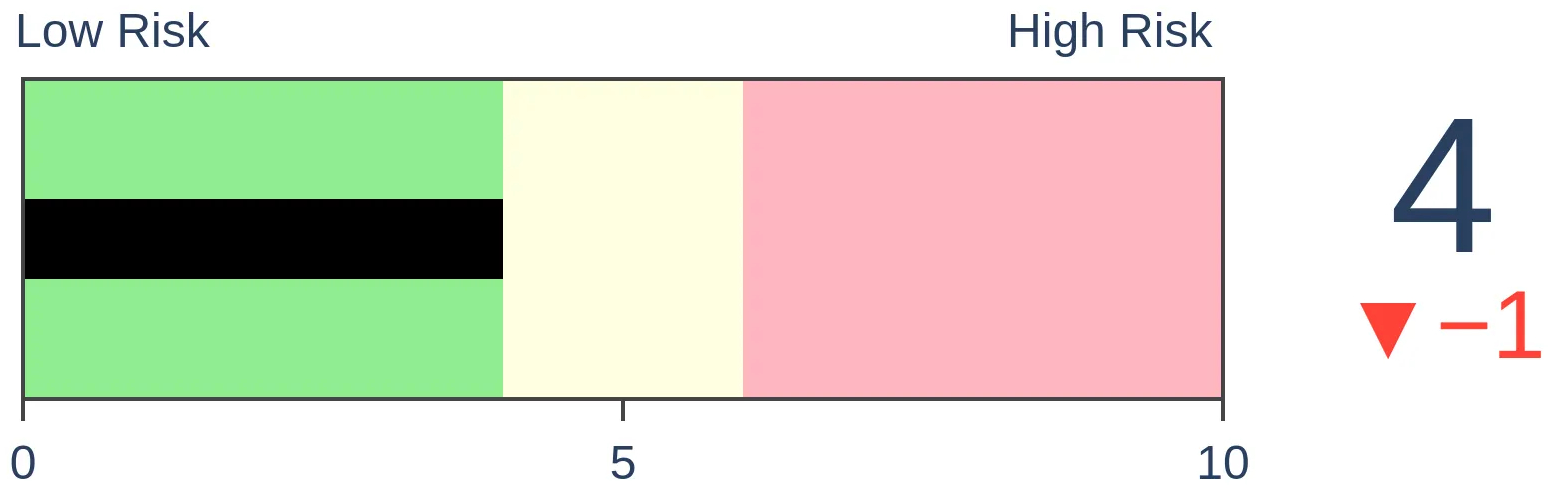
Bonds
|
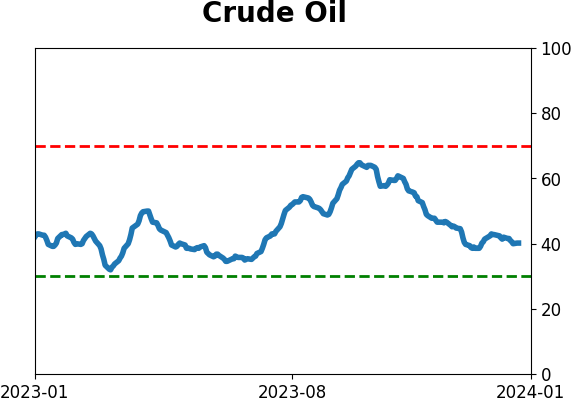
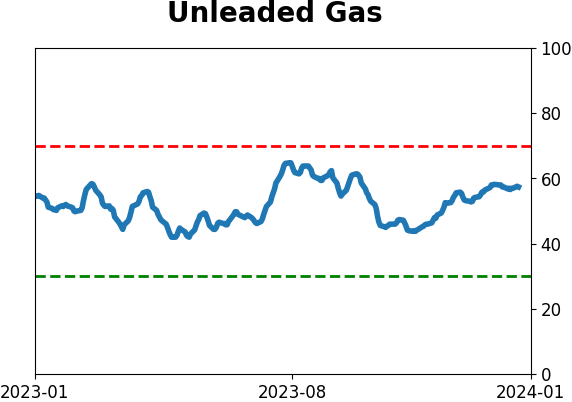
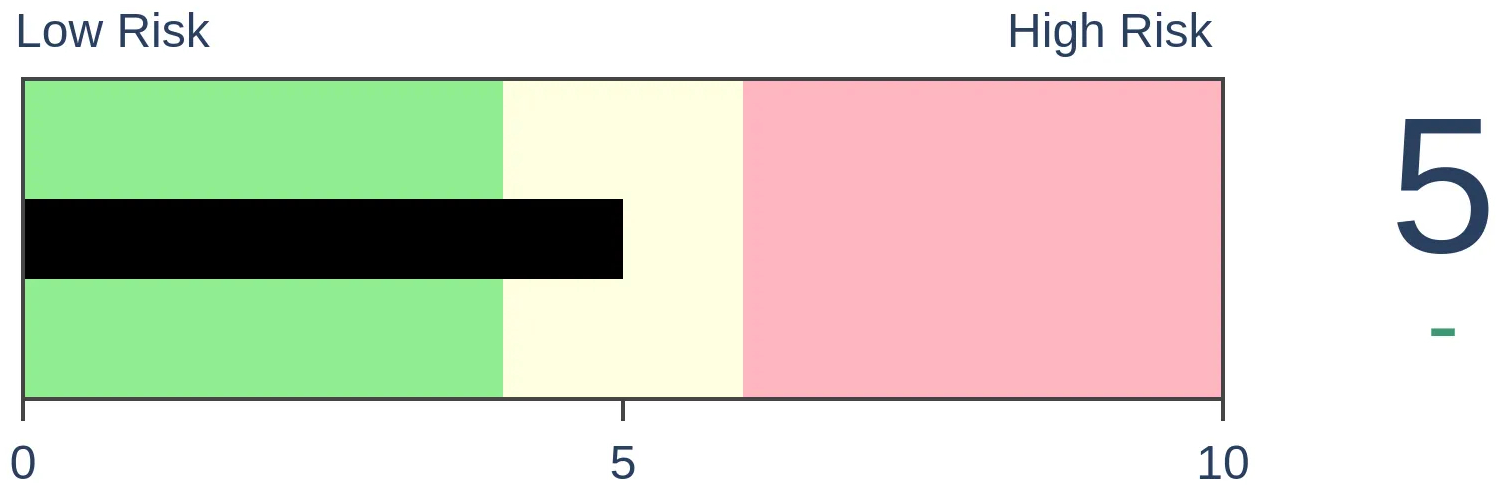
Crude Oil
|
|
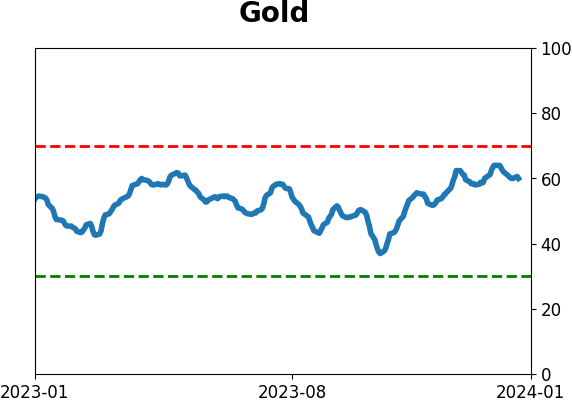
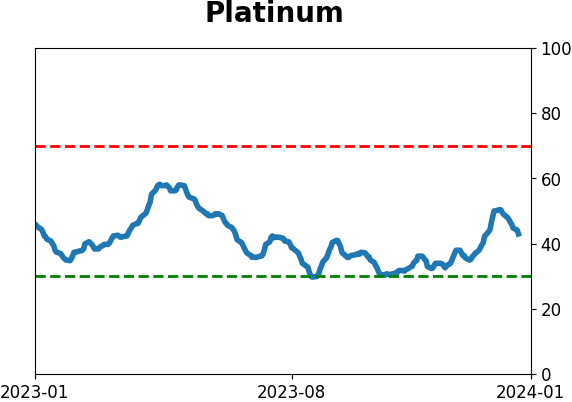
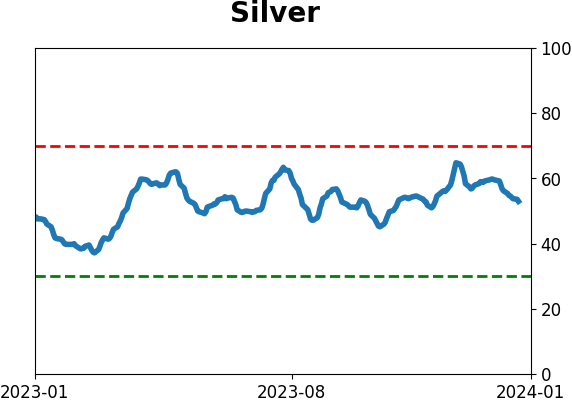
Gold

|
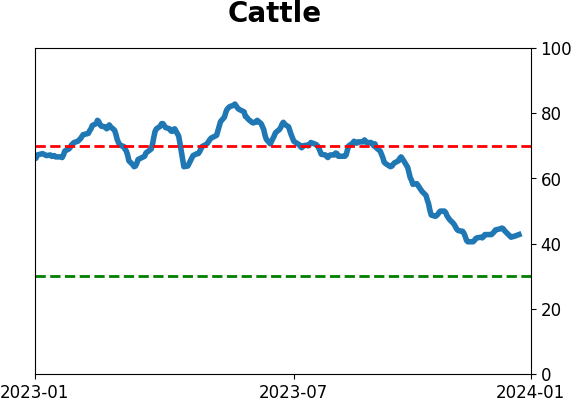
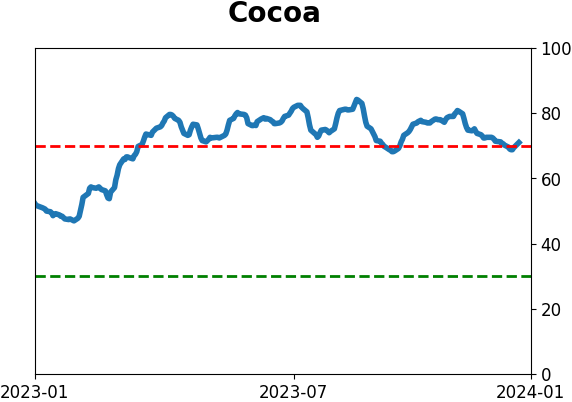
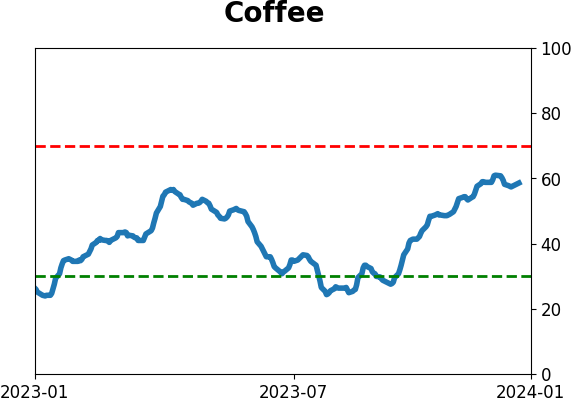
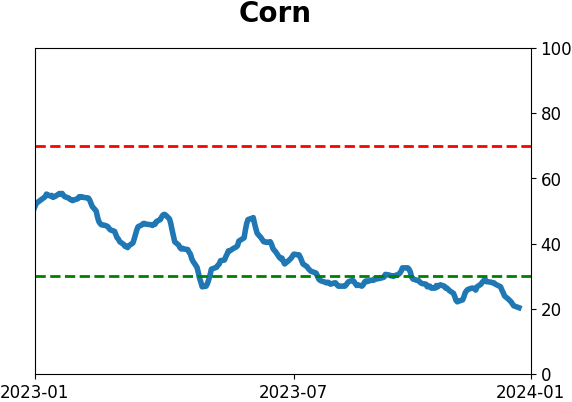
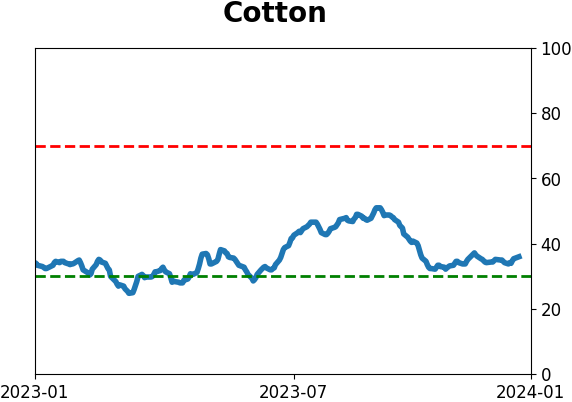
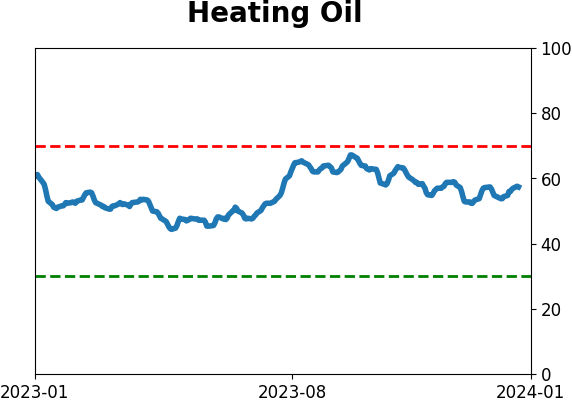
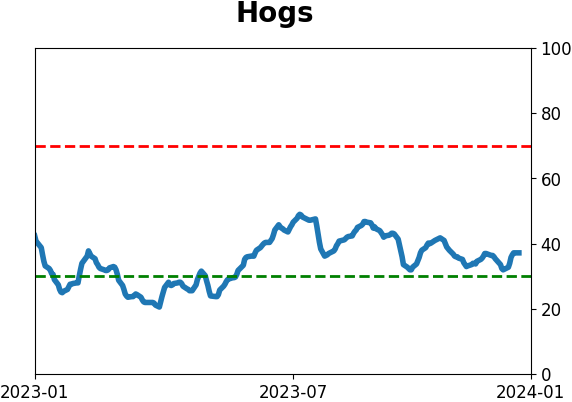
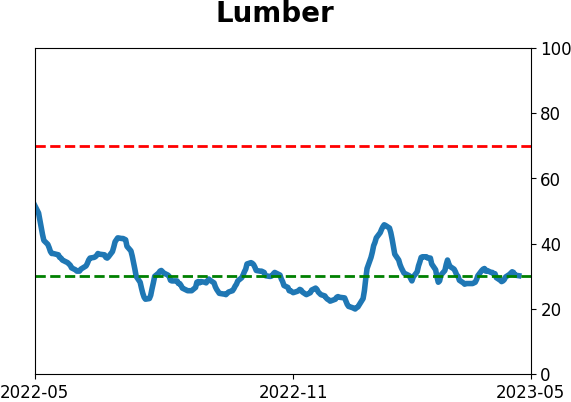
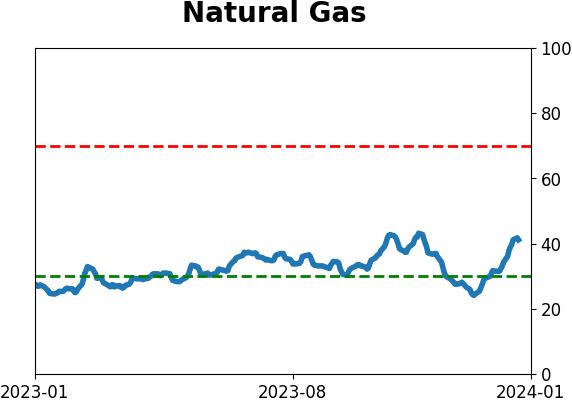
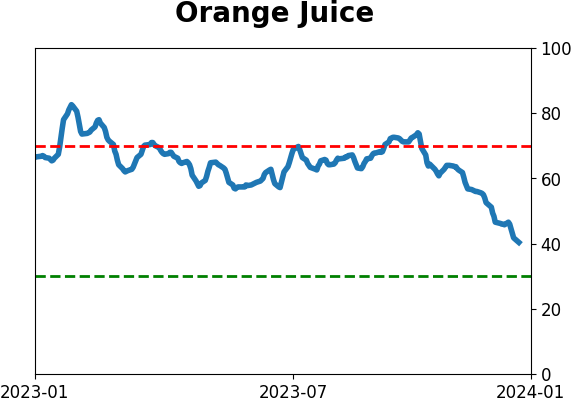
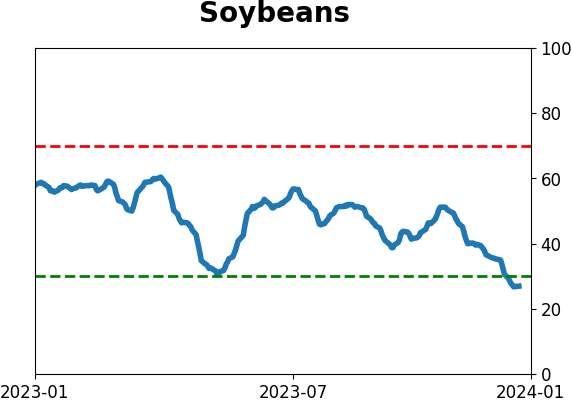
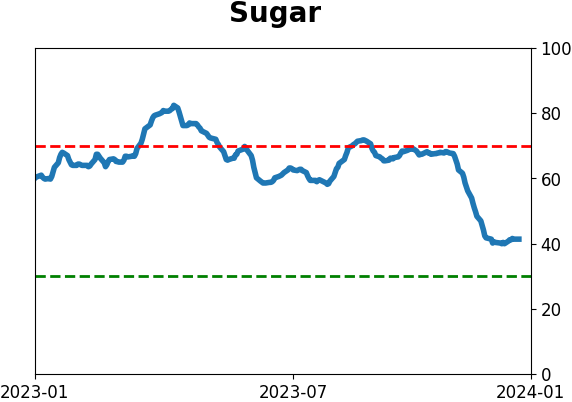
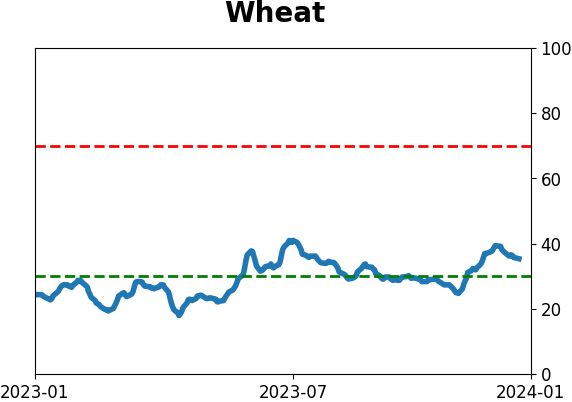
Agriculture
|
|
Research
By Jason Goepfert
BOTTOM LINE
The multi-month rally in stocks ignited Greed in traders, as evidenced by the Fear & Greed Model. It has since started to pull back, which has tended to keep going until the greed has been neutralized. We show a strategy using the new version of the Backtest Engine which tries to profit off the tendency by selling short.
FORECAST / TIMEFRAME
None
|
Key points:
- The Fear & Greed model has pulled back from an exceptional level of Greed
- When that happens, sentiment tends to keep dropping until it becomes a bit below neutral
- Trying to profit off that tendency by selling short is a difficult task, but some stocks, like Small Caps, work better
Selling short when Greed is retreating
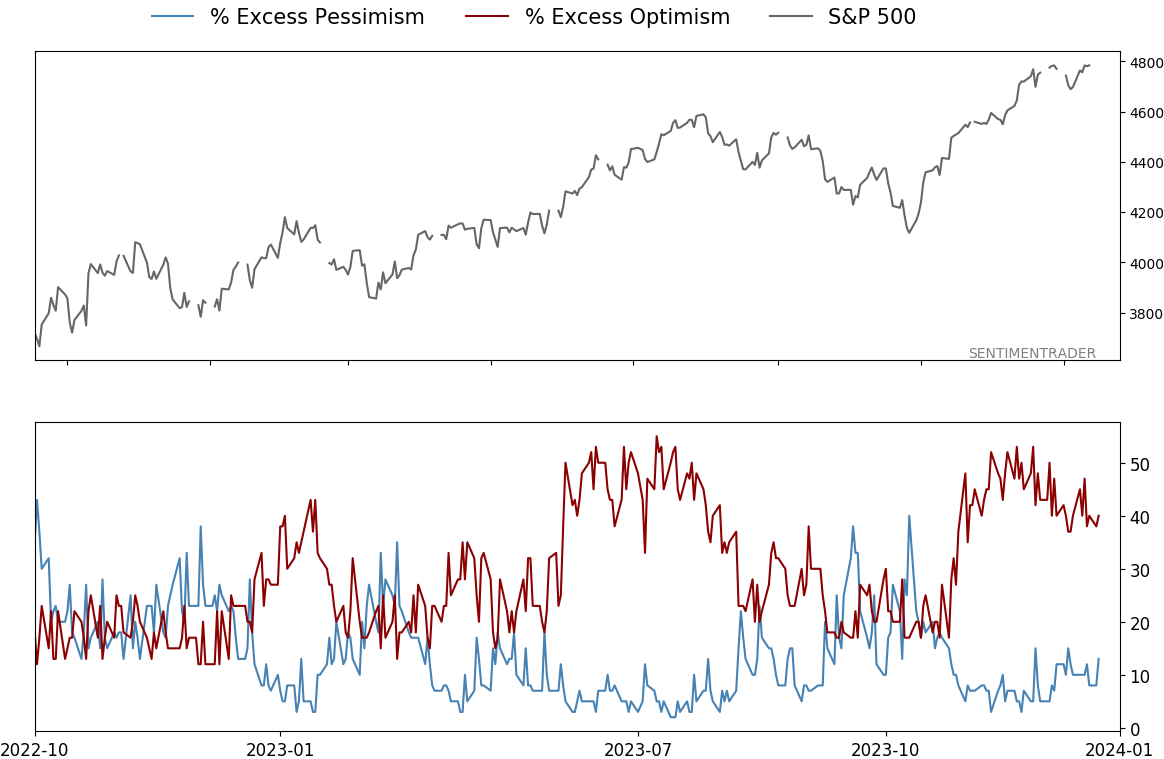
Greed is retreating. Even though stocks have rebounded to near all-time highs, the Fear & Greed Model has pulled back from one of the highest levels on record to just slightly extreme.
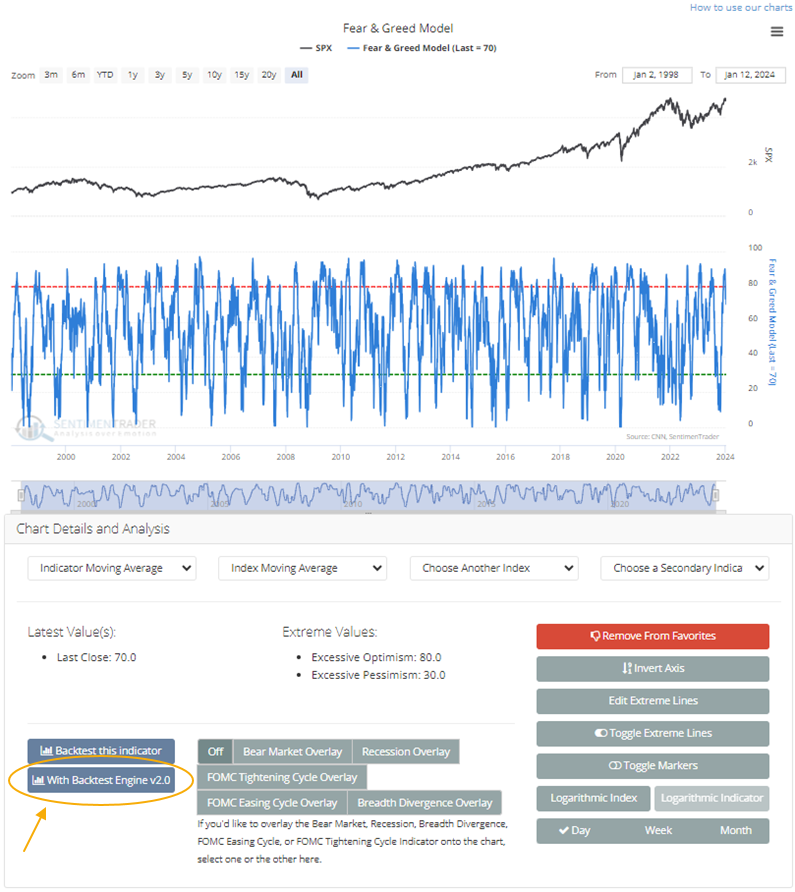
The model is based on the one published publicly by CNN, but the SentimenTrader version changed the high-yield bond and put/call ratio inputs to be less prone to the errors inherent in the CNN version of the model. That also allowed the creation of a longer historical record.
Since the 2001 peak, when the model suggested that traders were supremely Greedy and then started to become less so, the S&P 500 declined until Greed was gone entirely, and the model dropped below neutral.
Using the new version of the Backtest engine, users can recreate this behavior, see how various stocks or indexes performed afterward, and even create realistic trading strategies.
Let's theorize that when traders become exceptionally optimistic and start to doubt themselves, they sell stocks until Greed is completely gone. That is easily tested in the new Engine. If a user is on the Fear & Greed chart, click the "With Backtest Engine 2.0" button.
When the Engine loads, change the symbol to SPY. Then, to make the test more realistic for real-time trading, change the Trade Price to "Next Open" and the Direction to "Short." This means we will short SPY at the next day's open when the entry conditions are met.
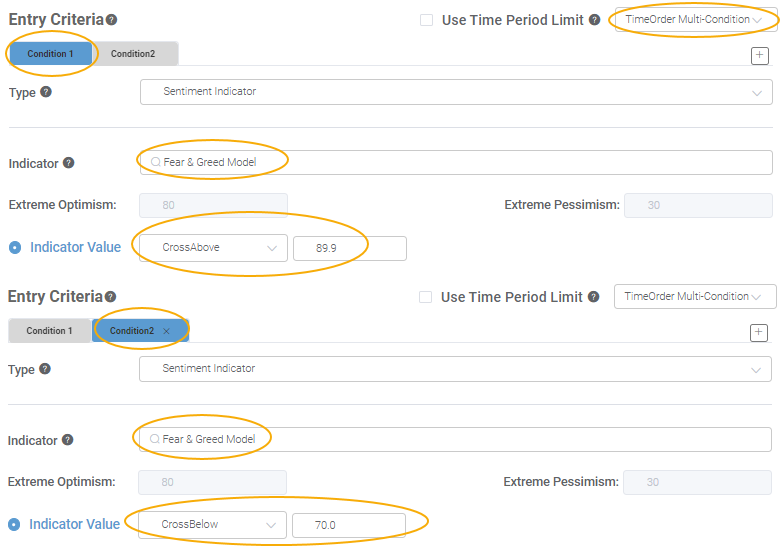
To enter the trade, we will require Greed to become exceptional and start pulling back. To accomplish this, select "TimeOrder Multi-Condition." That's just a fancy way of telling the Engine that something happened, and THEN something else happened.
For our test, we'll ask the Engine what happens when Fear & Greed reaches at least 90 and falls below 70. Click on Condition 1 so the tab is blue, make sure Fear & Greed is selected as the Indicator, then choose CrossAbove and enter 89.9. Then click Condition 2, enter Fear & Greed as the Indicator, and select "CrossBelow" 70. If you want to include only those times when Greed pulled back within a certain number of days, you can click the "Use Time Period Limit" box and select the number of days.
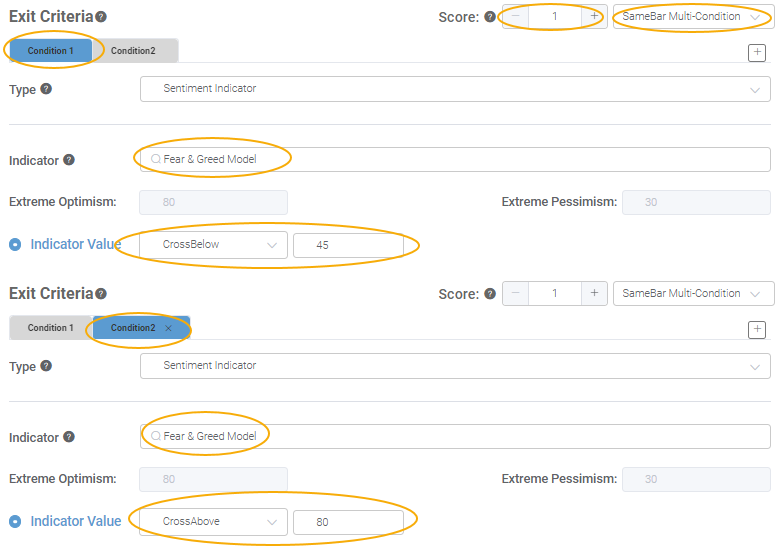
Now, we need to tell it when to get it out of our short trade. It's very flexible, and we could tell it to get us out after 20 days (or however long we want), or at a 3% stop loss (or whatever percent we choose), or a profit target, or many dozens of other factors. But since our theory is that stocks will drop until Greed is gone, let's use that as our exit.
Sometimes, using an indicator as the only exit will trap us in a trade. If we wait until Greed is gone, sometimes we'll have to wait for months because stocks just kept chugging higher. So, we'll exit either when Greed is gone or until it rebounds and becomes optimistic again. We'll use the indicator as a type of stop loss.
To accomplish this, in the Exit Criteria area, select "SameBar Multi-Condition" and (this is important!) change the Score to "1." Changing the Score to 1 means that the trade will exit if the first condition OR the second condition triggers.
For Condition 1, select Fear & Greed as the Indicator and "CrossBelow" 45. That will exit the short position when Greed drops a bit below average. As a type of stop loss, select the Condition 2 tab and then exit if Fear & Greed rebounds to CrossAbove 80.
These are not going to be gigantic winning trades. It will only tell us how SPY has typically behaved when sentiment gets supremely greedy, retreats, and then either returns to normal or becomes greedy again.
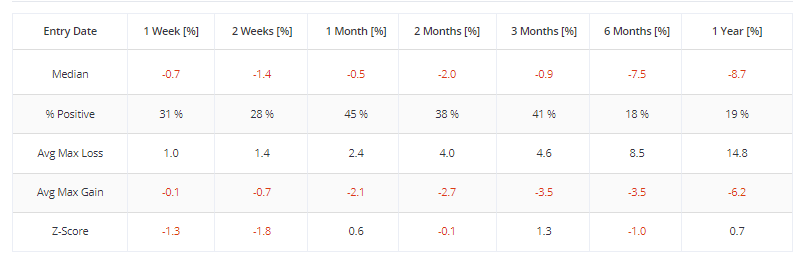
When the test is complete, and you see the summary information, you can scroll down and see that returns were mixed. It isn't easy to create a short-selling system for something like SPY. Still, in recent years, it has succeeded, at least in terms of profitable short trades.
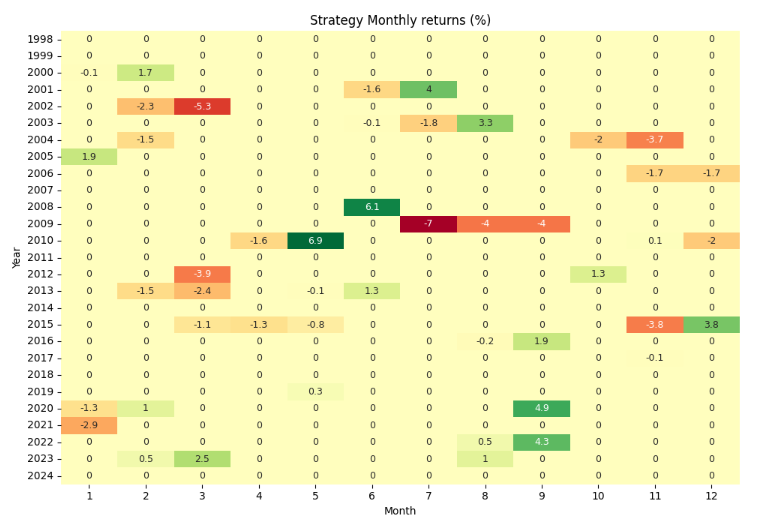
If you click the "Exit with different Time-In-Market frame" tab, you can see the individual dates of the trades and how the short position would have fared over various time frames. While it wasn't a great trade, the next month showed a 45% win rate, which means if you had entered the trade after Greed pullback back to 70 and stayed short for one month, your short sales would have been profitable 45% of the time.
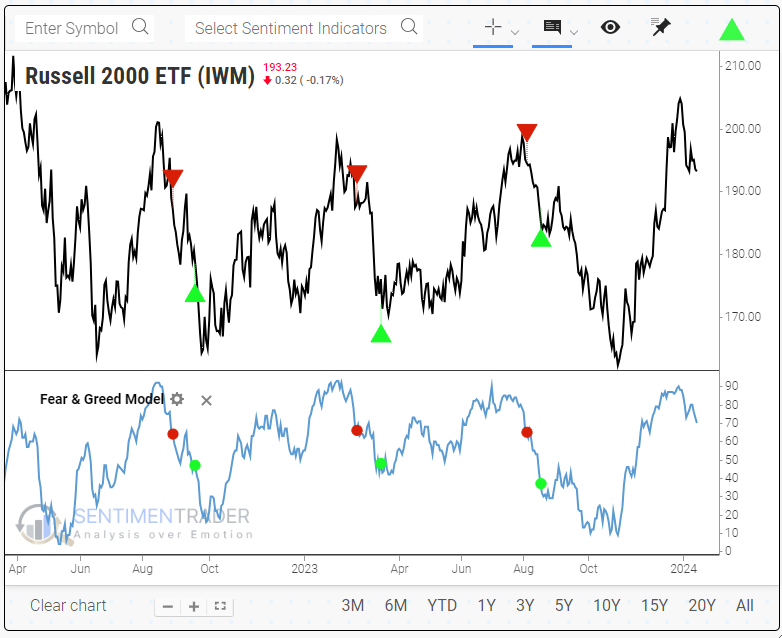
You can edit the test to choose different indexes, ETFs, or individual stocks. If we change the market to the small-cap Russell 2000 ETF, IWM, then it was a more successful strategy. Small-cap stocks have tended to pull back more consistently when traders ease back on their extreme bullishness.
What the research tells us...
When market participants become supremely optimistic that stocks will continue to rally in the weeks ahead, returns tend to moderate. The first pullback in extreme sentiment tends to keep going until Greed is mostly gone and sentiment has returned to neutral. But it can be difficult to profit from that tendency because 1) stocks usually go up, and 2) nothing's perfect.
A relatively simple trading strategy to try to profit off this tendency has been helpful for modest short-term gains in recent years but not over a longer time frame. If trying to profit off the tendency, a better trading vehicle has been something like IWM, as small-cap stocks have tended to revert more than larger stocks. If nothing else, going through an exercise like this will show the power and flexibility of the new Backtest Engine and its place as a tool to test theories and assumptions.
Indicators at Extremes
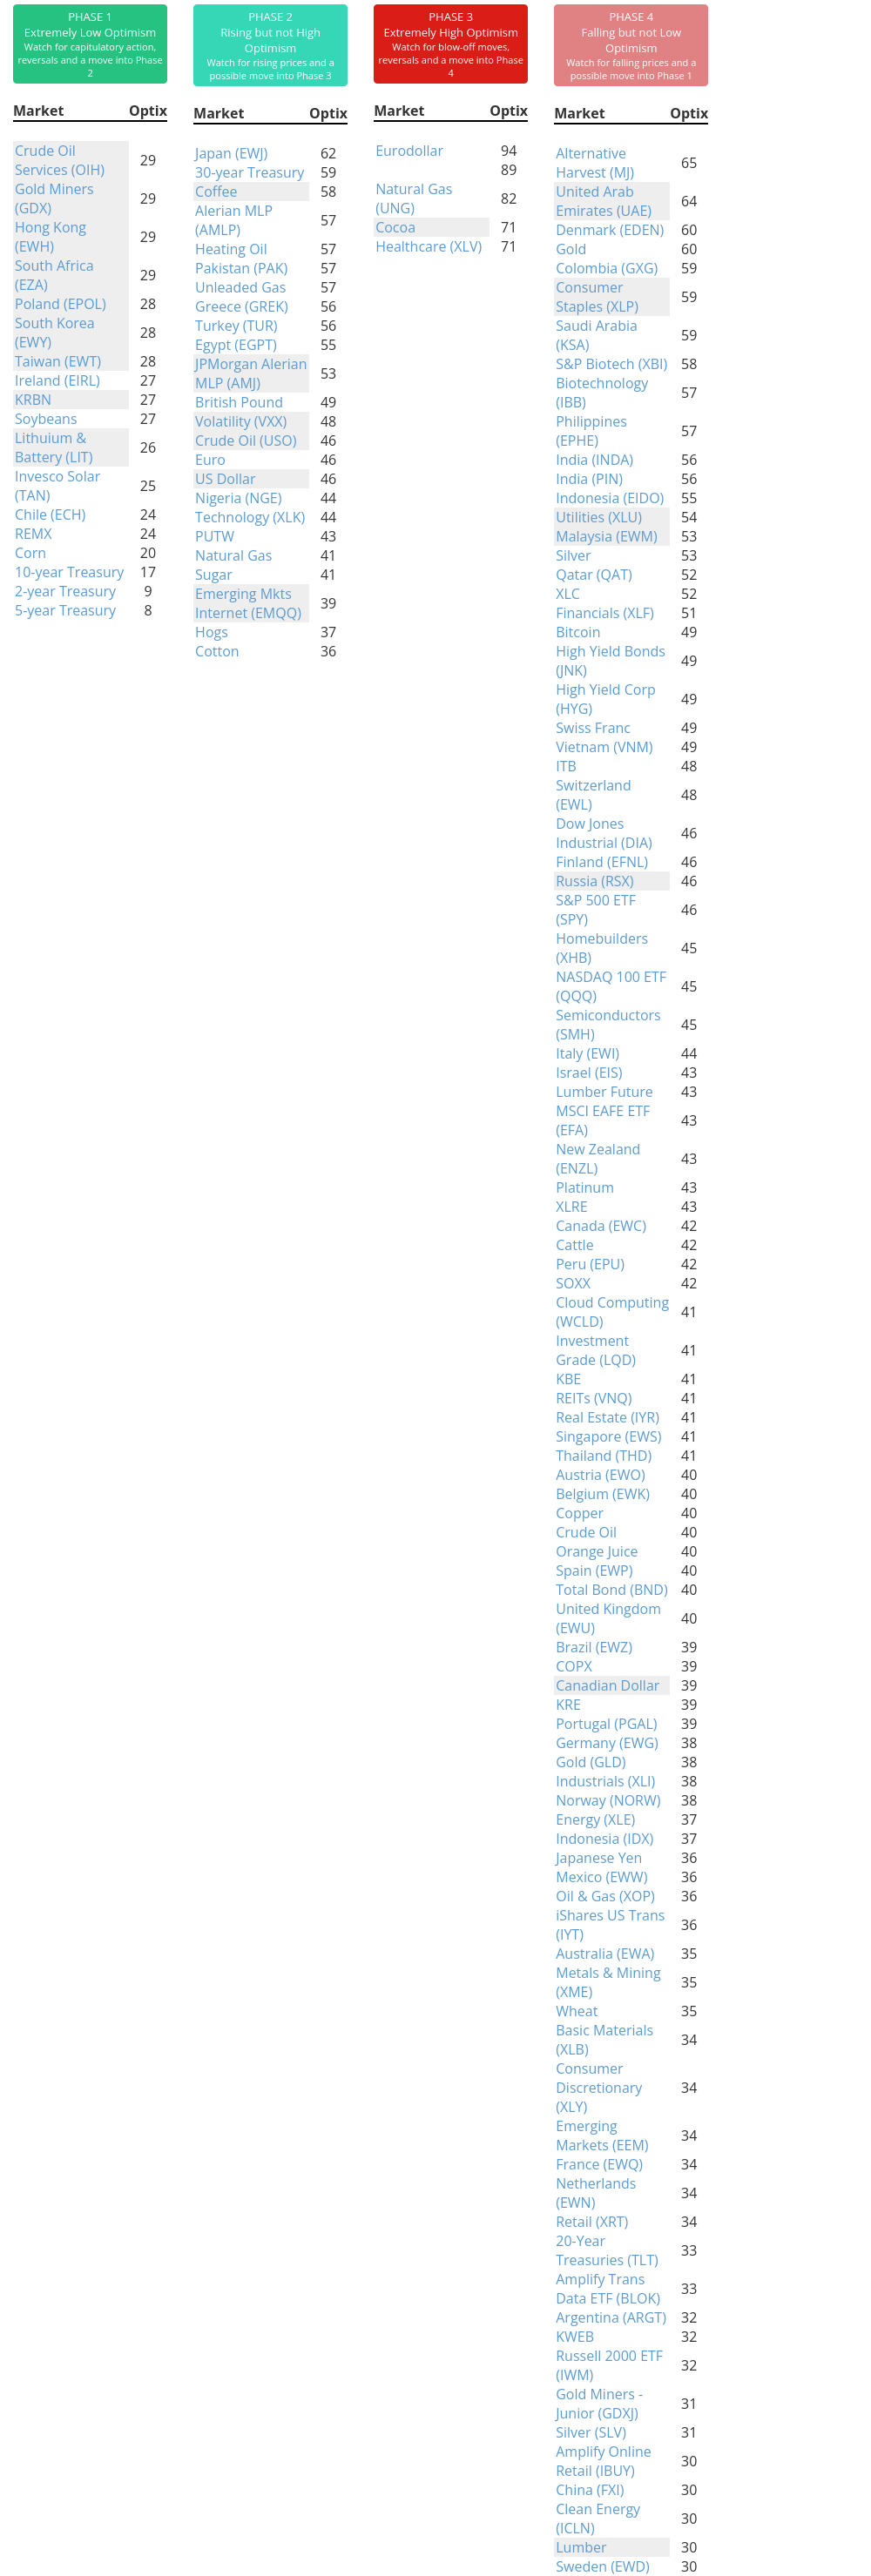
Phase Table
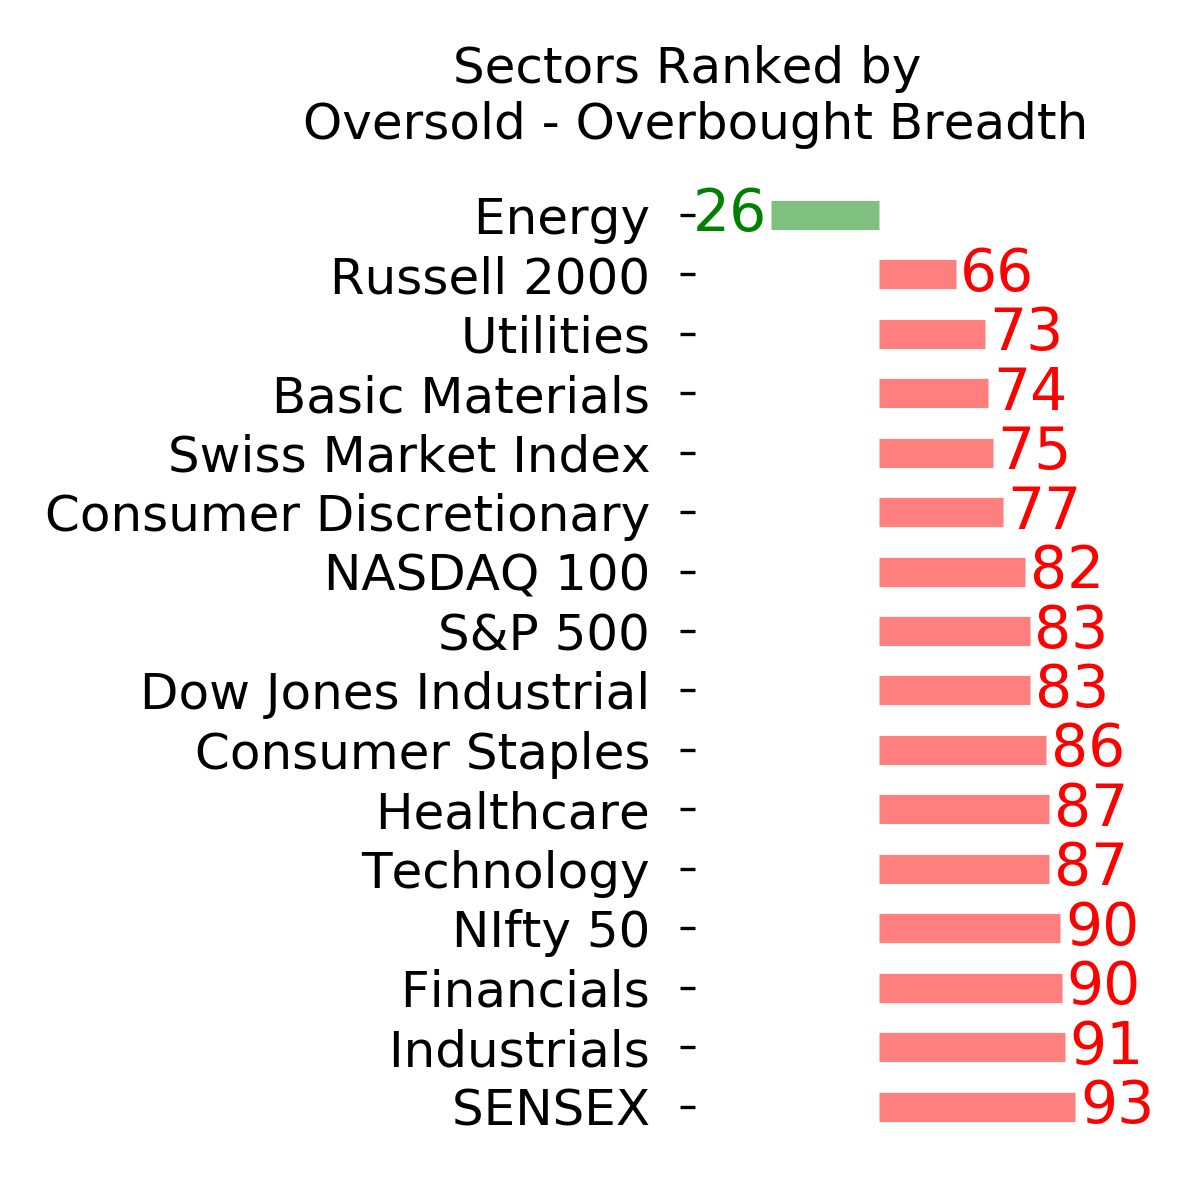
Ranks
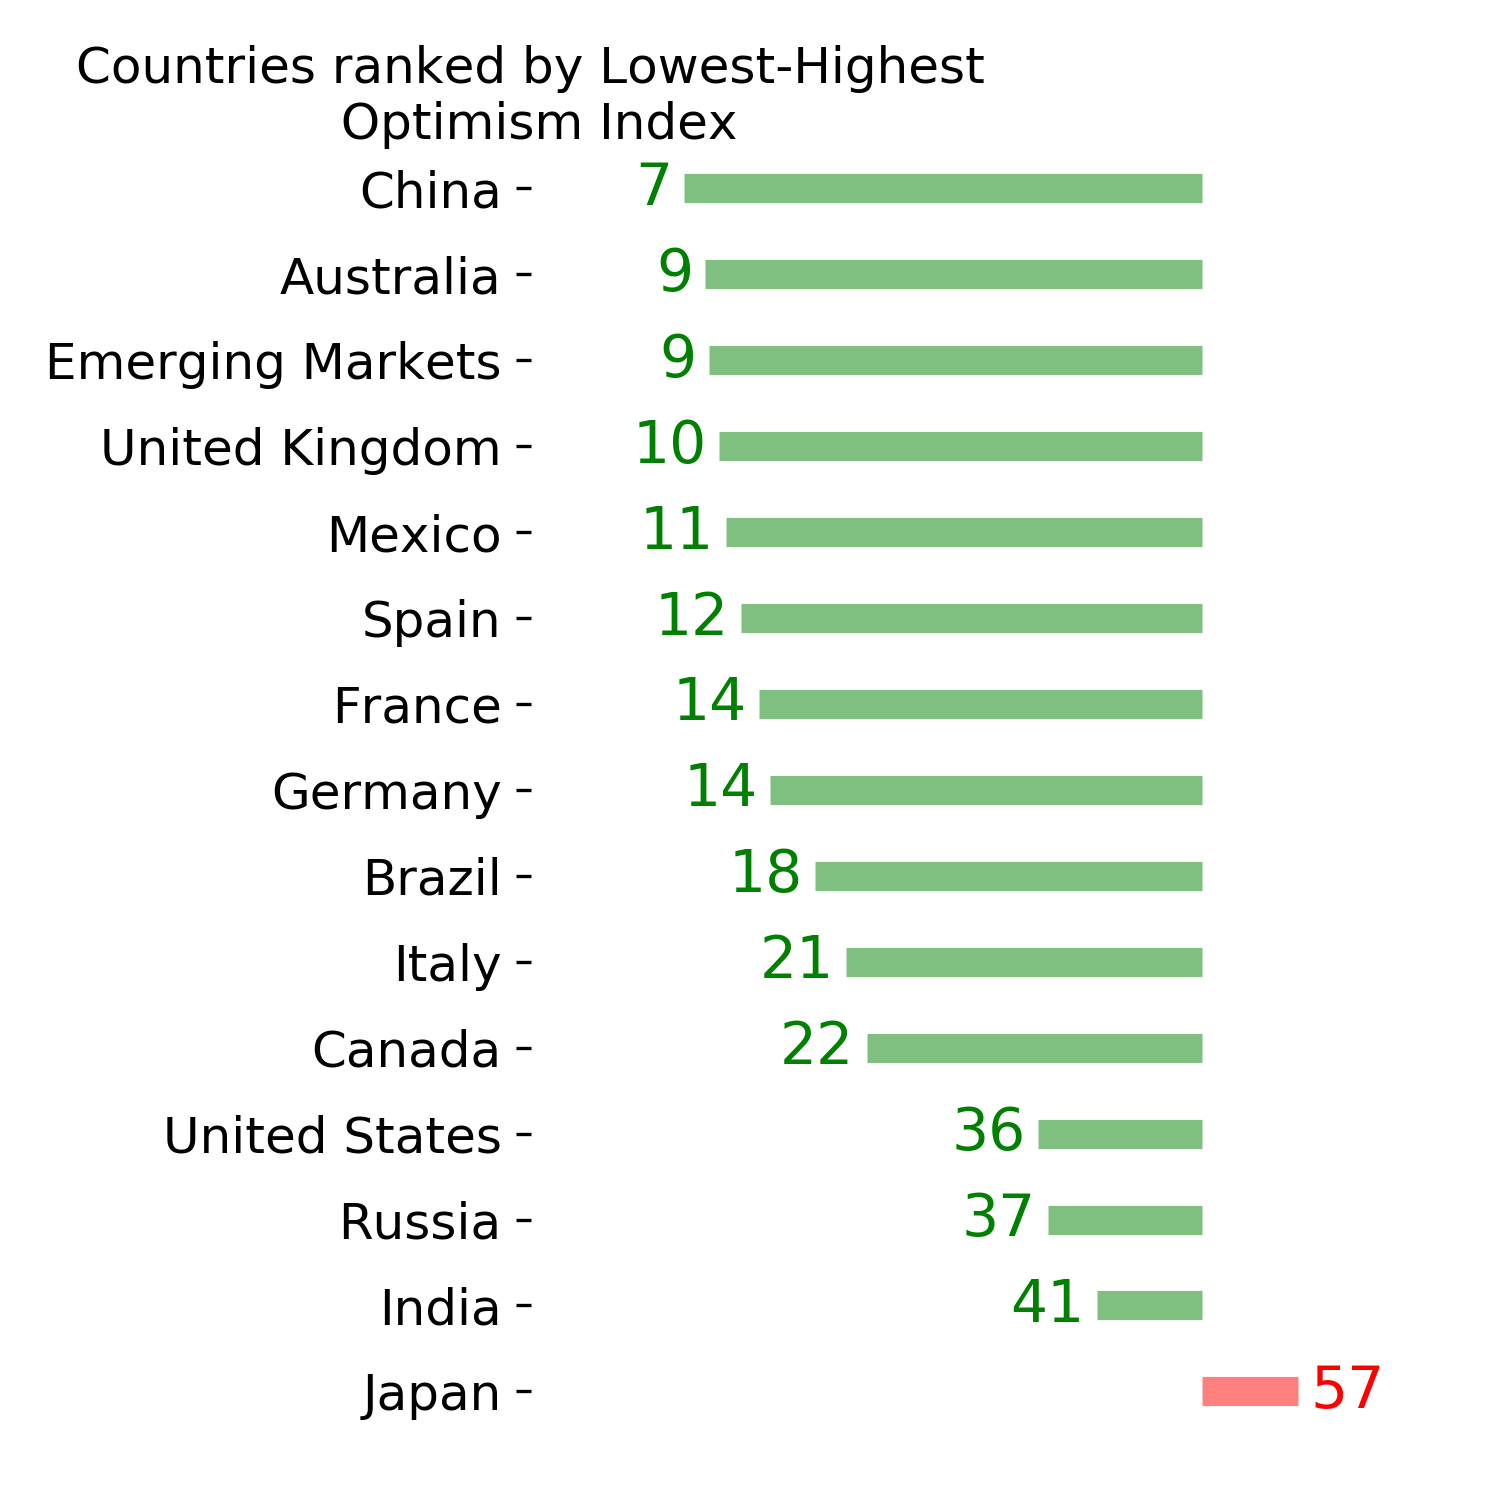
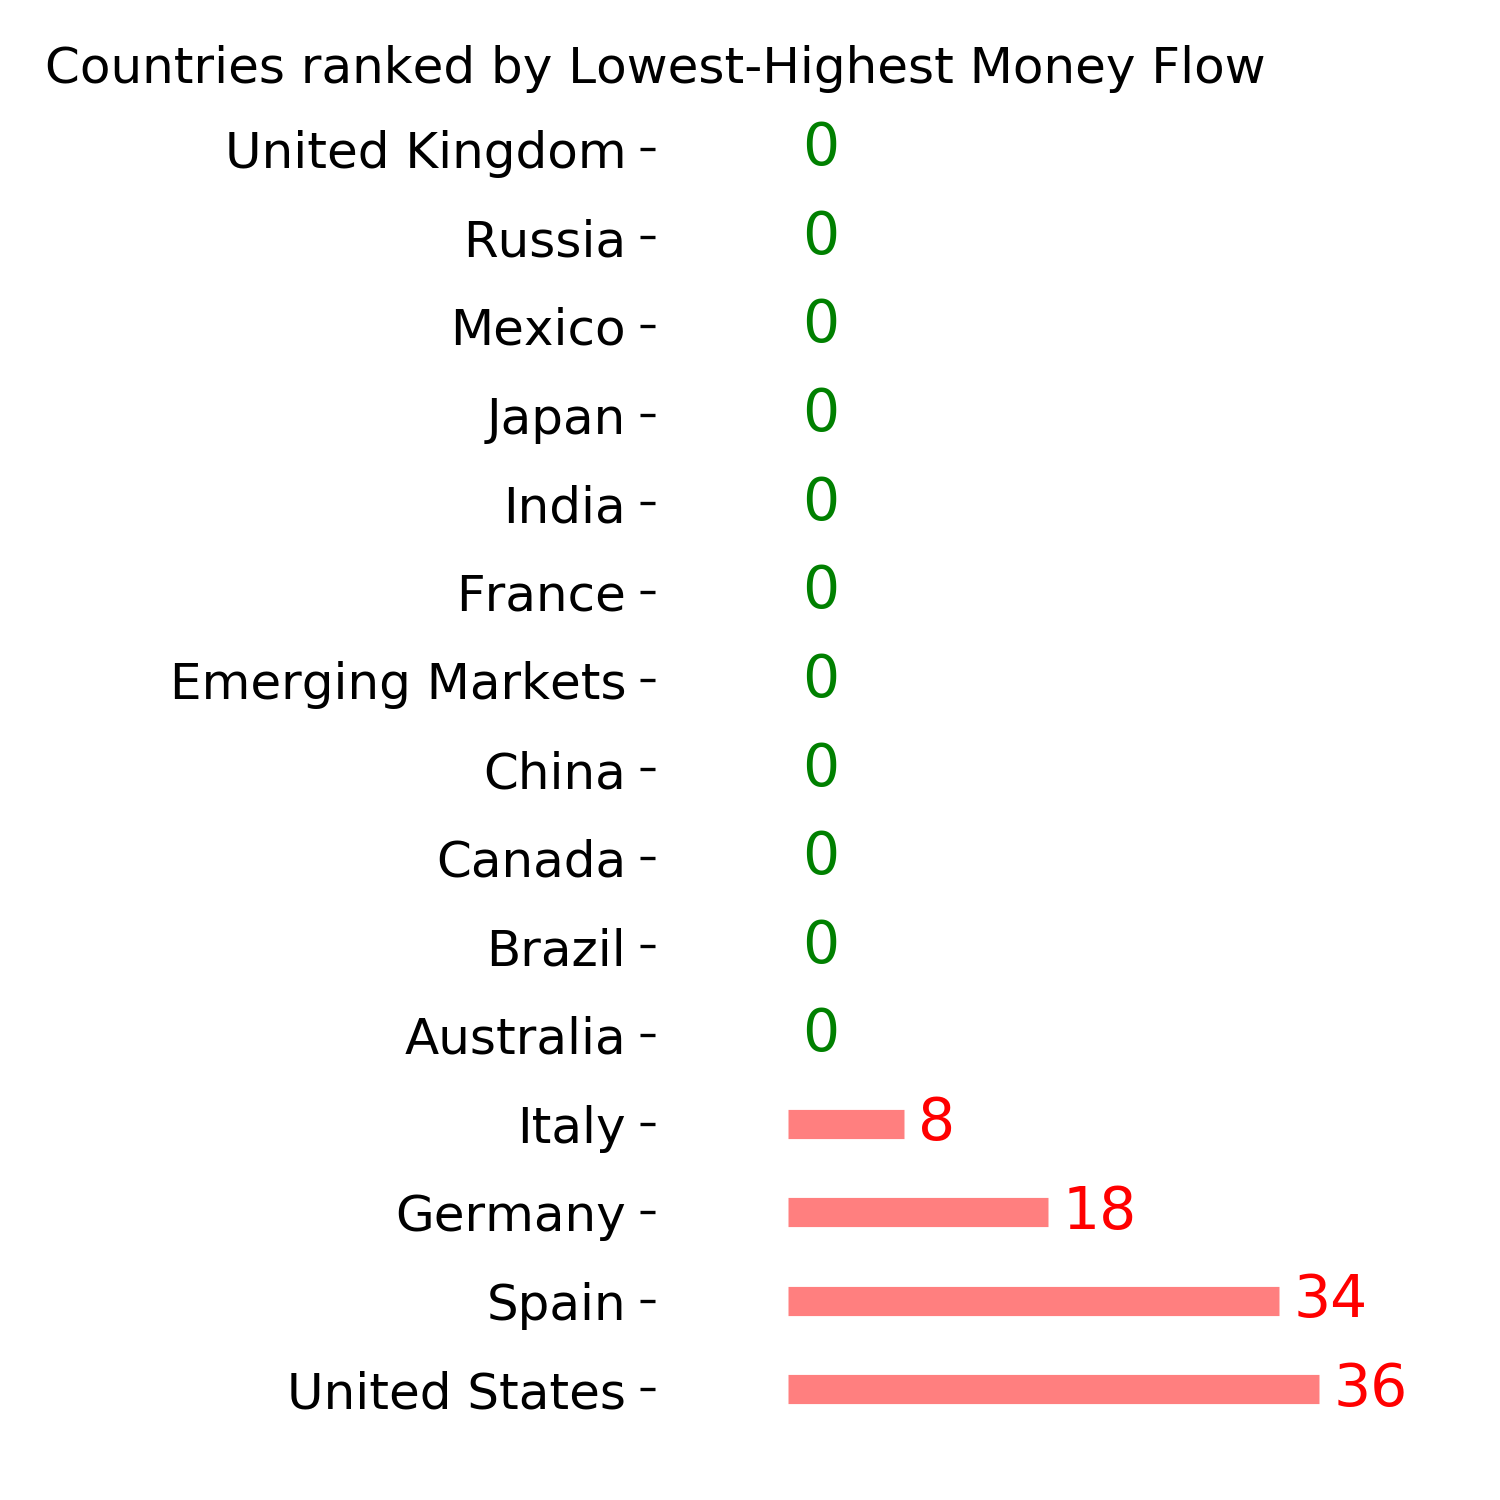
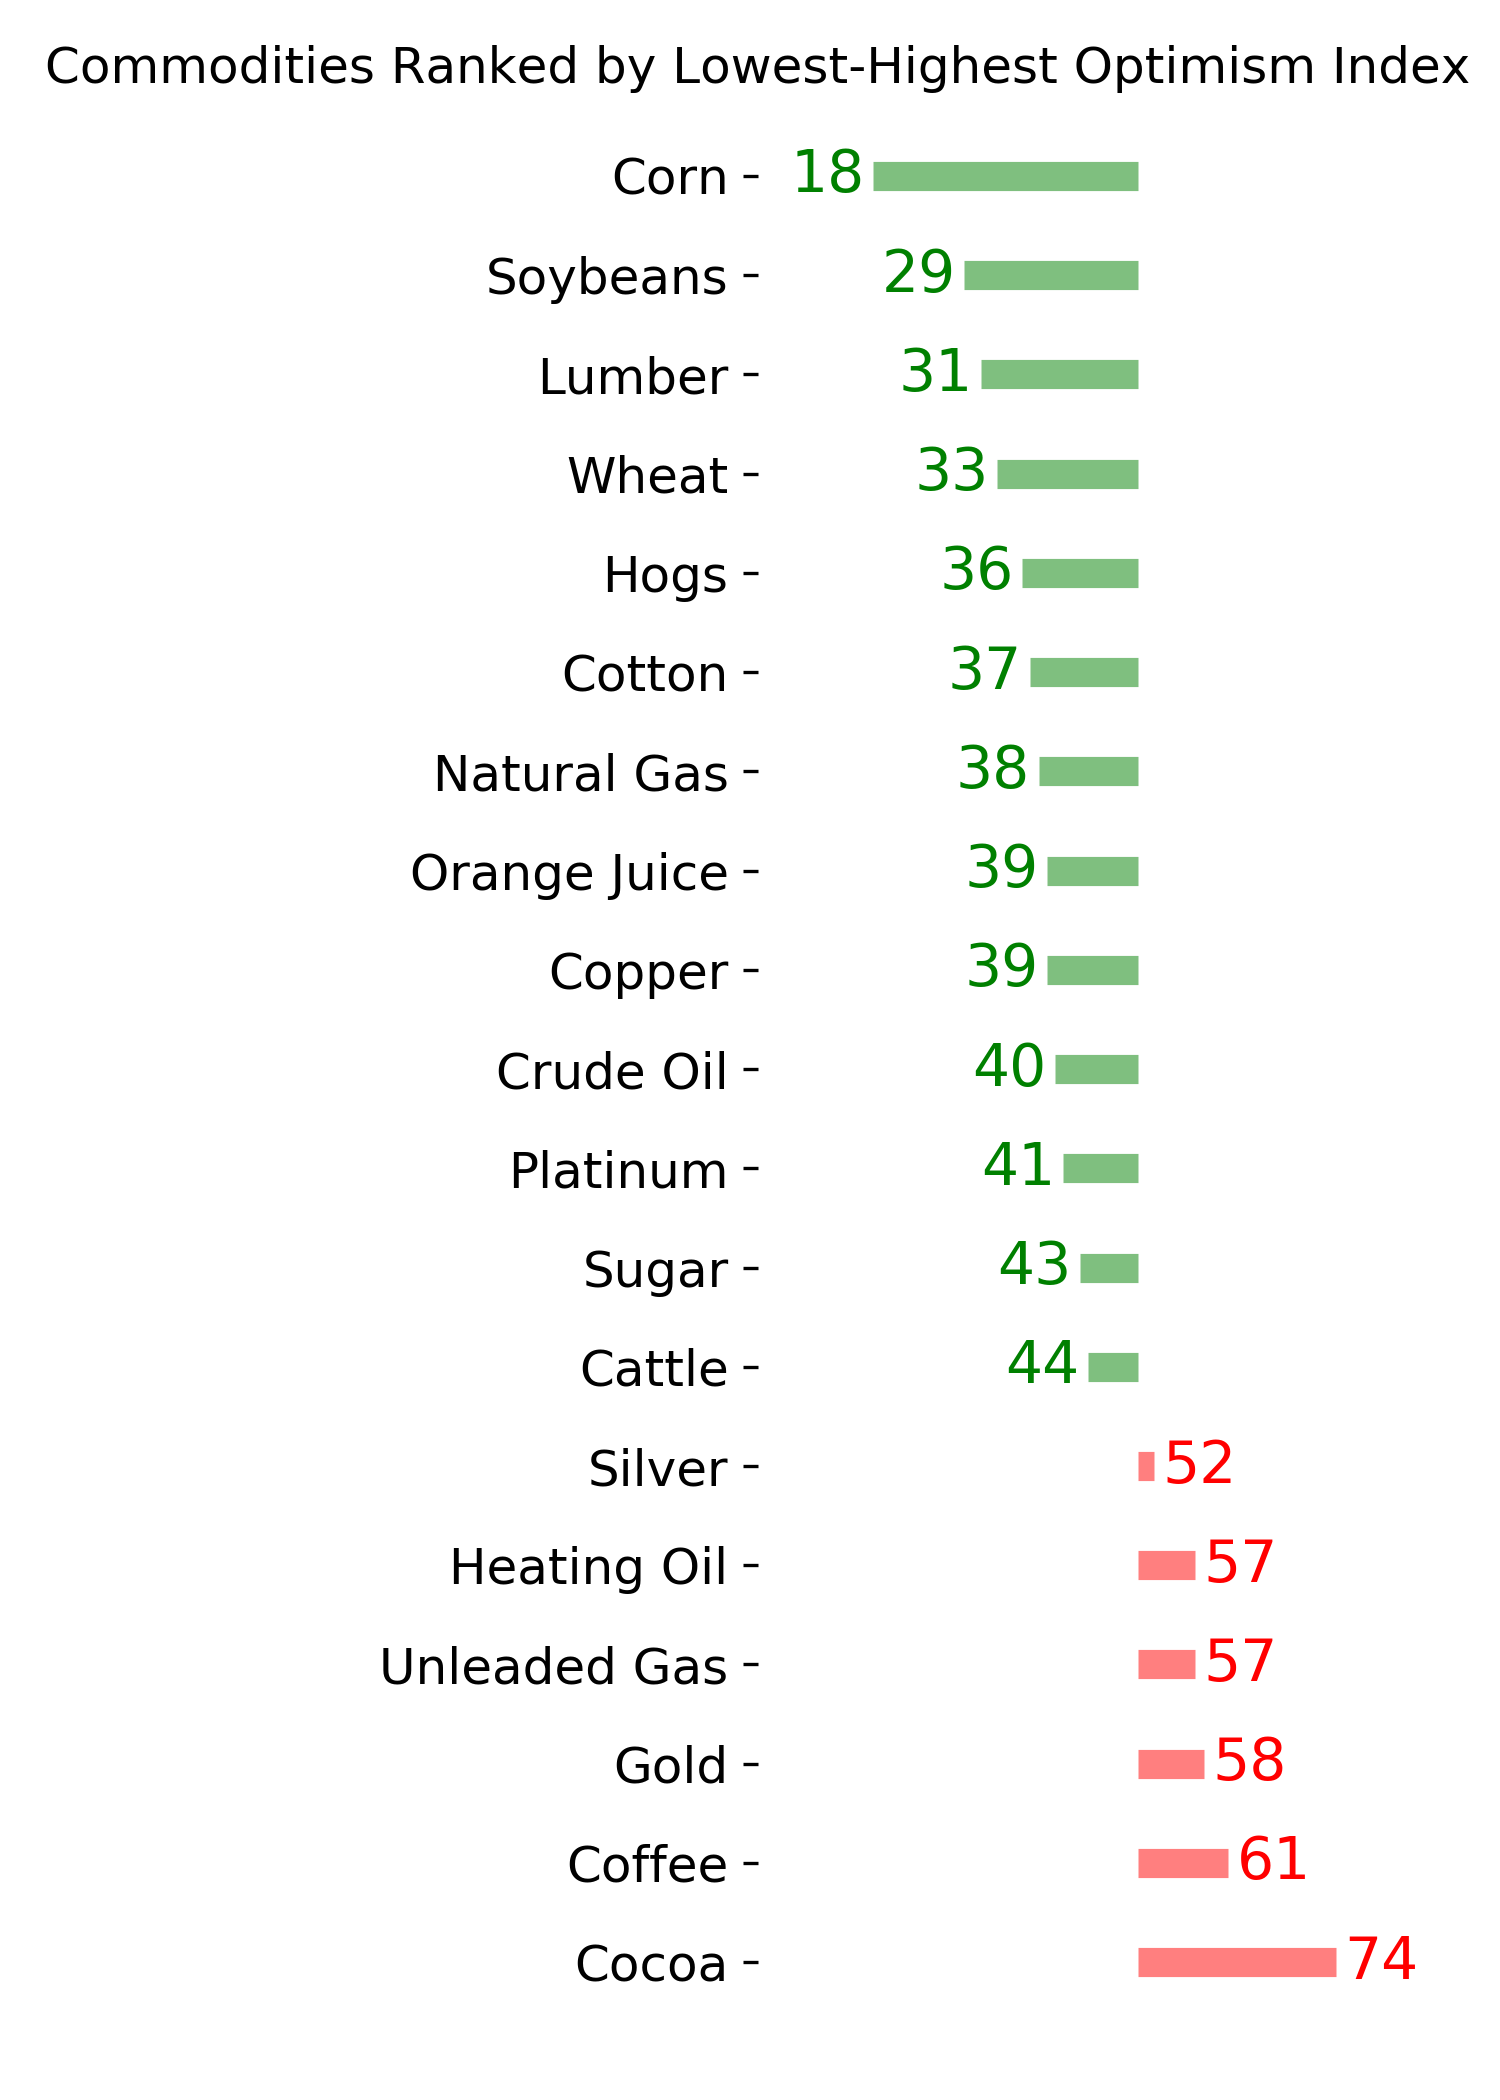
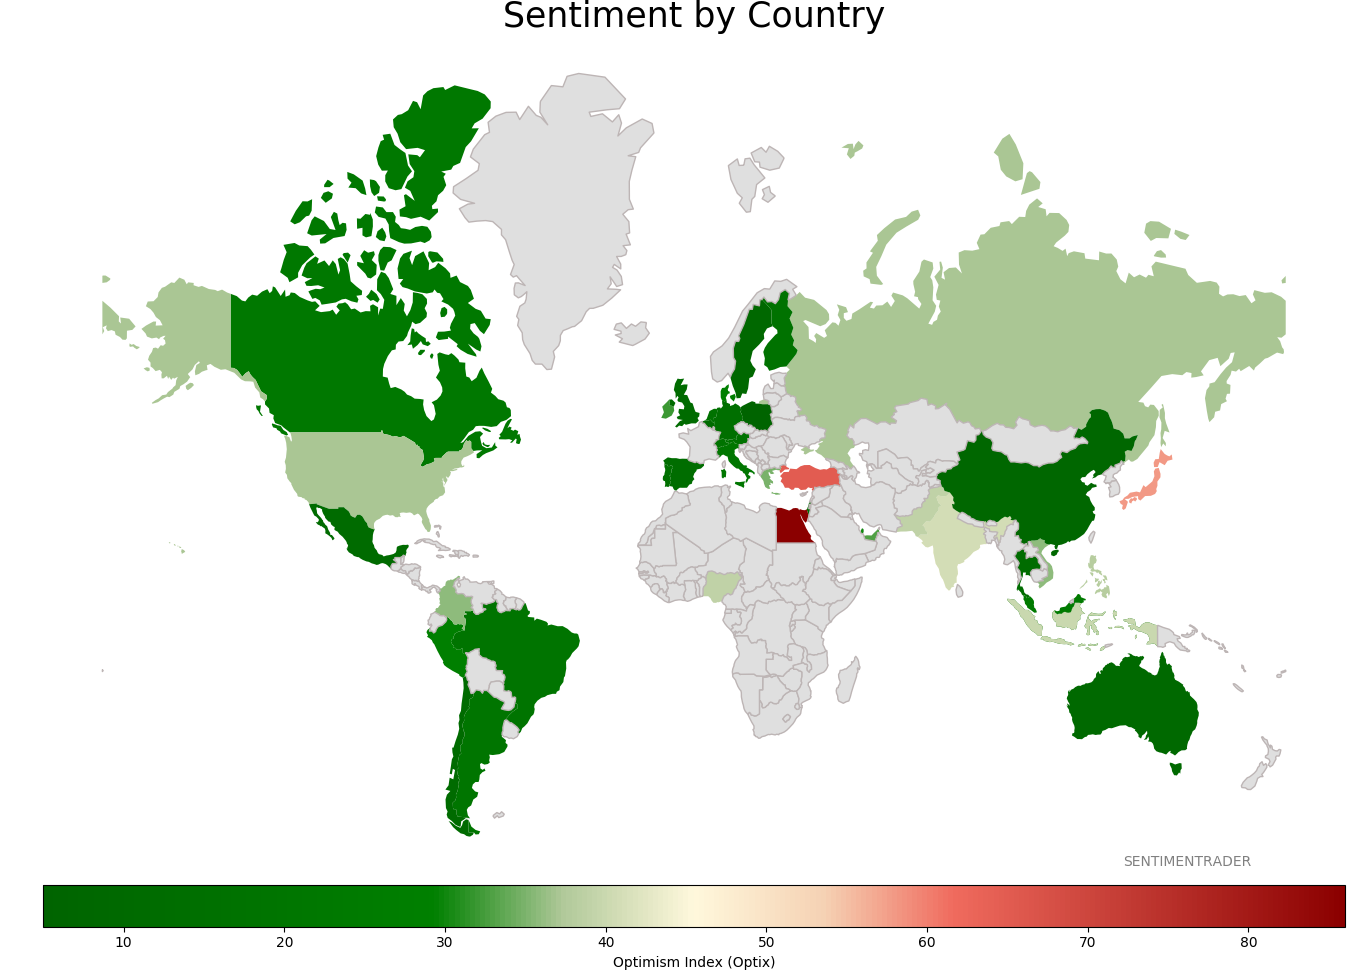
Sentiment Around The World
Optimism Index Thumbnails
|
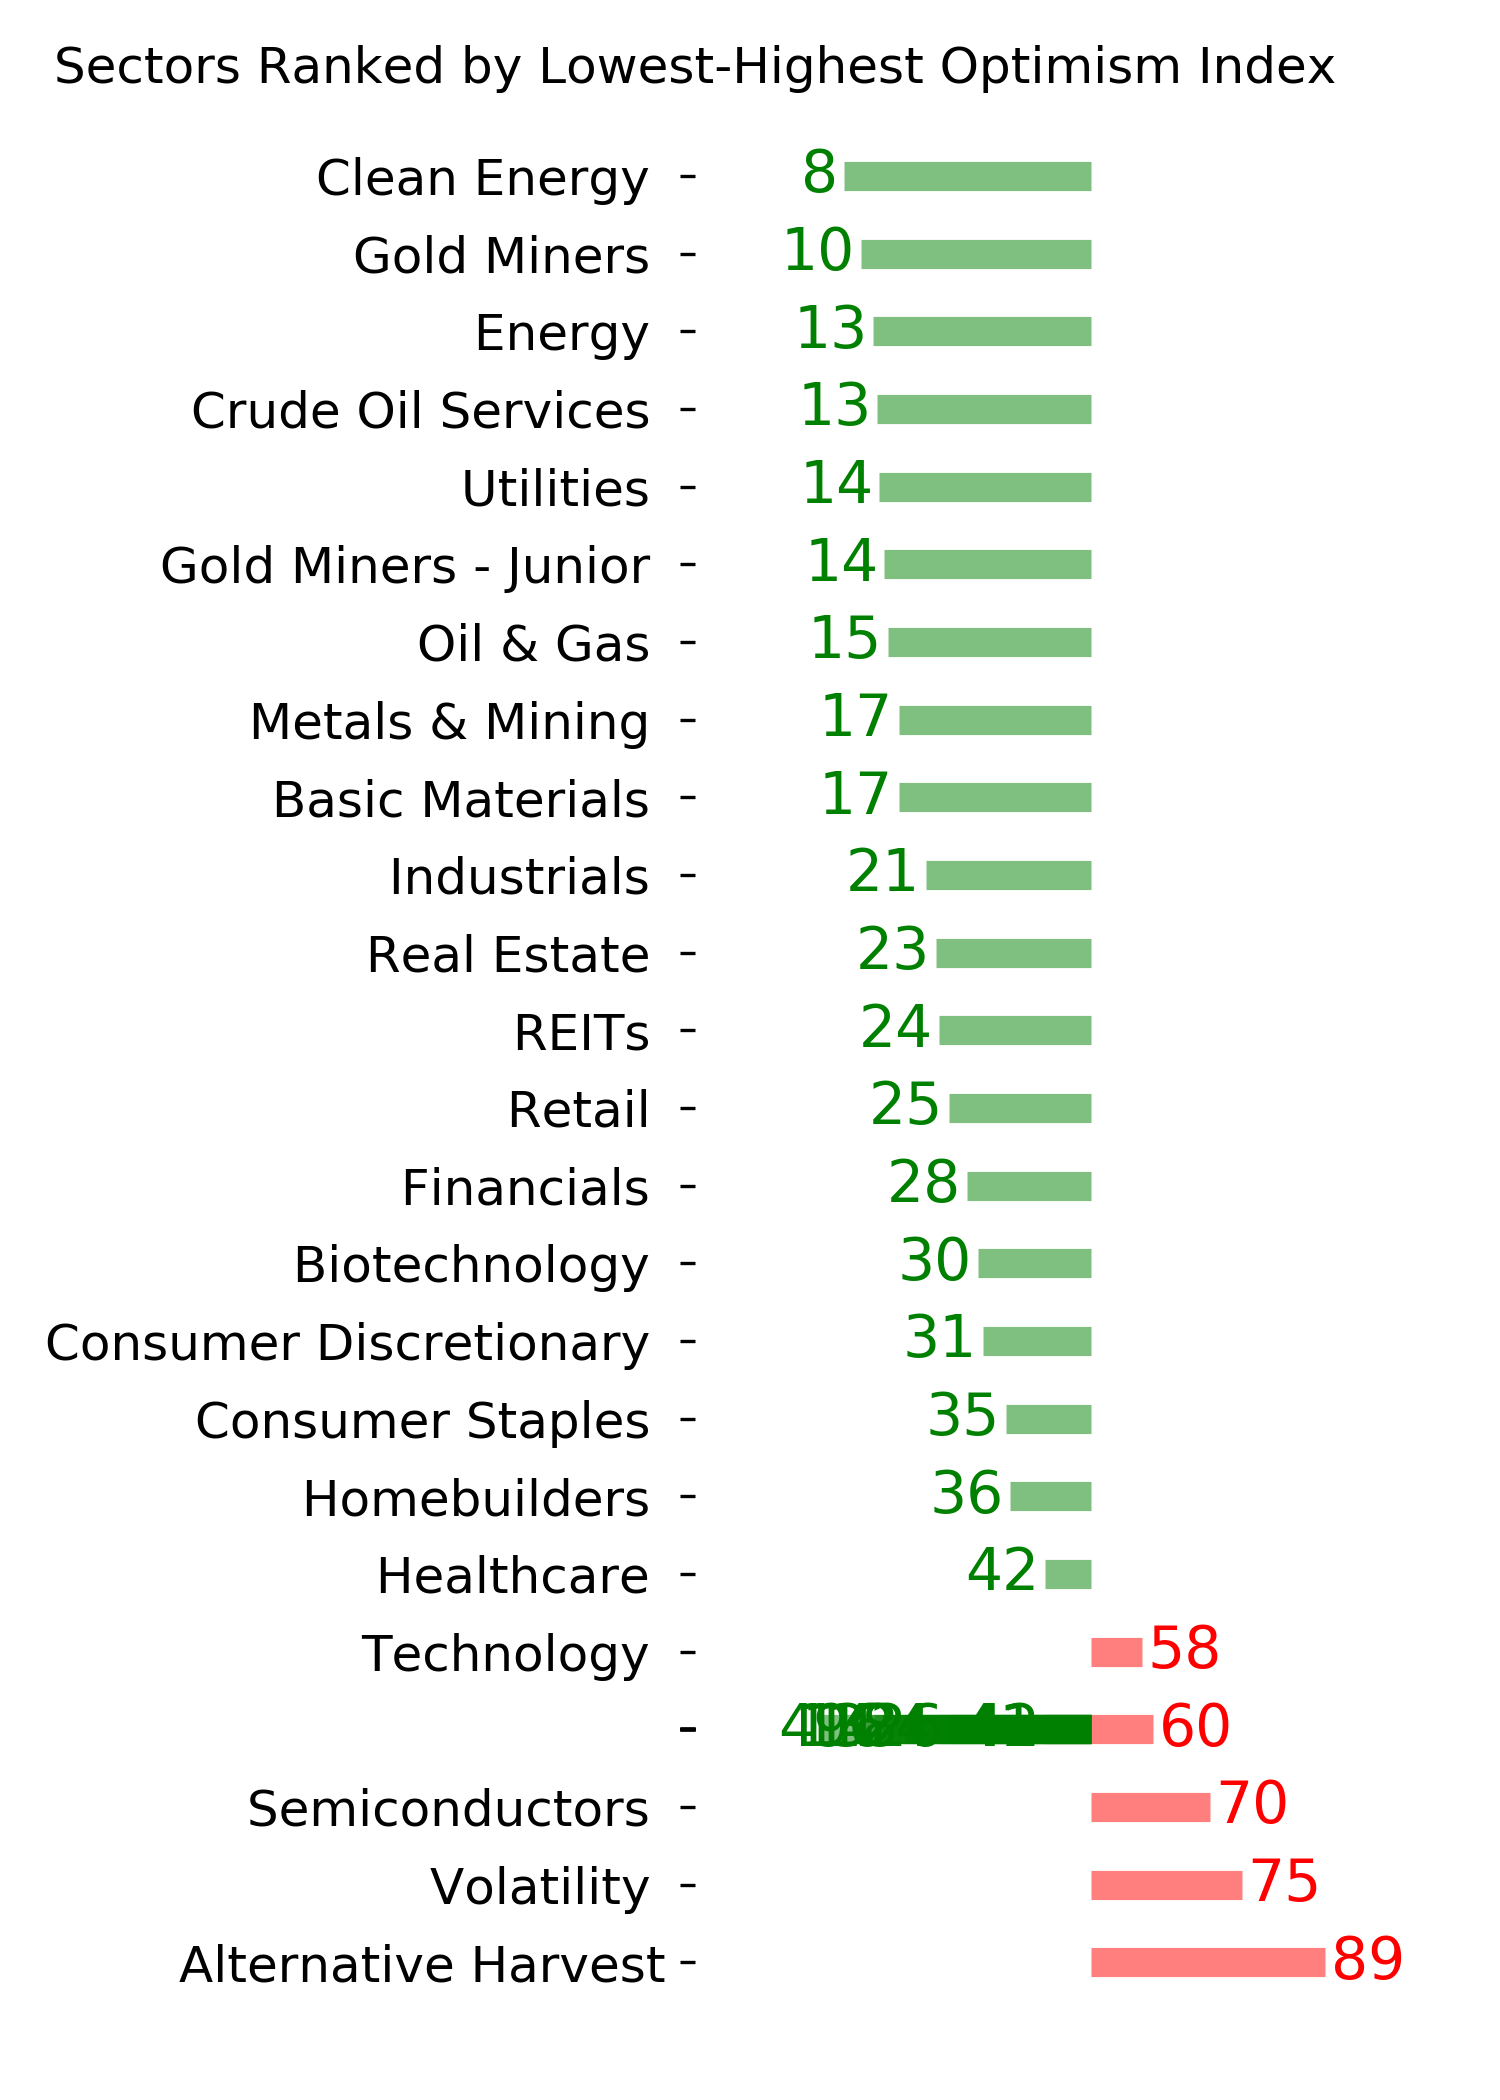
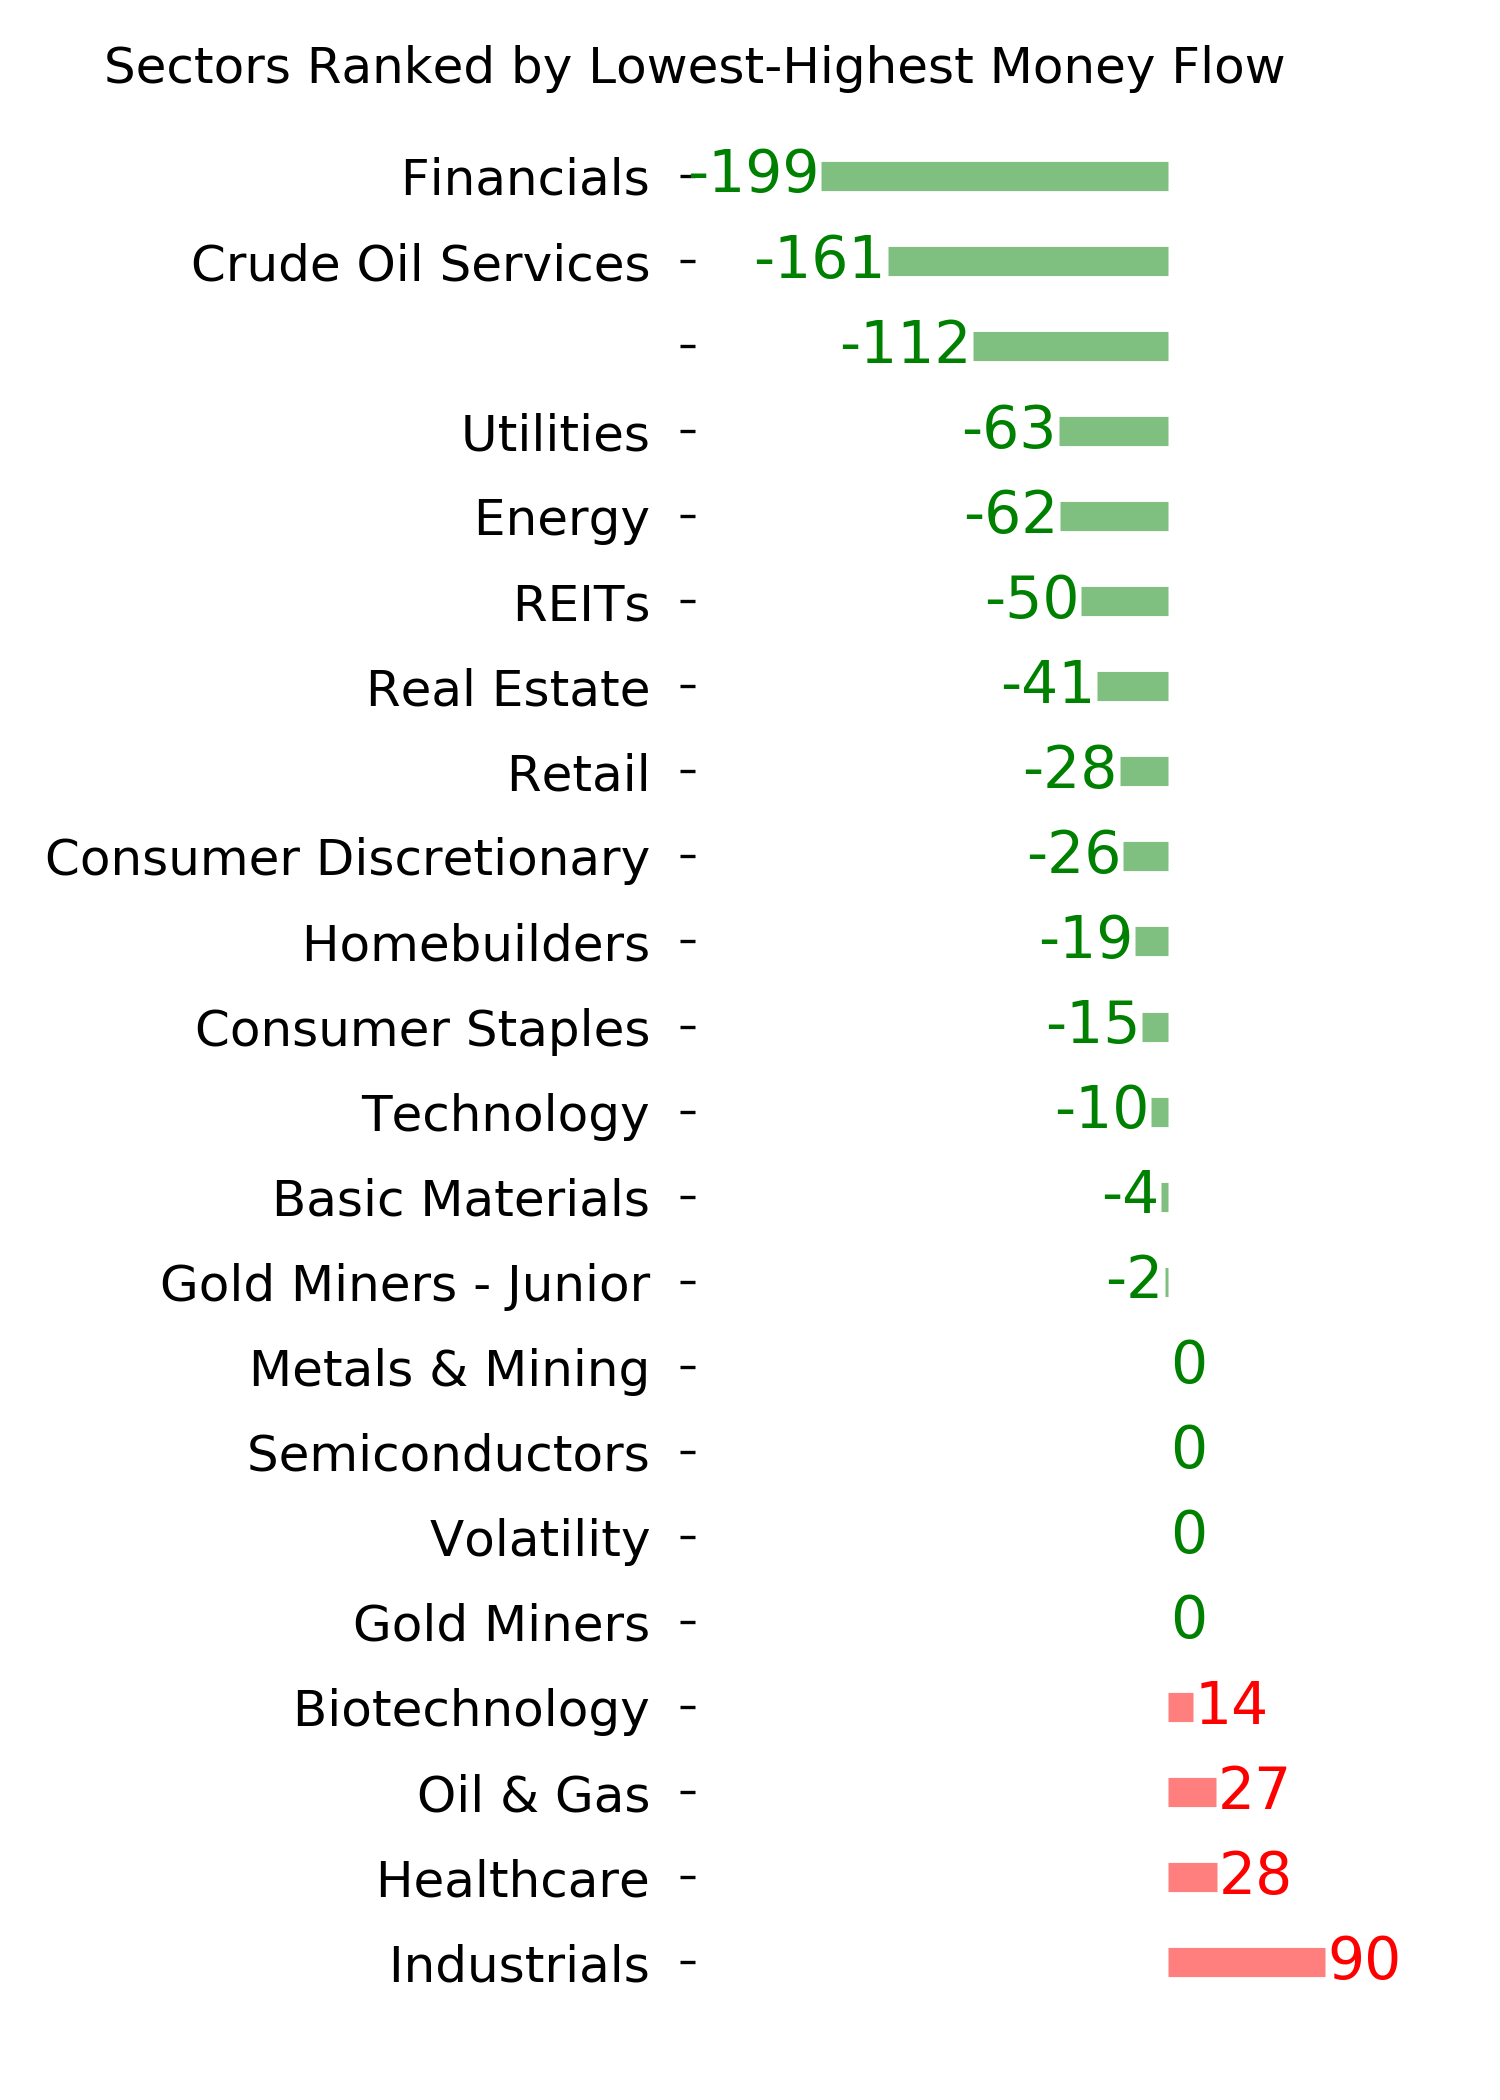
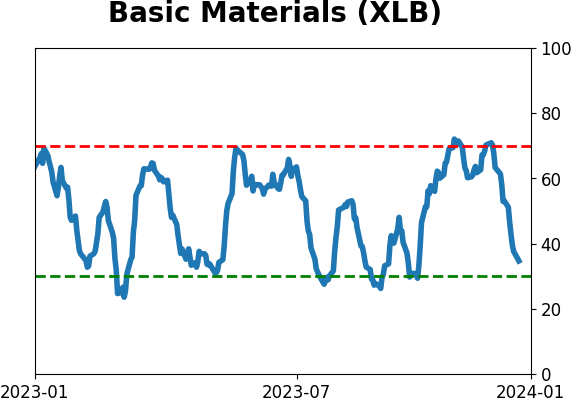
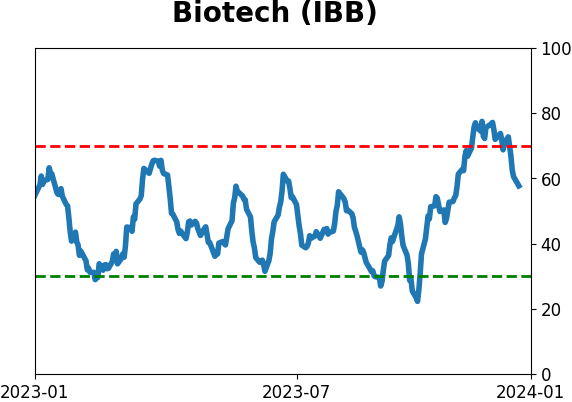
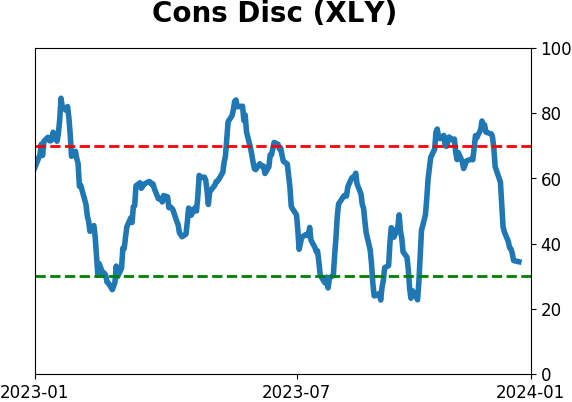
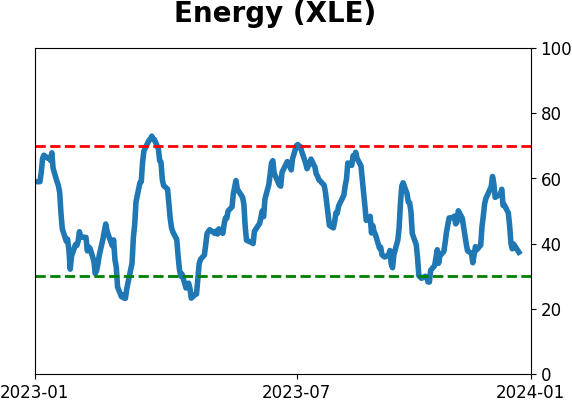
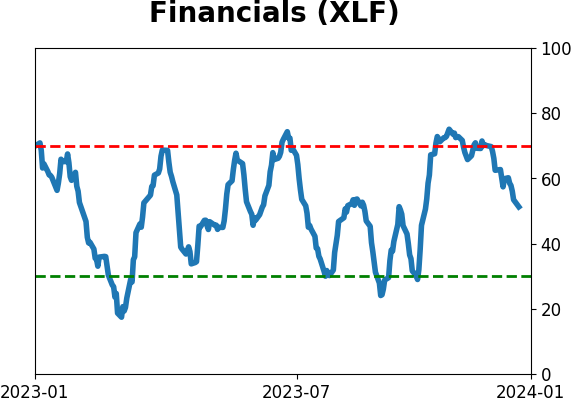
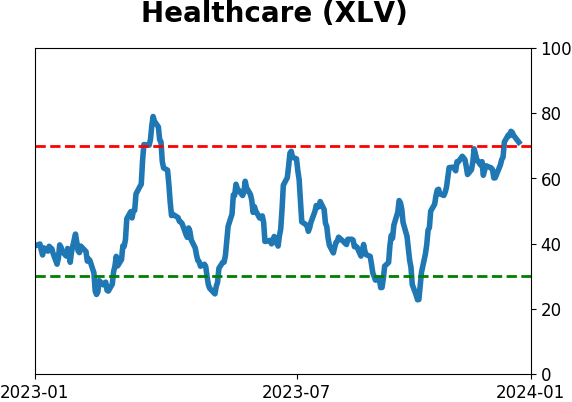
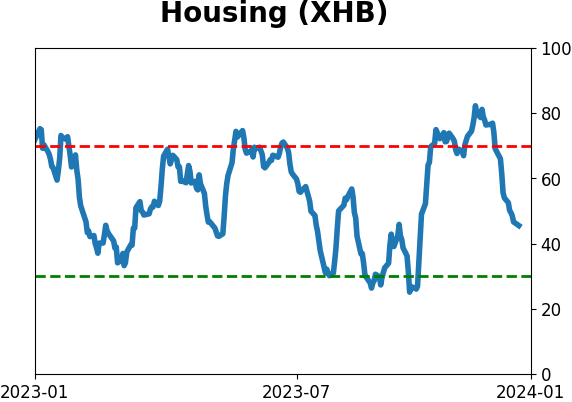
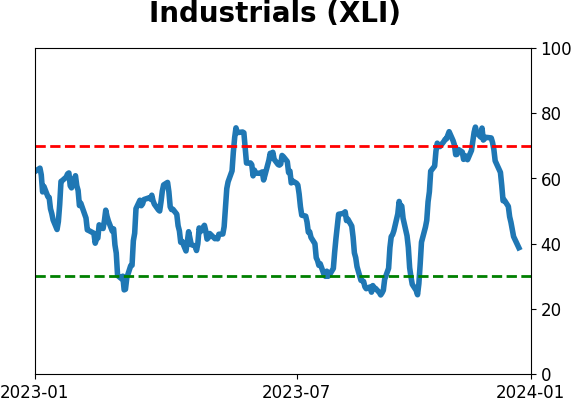
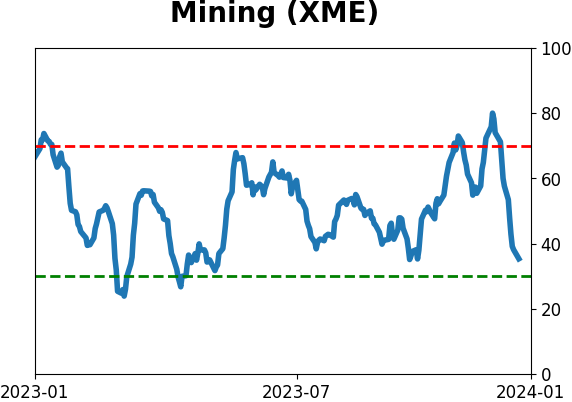
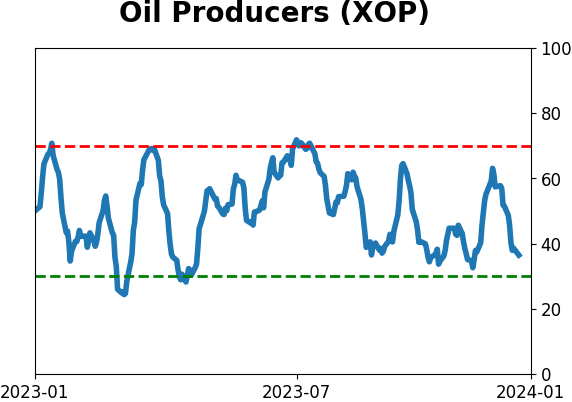
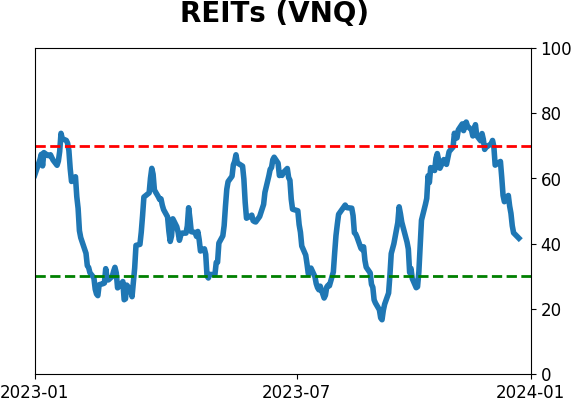
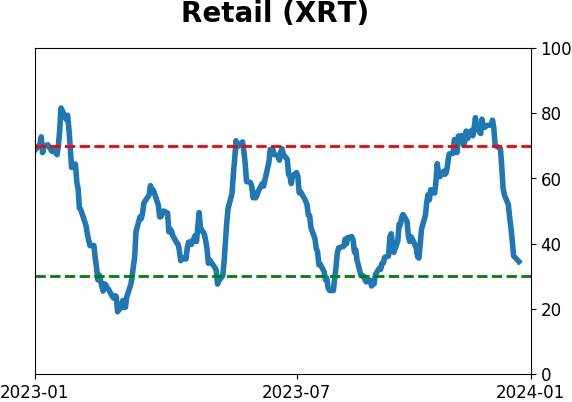
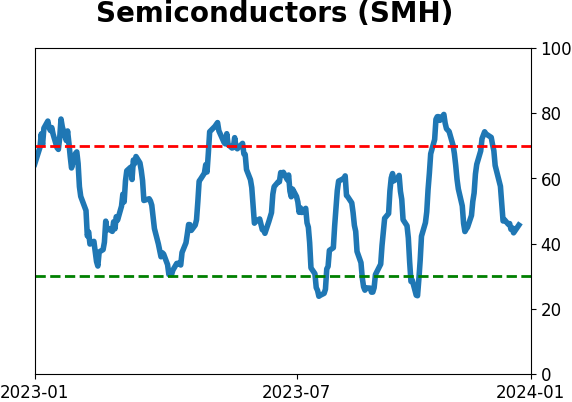
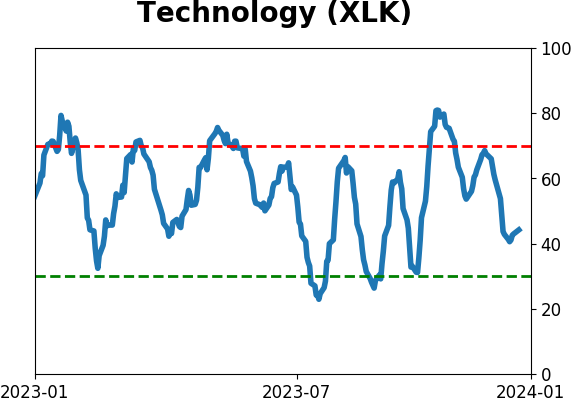
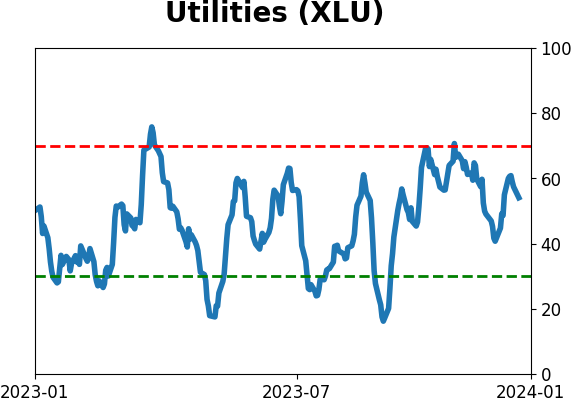
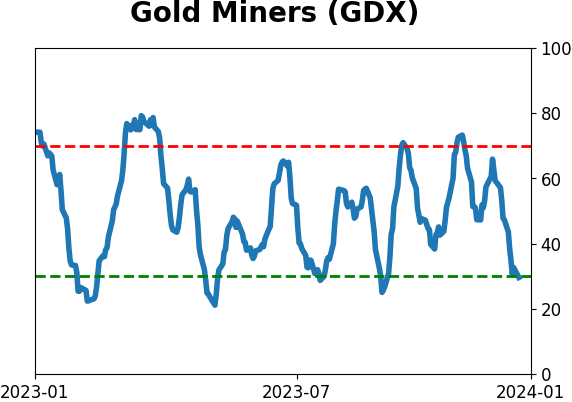
Sector ETF's - 10-Day Moving Average
|
|
|
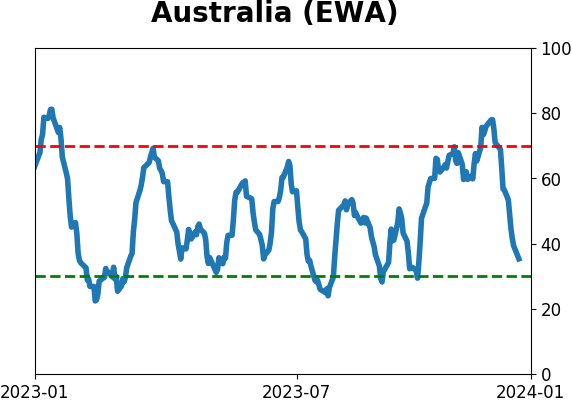
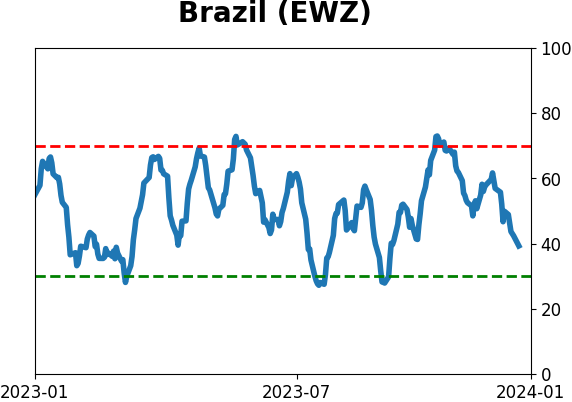
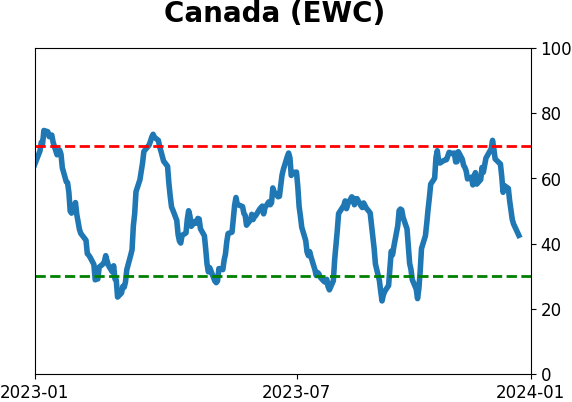
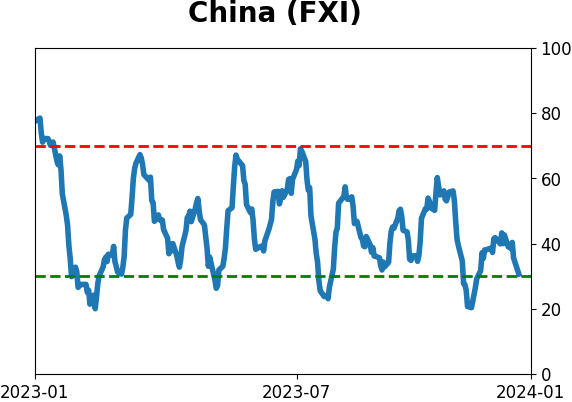
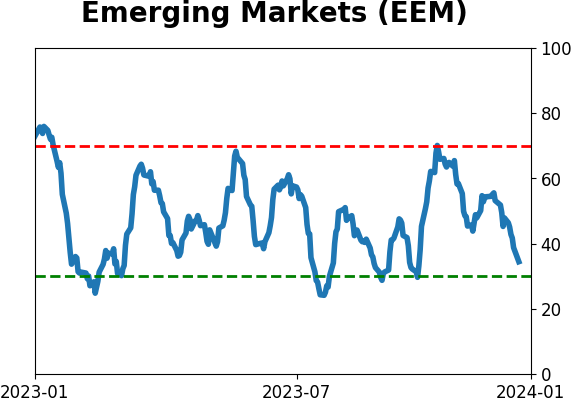
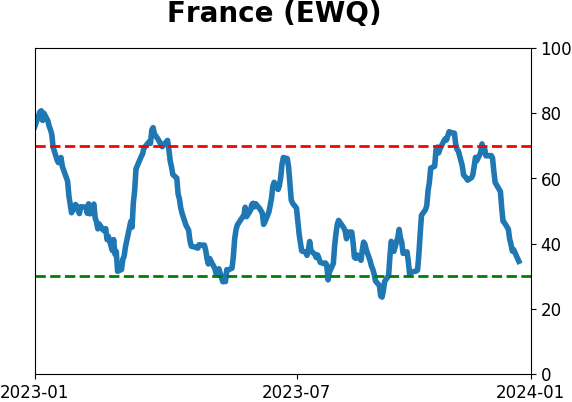
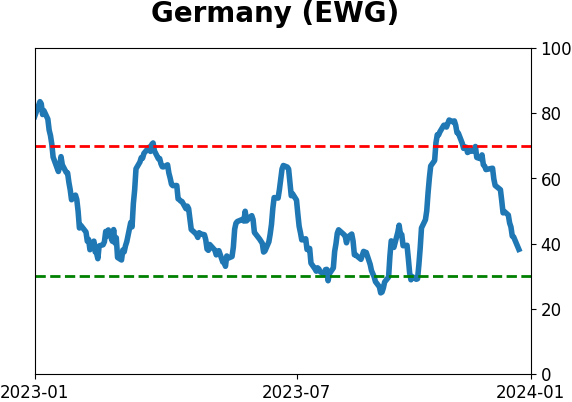
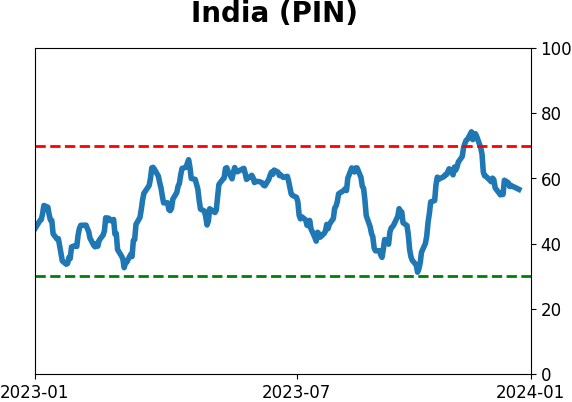
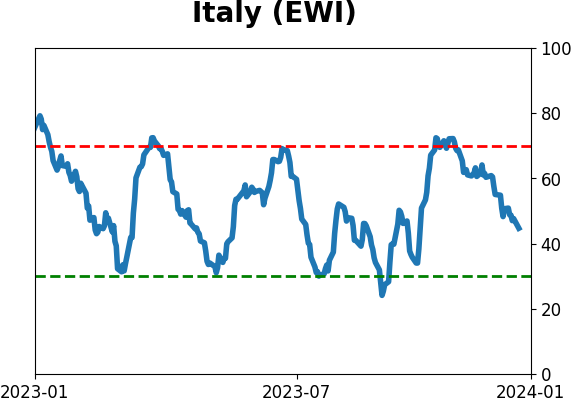
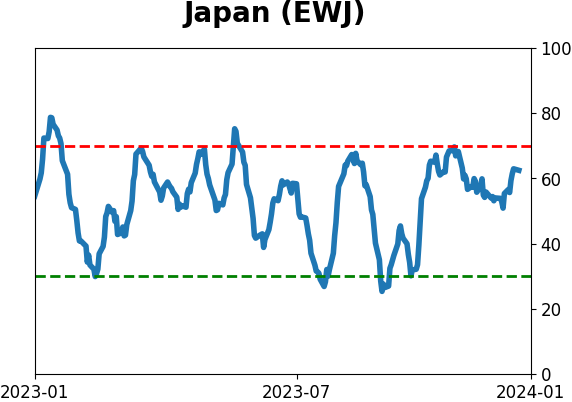
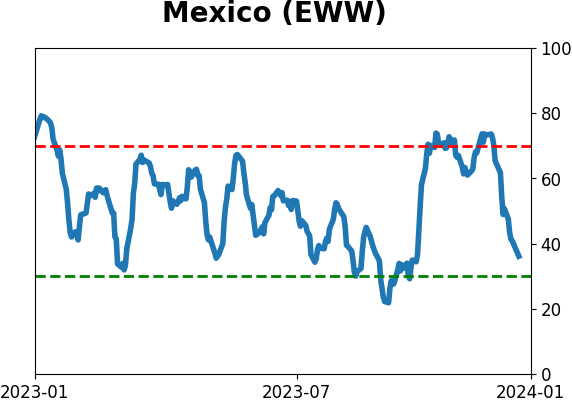
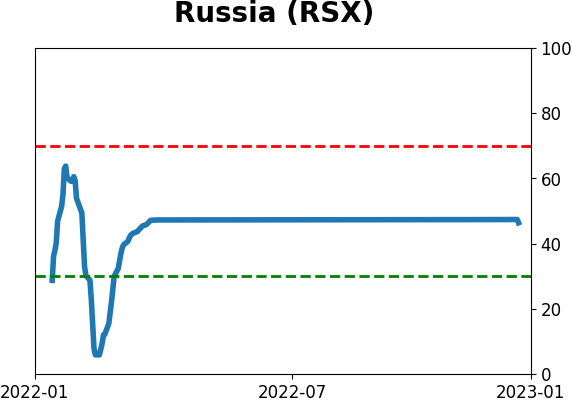
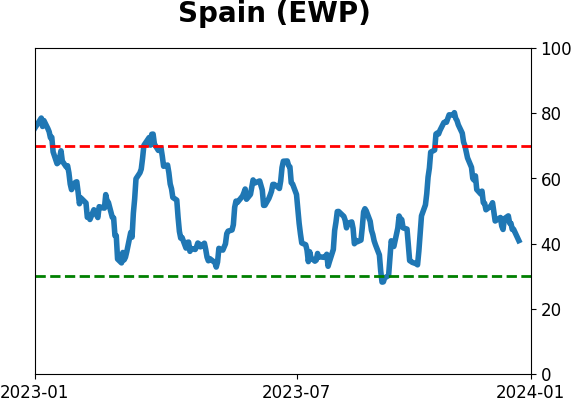
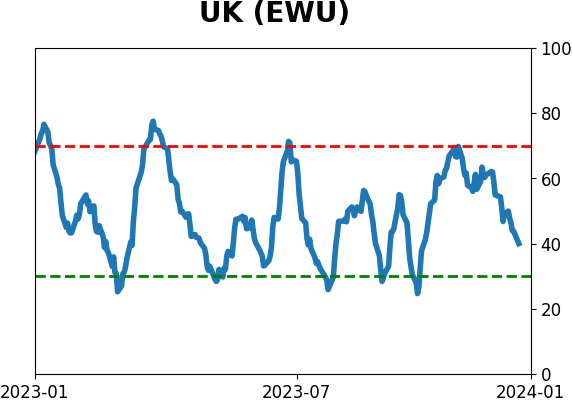
Country ETF's - 10-Day Moving Average
|
|
|
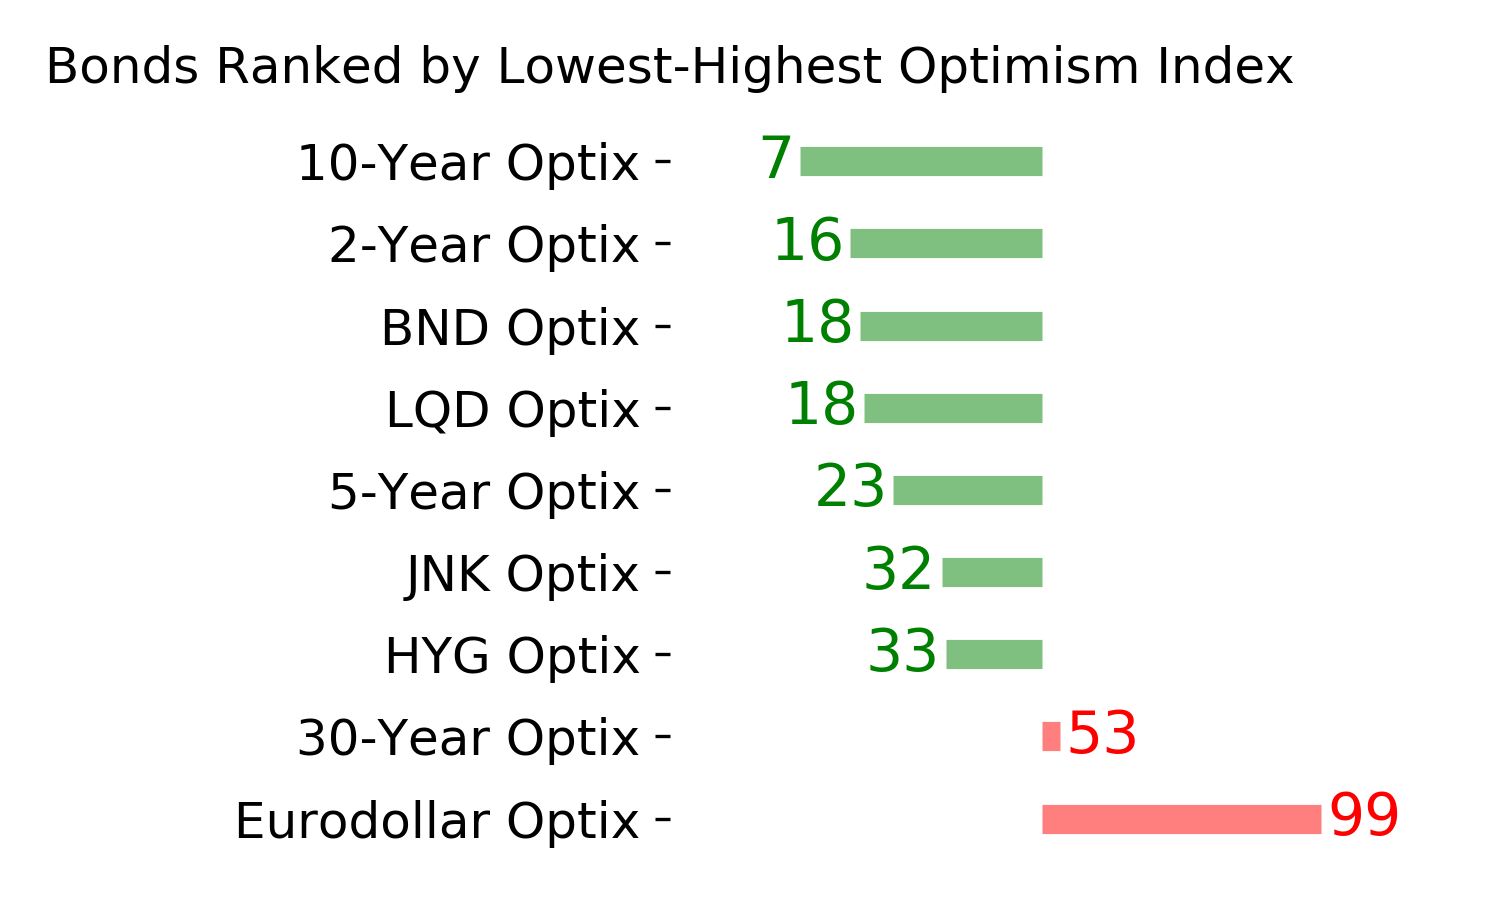
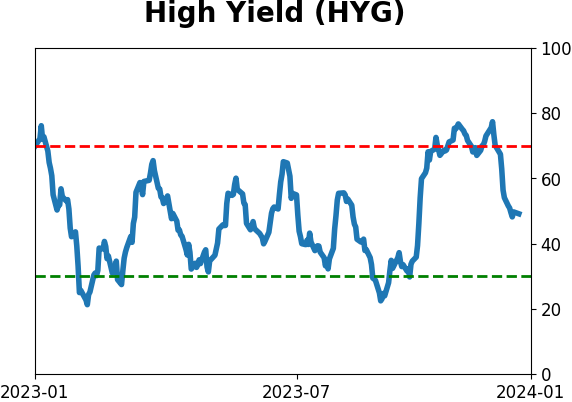
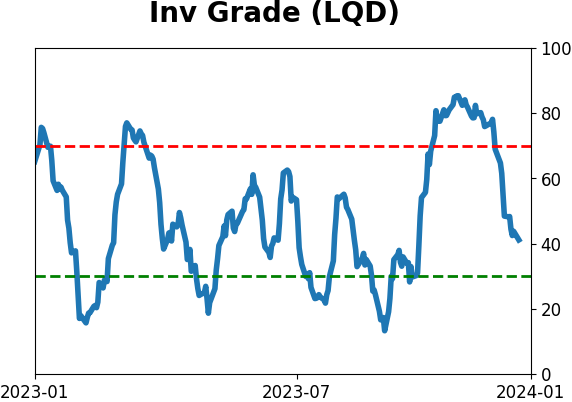
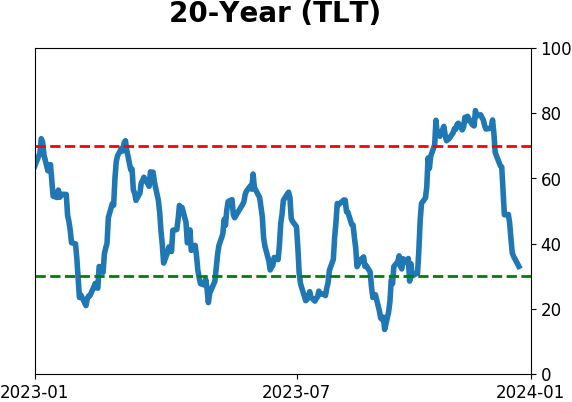
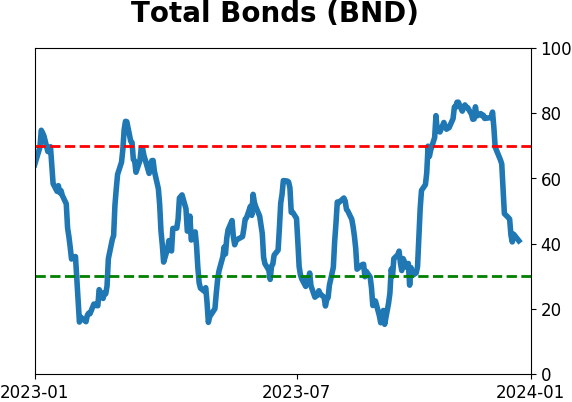
Bond ETF's - 10-Day Moving Average
|
|
|
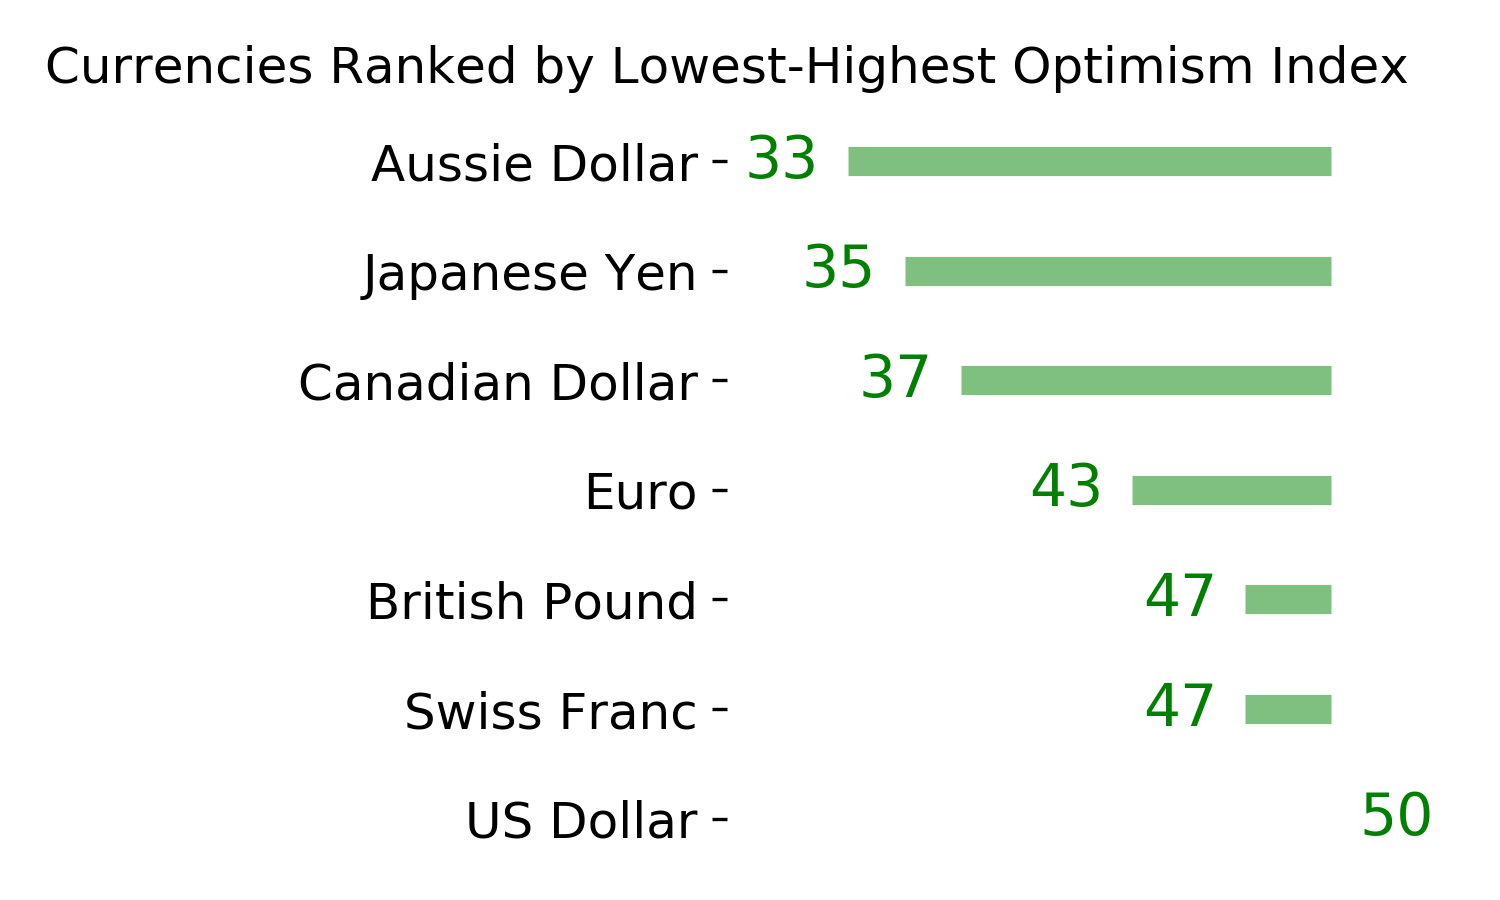
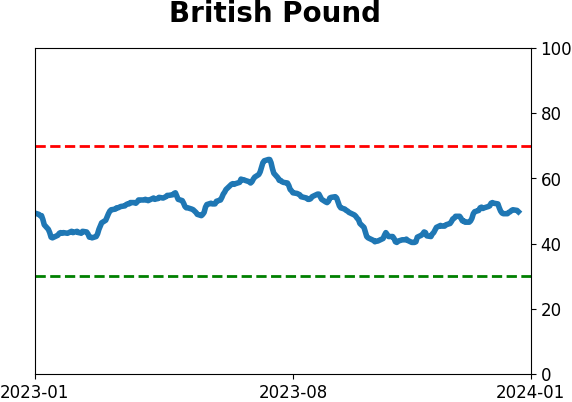
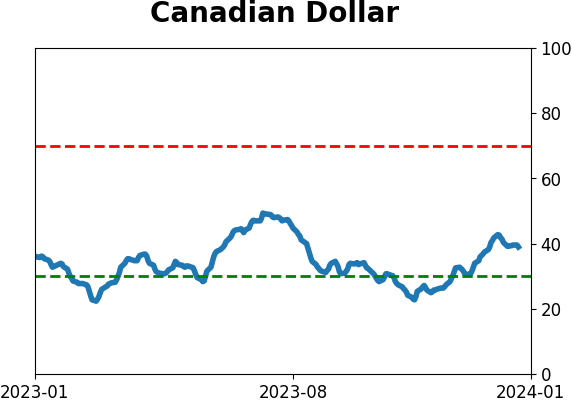
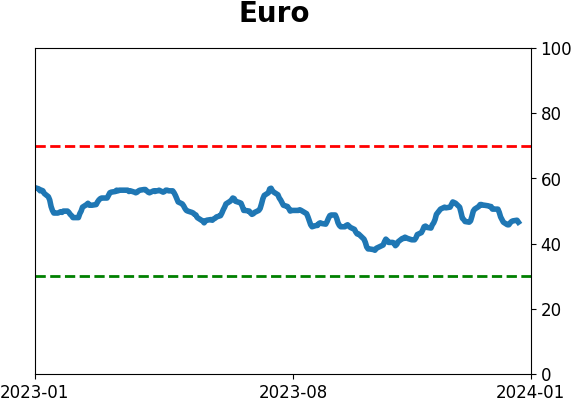
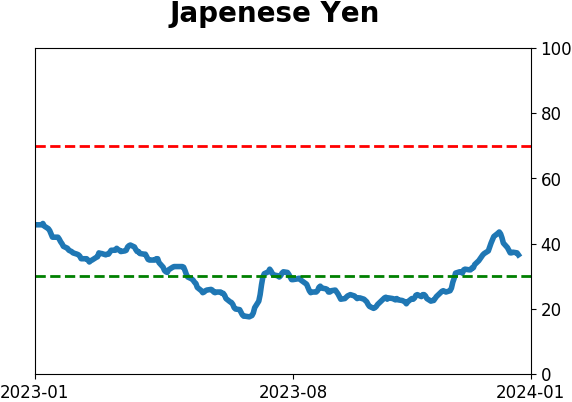
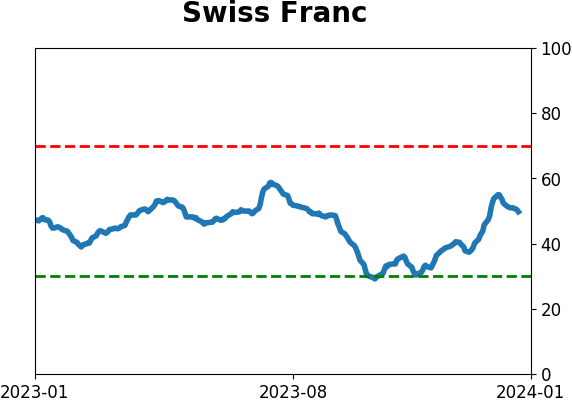
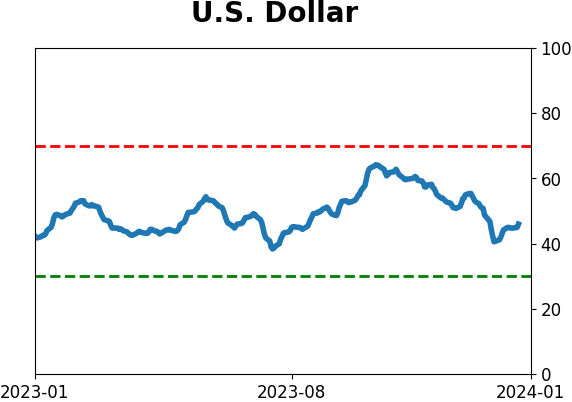
Currency ETF's - 5-Day Moving Average
|
|
|
Commodity ETF's - 5-Day Moving Average
|
|