Daily Report : Small caps fall into a correction

| View/Print a PDF version of this Report |
Headlines
|
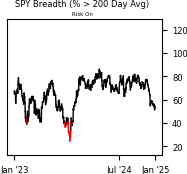
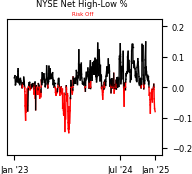
Small caps fall into a correction: The Russell 2000 was the toast of the town after the presidential election, but that quickly soured. The small cap index is already back into correction territory, which tends to precede weak returns. One hopeful sign for the bulls is that more than 40% of small cap stocks remain above their 200-day averages, which has tended to limit the worst losses. |
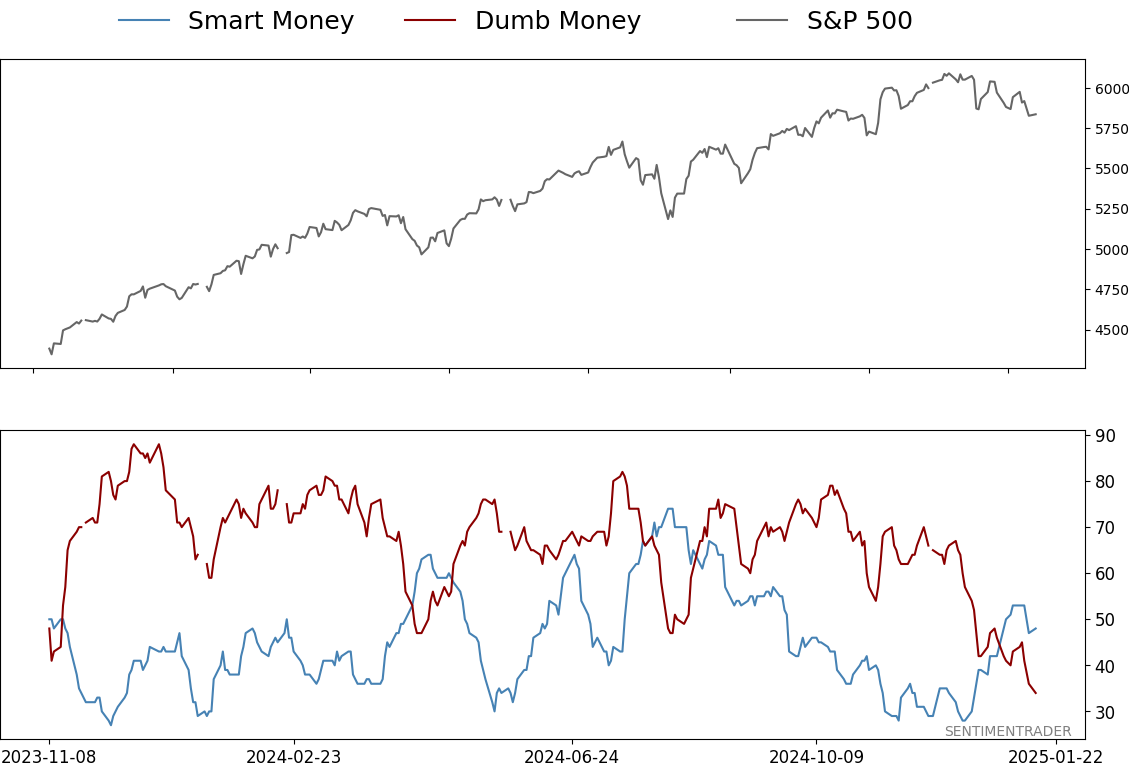
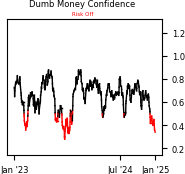
Smart / Dumb Money Confidence
|
|
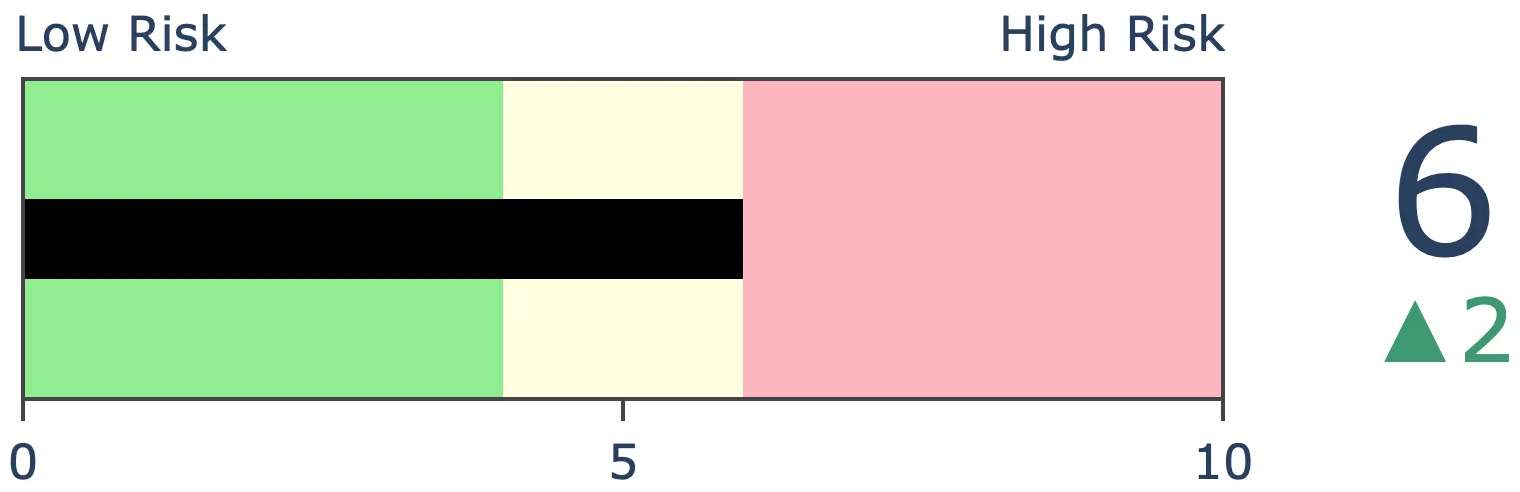
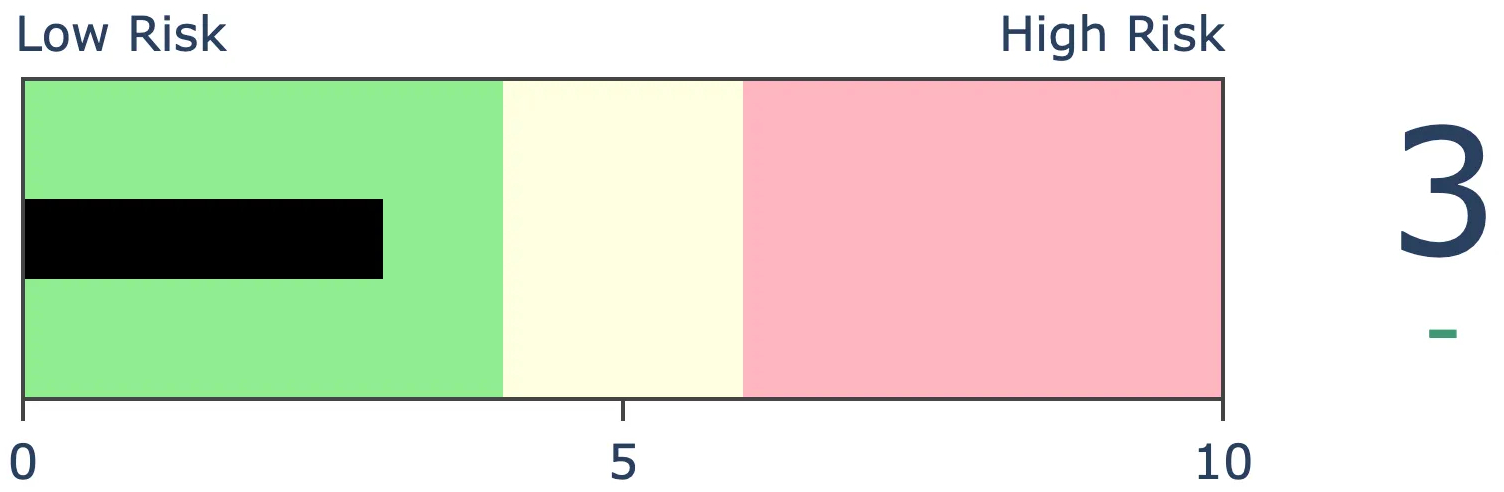
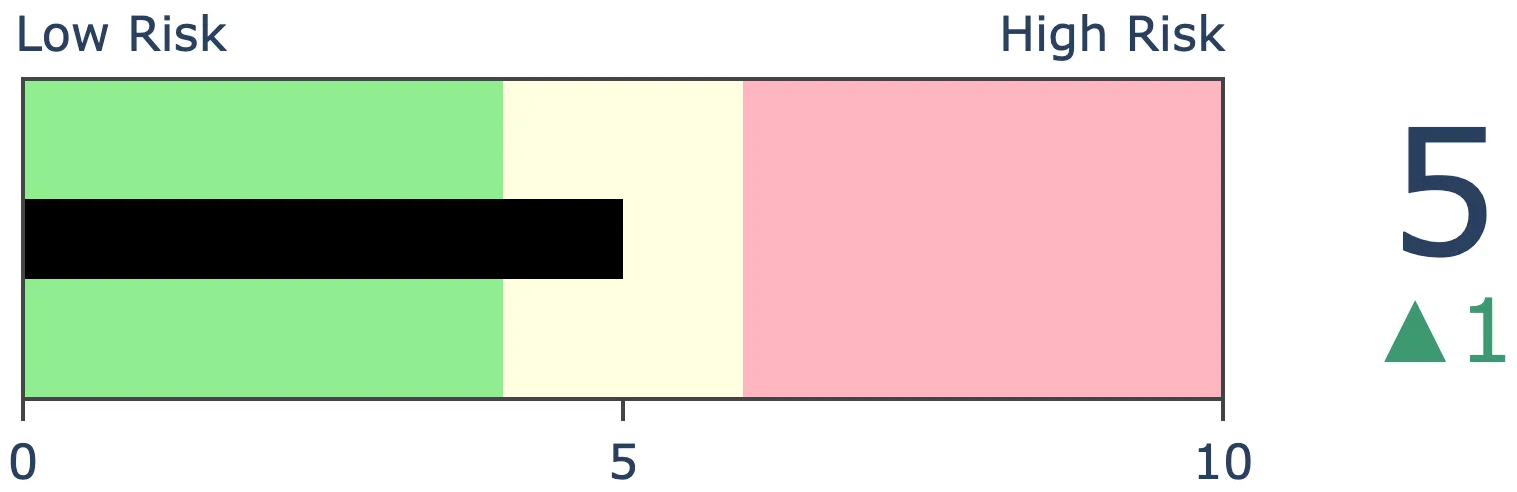
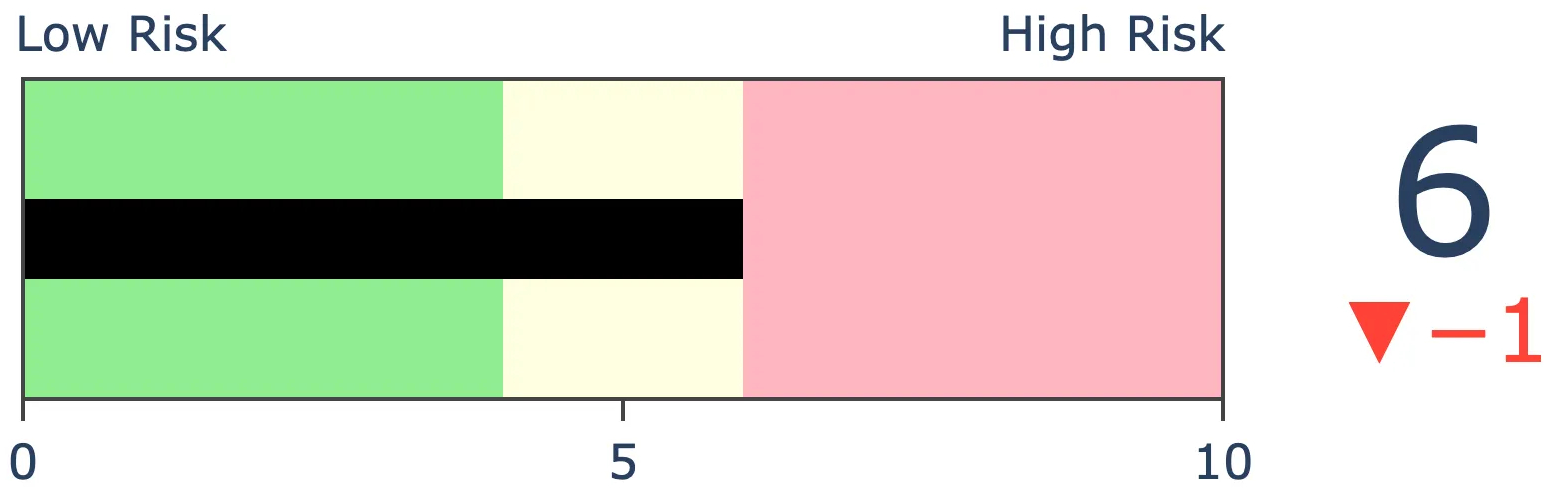
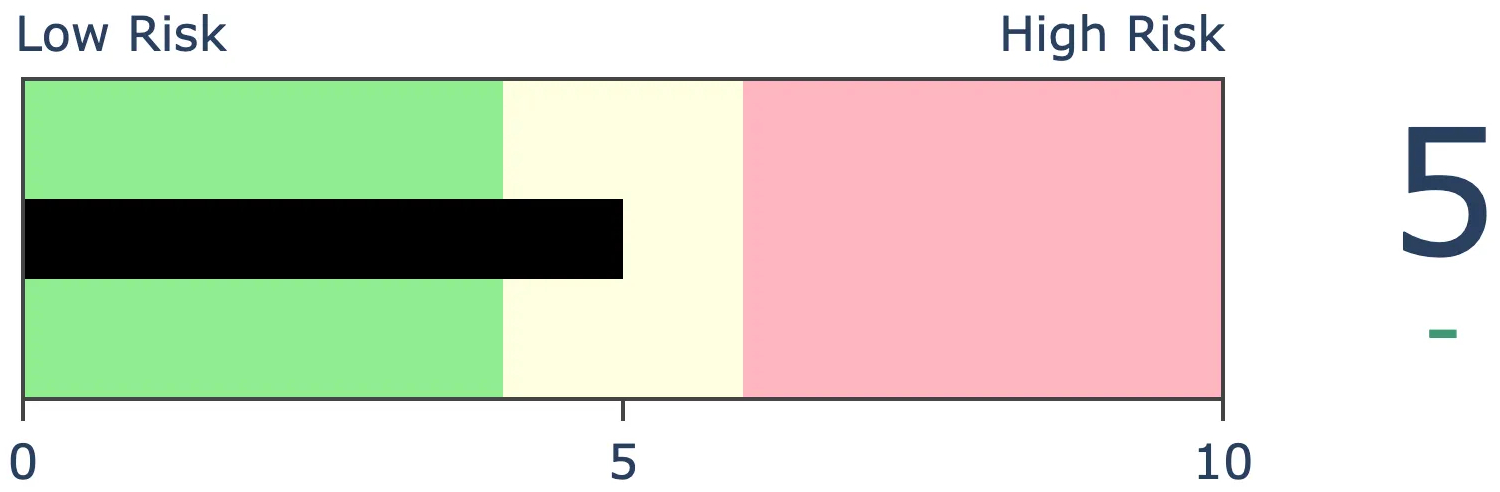
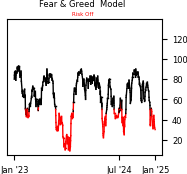
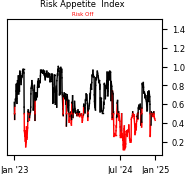
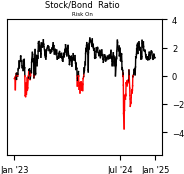
Risk Levels
|
|

|
Research
Small caps fall into a correctionBy Jason GoepfertBOTTOM LINEThe Russell 2000 was the toast of the town after the presidential election, but that quickly soured. The small cap index is already back into correction territory, which tends to precede weak returns. One hopeful sign for the bulls is that more than 40% of small cap stocks remain above their 200-day averages, which has tended to limit the worst losses. FORECAST / TIMEFRAME |
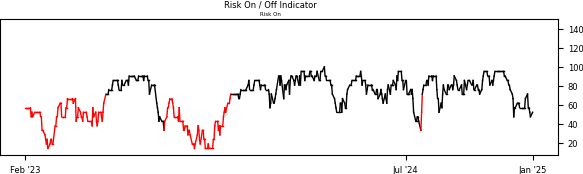
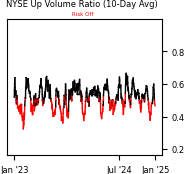
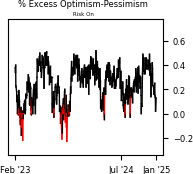
Sentiment Risk On / Risk Off Overview
| ||
|
|
|
|
|
|
|
|
|
|
|
|
Indicators at Extremes
|
|
|
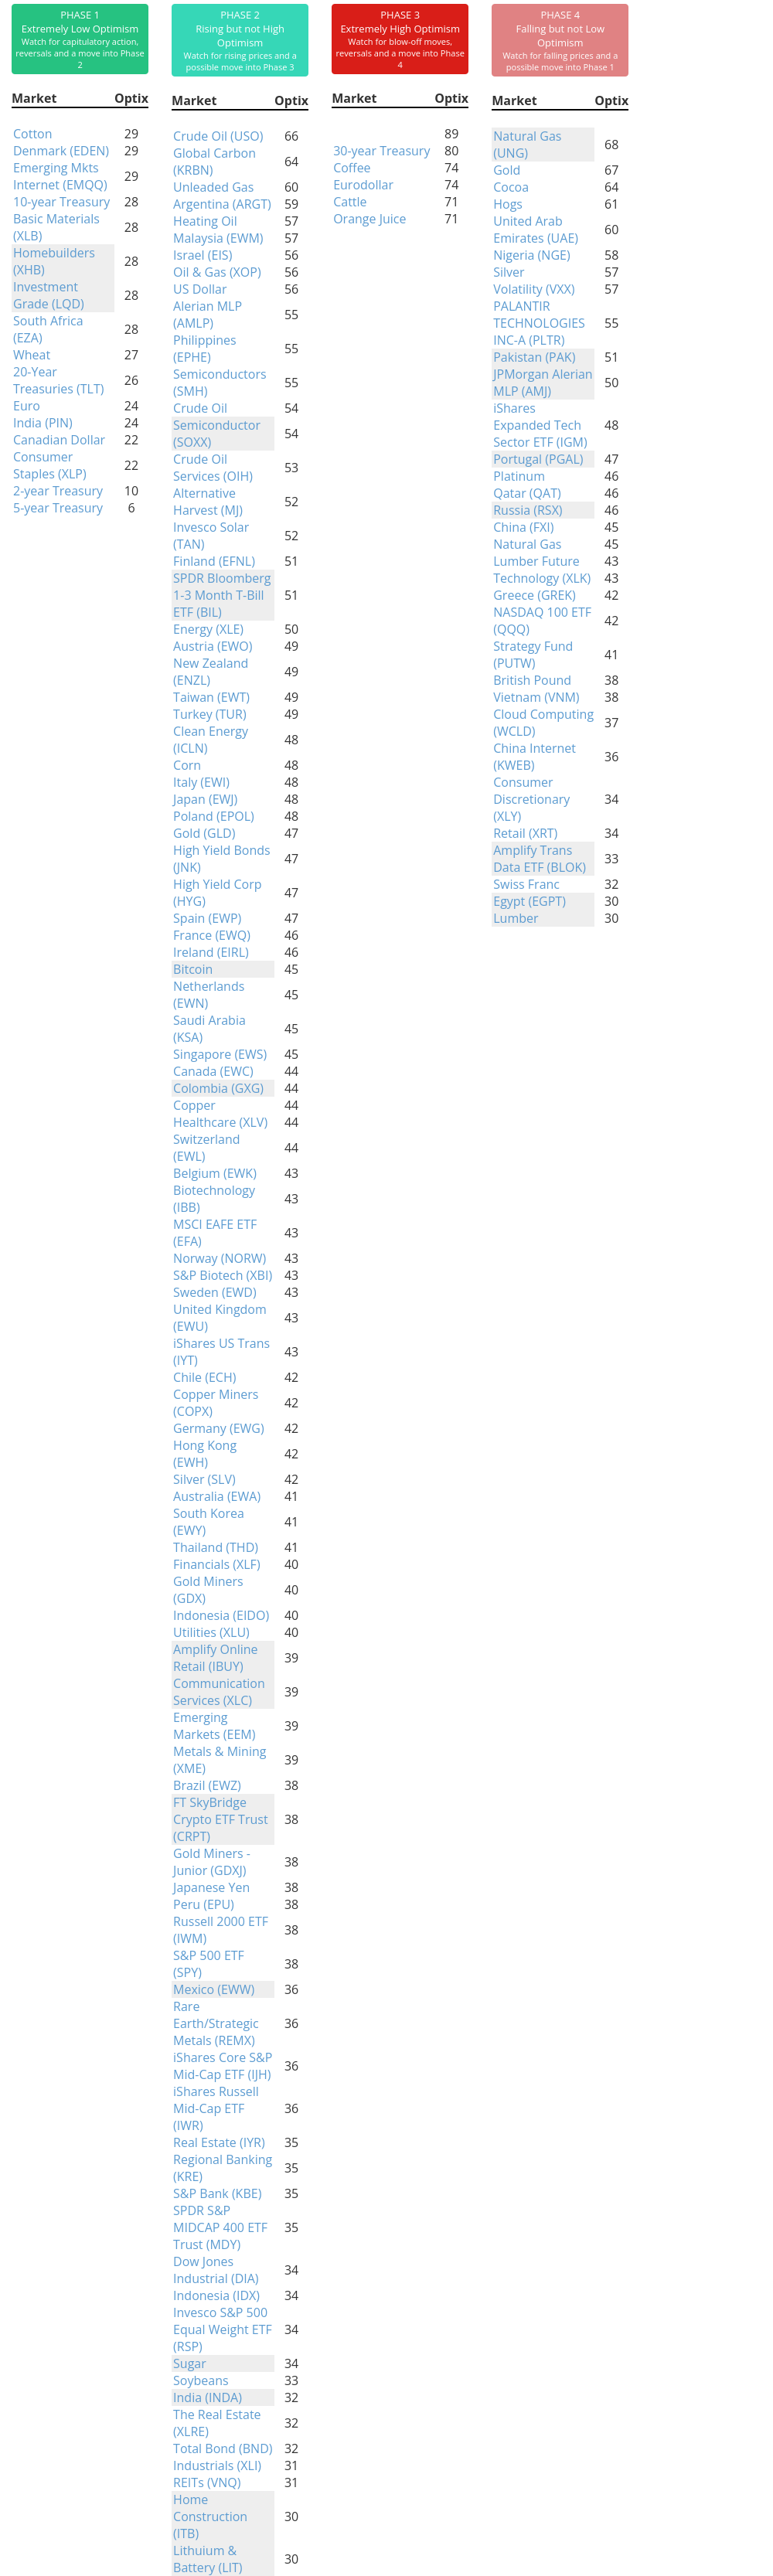
Phase Table
|
|
|
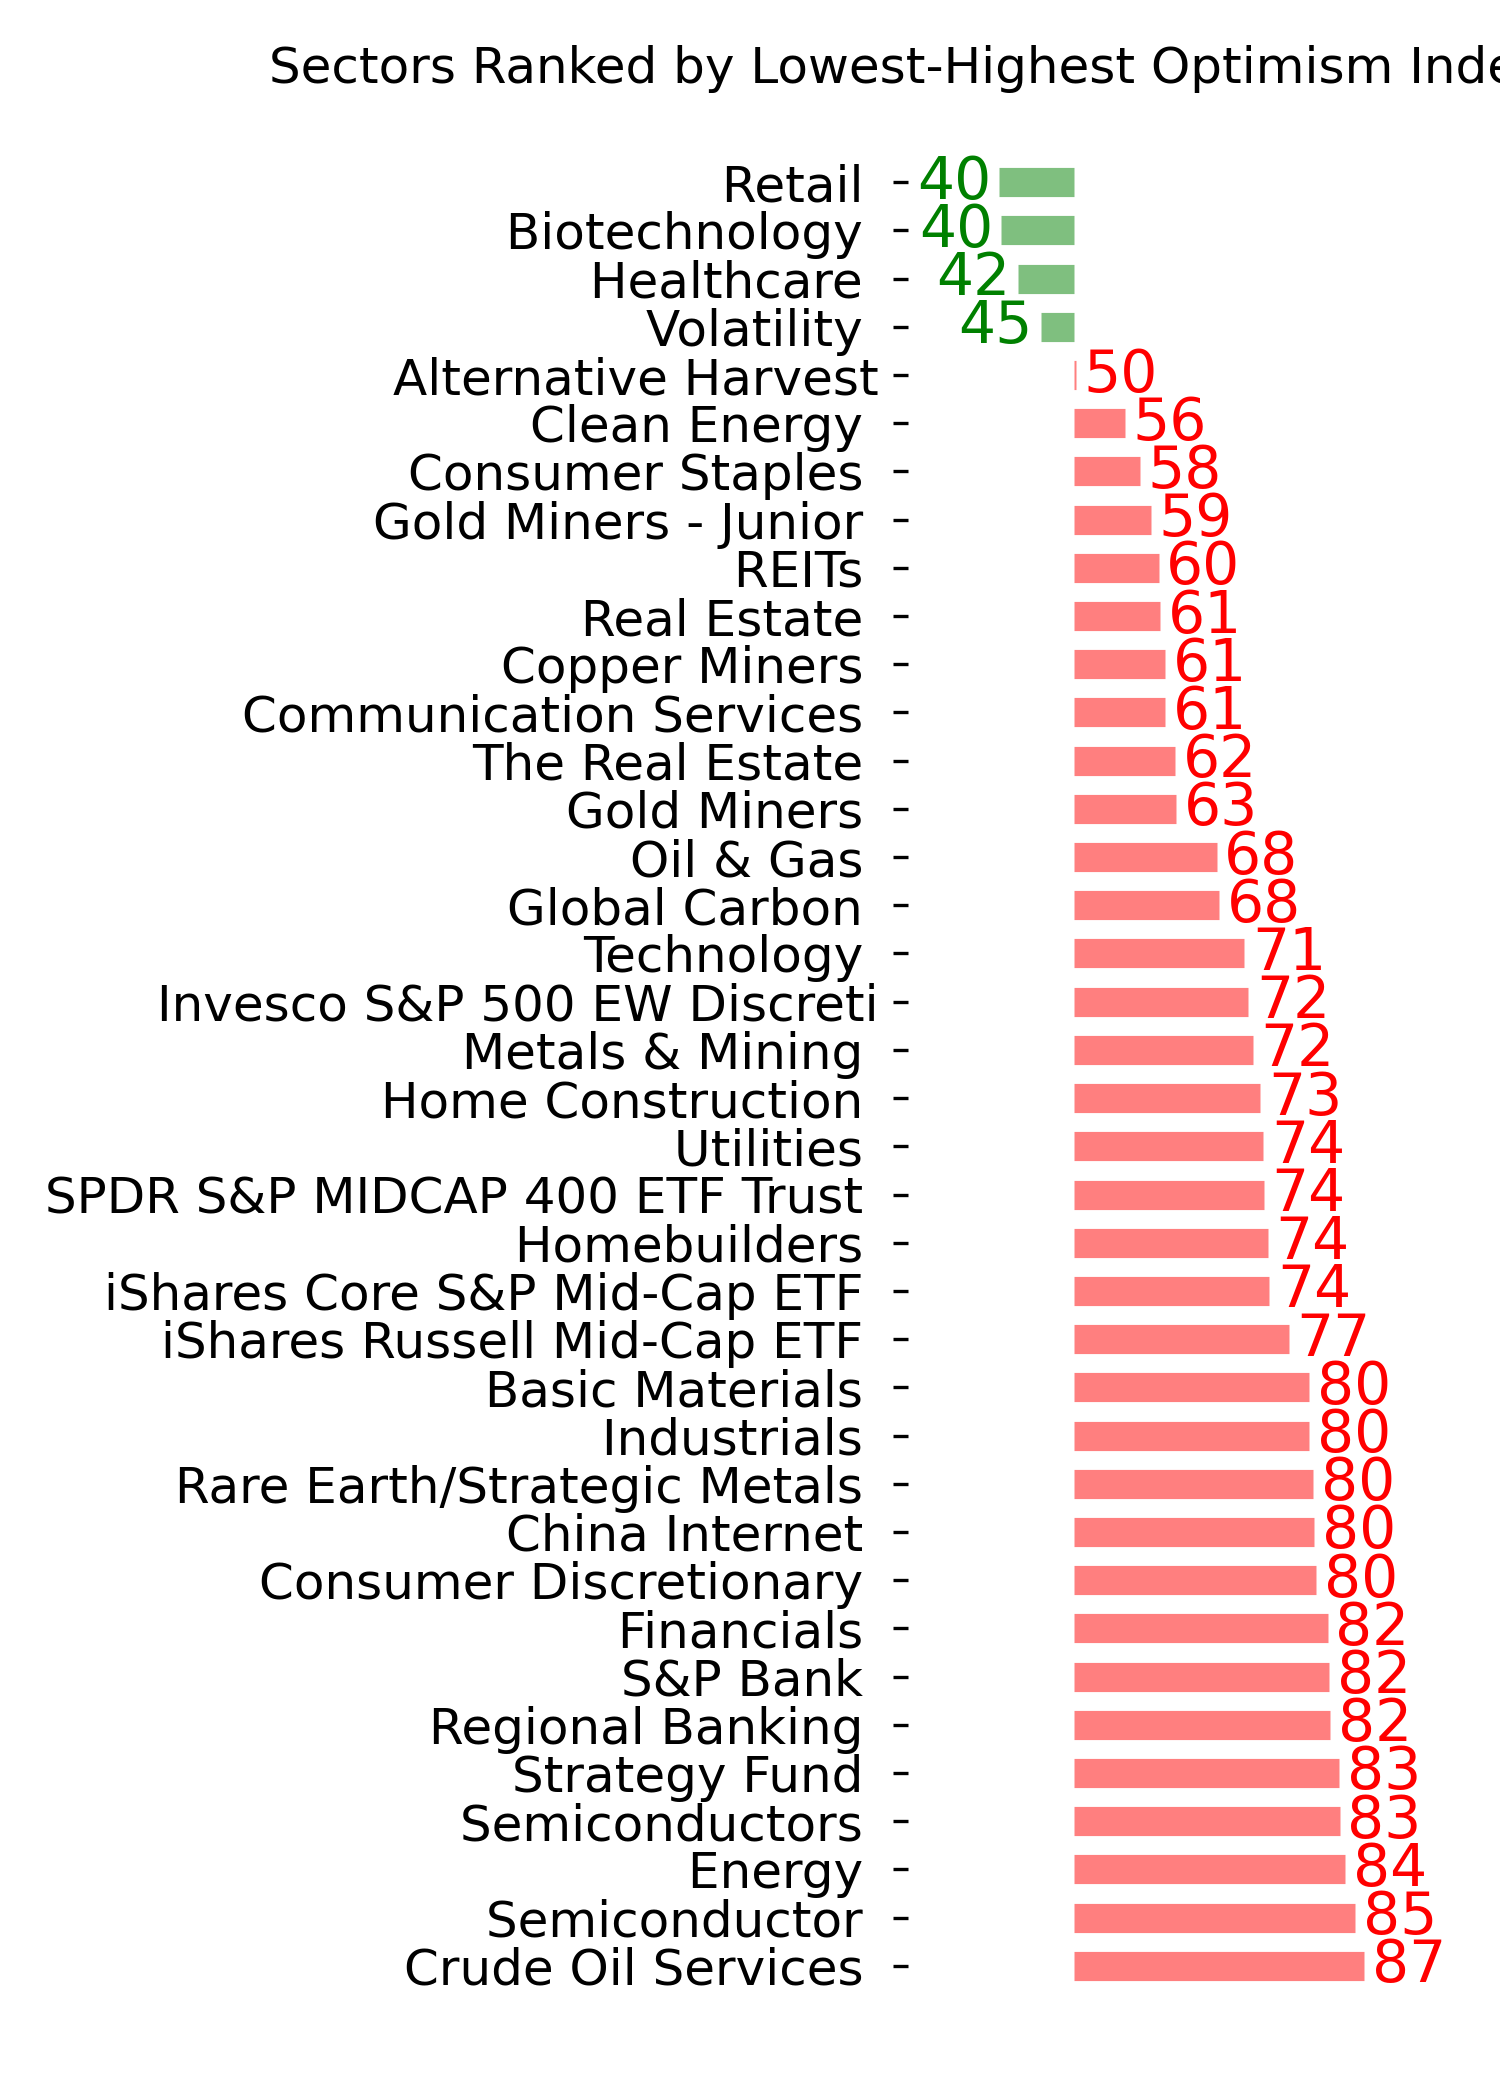
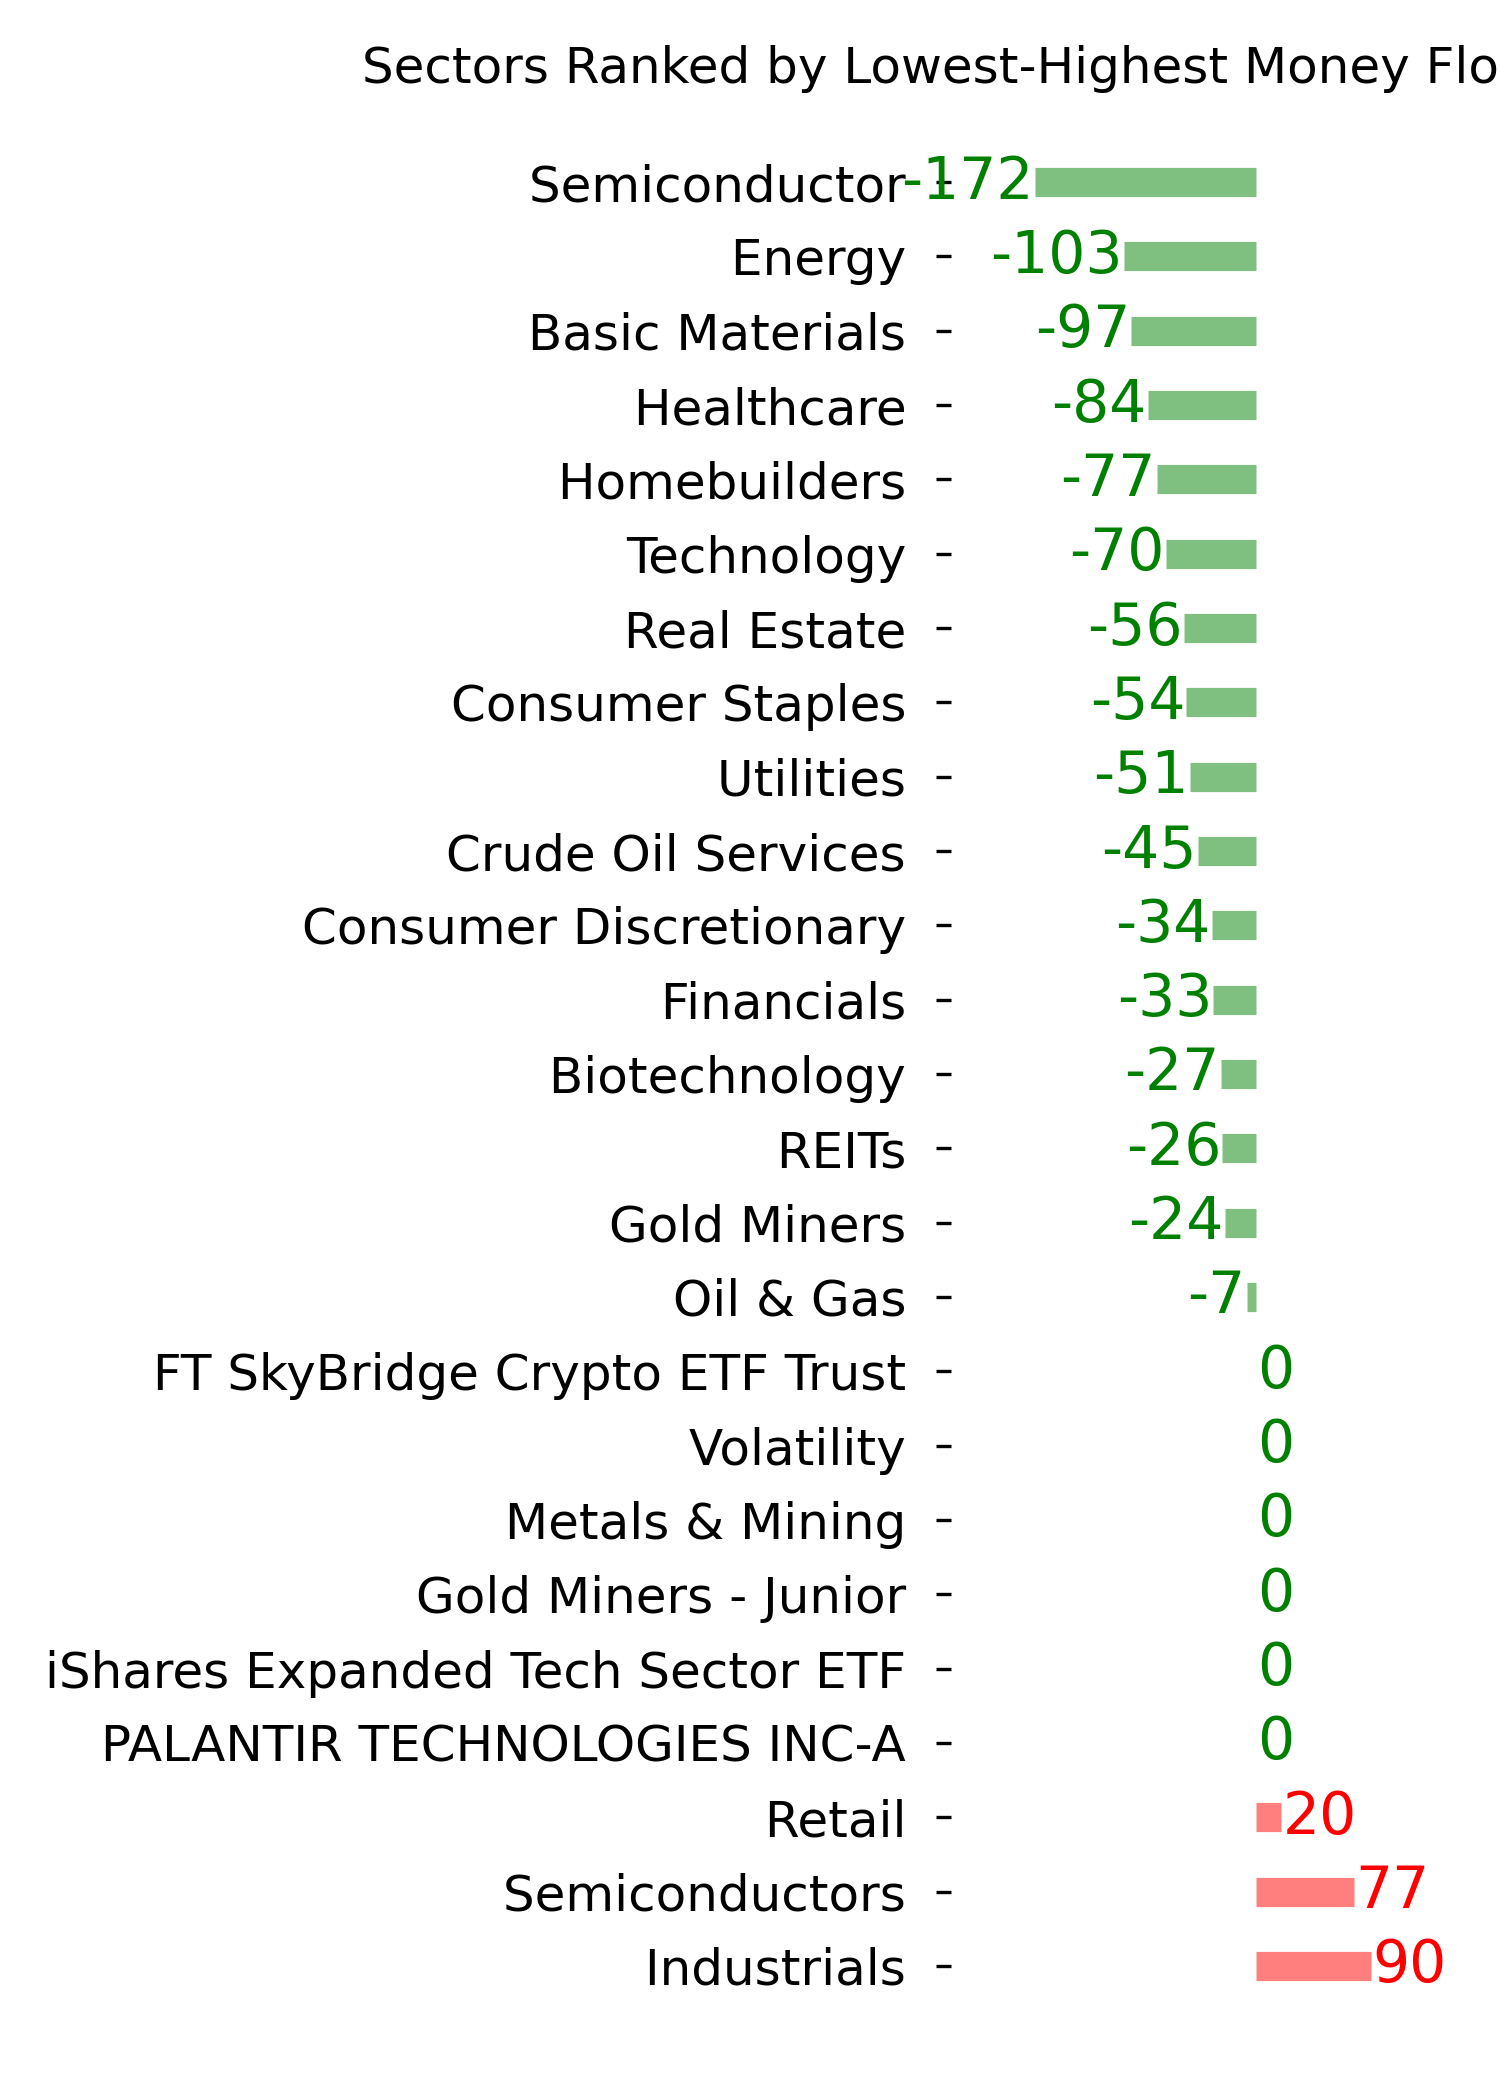
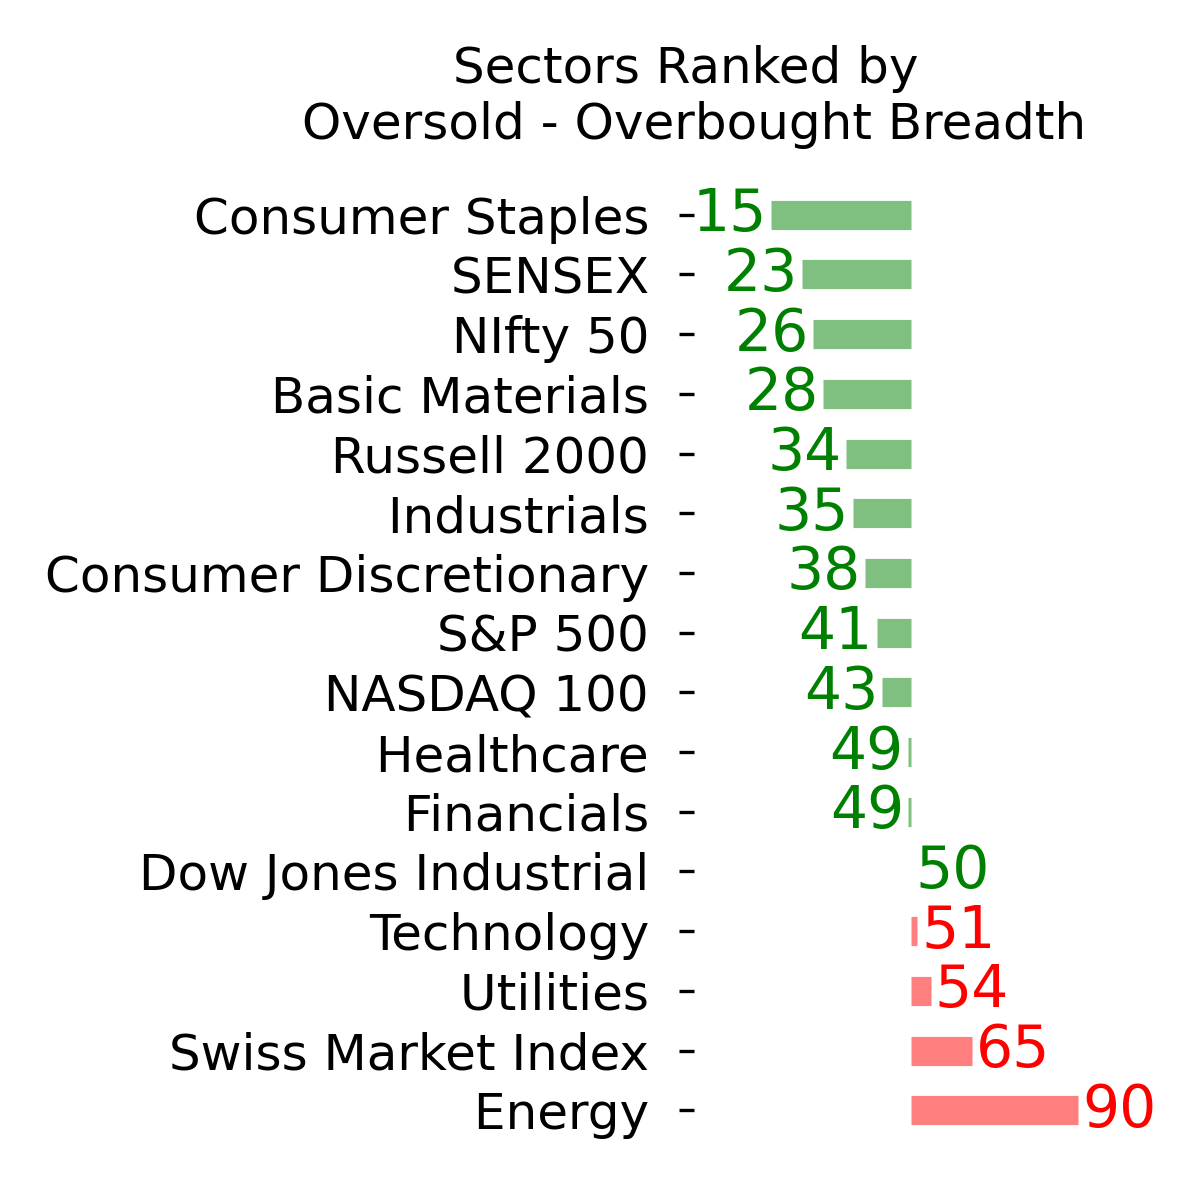
Ranks
|
|
|
|

|
|
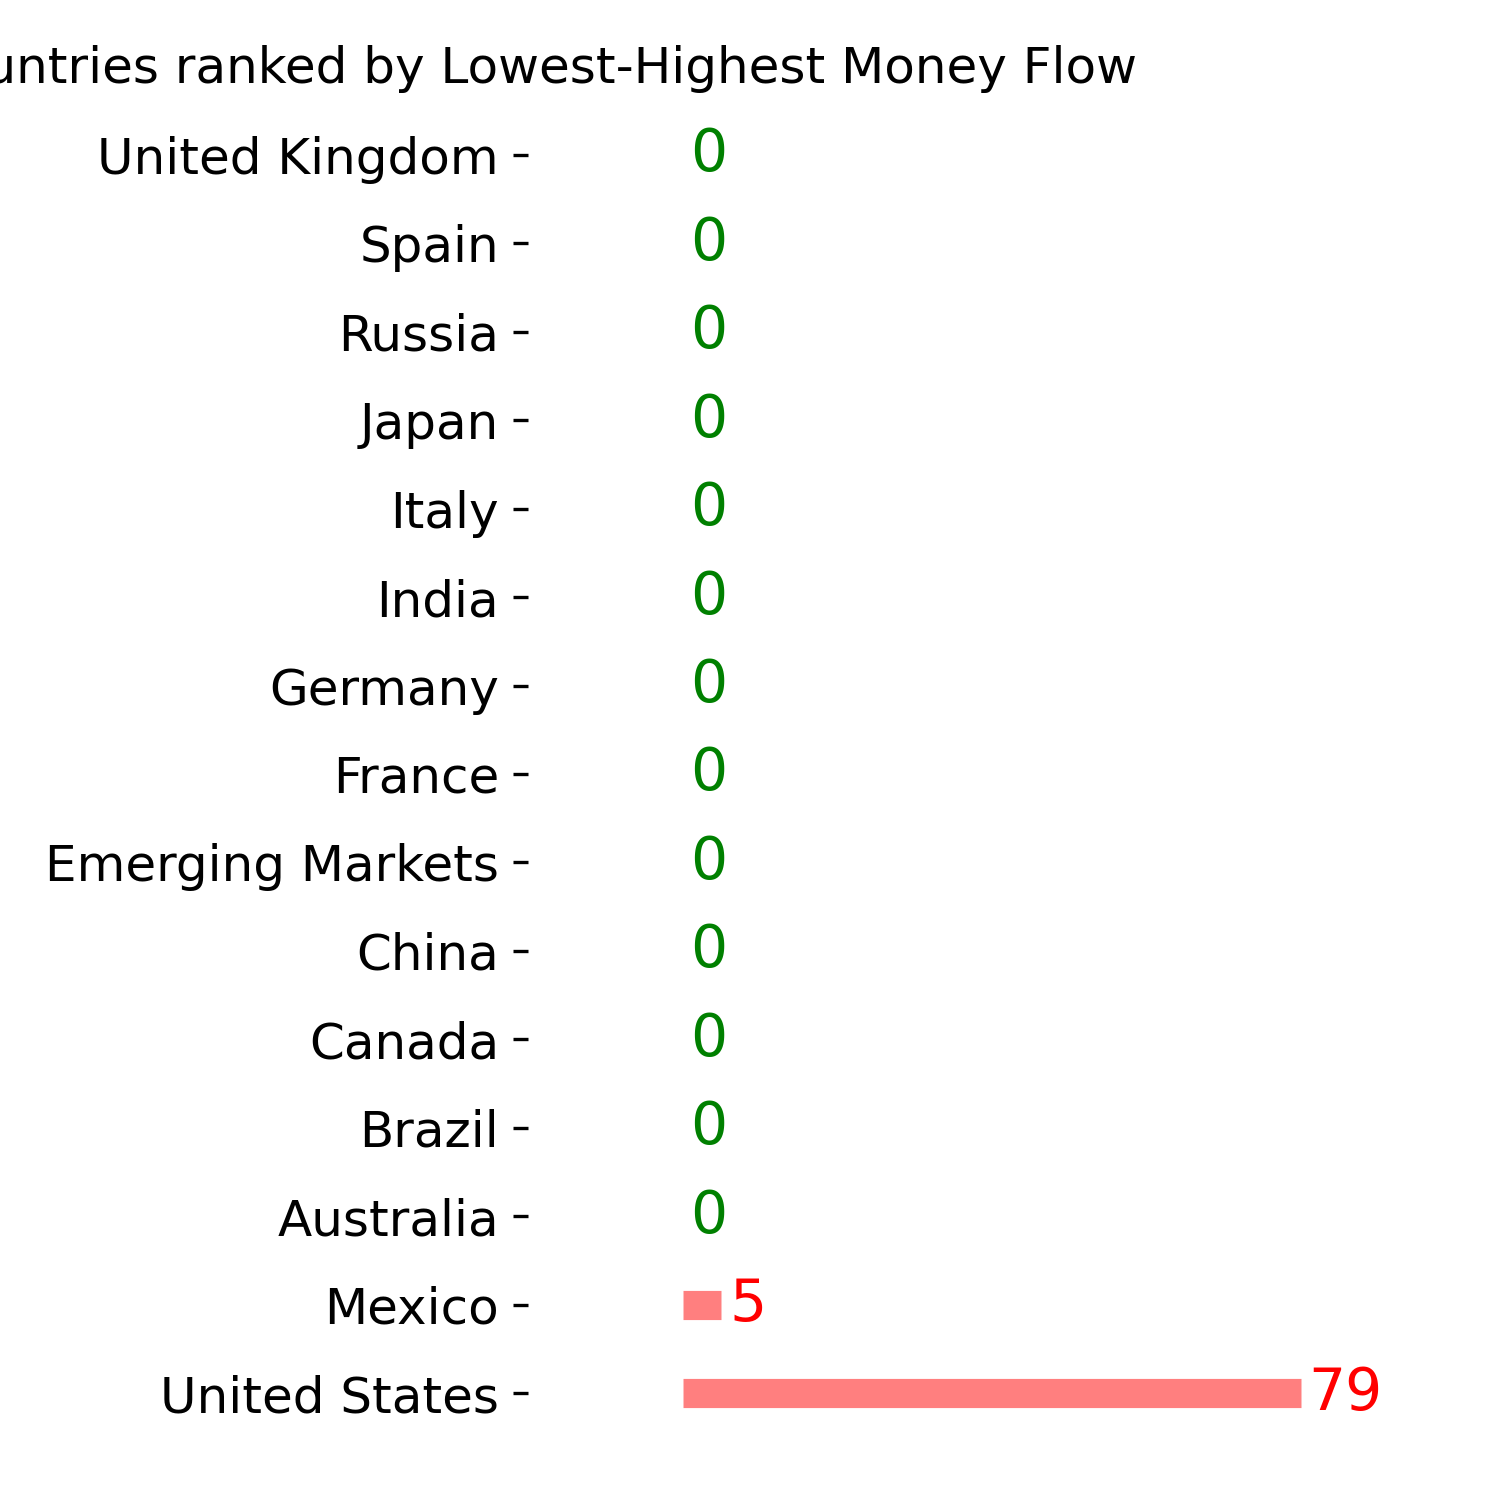
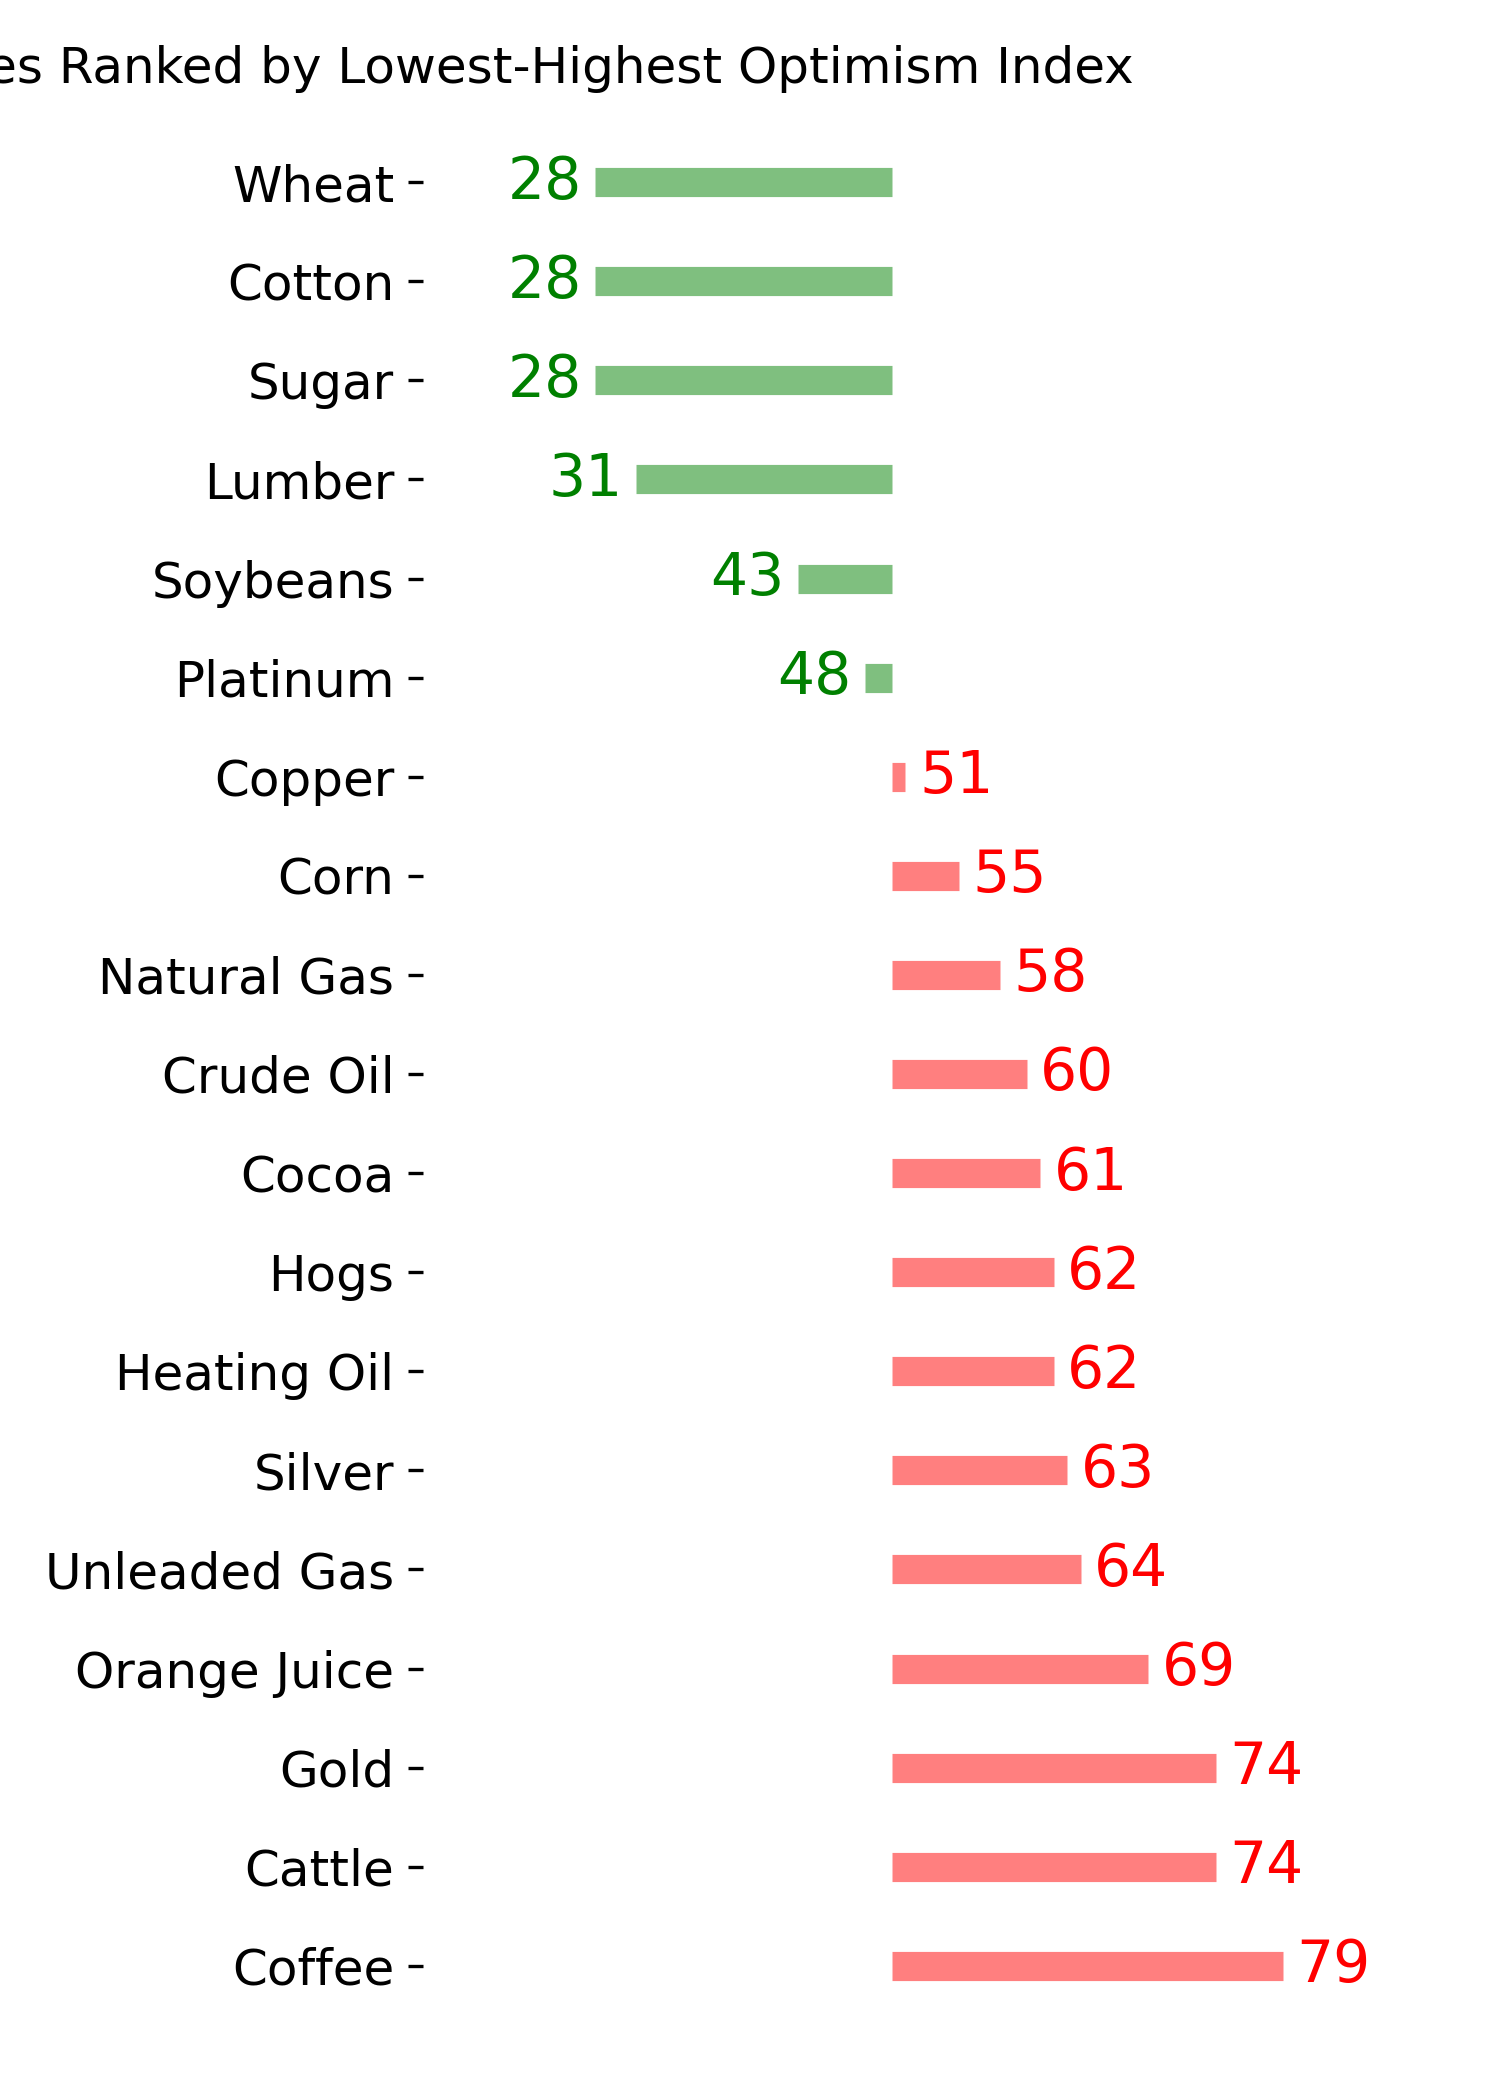
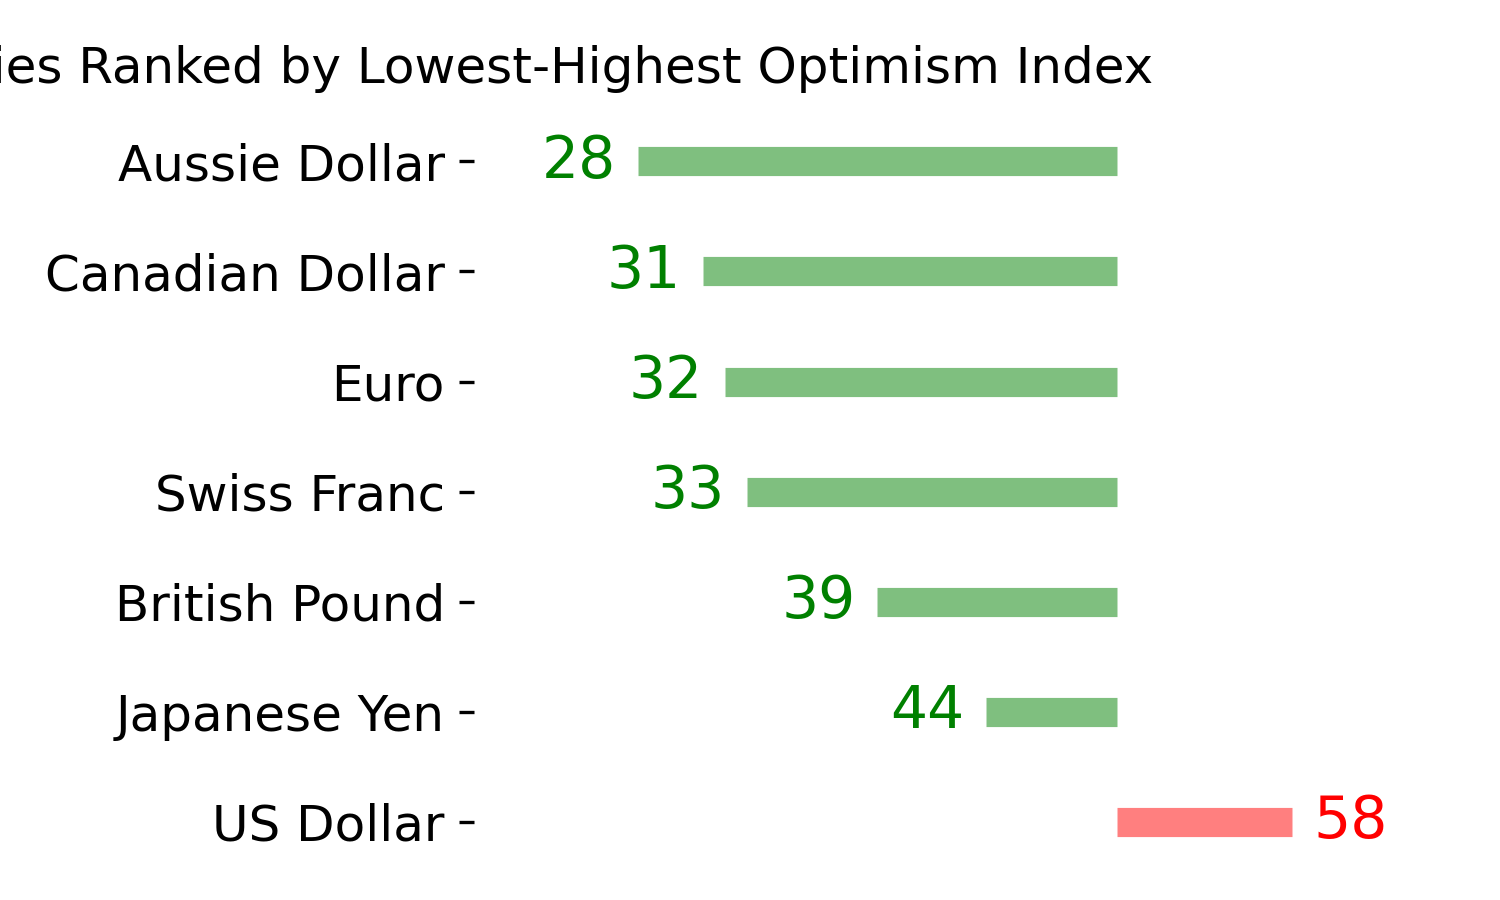
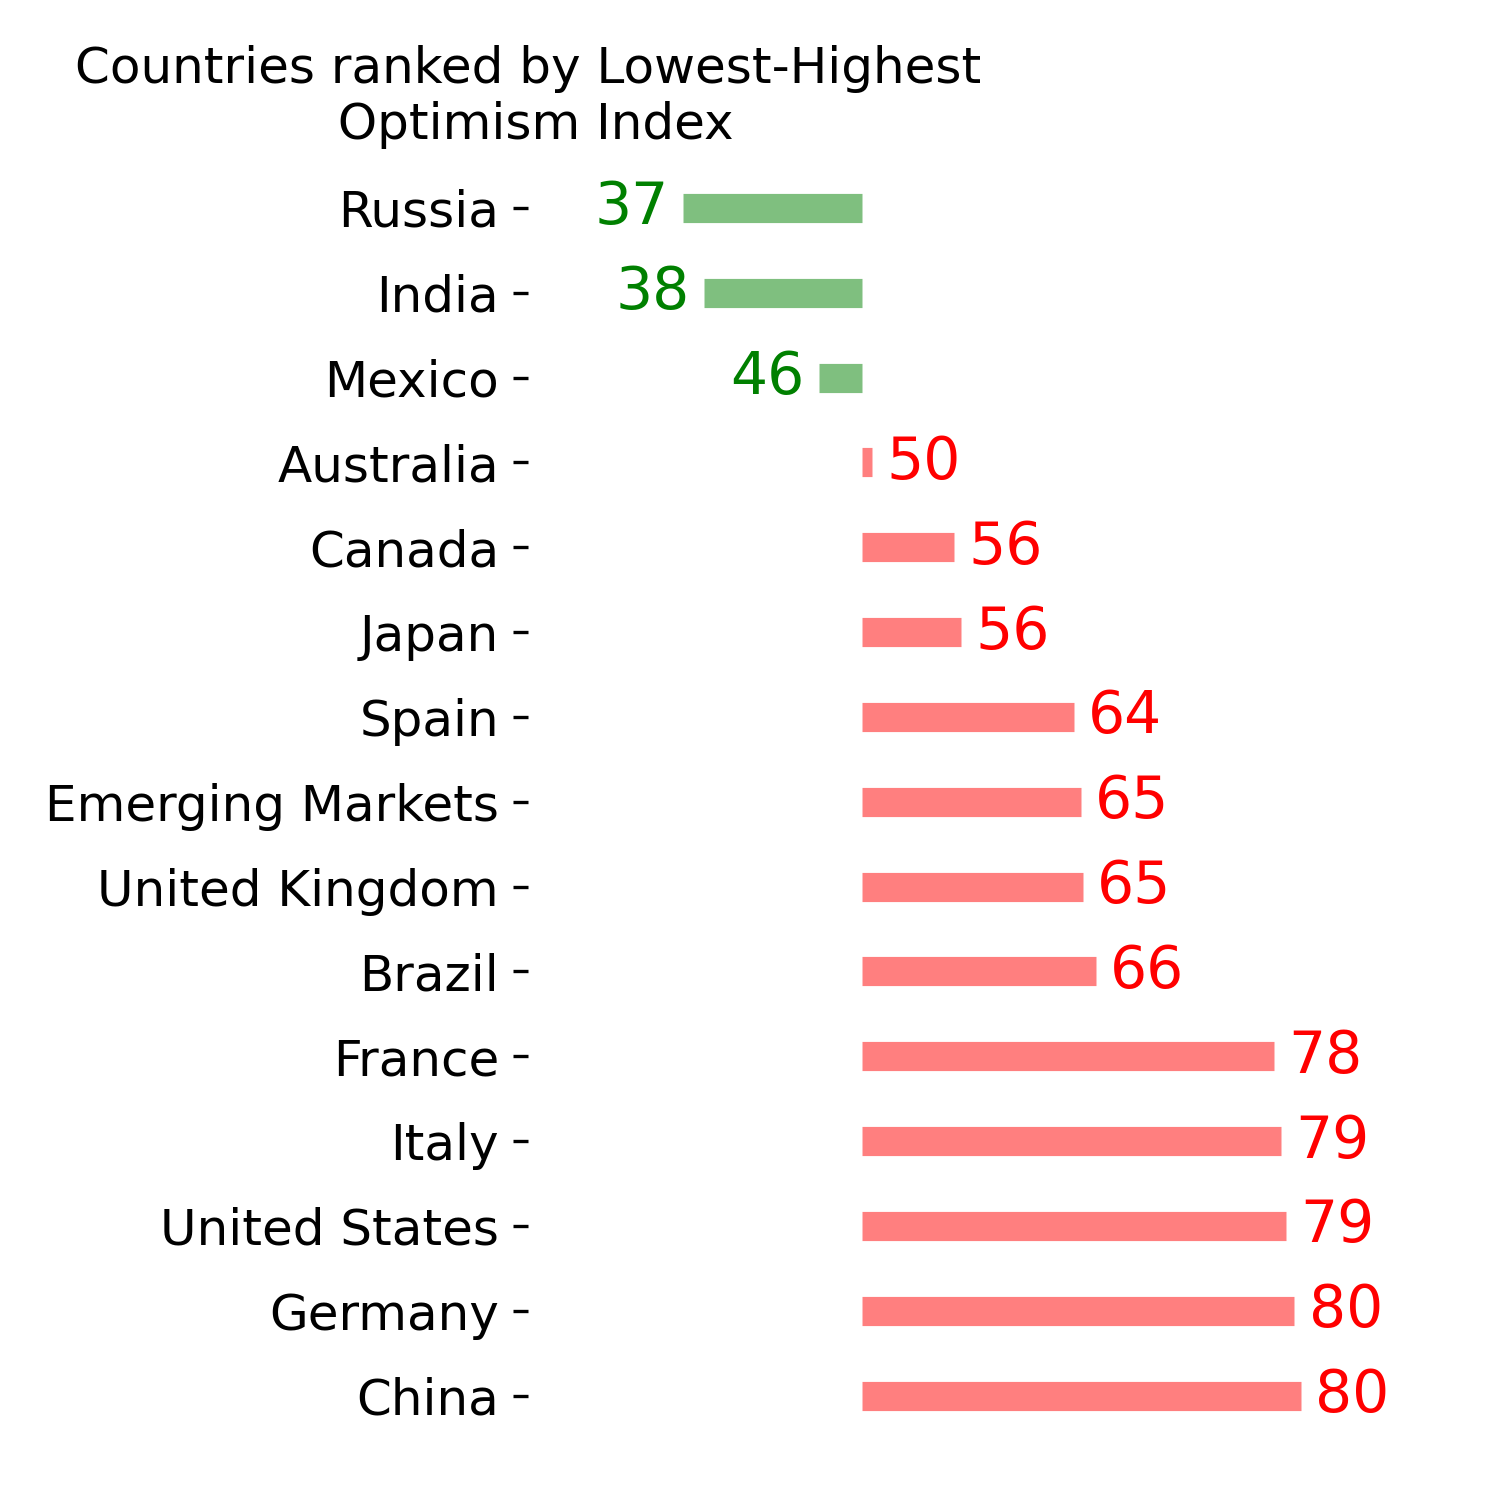
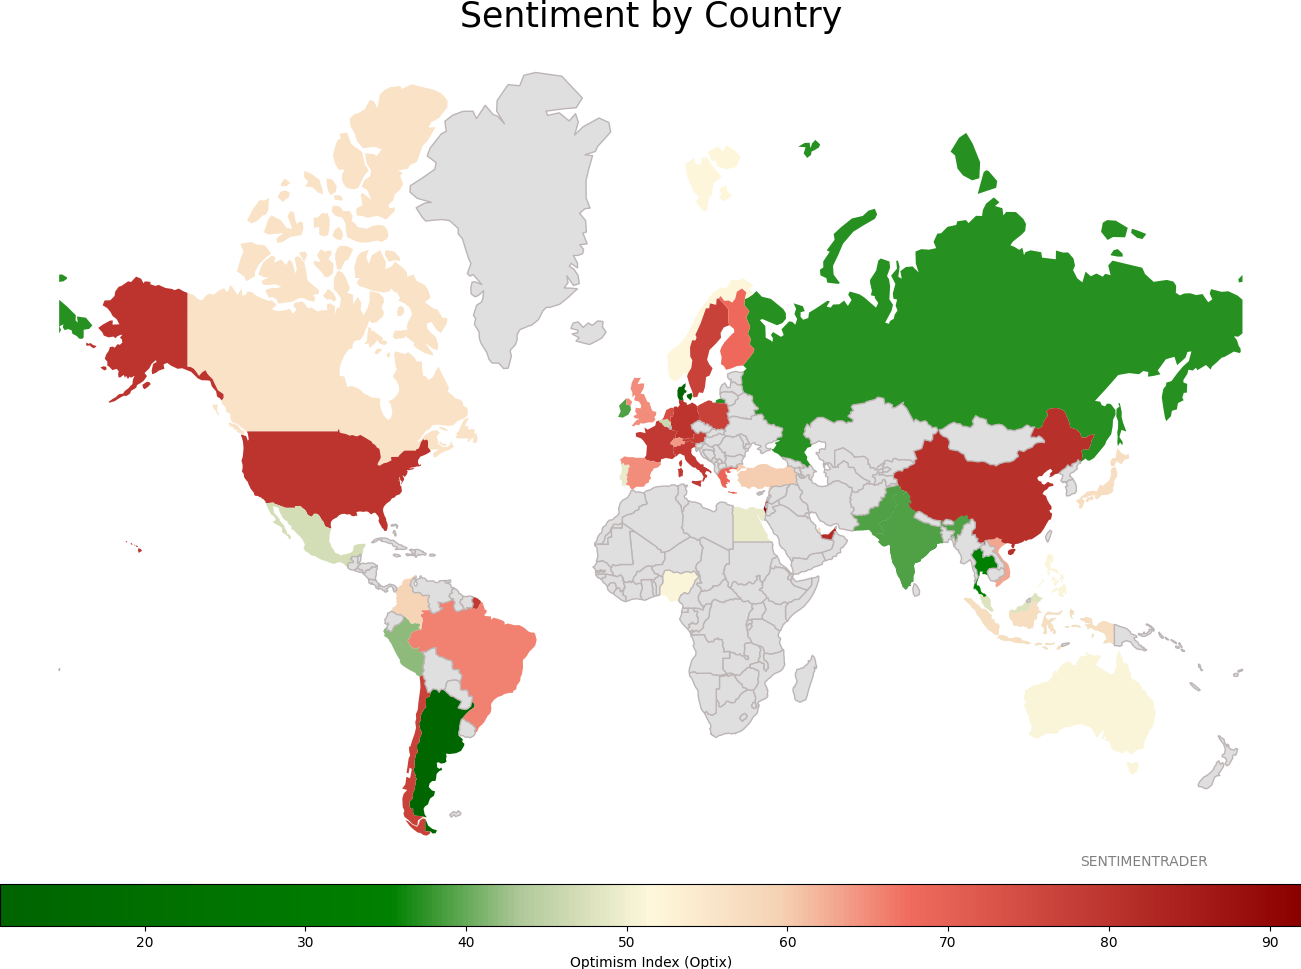
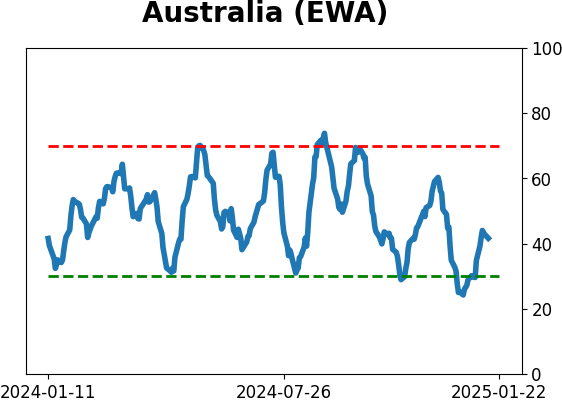
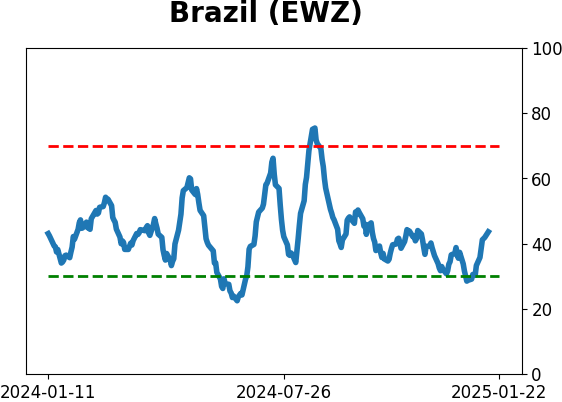
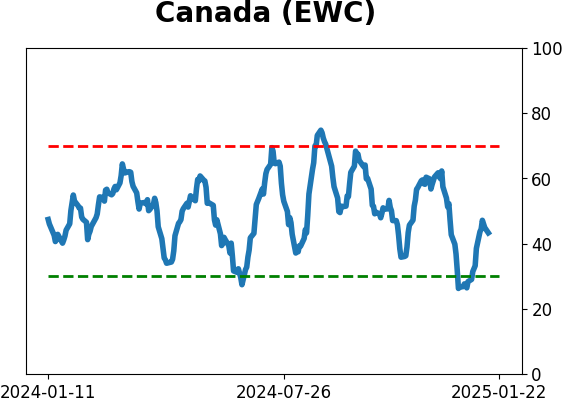
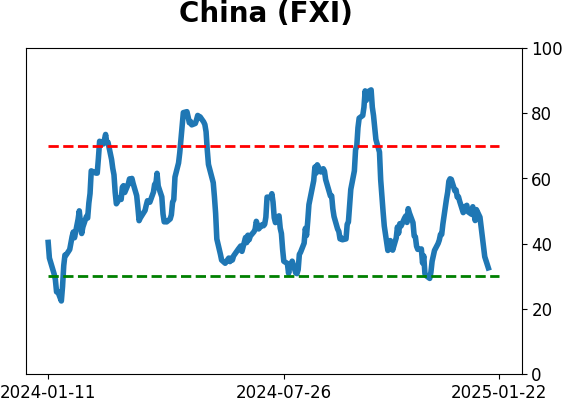
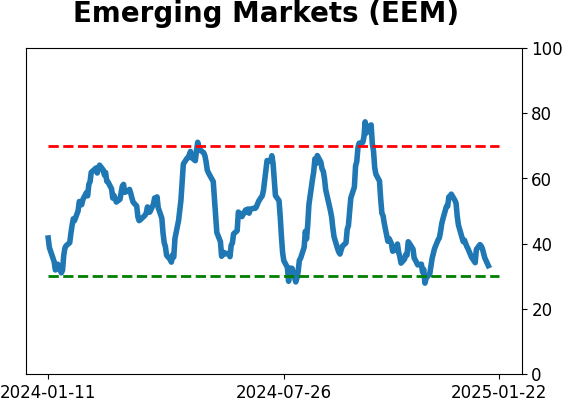
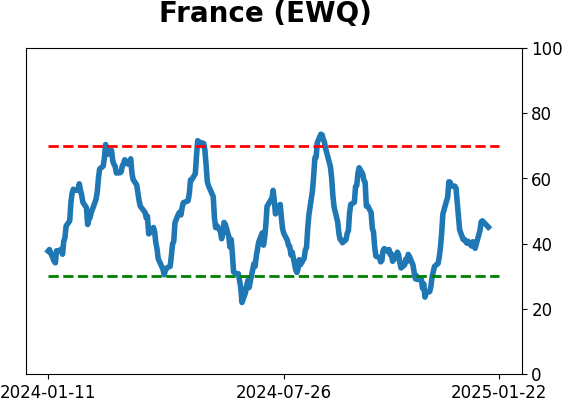
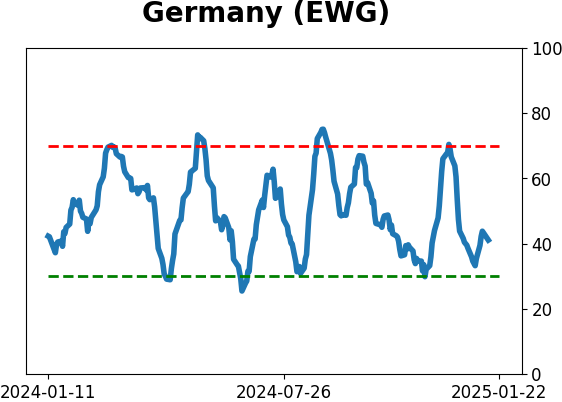
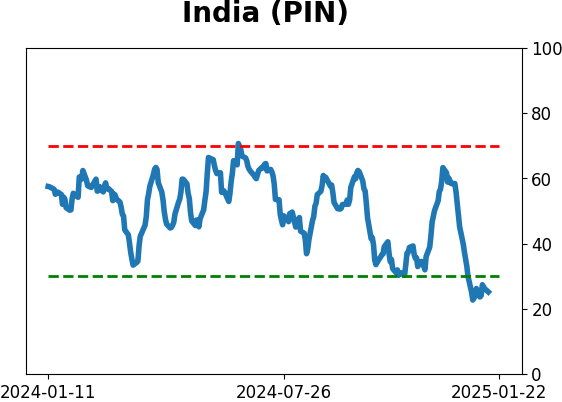
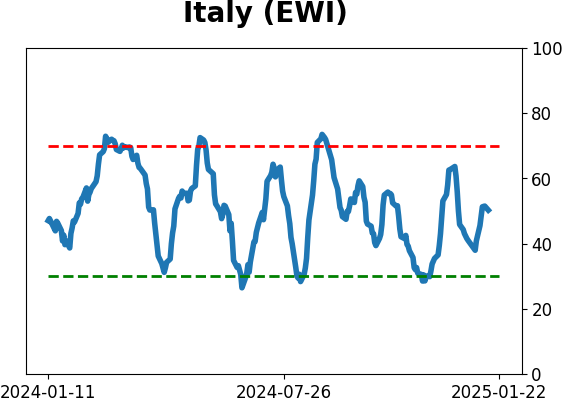
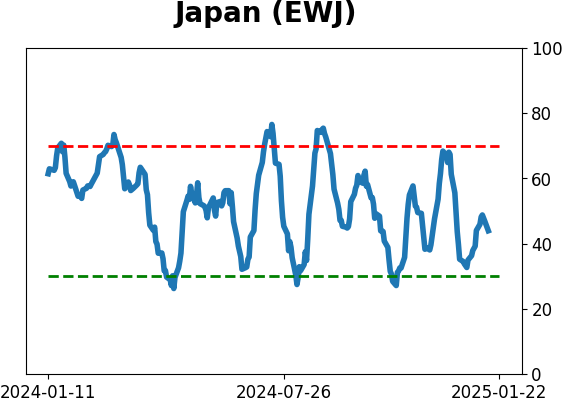
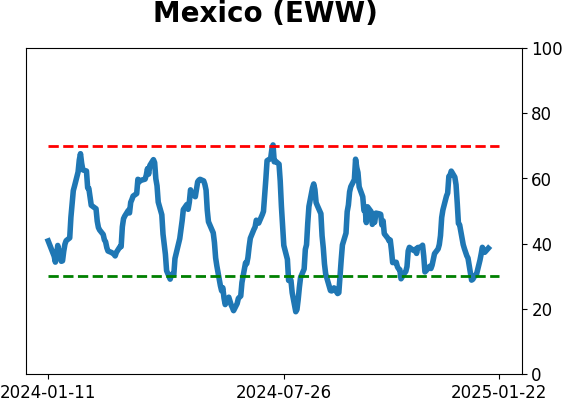
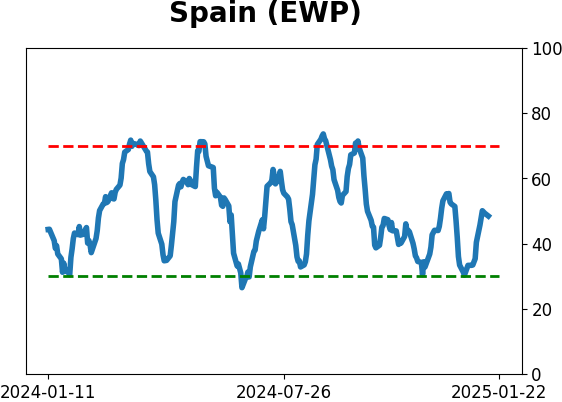
Sentiment Around The World
|
|
|
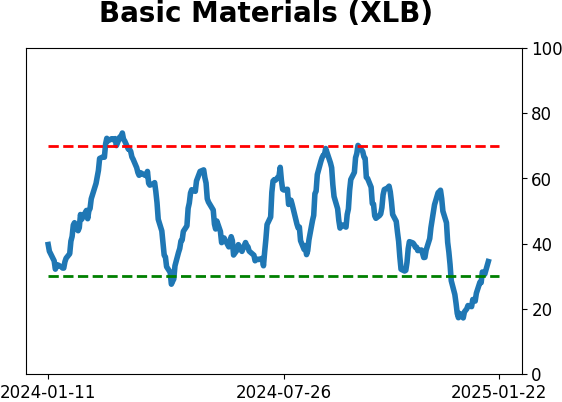
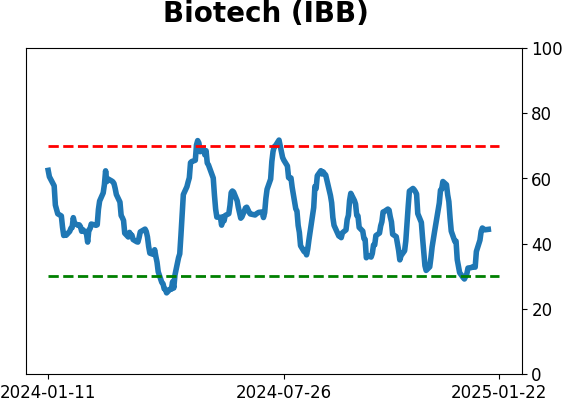
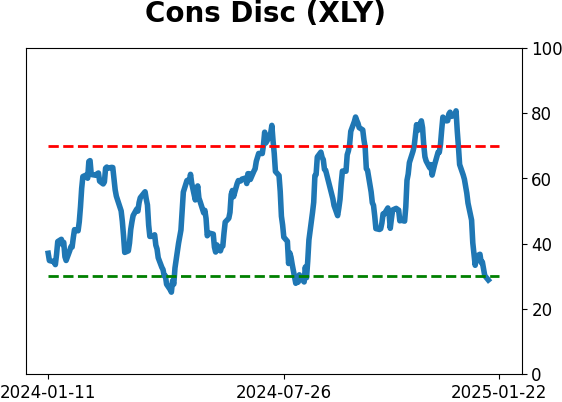
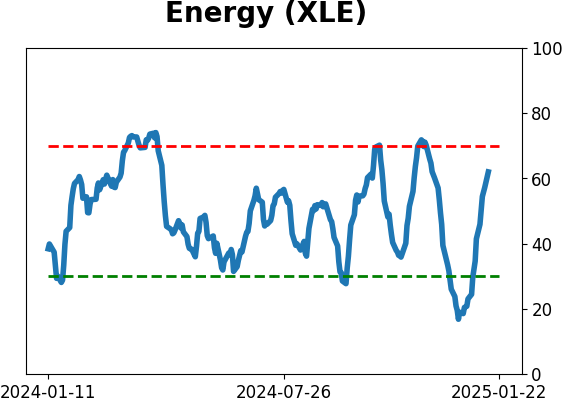
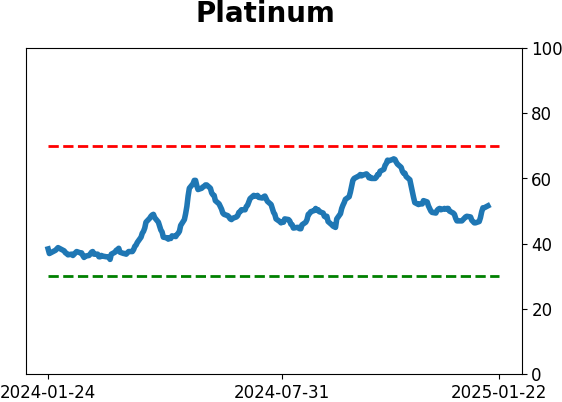
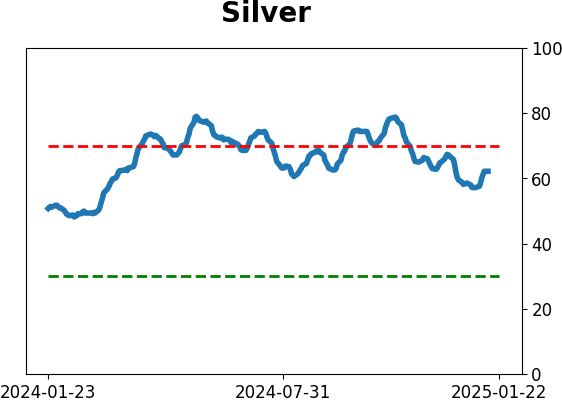
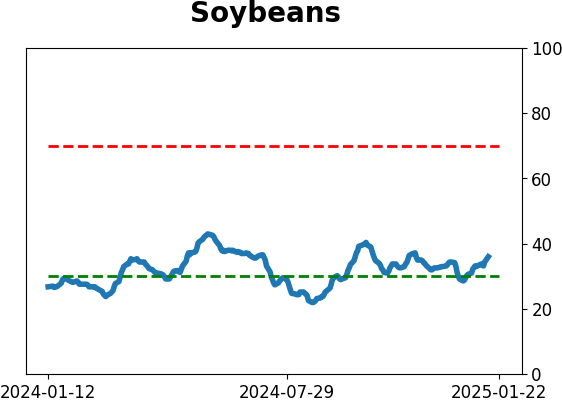
Optimism Index Thumbnails
|
|
|
|
|
|
|
|
|
|
|
|
|
|
|
|
|
|
|
|
|