Headlines
|
|
New highs dominate again but investors wary of another fakeout:
For the first time in a while, there are more securities on the NYSE trading at a 52-week high than 52-week low. The net percentage is not only positive, it's the highest in over a year. Similar recoveries tended to lead to good long-term returns, especially if buyers continued to follow-though in the short-term.
|
Smart / Dumb Money Confidence
|
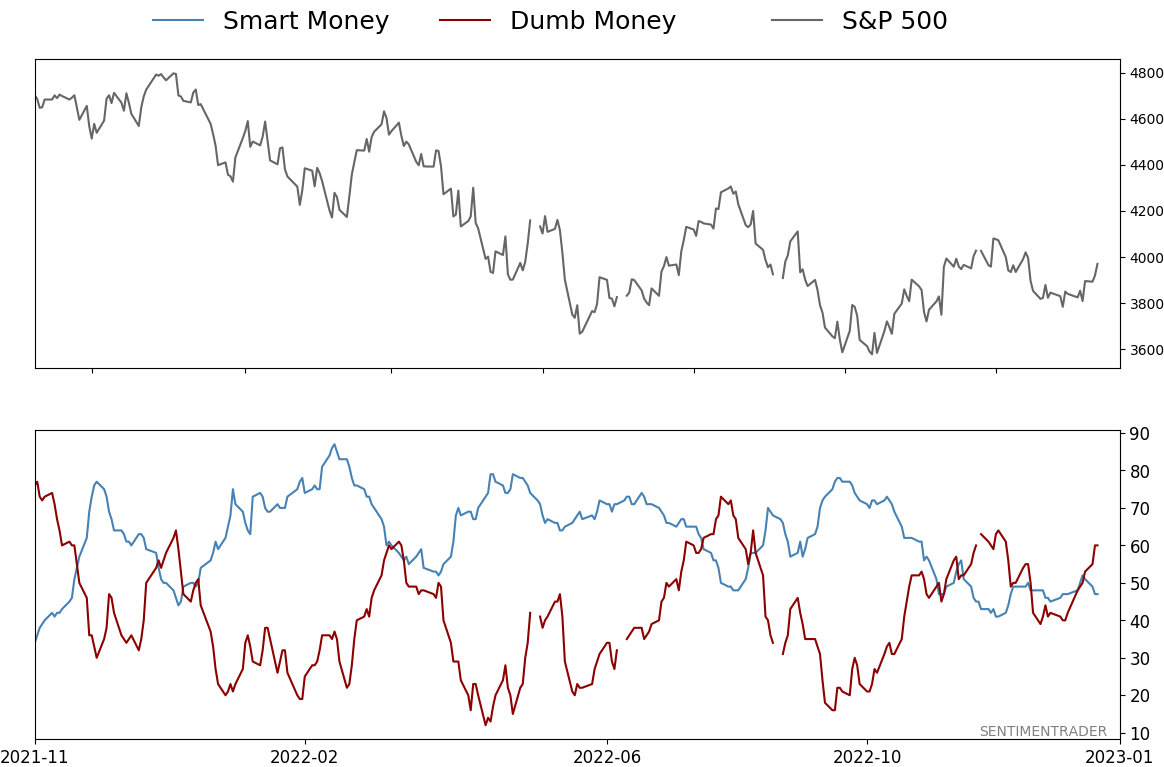
Smart Money Confidence: 47%
Dumb Money Confidence: 60%
|
|
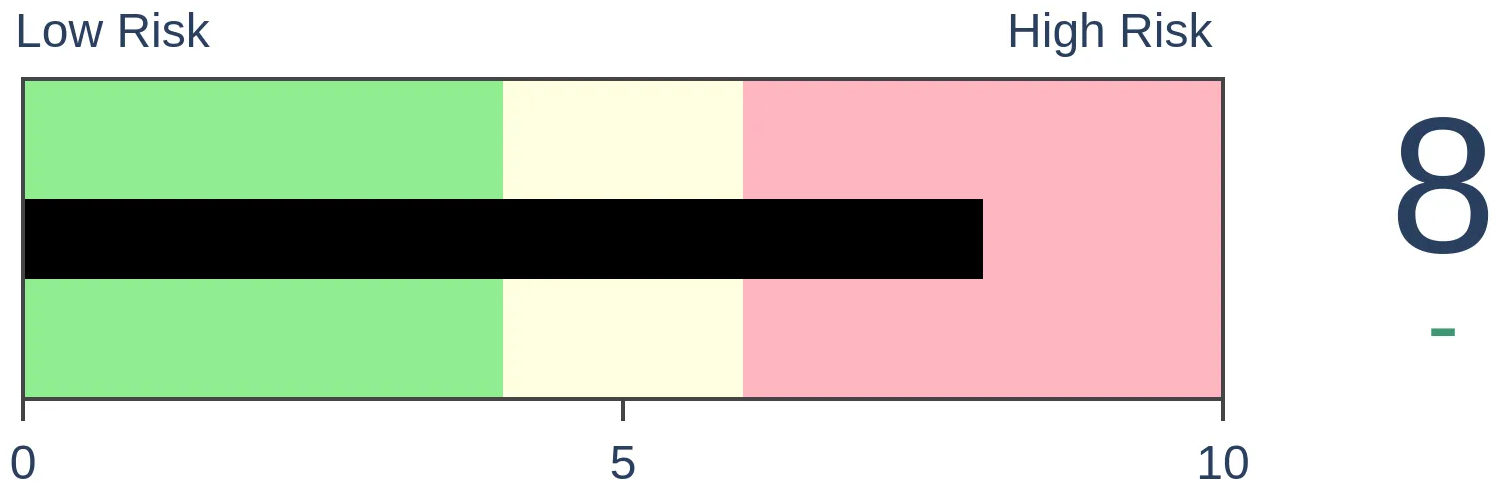
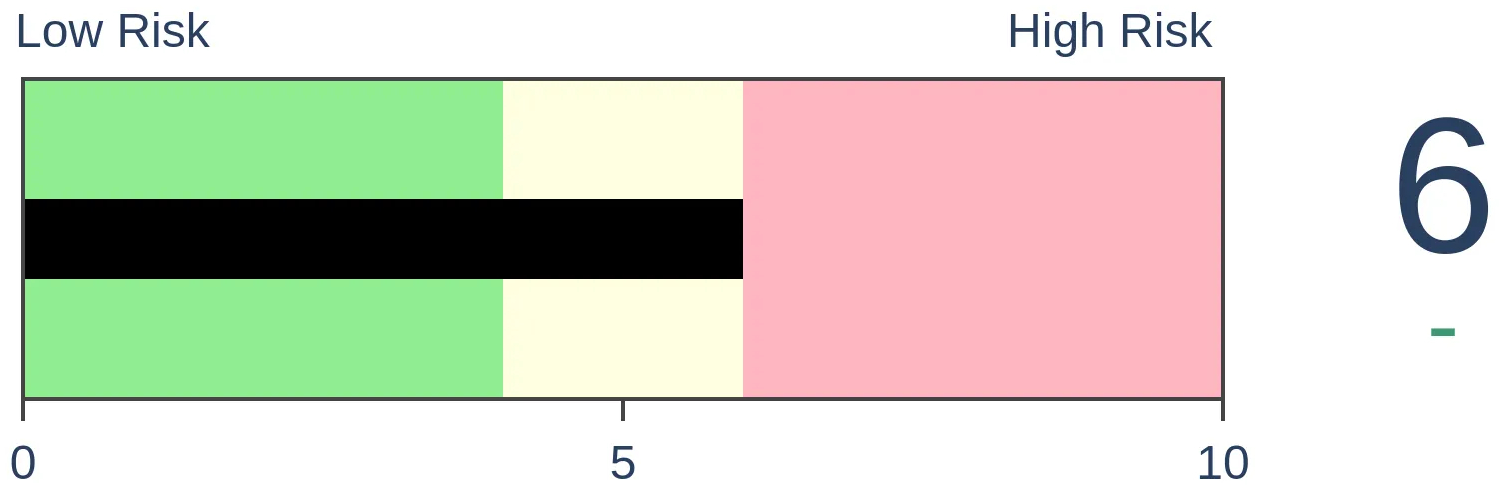
Risk Levels
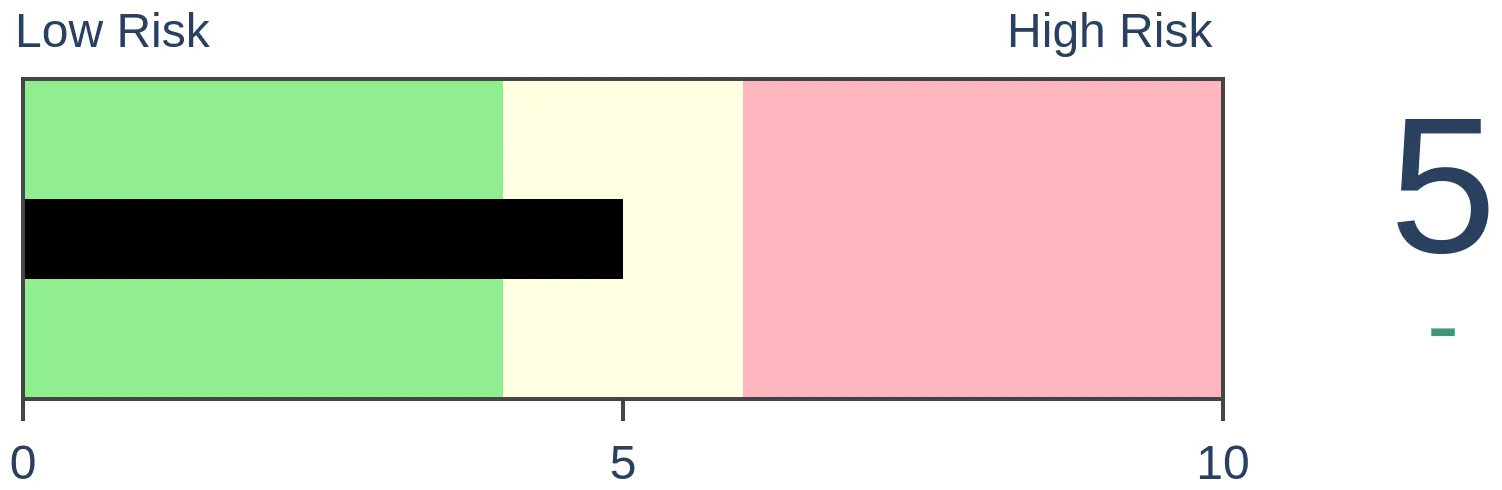
Stocks Short-Term
|
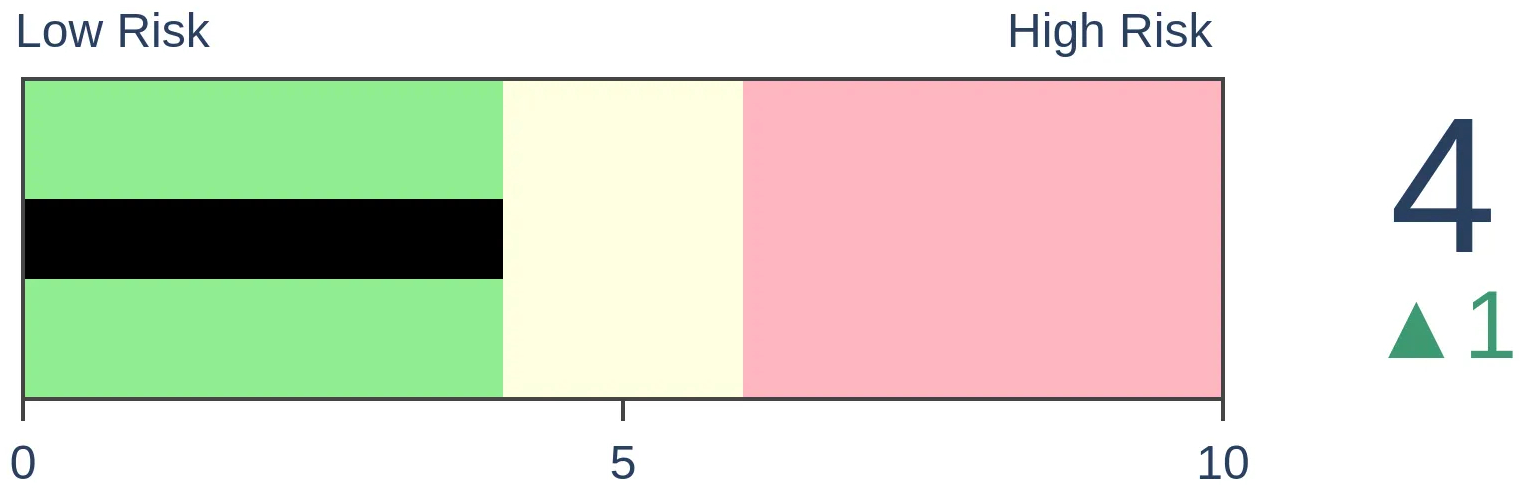
Stocks Medium-Term
|
|
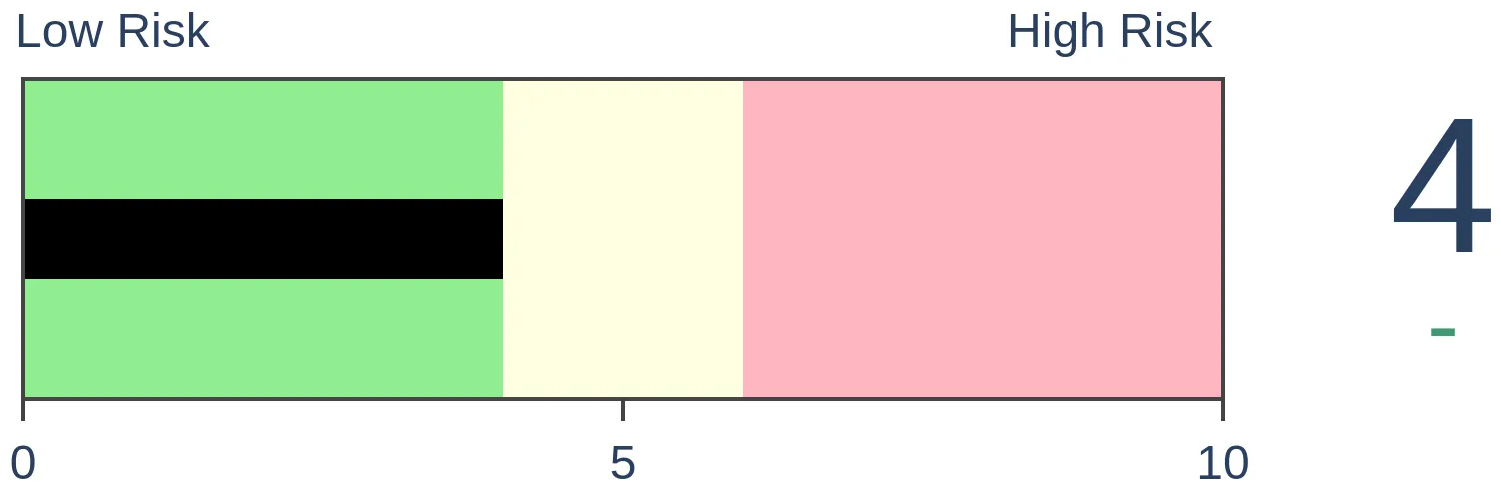
Bonds
|
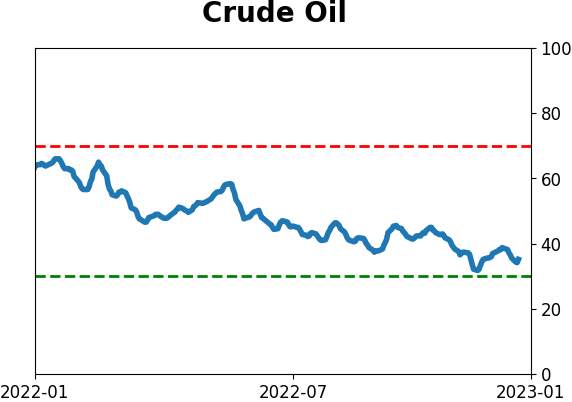
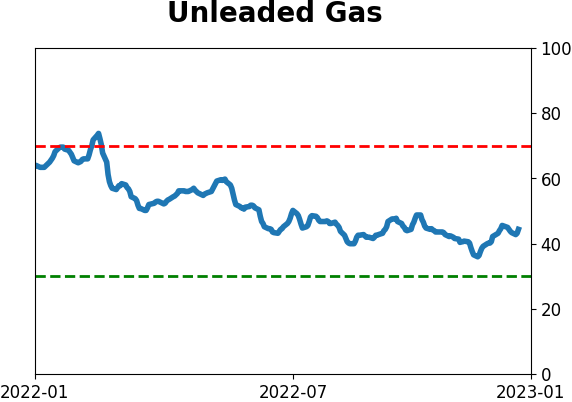
Crude Oil
|
|
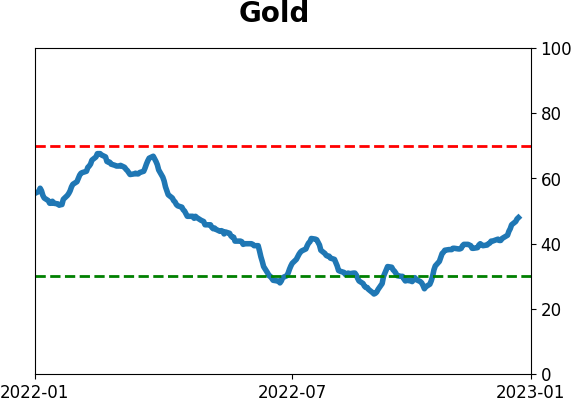
Gold
|
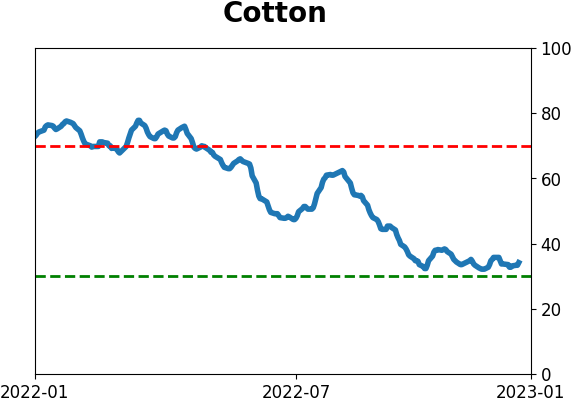
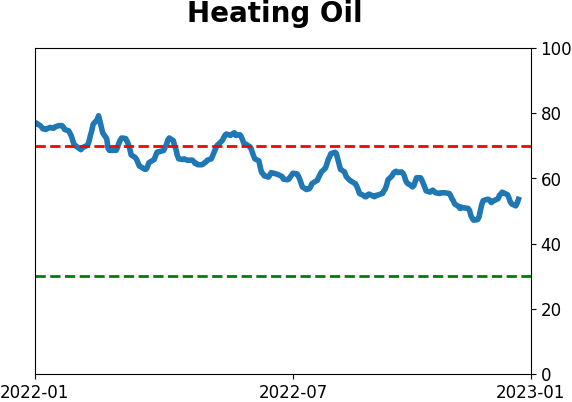
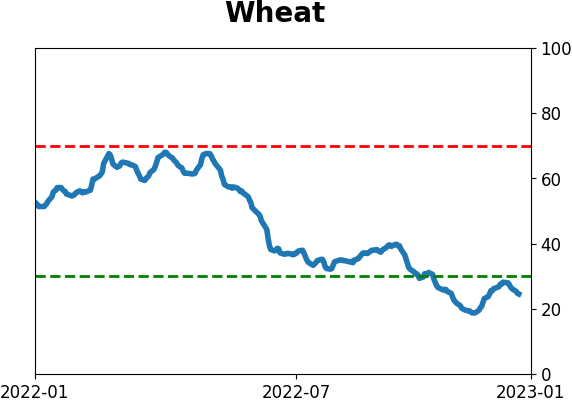
Agriculture

|
|
Research
By Jason Goepfert
BOTTOM LINE
For the first time in a while, there are more securities on the NYSE trading at a 52-week high than 52-week low. The net percentage is not only positive, it's the highest in over a year. Similar recoveries tended to lead to good long-term returns, especially if buyers continued to follow-though in the short-term.
FORECAST / TIMEFRAME
None
|
Key points:
- The net percentage of securities at 52-week highs minus 52-week lows has turned positive
- At nearly 3% of total issues, the indicator has recorded its highest reading in over a year
- Similar recoveries mostly preceded positive long-term returns, especially if buyers didn't immediately recede
The market environment is slowly improving
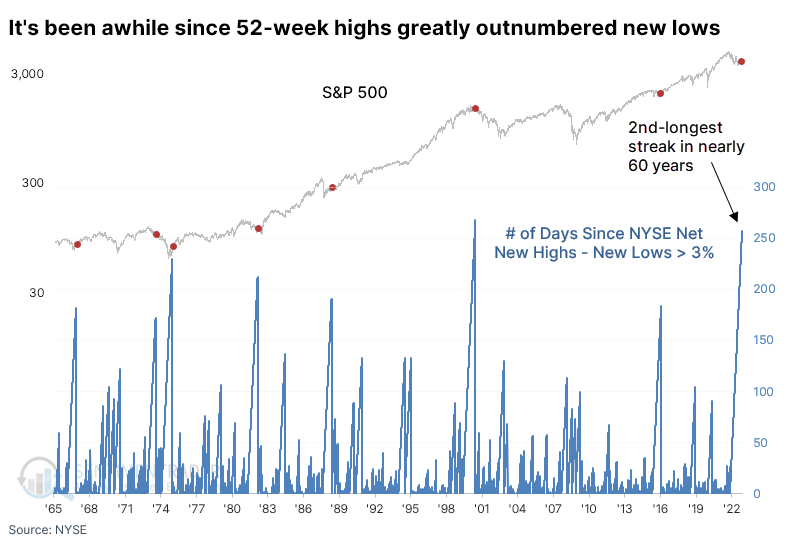
One of the hallmarks of this bear market has been the near-total domination of stocks falling to 52-week lows versus the relatively few managing to tick at a 52-week high.
That has finally changed. You gotta squint, but Monday's reading was the highest in over a year. There have been a few other fakeouts over the past year, so a positive reading is not an iron-clad guarantee that buyers are now in control.
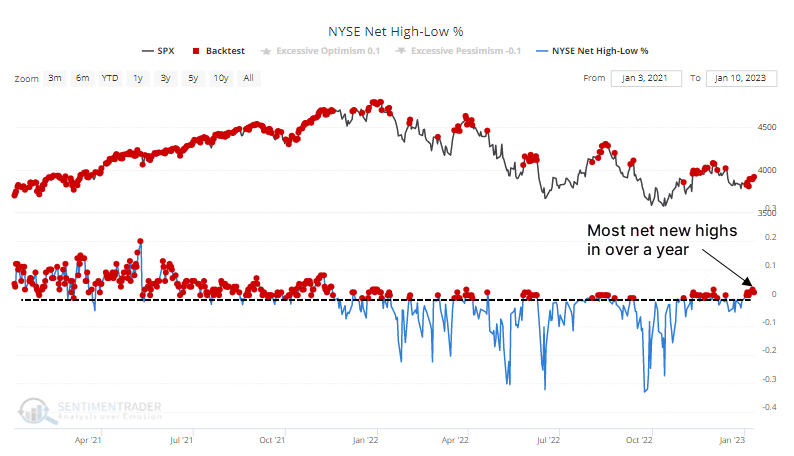
Even though there are more securities at new highs than new lows, it's still weak. It has now been over a year since there has been more than a net 3% of new highs versus new lows. It's the 2nd-longest streak since at least 1965. The other periods of extended weakness were around bear market lows, except for 1973 and 2000.
The table below shows other times when the net percentage of securities at highs minus lows cycled from -20% to a positive reading and the highest figure in at least a year. Forward returns in the S&P 500 were mixed over the next month or so, then gradually improved.
Over the following year, returns tended to be fairly strong, with low risk and high reward. Out of the 19 signals, there were 3 distinct failures.
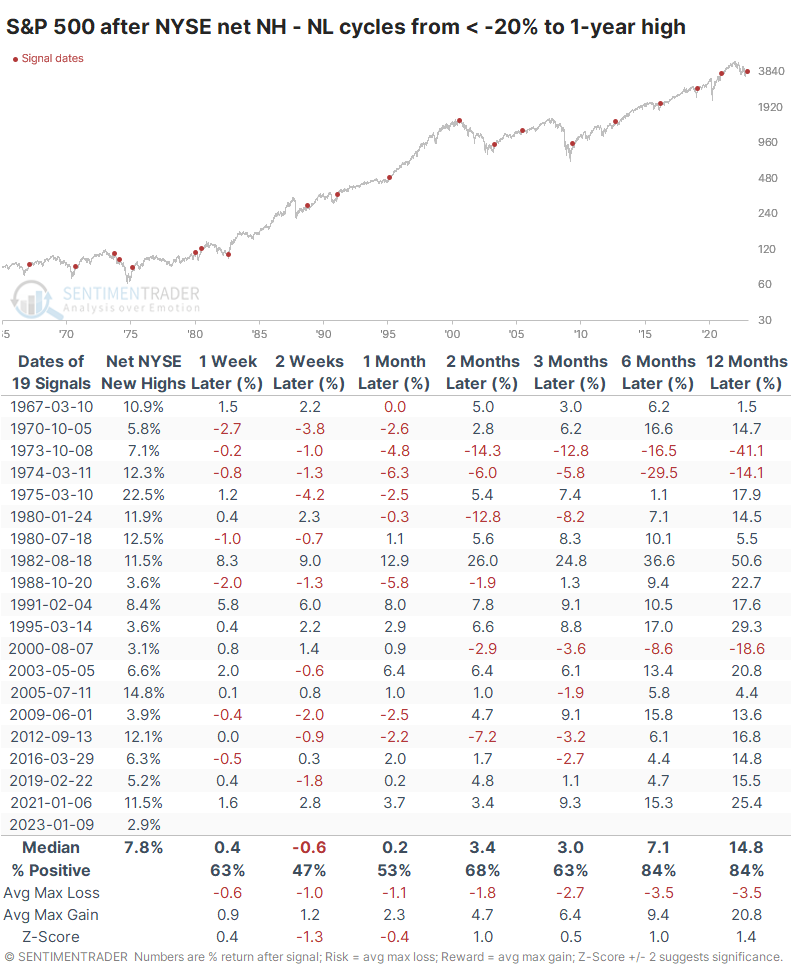
There was a +0.43 correlation (on a scale of -1.0 to +1.0) between the S&P's one-week and one-year returns. It's a modest suggestion that if buyers continue to find interest in stocks short-term, it bodes well long term. It's not fool-proof, but generally, if sellers dominated soon after these new one-year highs in breadth, forward returns were significantly worse than if buyers dominated short-term. Follow-through was important.
What the research tells us...
Last year was a constant reminder that chasing rallies in bear markets is a brutal way to make a living. Every time sentiment turned modestly optimistic and breadth seemed to be turning a corner, buyers stepped away, and investors got slapped. Understandably, sentiment has been relatively tepid lately - multiple failures will do that. Based on the above, the recovery in securities trading at new highs versus lows is an encouraging longer-term sign. It would become even more so if buyers continue to show up over the next couple of weeks.
Indicators at Extremes
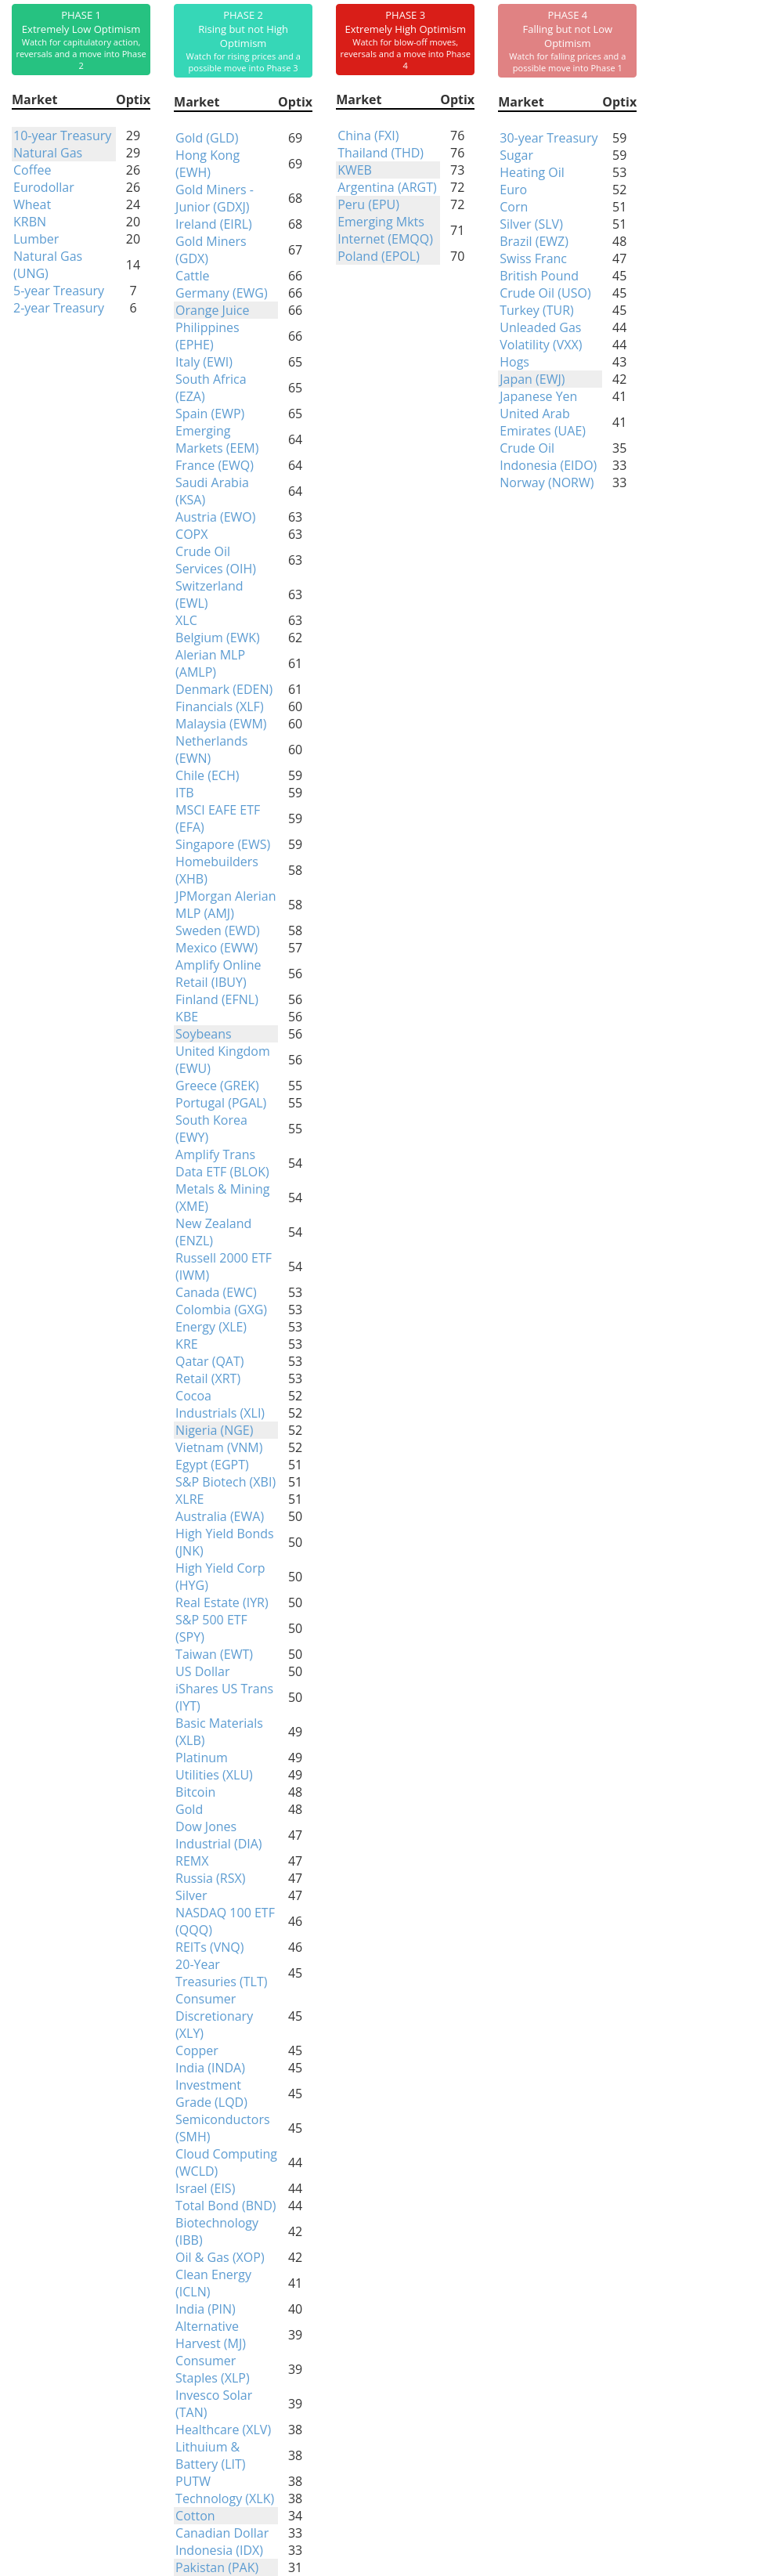
Phase Table
Ranks
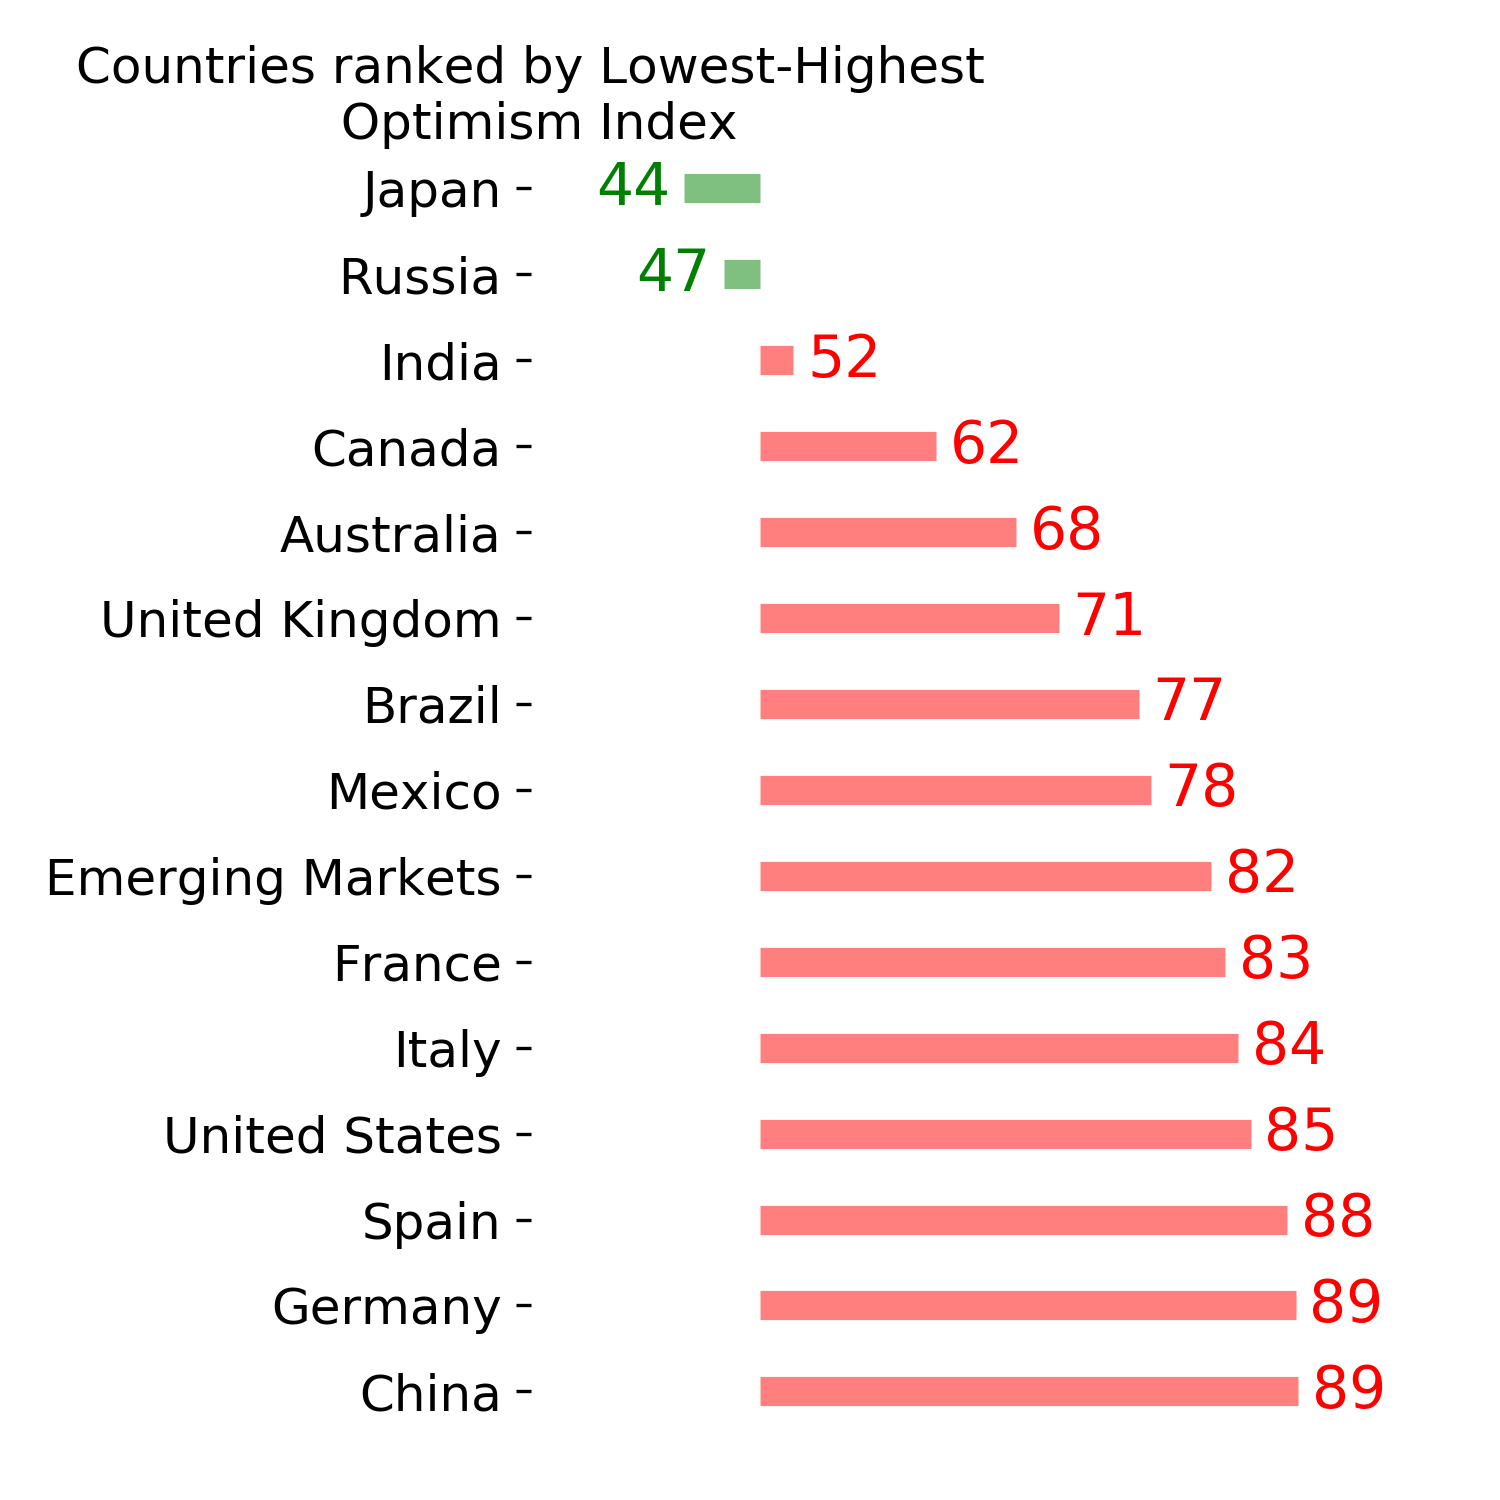
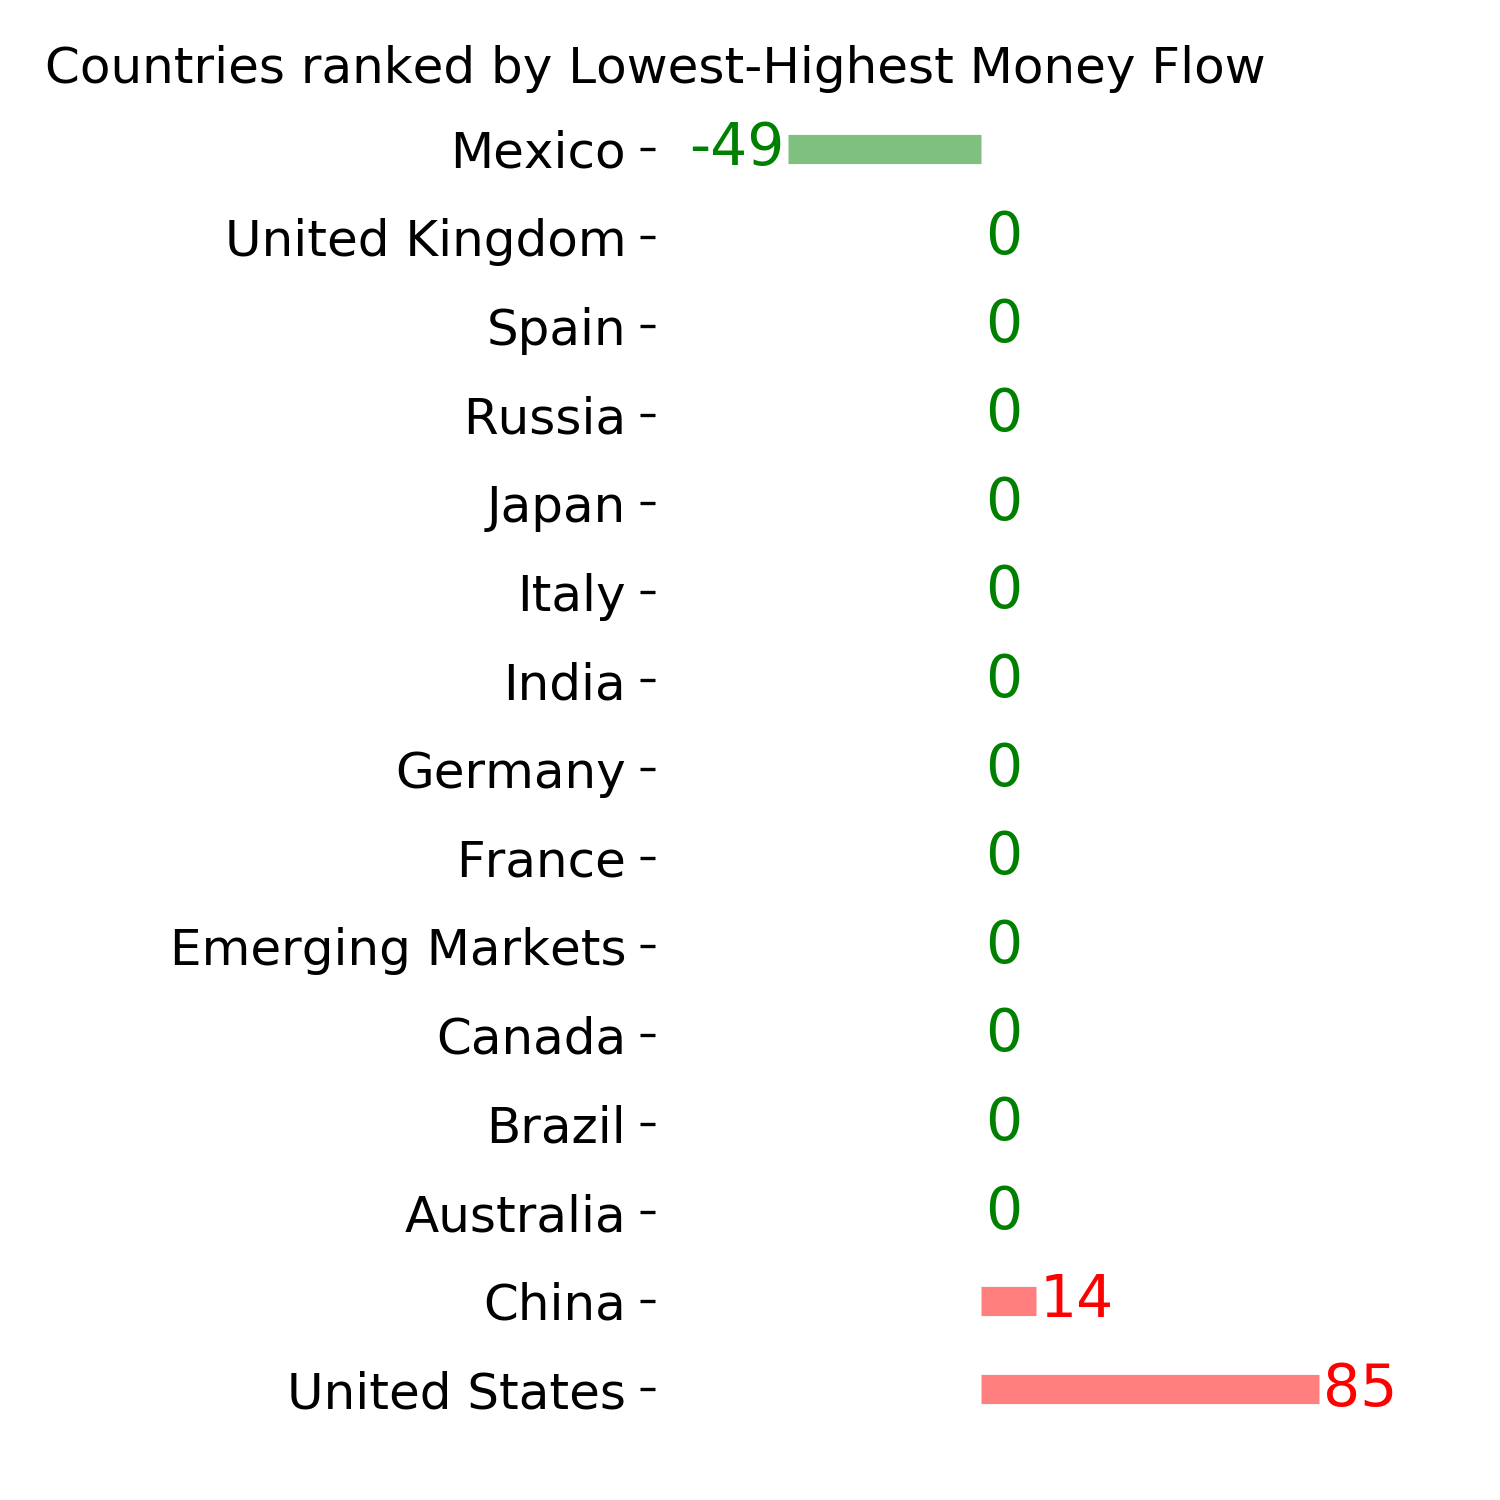
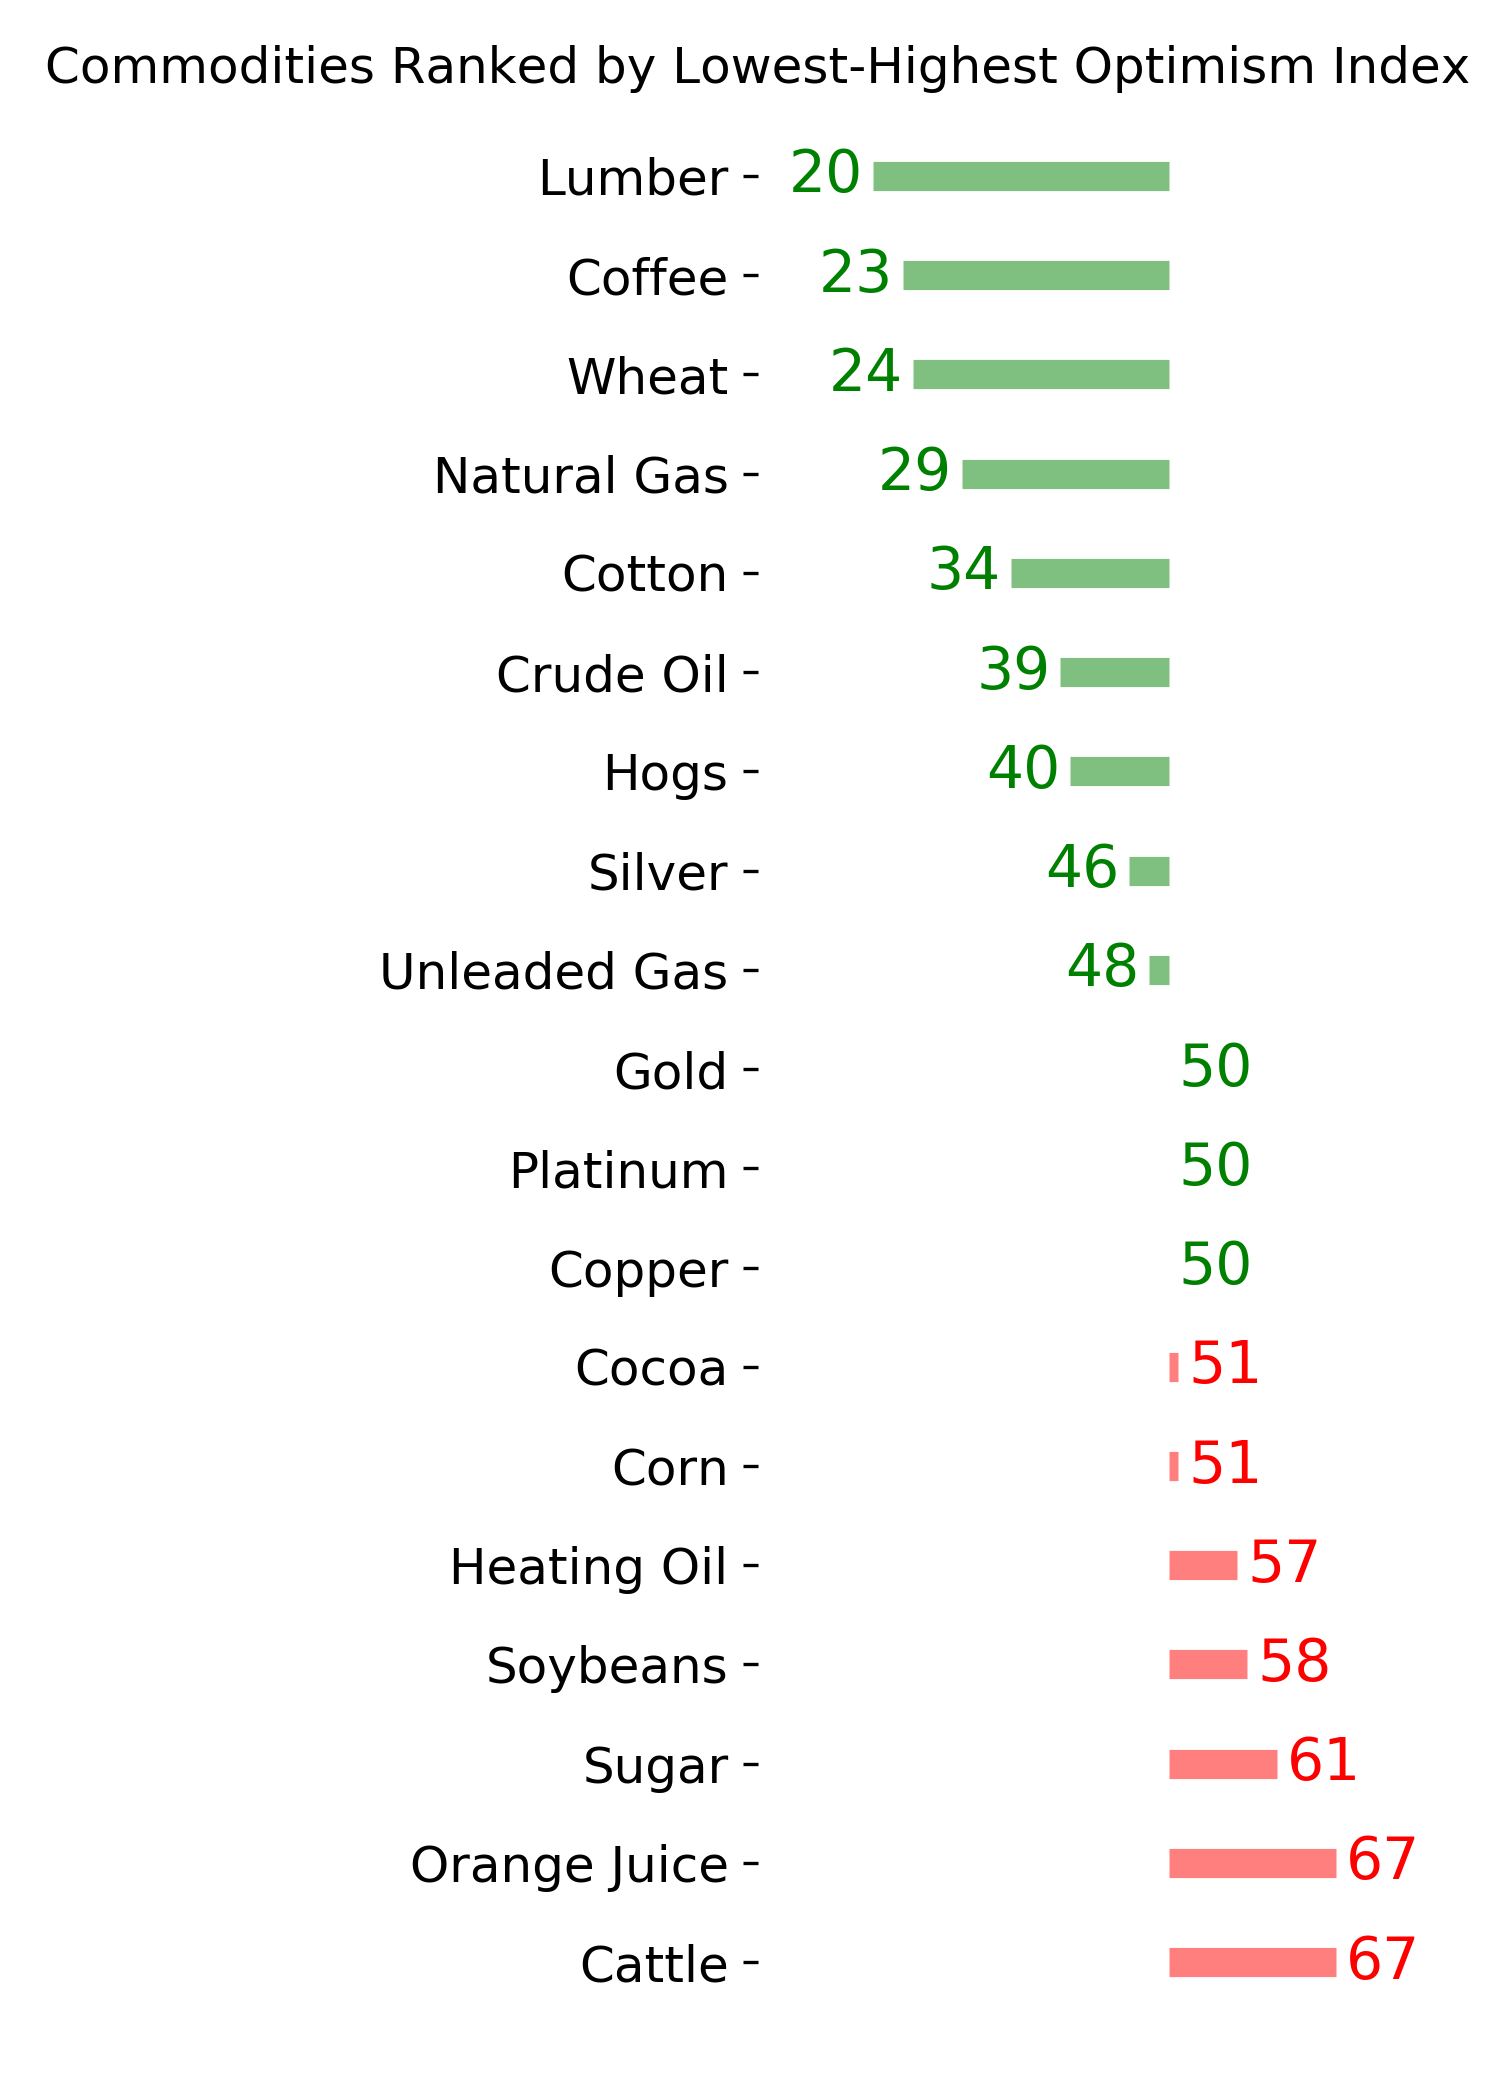
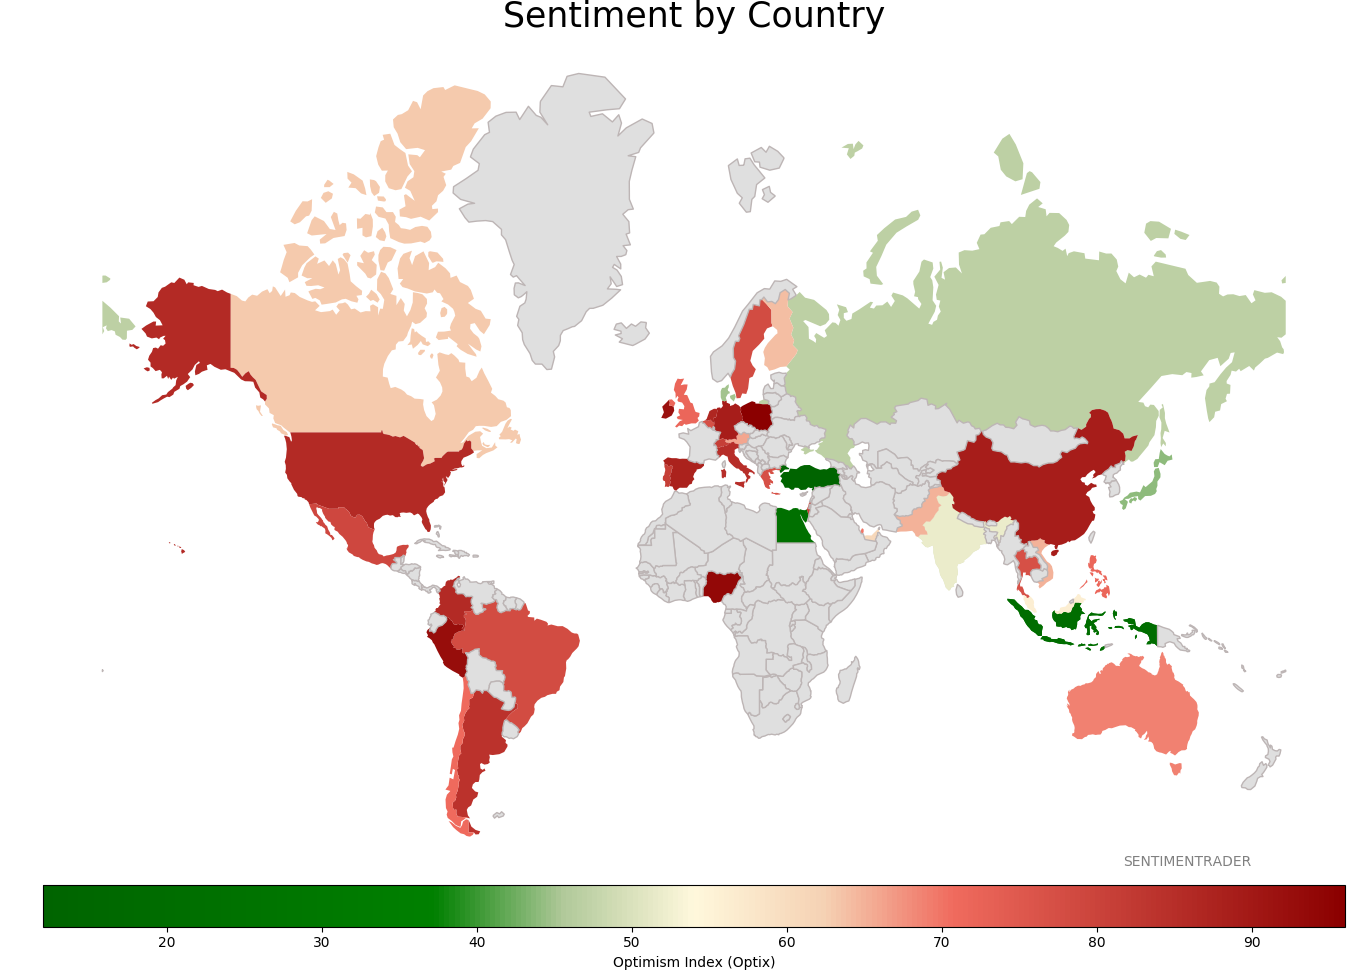
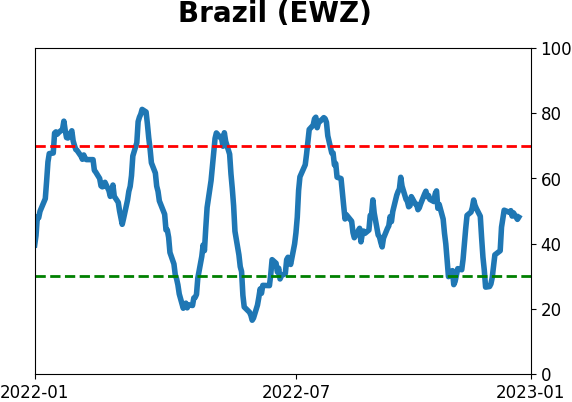
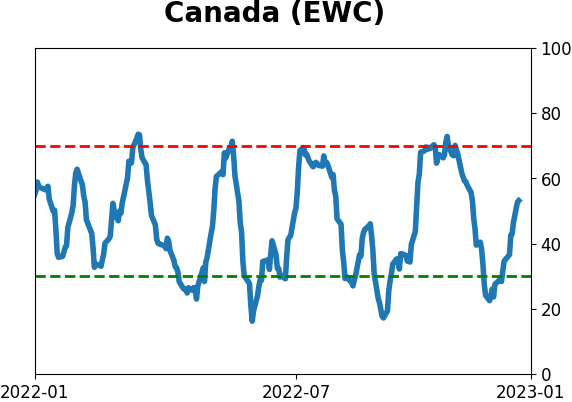
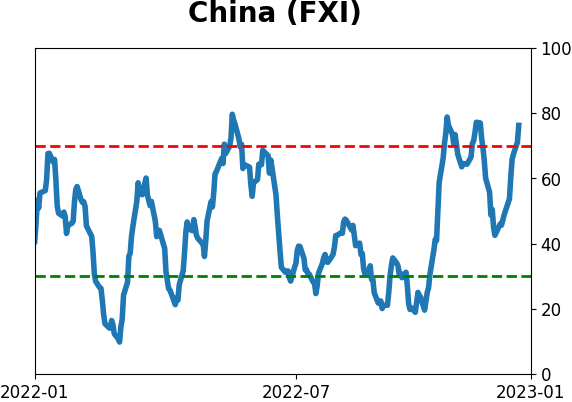
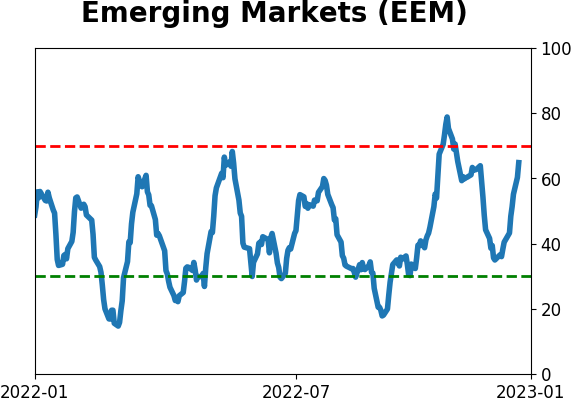
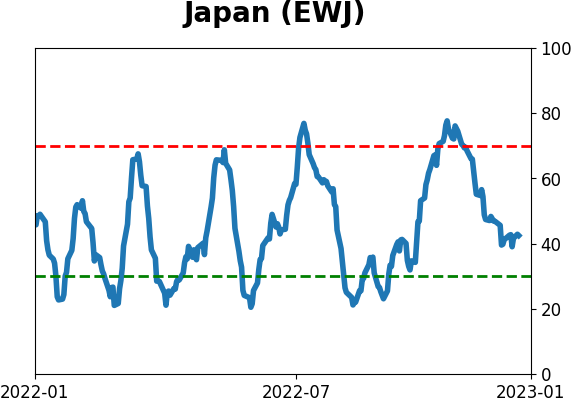
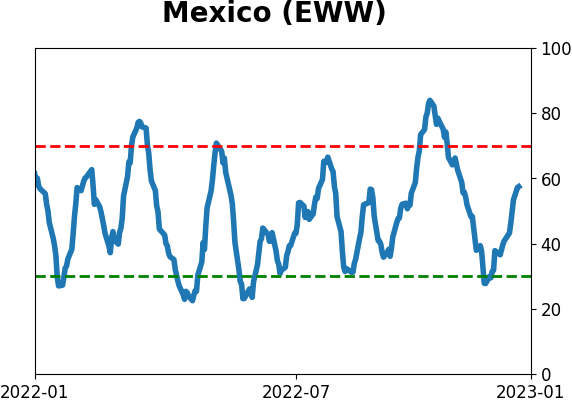
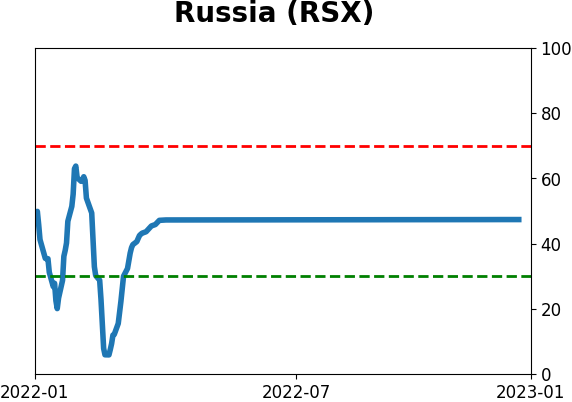
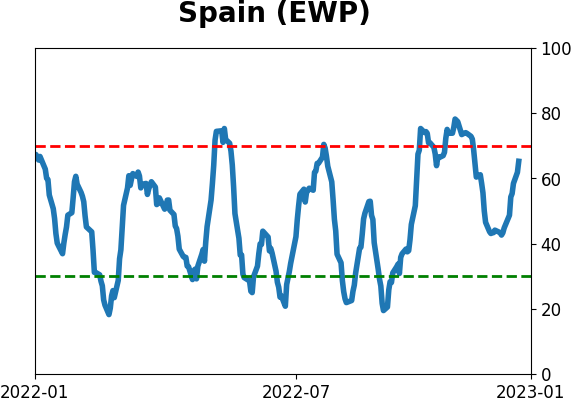
Sentiment Around The World
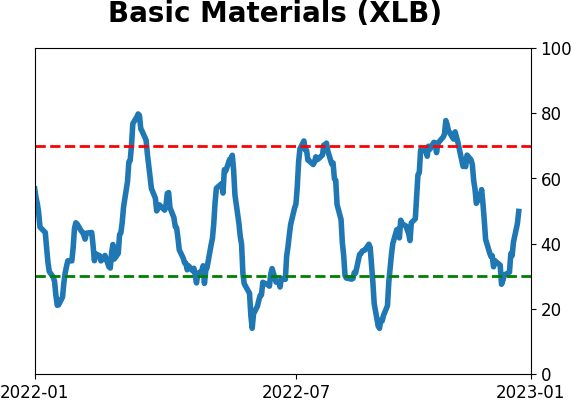
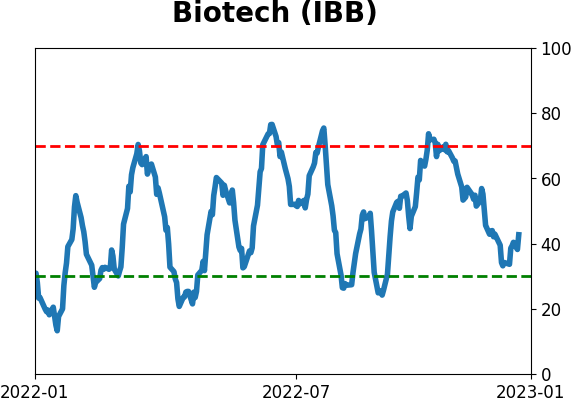
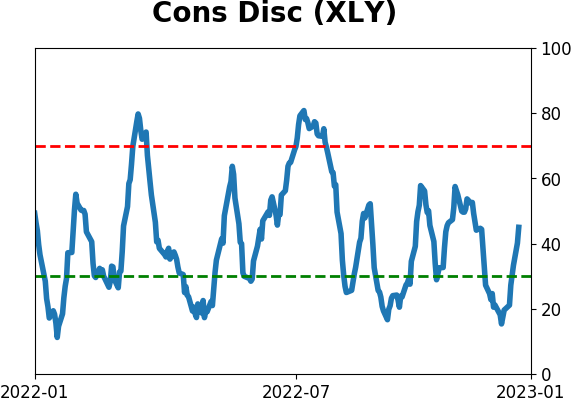
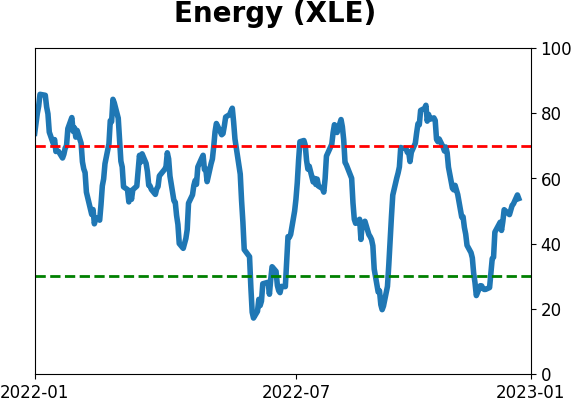
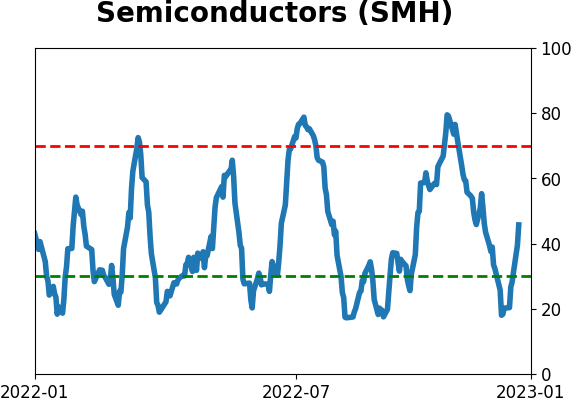
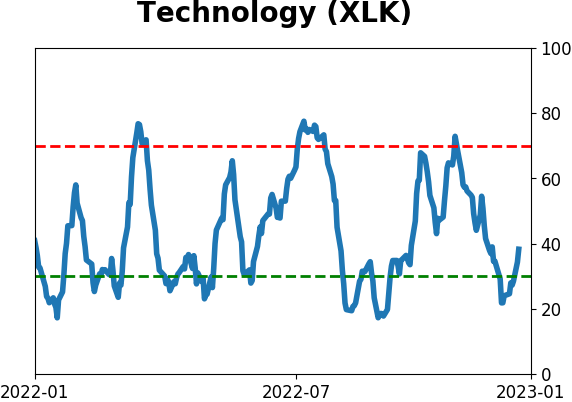
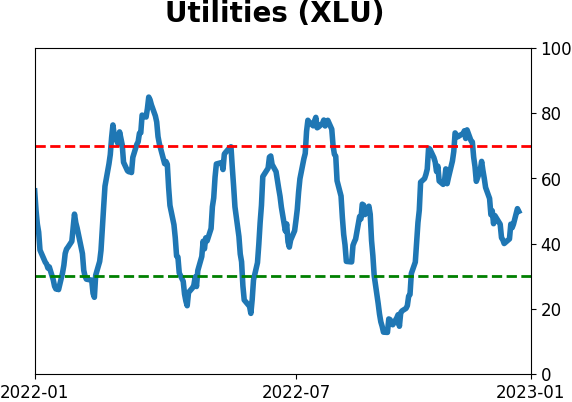
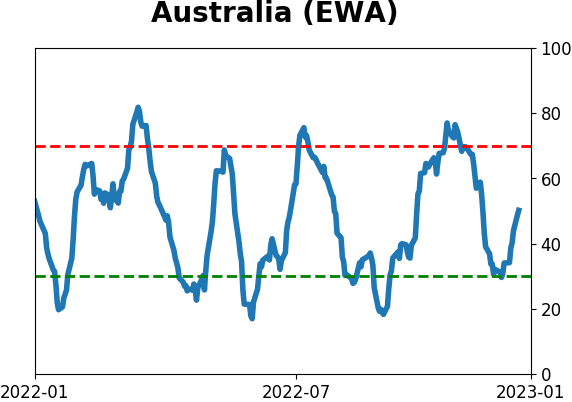
Optimism Index Thumbnails
|
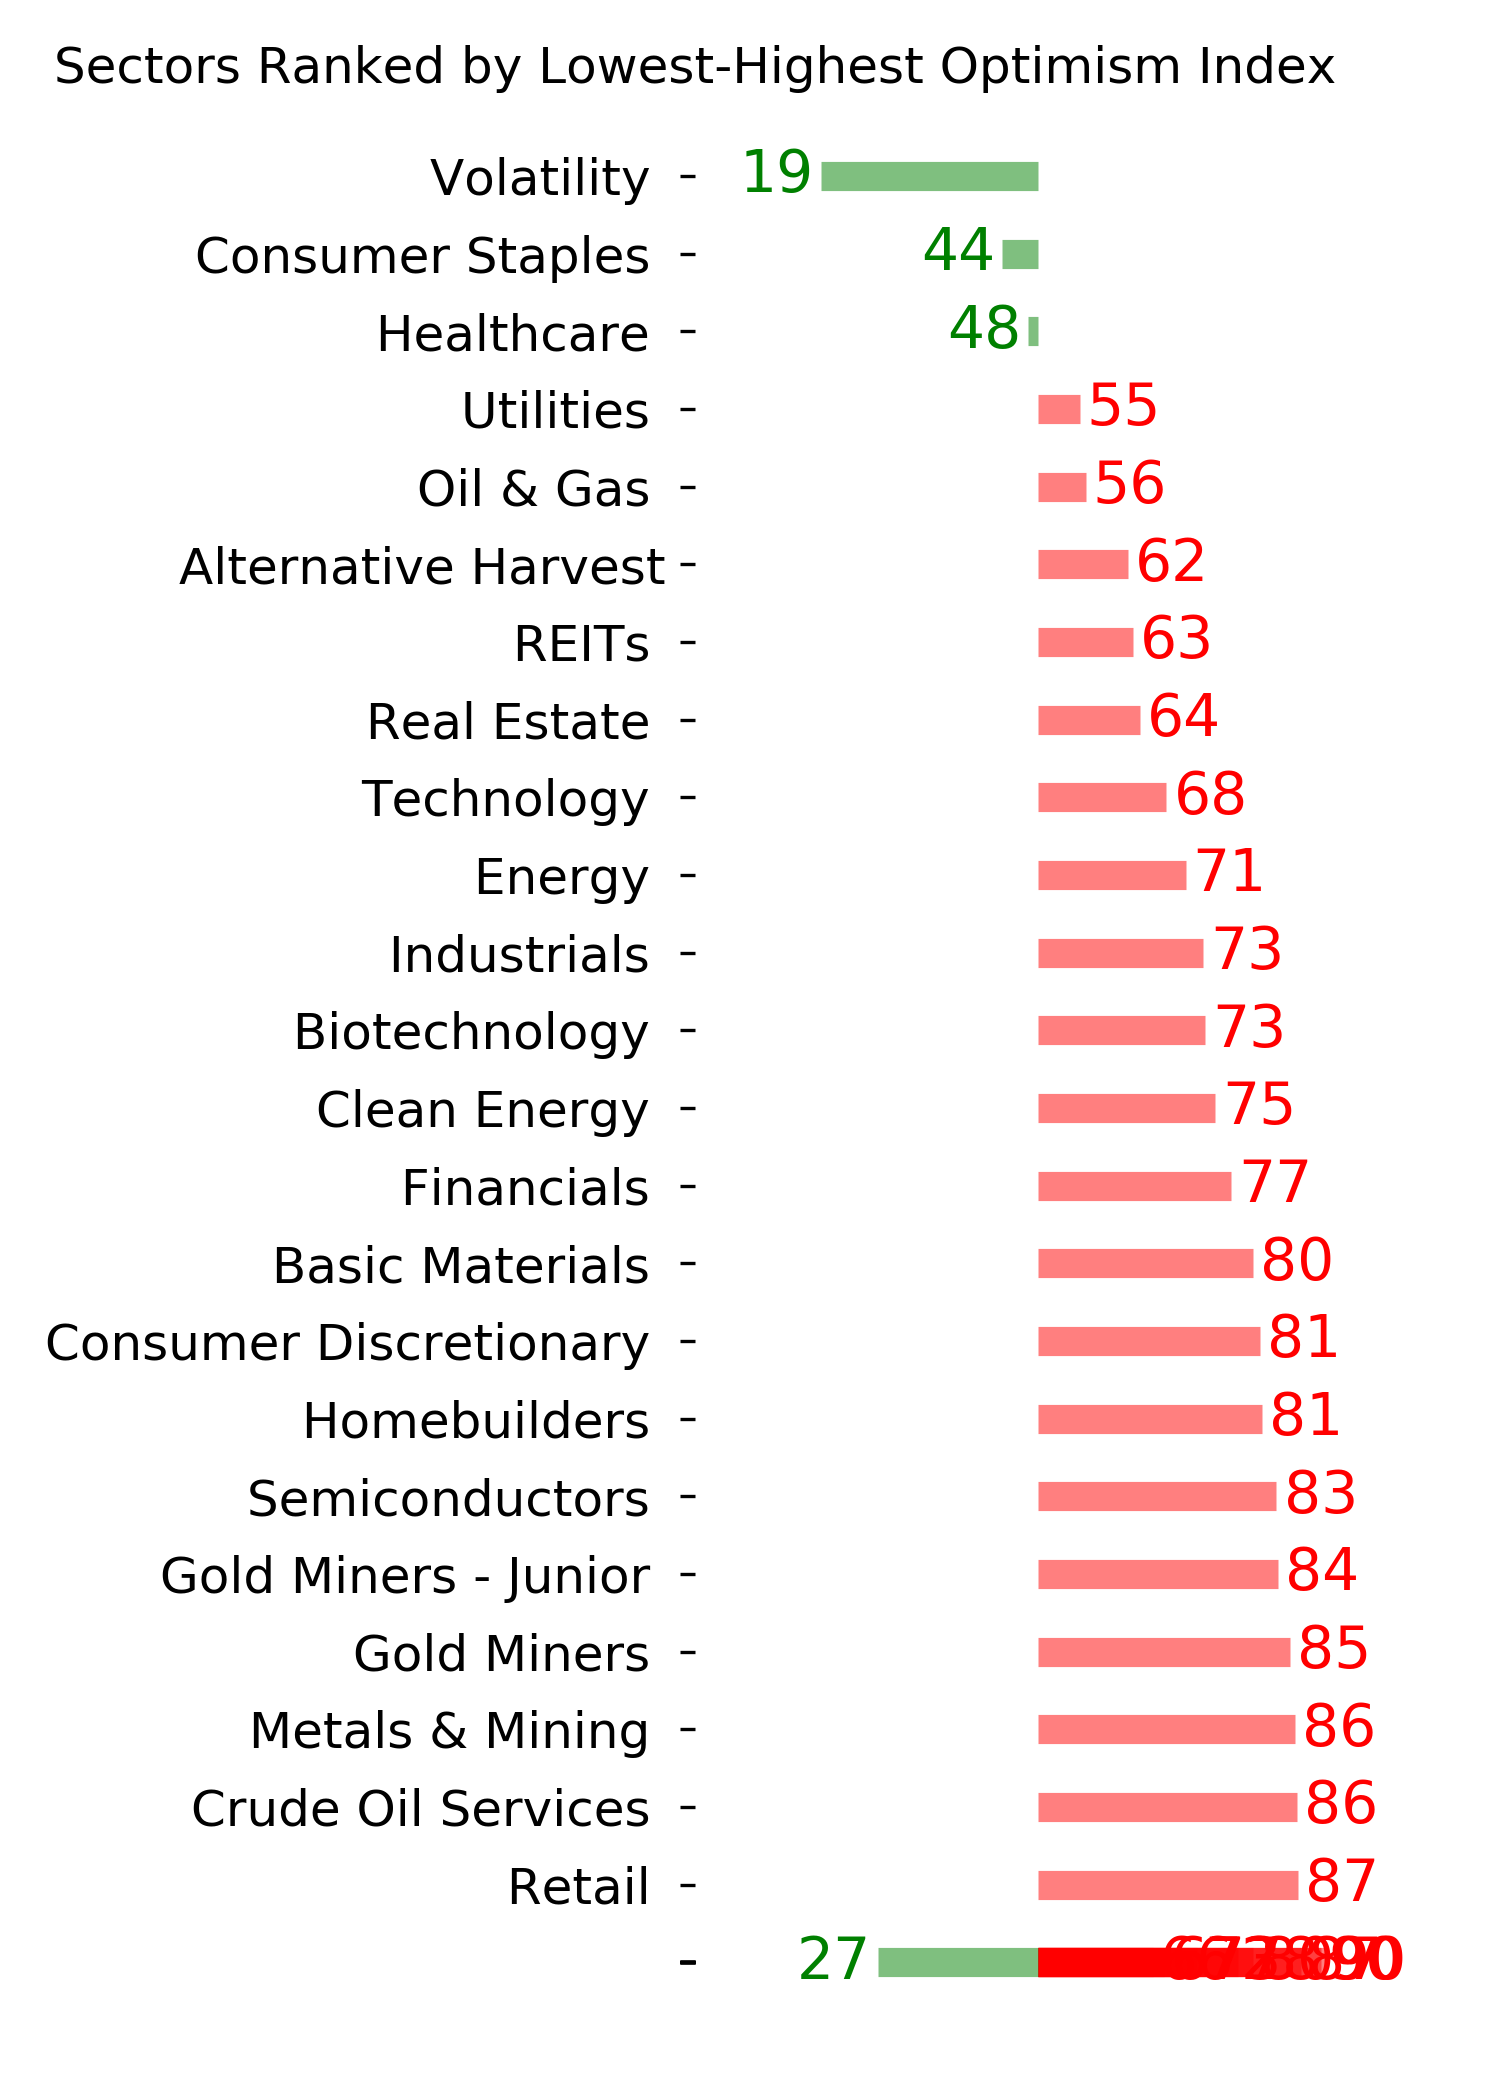
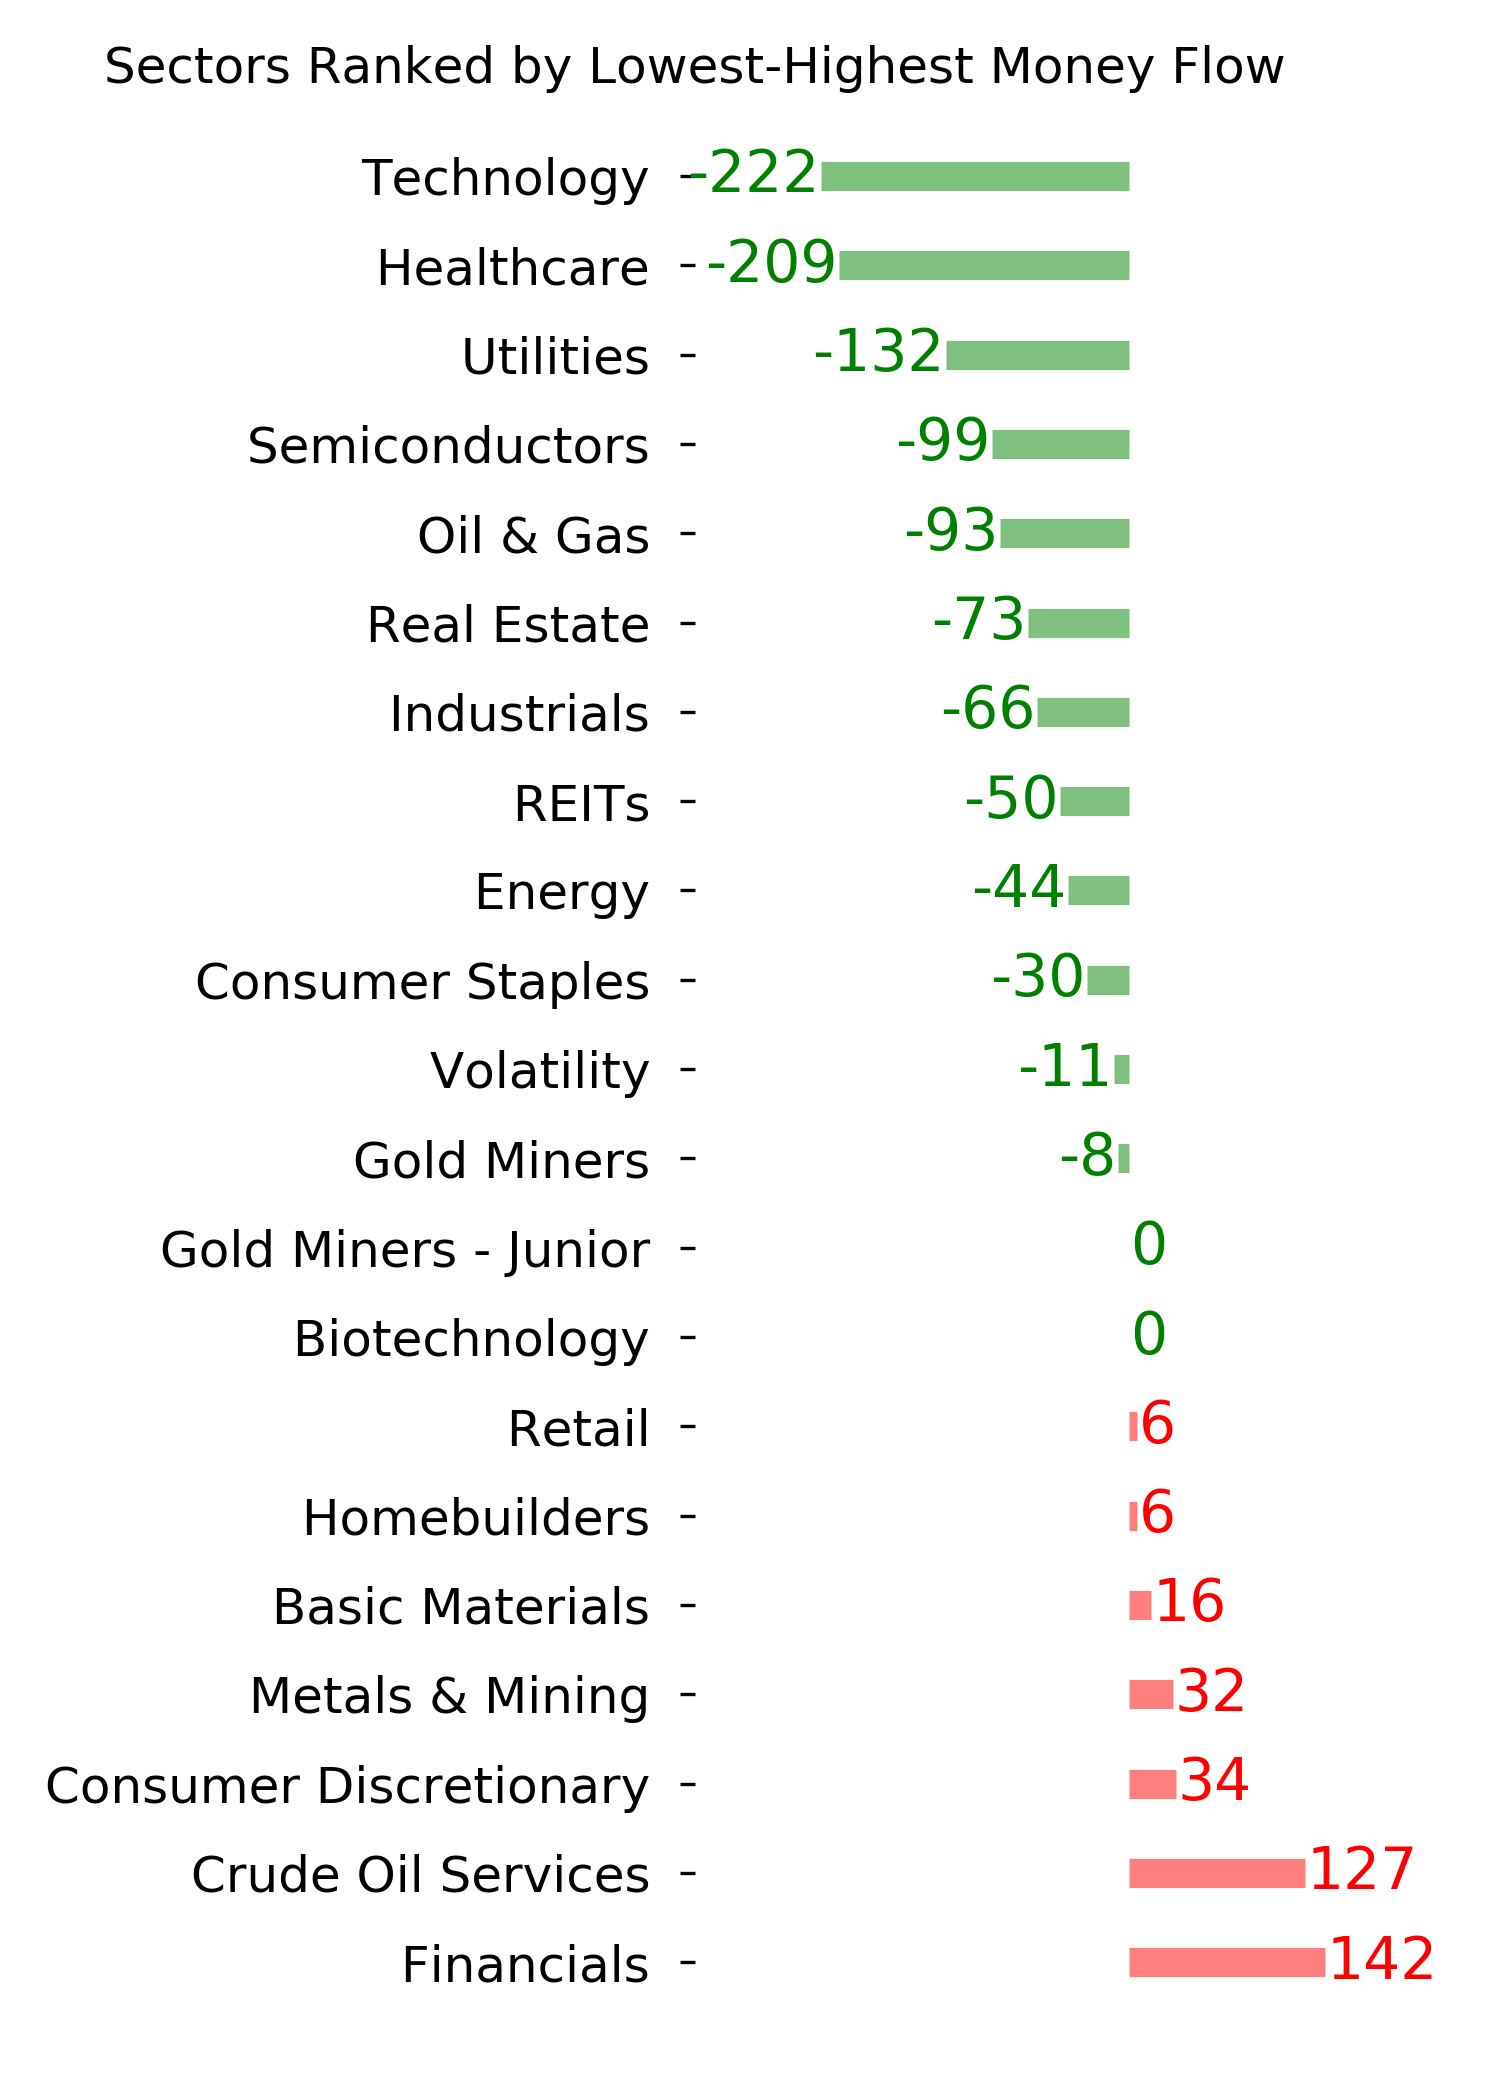
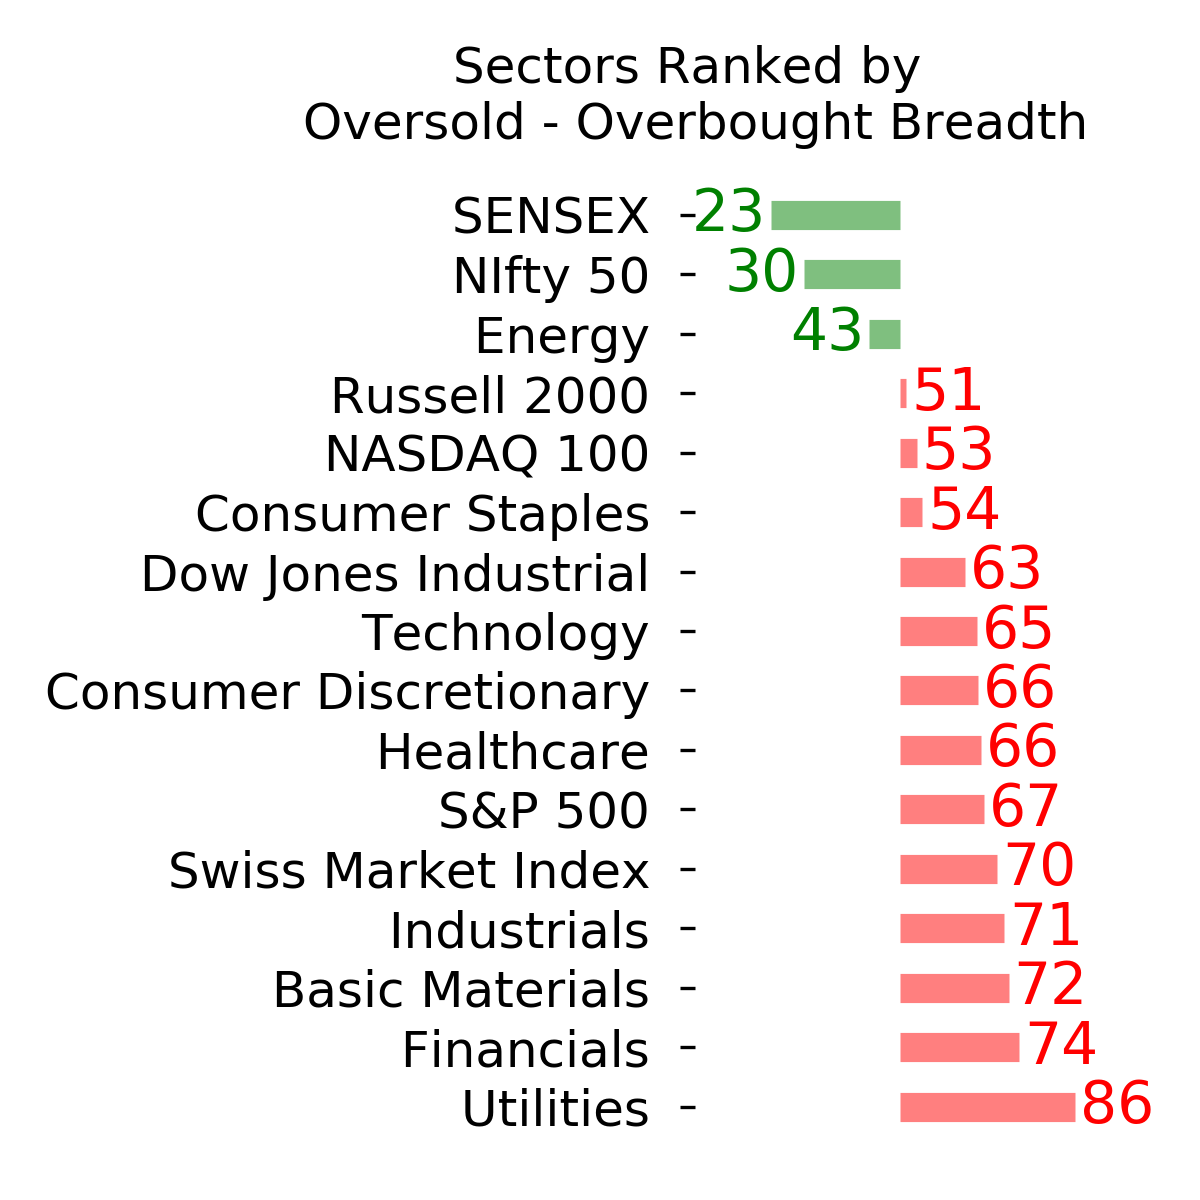
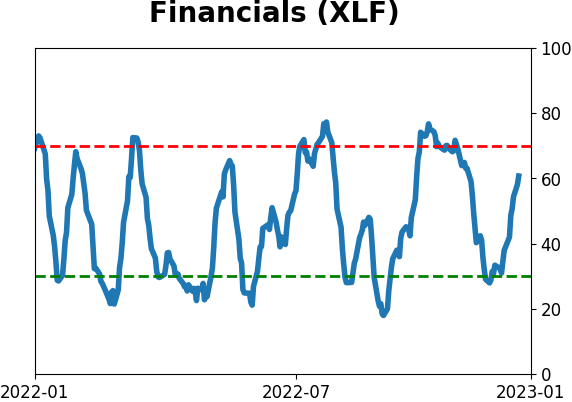
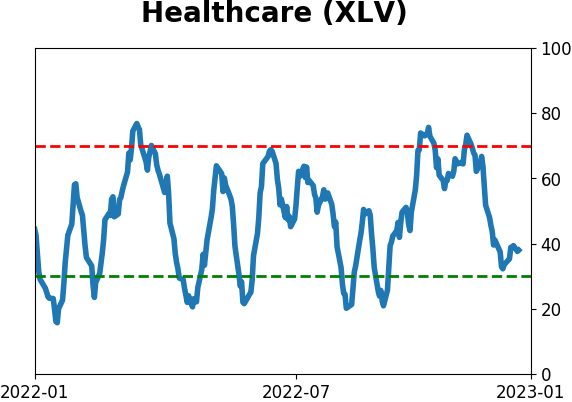
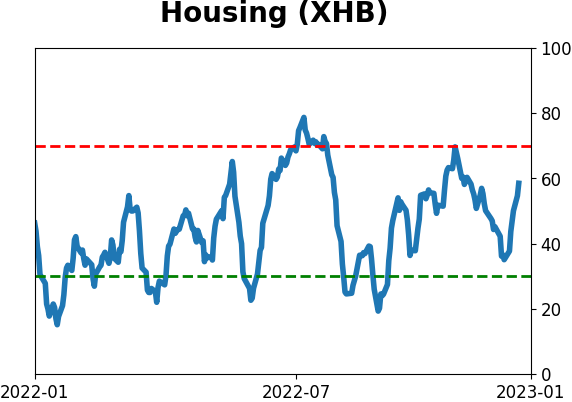
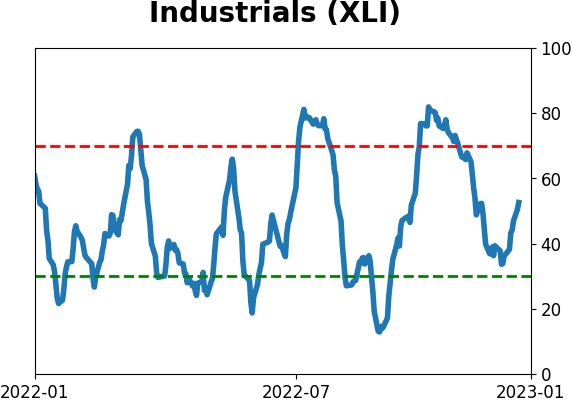
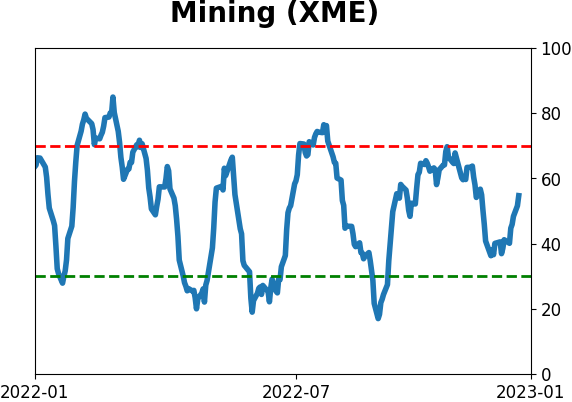
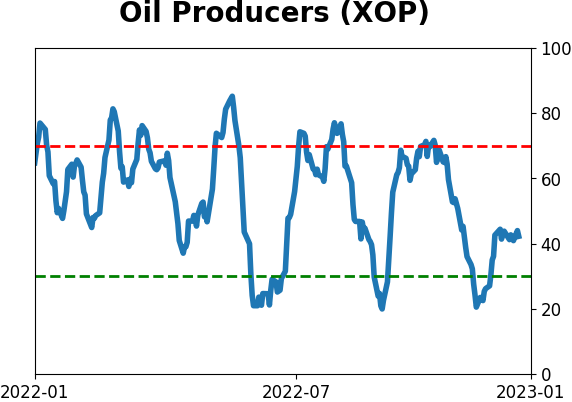
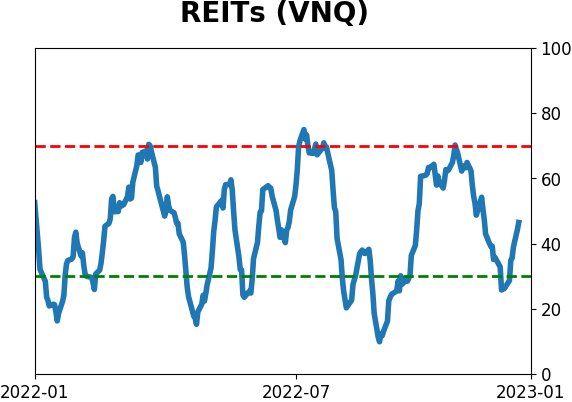
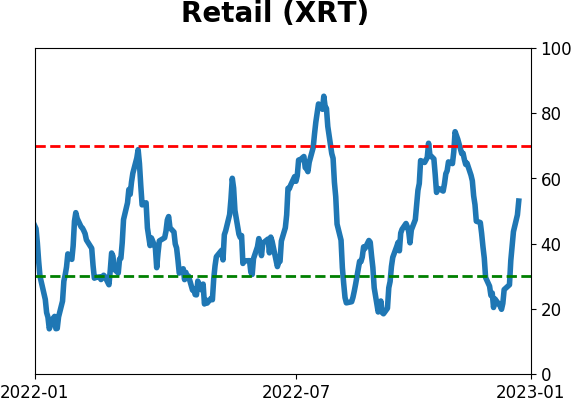
Sector ETF's - 10-Day Moving Average
|
|
|
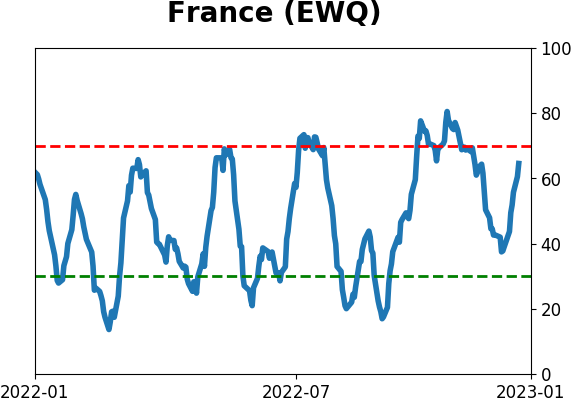
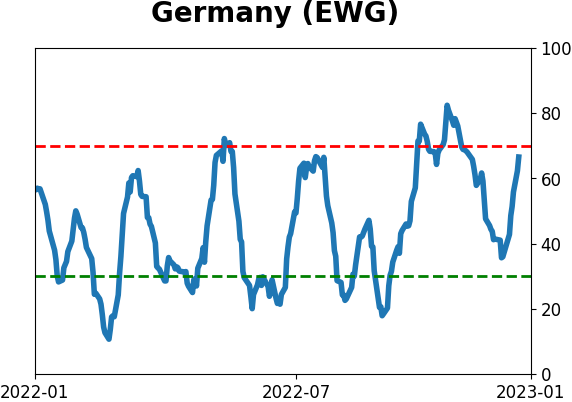
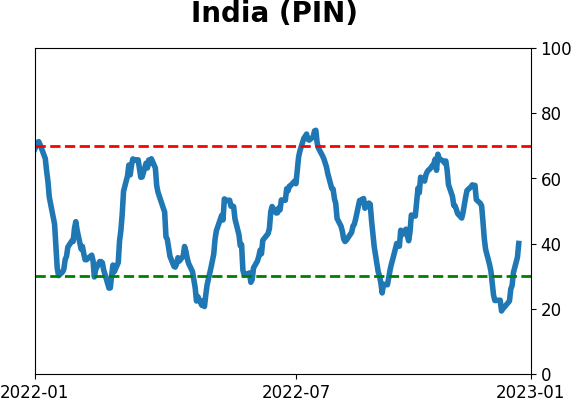
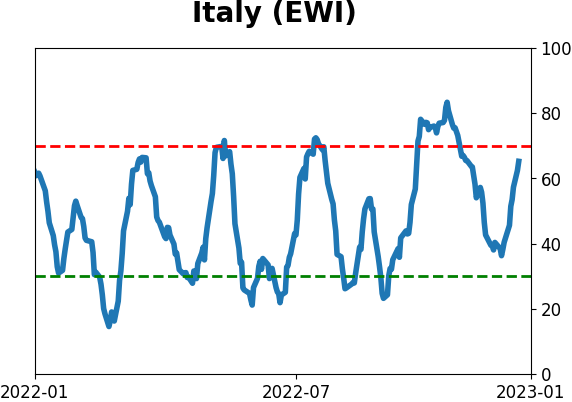
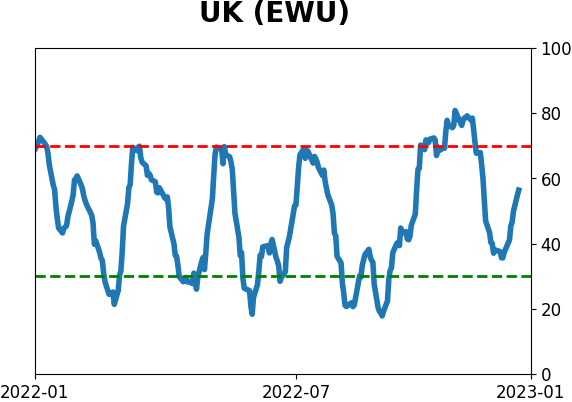
Country ETF's - 10-Day Moving Average
|
|
|
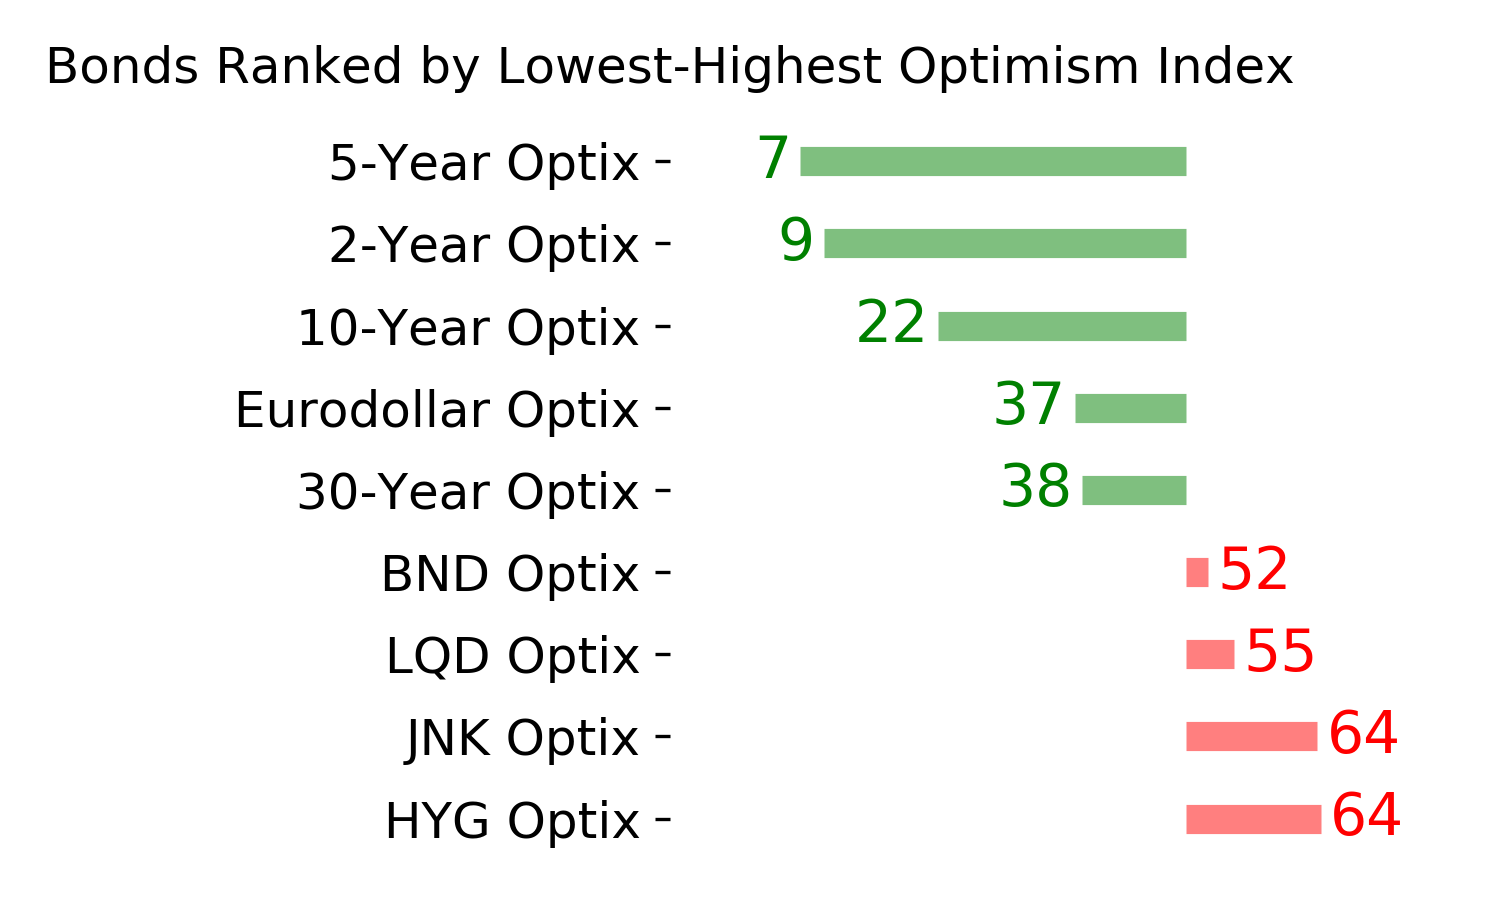
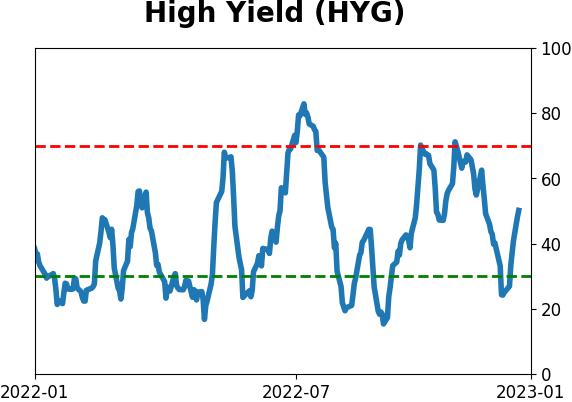
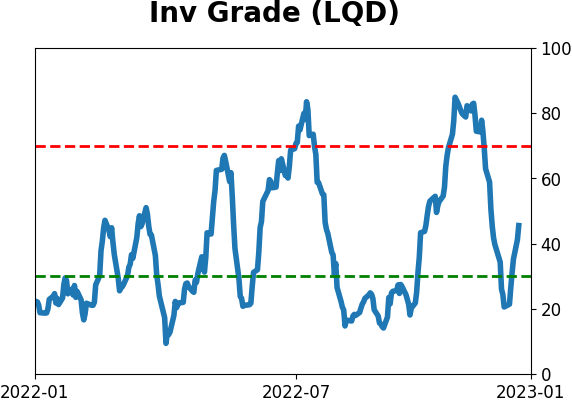
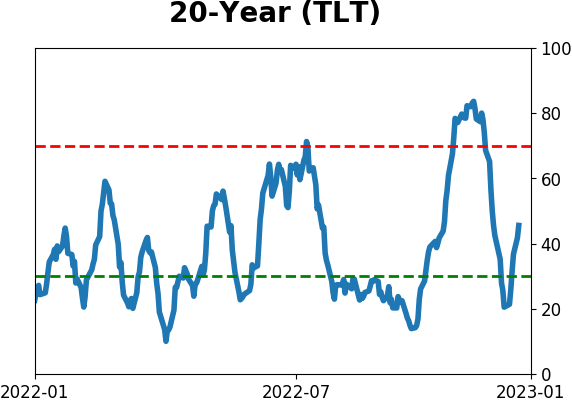
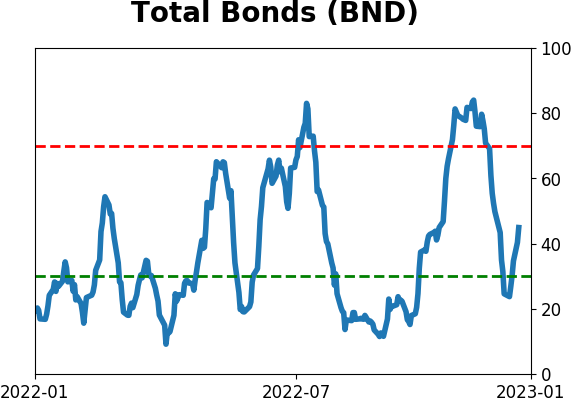
Bond ETF's - 10-Day Moving Average
|
|
|
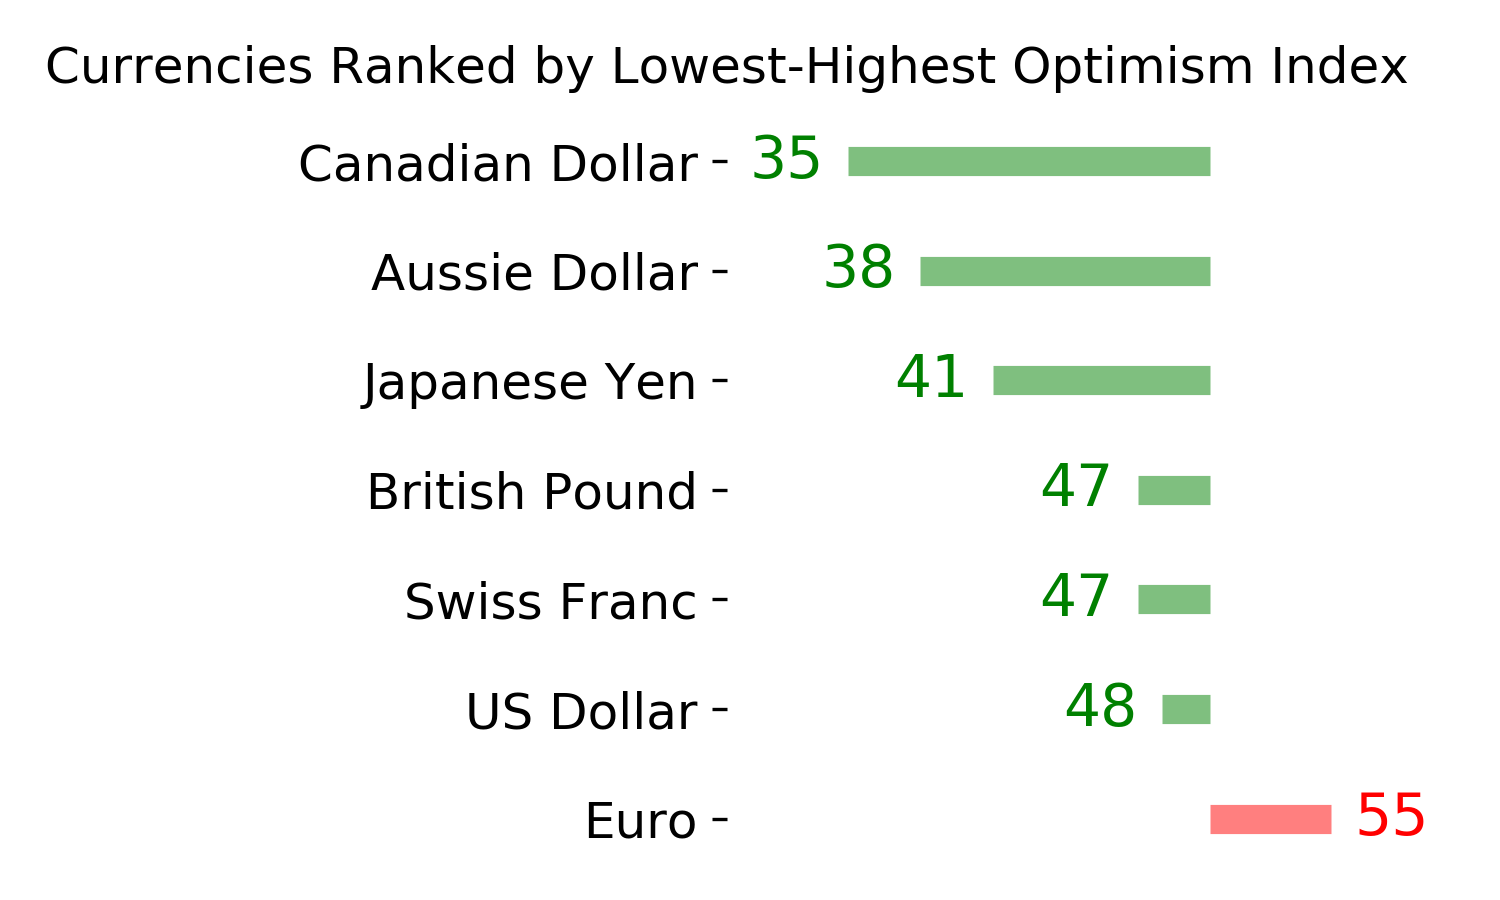
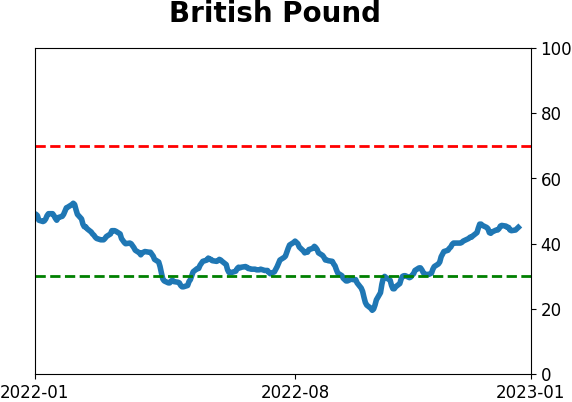
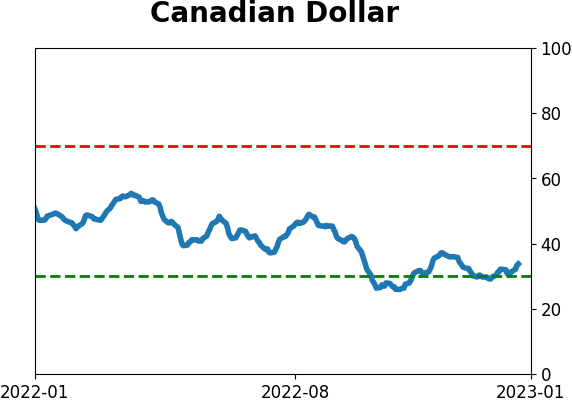
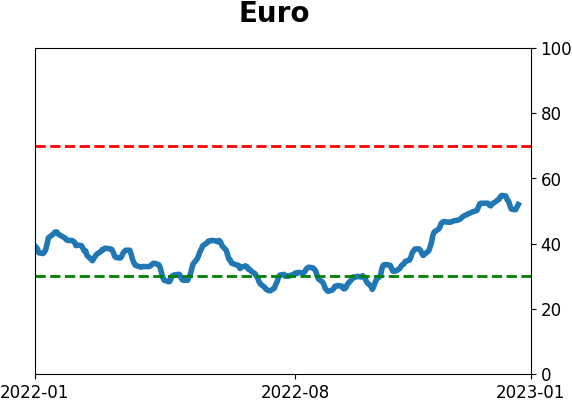
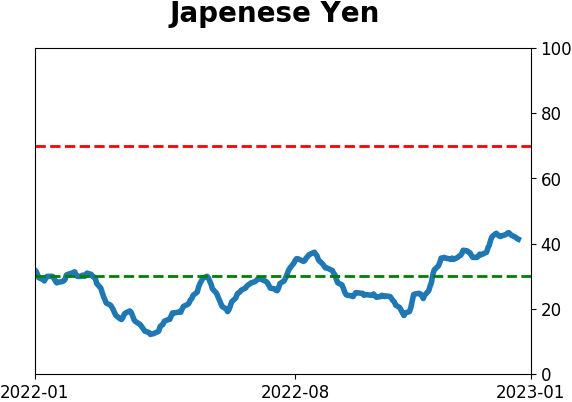
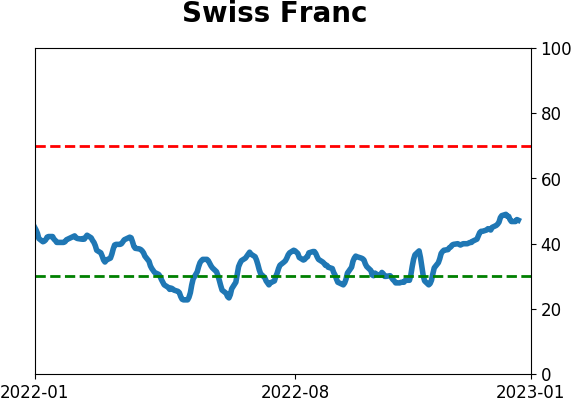
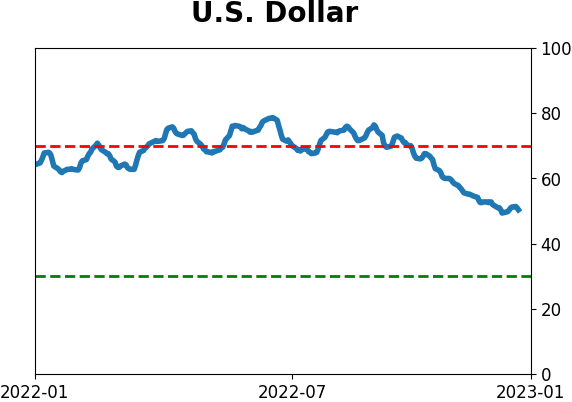
Currency ETF's - 5-Day Moving Average
|
|
|
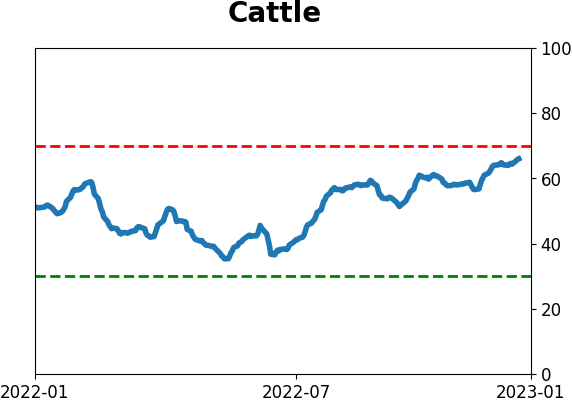
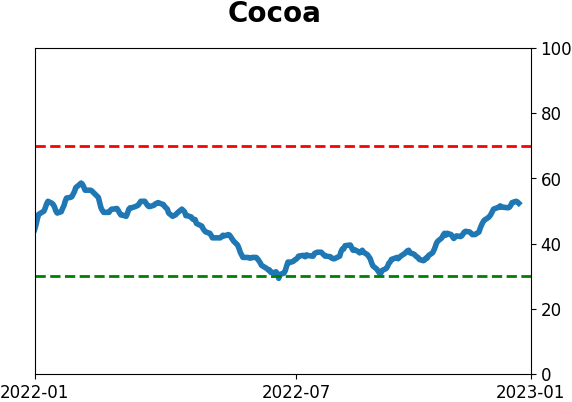
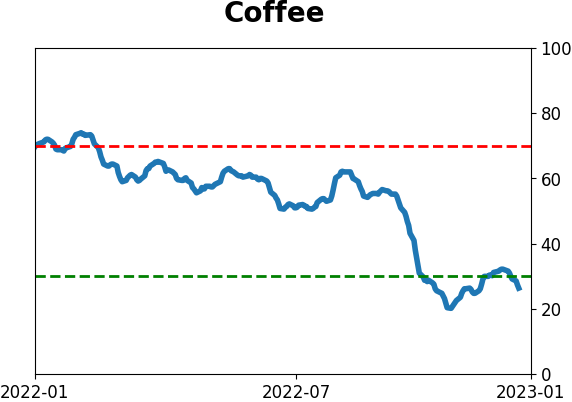
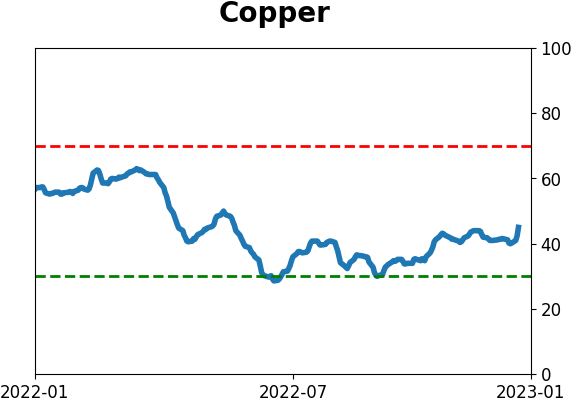
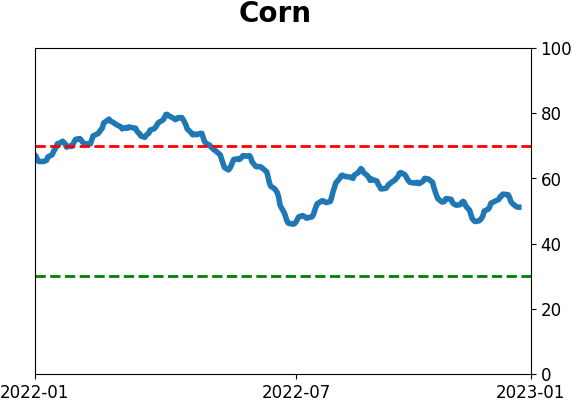
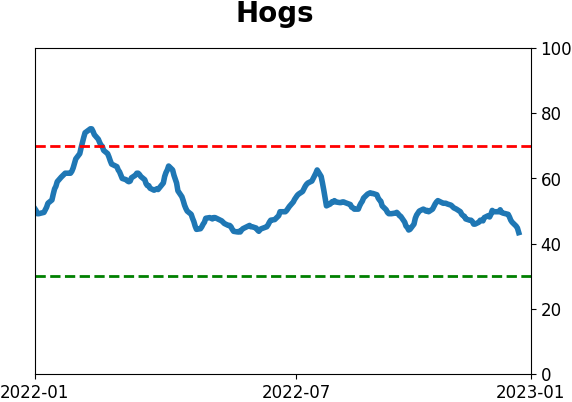
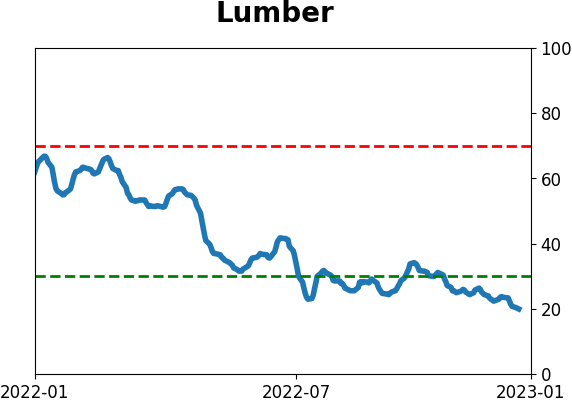
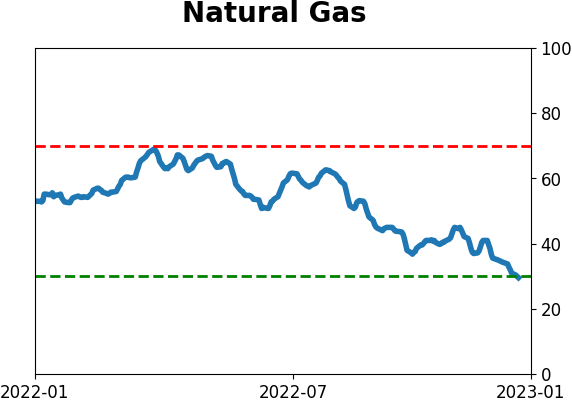
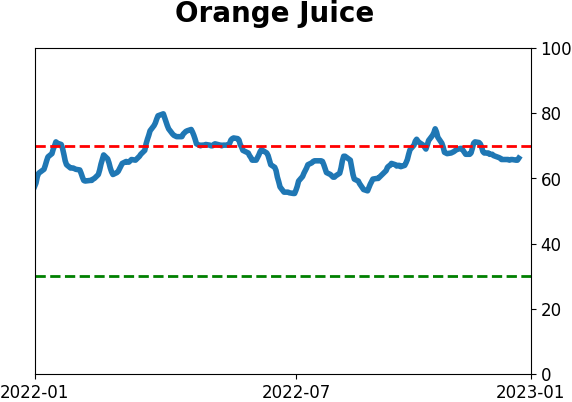
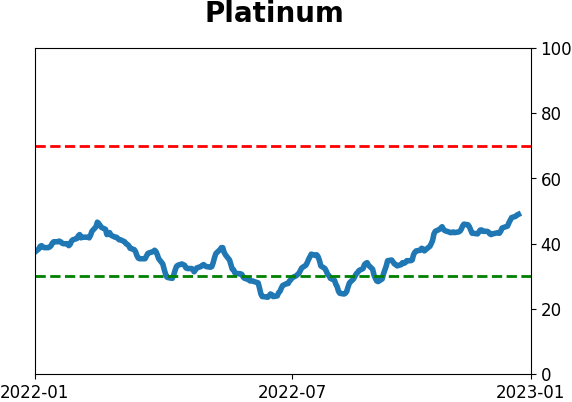
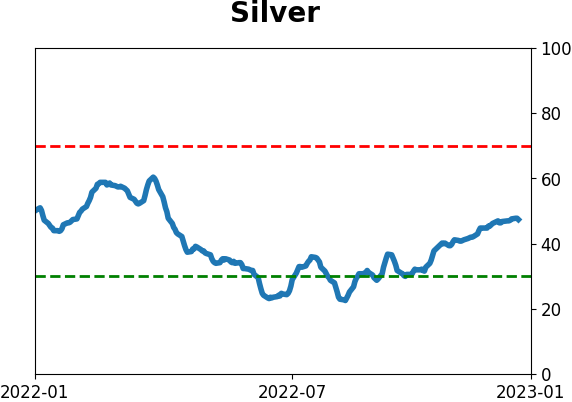
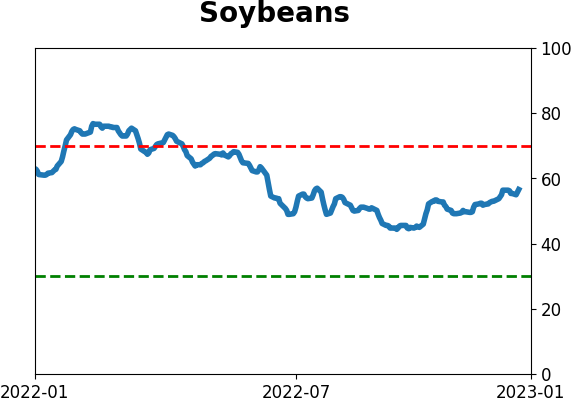
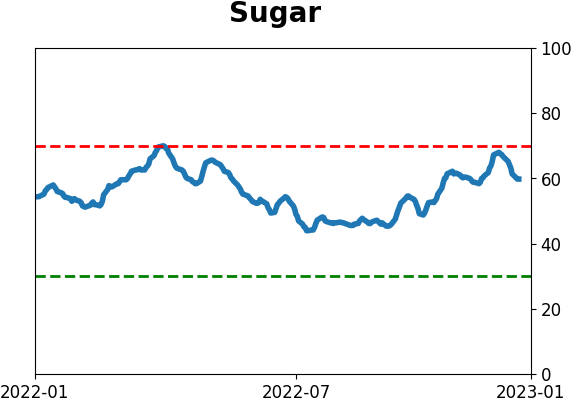
Commodity ETF's - 5-Day Moving Average
|
|