Headlines
|
|
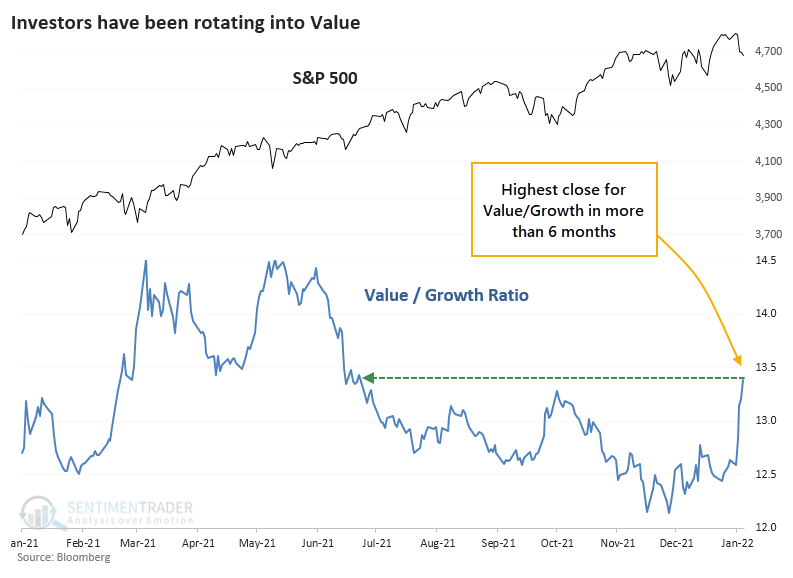
Violent rotations into Value usually continue:
There has been a sudden, and violent, shift to Value stocks and out of Growth. Similar reversals since 1928 have tended to lead to further gains in Value relative to Growth, but only over the medium-term. For the S&P 500, it was a mixed sign, with gyrating results.
|
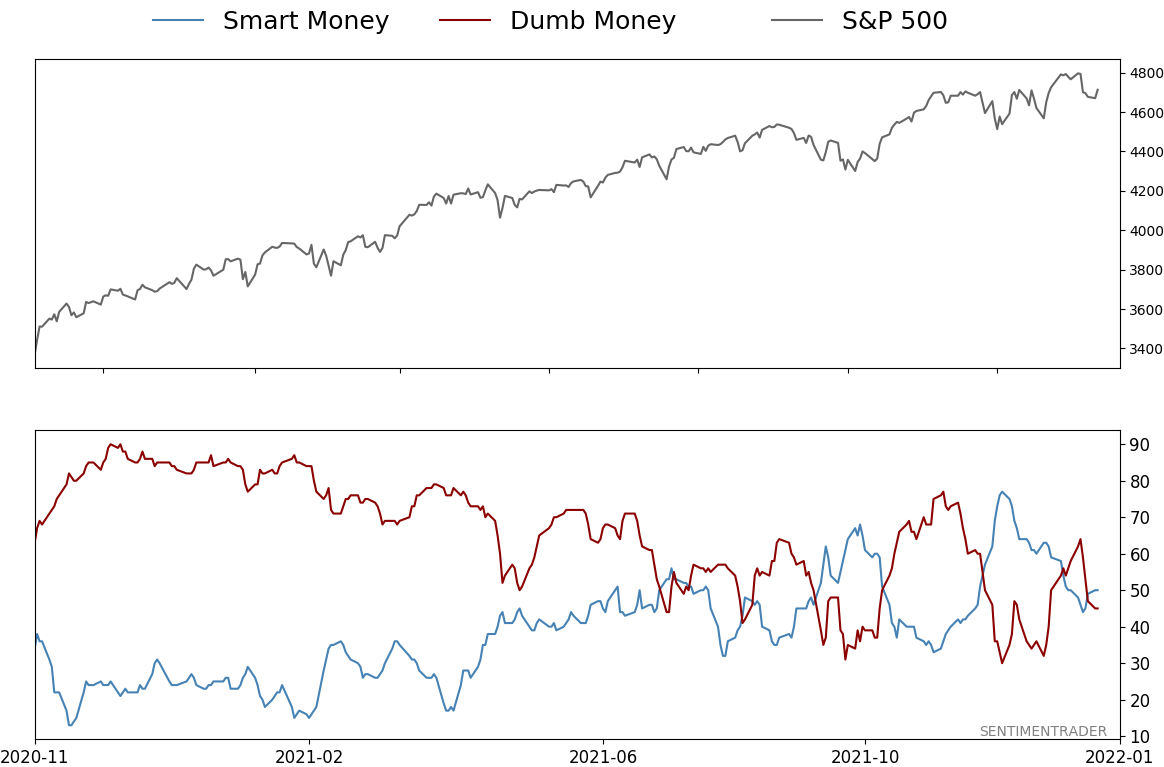
Smart / Dumb Money Confidence
|
Smart Money Confidence: 50%
Dumb Money Confidence: 45%
|
|
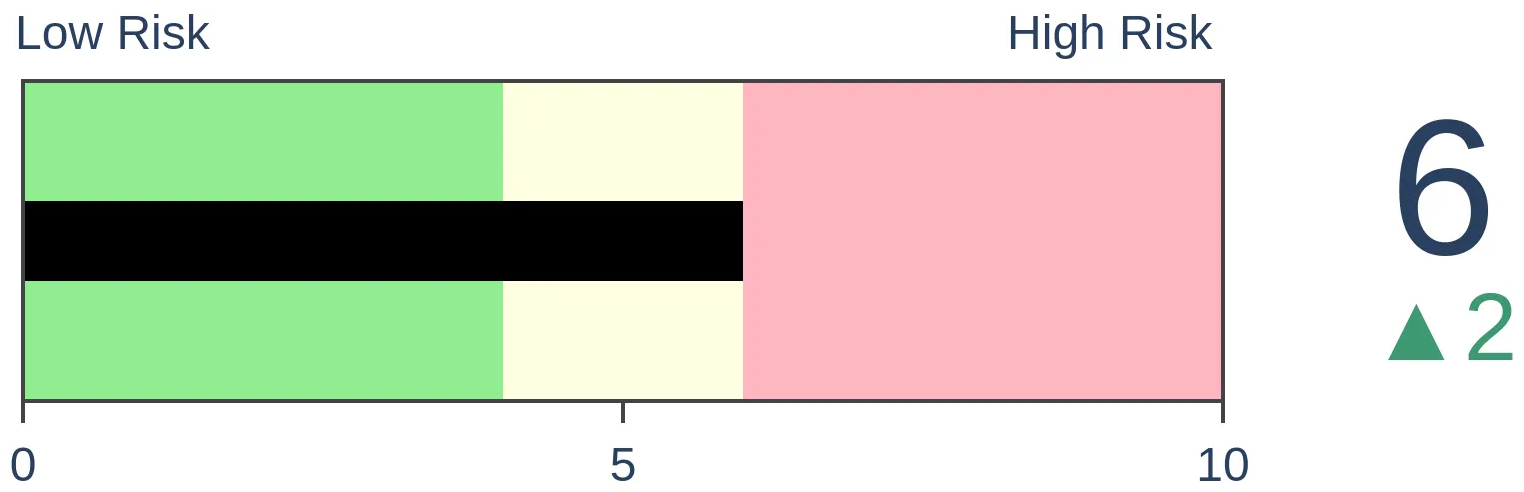
Risk Levels
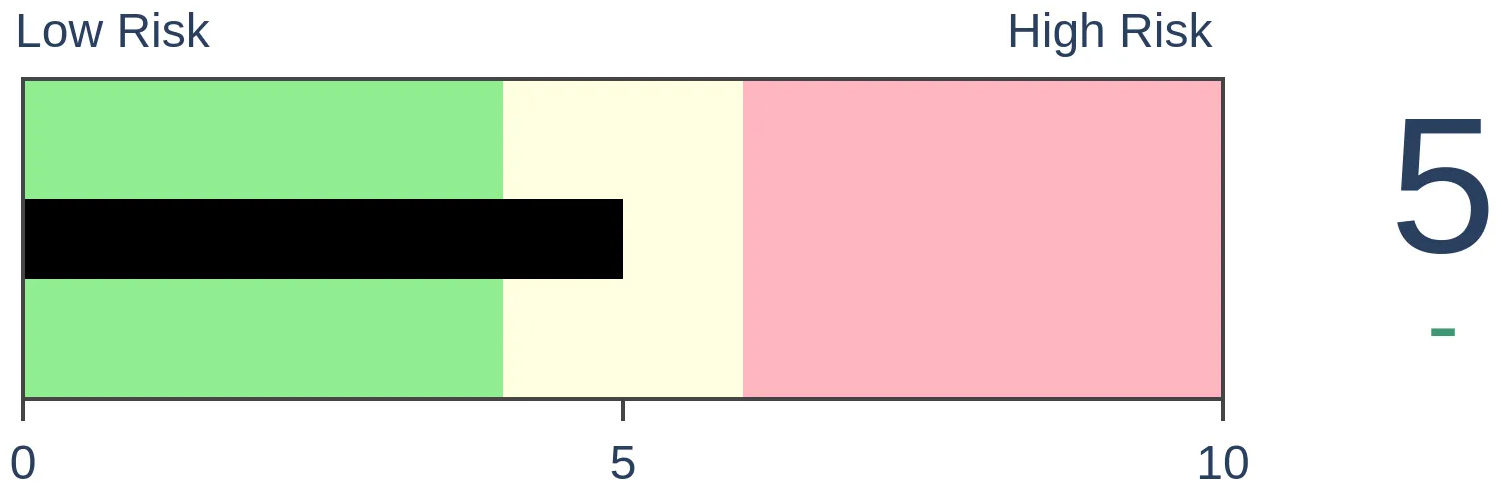
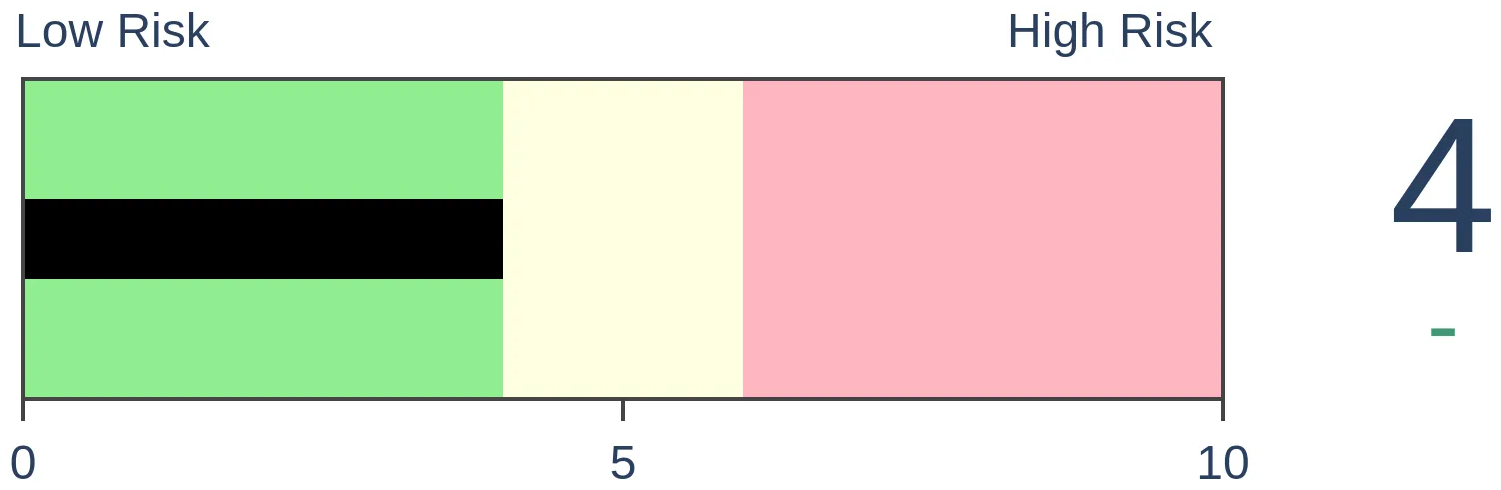
Stocks Short-Term
|
Stocks Medium-Term
|
|
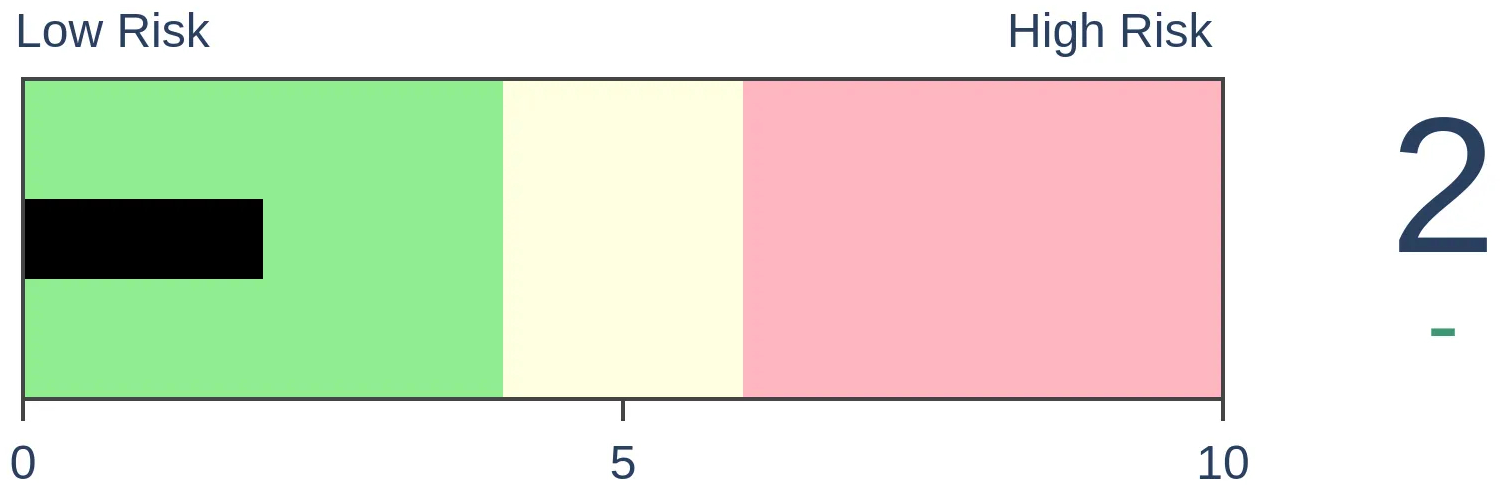
Bonds
|
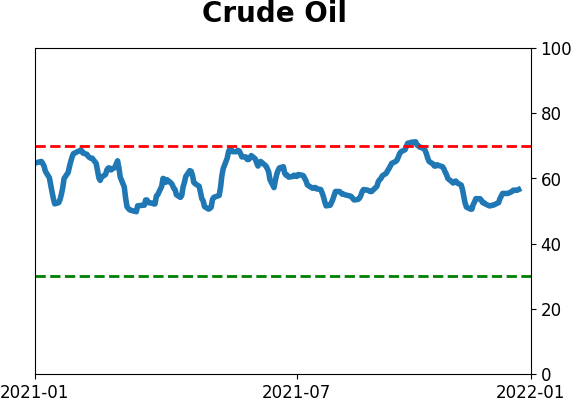
Crude Oil
|
|
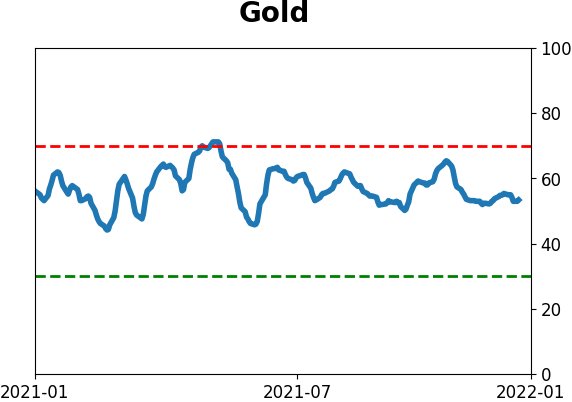
Gold

|
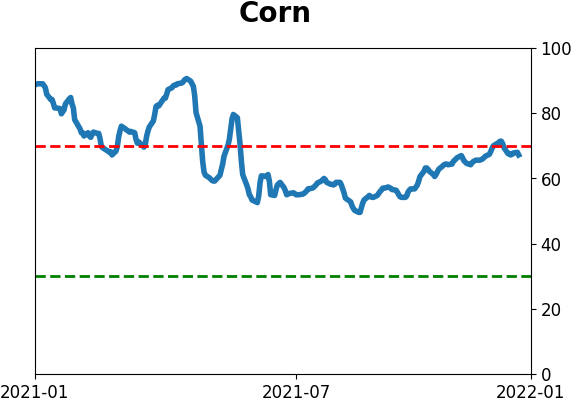
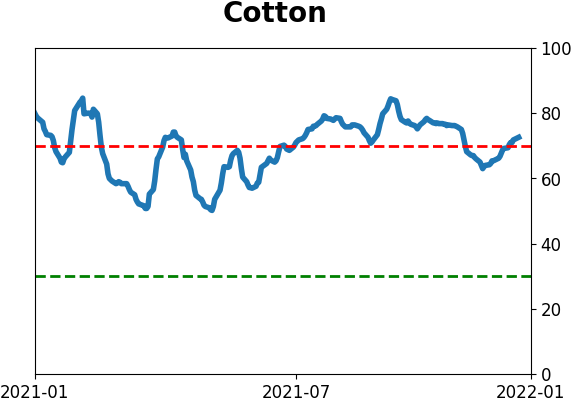
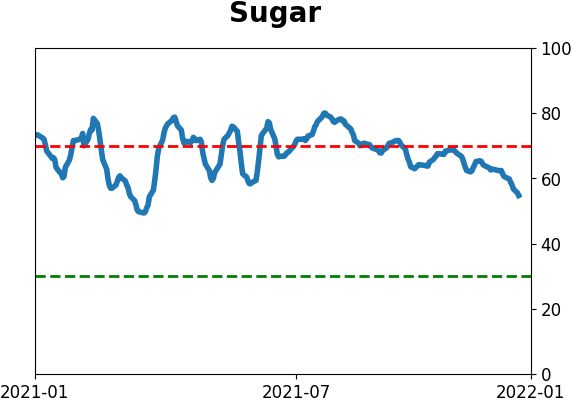
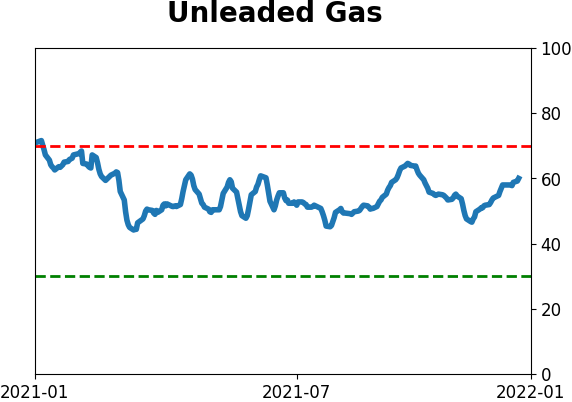
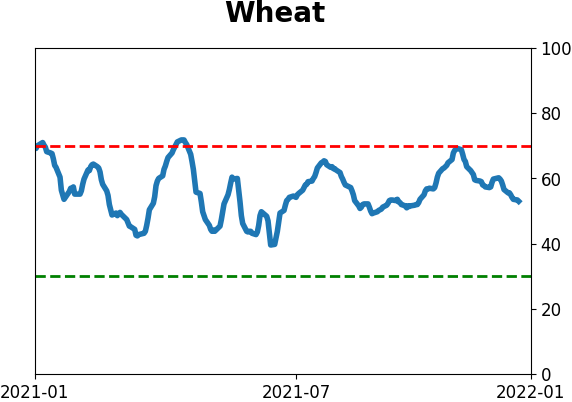
Agriculture

|
|
Research
By Jason Goepfert
BOTTOM LINE
There has been a sudden, and violent, shift to Value stocks and out of Growth. Similar reversals since 1928 have tended to lead to further gains in Value relative to Growth, but only over the medium-term. For the S&P 500, it was a mixed sign, with gyrating results.
FORECAST / TIMEFRAME
None
|
Key points:
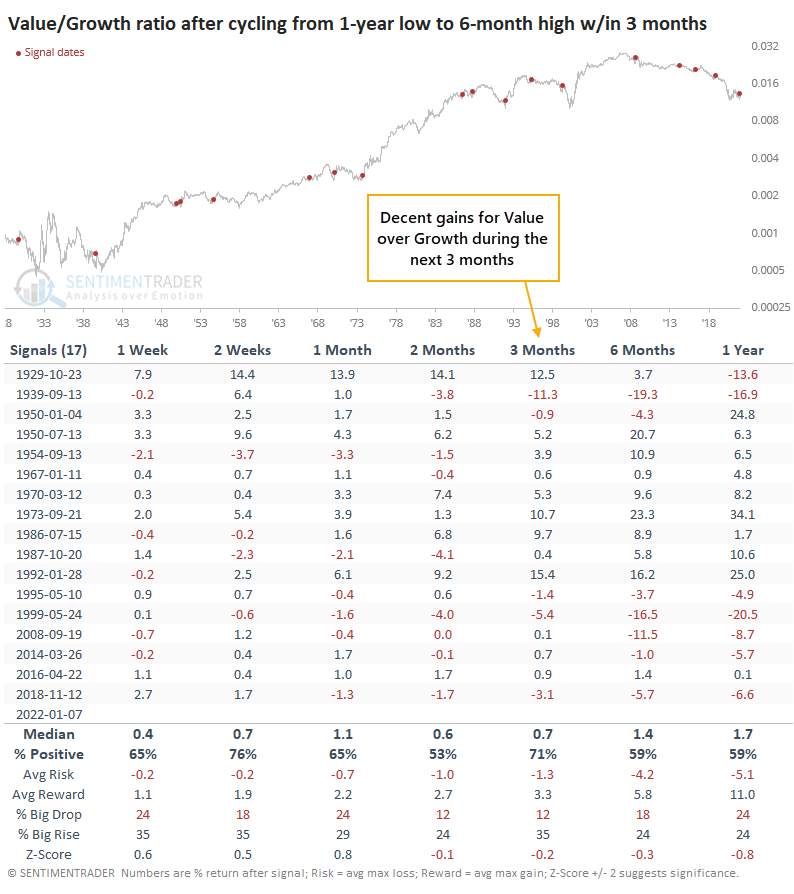
- The ratio of Value to Growth factors has cycled from a 1-year low to a 6-month high
- Similar reversals preceded more relative gains for Value over the next several months
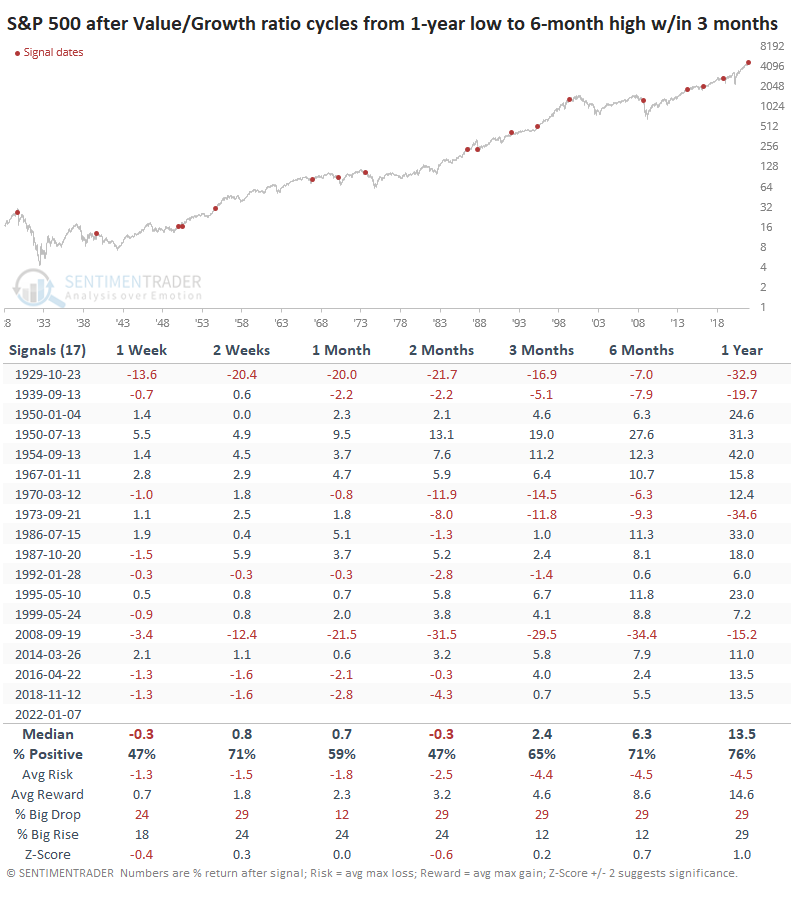
- It was a mixed sign for the S&P 500
A violent shift to Value
One of the most vicious reversals of the new year has been the rotation out of Growth and into Value. After plunging to nearly a 20-year low late last year, the ratio between Value and Growth factors has soared. On Monday, it reached a 6-month high, surpassing its peak from October.
This is yet the latest temptation for Value investors. Previous rallies were nothing but siren songs, but hope springs eternal. At some point, valuations have to matter. Right?
There may be a silver lining here for those who insist on actual profit-earning businesses that aren't absurdly speculative. After the Value/Growth ratio cycled from a 1-year low to a 6-month high within 3 months, Value continued to outperform in the months ahead. Value investors tend to have time frames that extend for years, not months, but the edge isn't significant after the first few months.
For the broader market, it was a mixed blessing. One might reasonably assume that a sudden shift toward Value would be a dire warning for the S&P 500, but that wasn't really the case. Over the next 2 months, it showed below-average returns, and up to 3 months later, the risk/reward was about even. But only 4 of the 17 signals preceded double-digit declines in the months ahead.
What the research tells us...
There has been a sudden and significant shift into Value shares in recent weeks at the expense of Growth stocks. Value investors have suffered false starts multiple times in recent years, leading to disappointment. One difference this time is the sheer violence of the move, and there is some historical support for the idea that it's finally time for Value to outperform. However, it's not a decisive edge and only extends for a few months.
Active Studies
| Time Frame | Bullish | Bearish | | Short-Term | 2 | 0 | | Medium-Term | 13 | 2 | | Long-Term | 13 | 4 |
|
Indicators at Extremes
Portfolio
| Position | Description | Weight % | Added / Reduced | Date | | Stocks | RSP | 35.9 | Added 25.2% | 2022-01-03 | | Bonds | 32.7% BND, 7.1% SCHP | 39.8 | Added 8.3% | 2021-10-26 | | Commodities | GCC | 2.4 | Reduced 2.1%
| 2020-09-04 | | Precious Metals | GDX | 4.6 | Reduced 4.2% | 2021-05-19 | | Special Situations | 9.8% KWEB, 4.7% XLE, 2.9% PSCE | 17.3 | Added 9.78% | 2021-10-01 | | Cash | | 0.1 | | |
|
Updates (Changes made today are underlined)
Coinciding with the new year, there was a thrust in participation in the S&P 500 near the end of December. Thrusts have been among the most consistent signals over the decades, and this is hard to ignore. I have greater confidence in thrusts when coming off extreme pessimism, like the spring of 2020, as opposed to near all-time highs on low volume. Still, it's hard to justify not being at least neutral weight stocks given this behavior. Bond sentiment is trying to recover from a recent bout of pessimism, and gold stocks are doing their thing which is not much at all. They've been flat for six months. Chinese tech stocks were doing exactly what they're supposed to do, then did *not* by plunging to new lows. This is troubling on a shorter-term time frame, but this was never meant for a trade, rather a multi-year investment. Recent behavior is troubling and I will not be adding any exposure as long as that's the case. RETURN YTD: +0.9% 2021: +8.7%, 2020: +8.1%, 2019: +12.6%, 2018: +0.6%, 2017: +3.8%, 2016: +17.1%, 2015: +9.2%, 2014: +14.5%, 2013: +2.2%, 2012: +10.8%, 2011: +16.5%, 2010: +15.3%, 2009: +23.9%, 2008: +16.2%, 2007: +7.8%
|
|
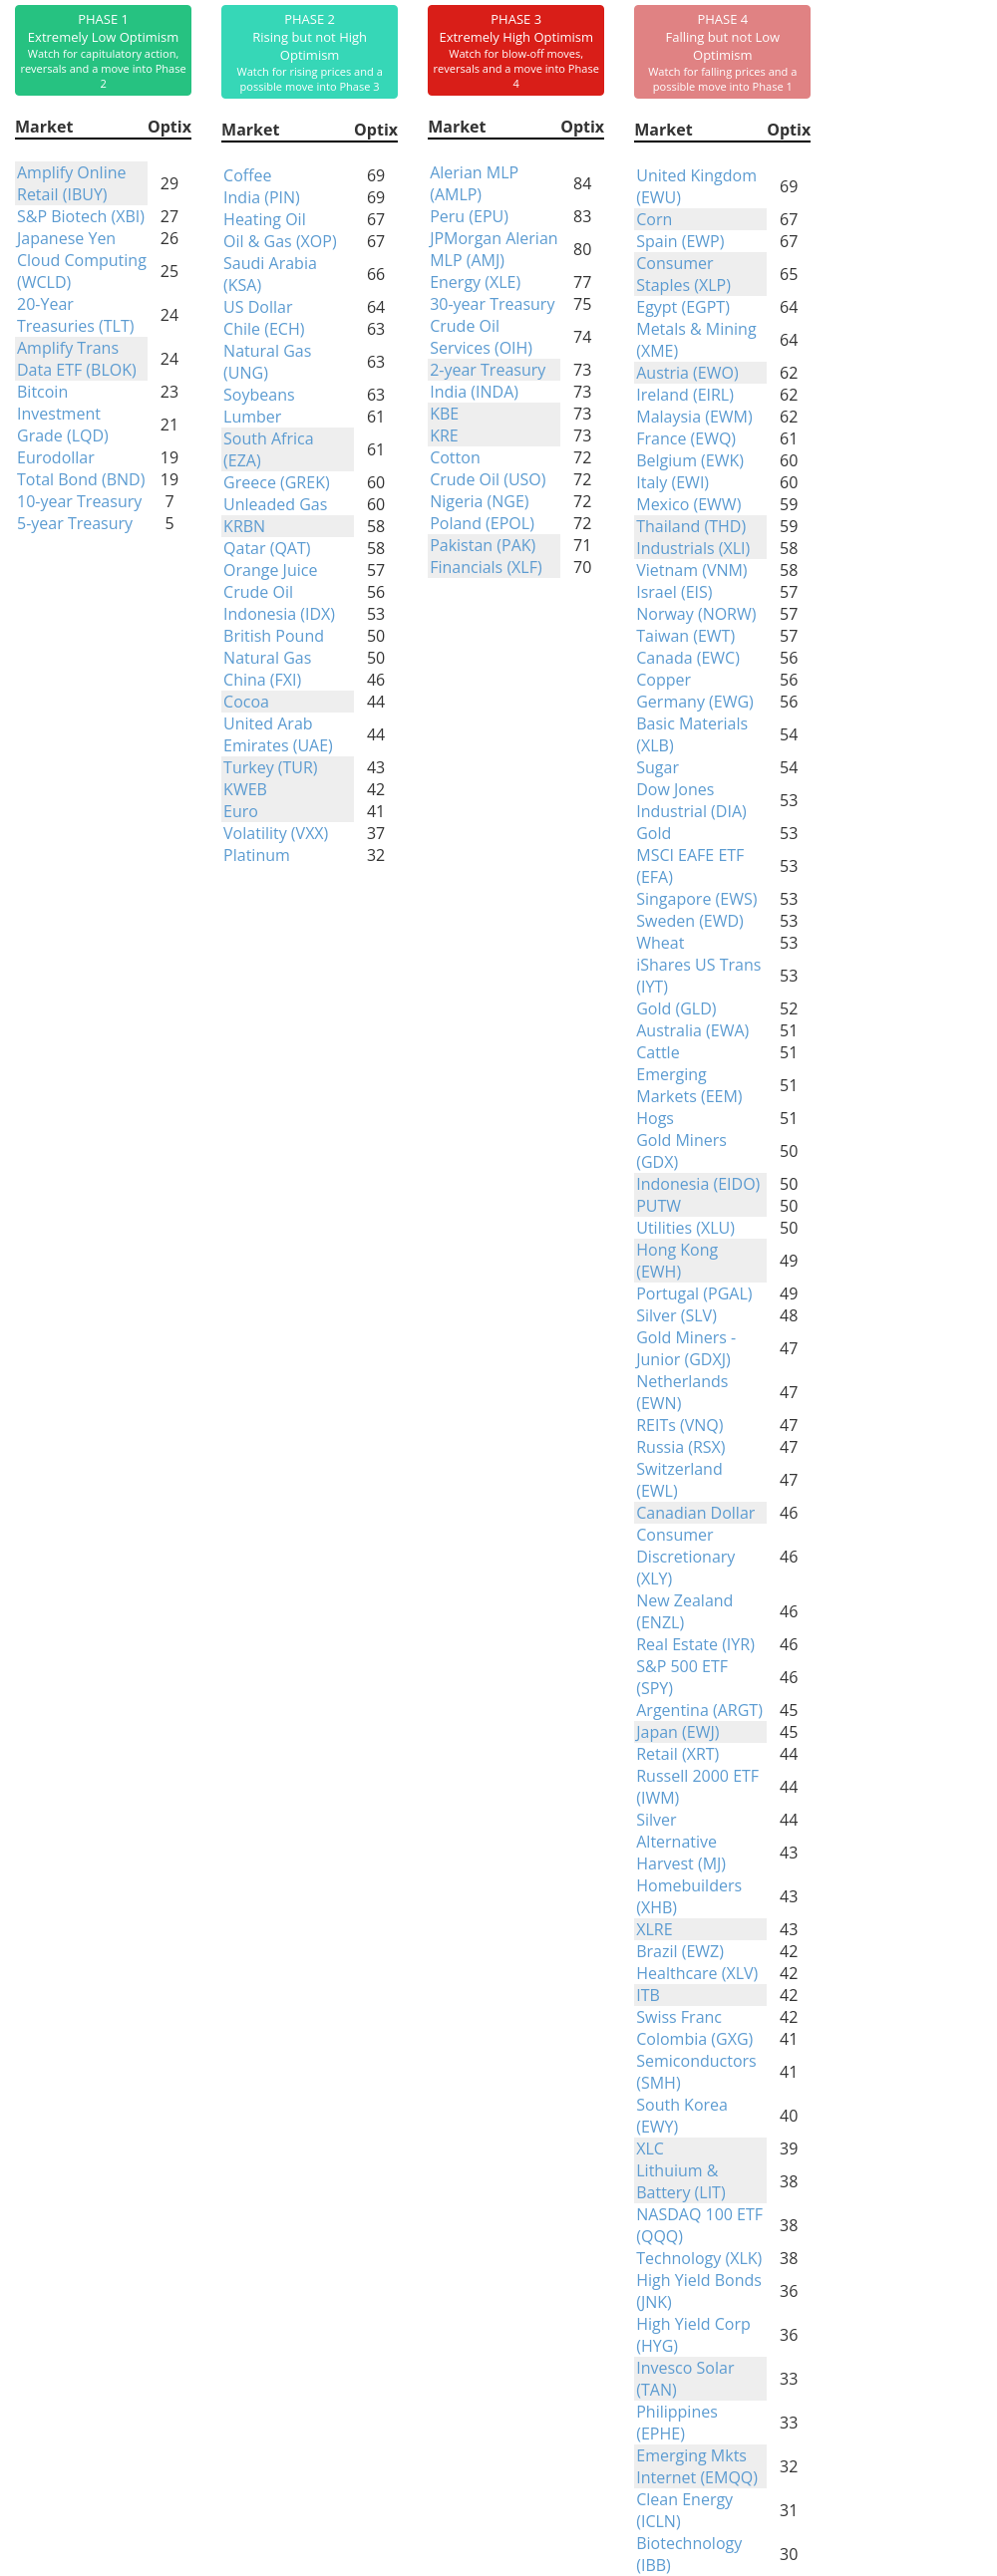
Phase Table
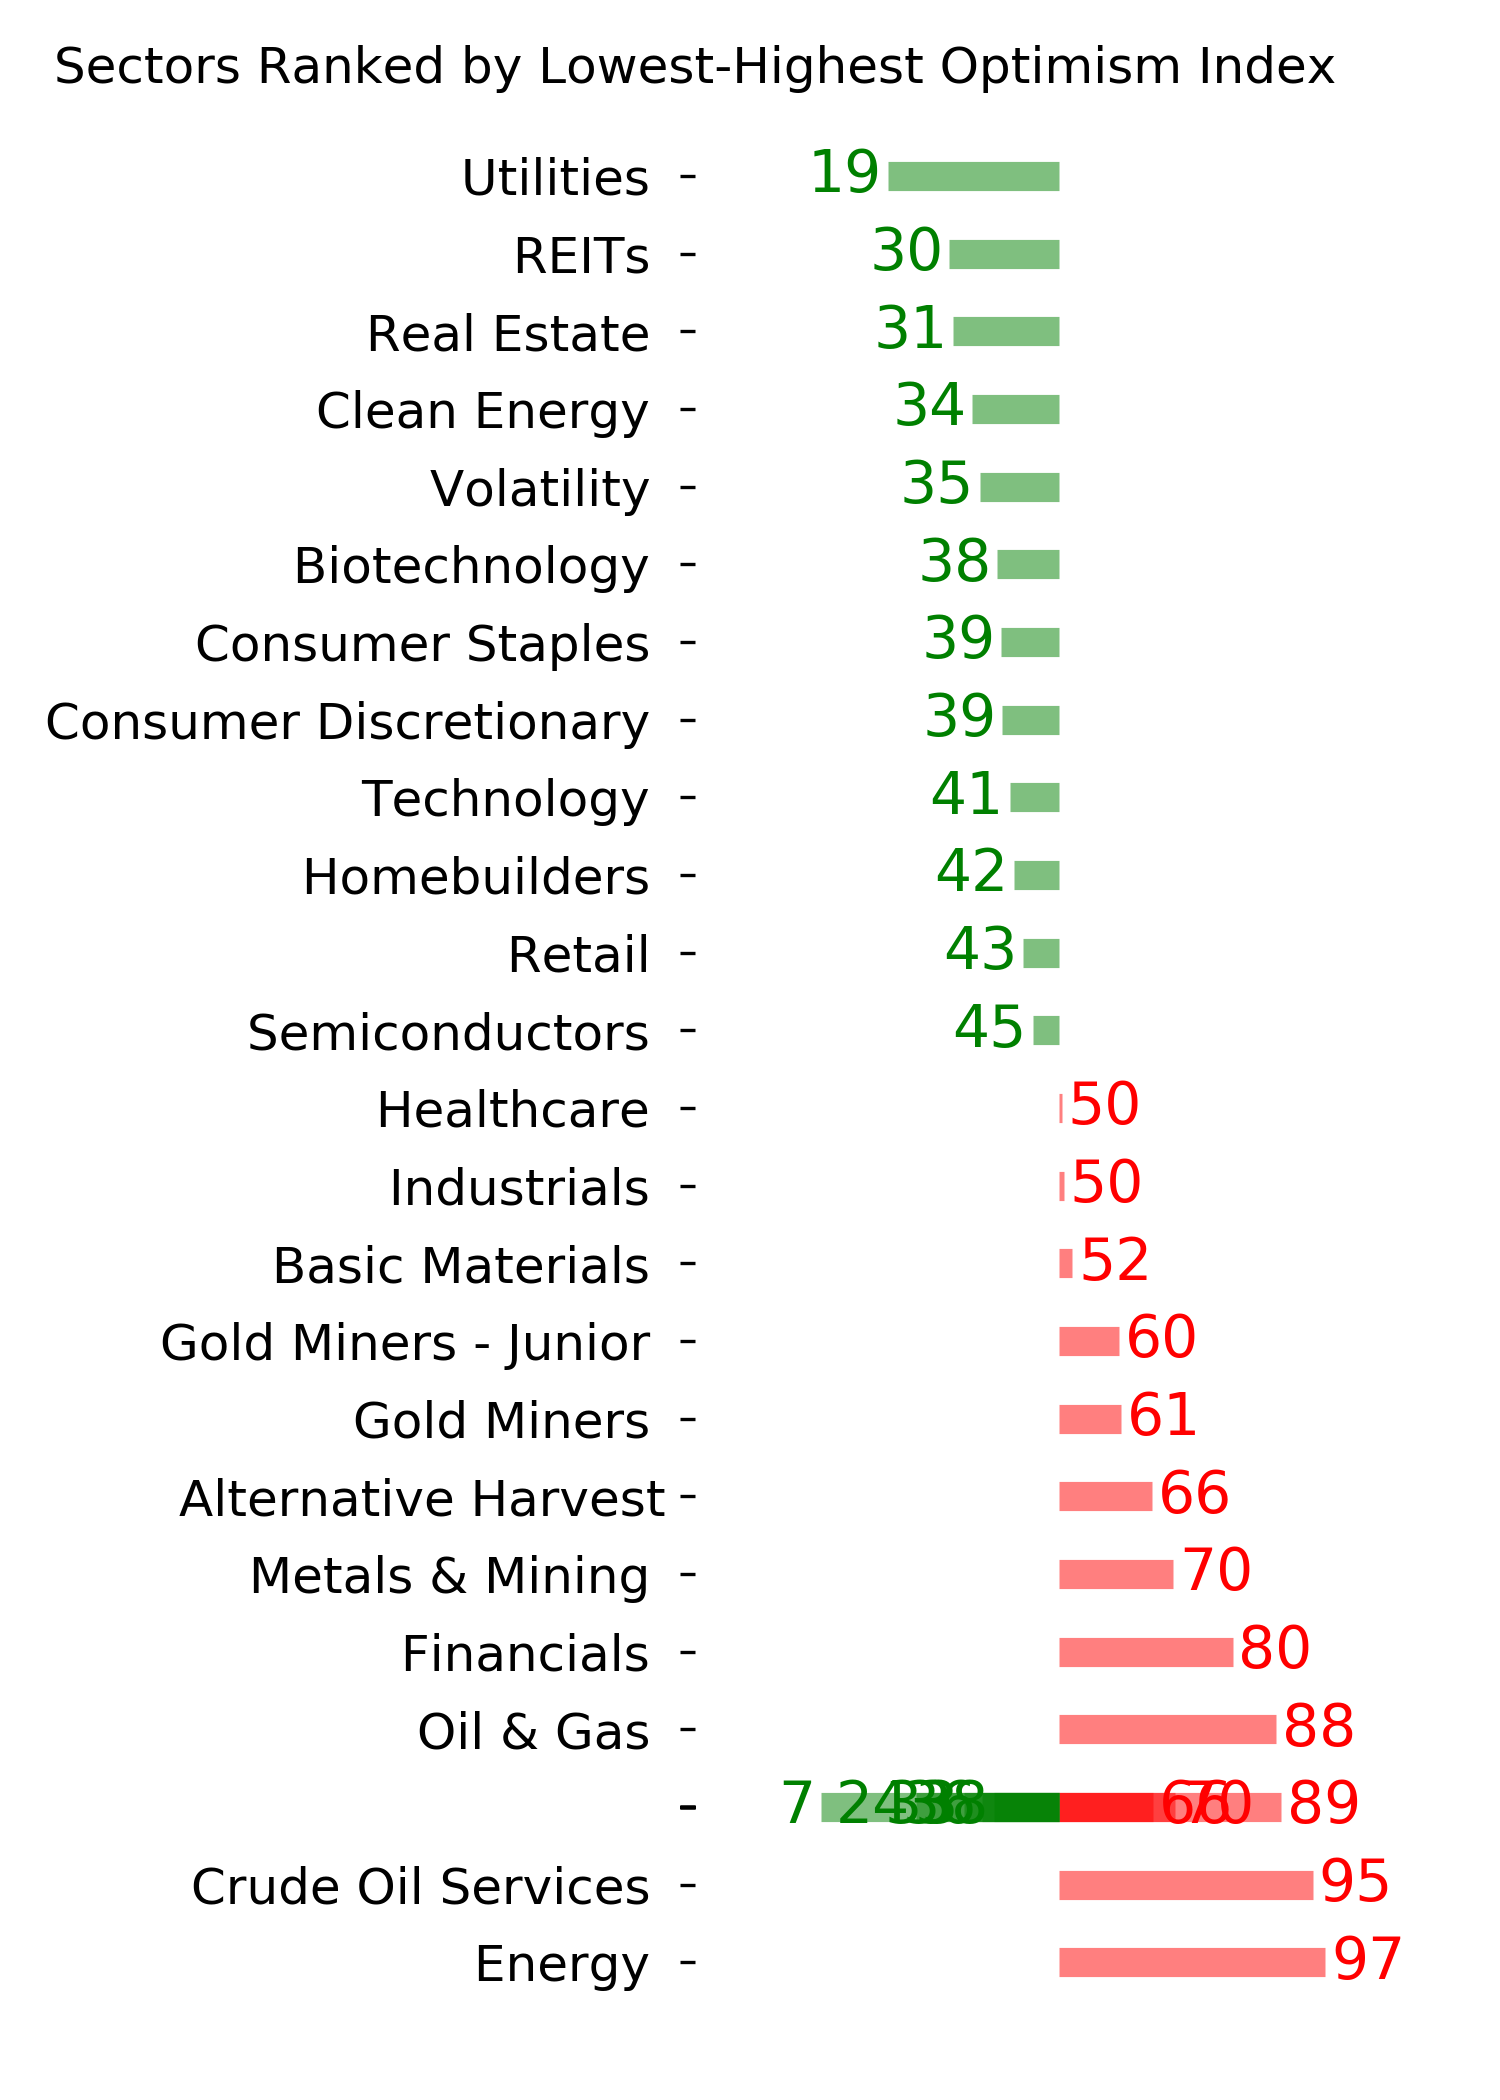
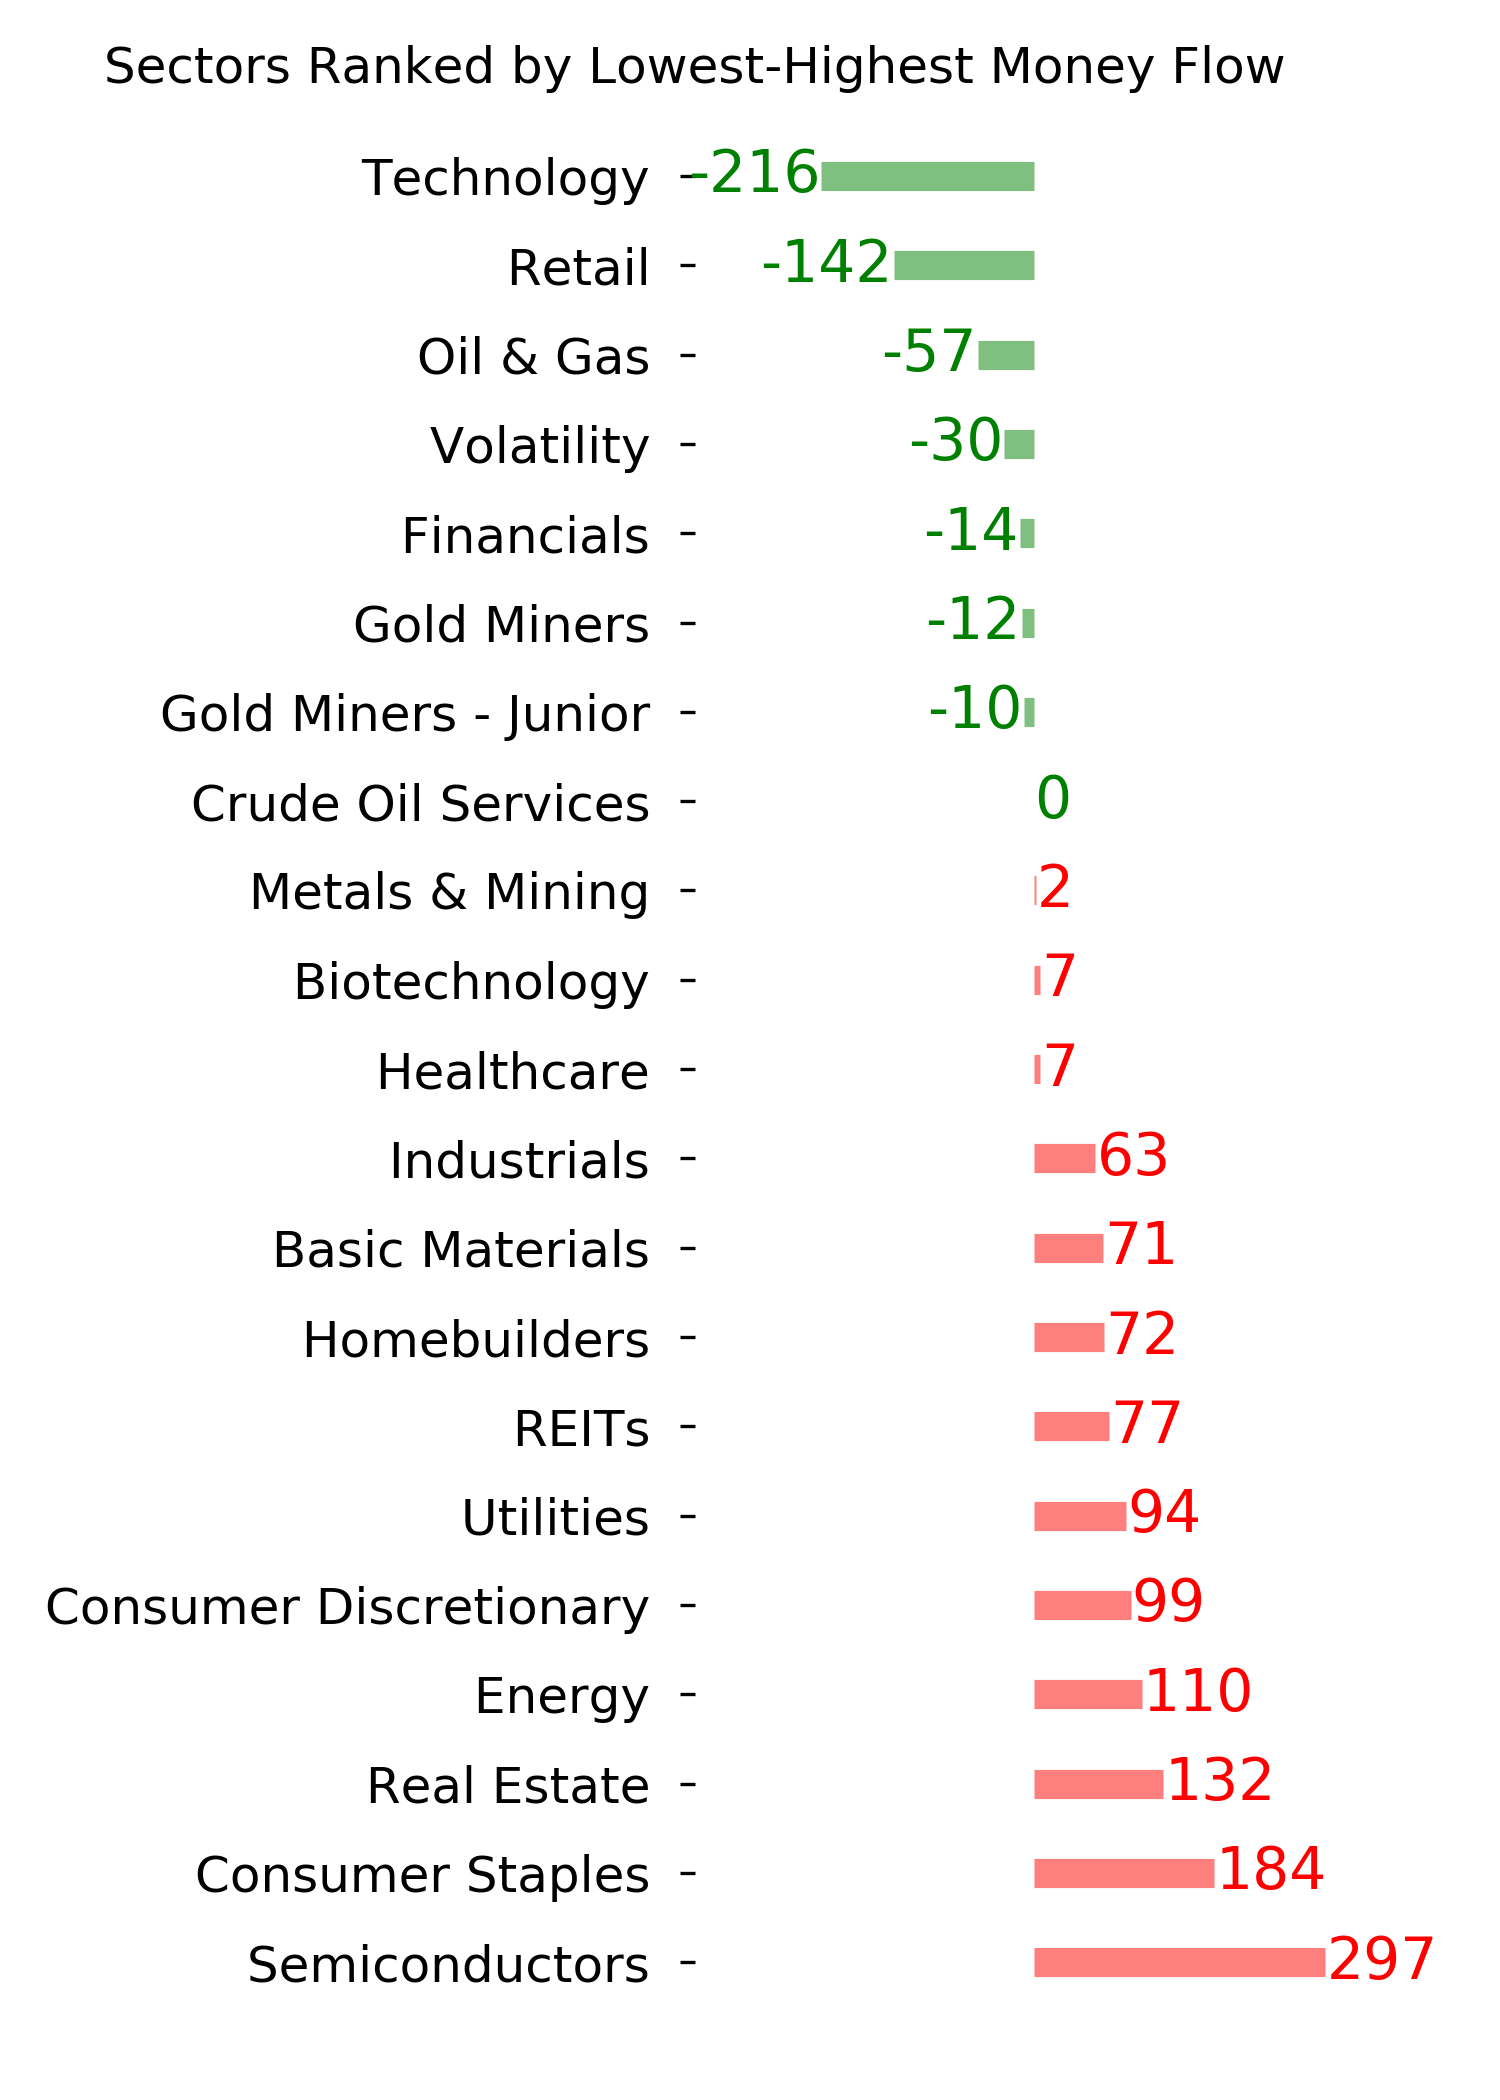
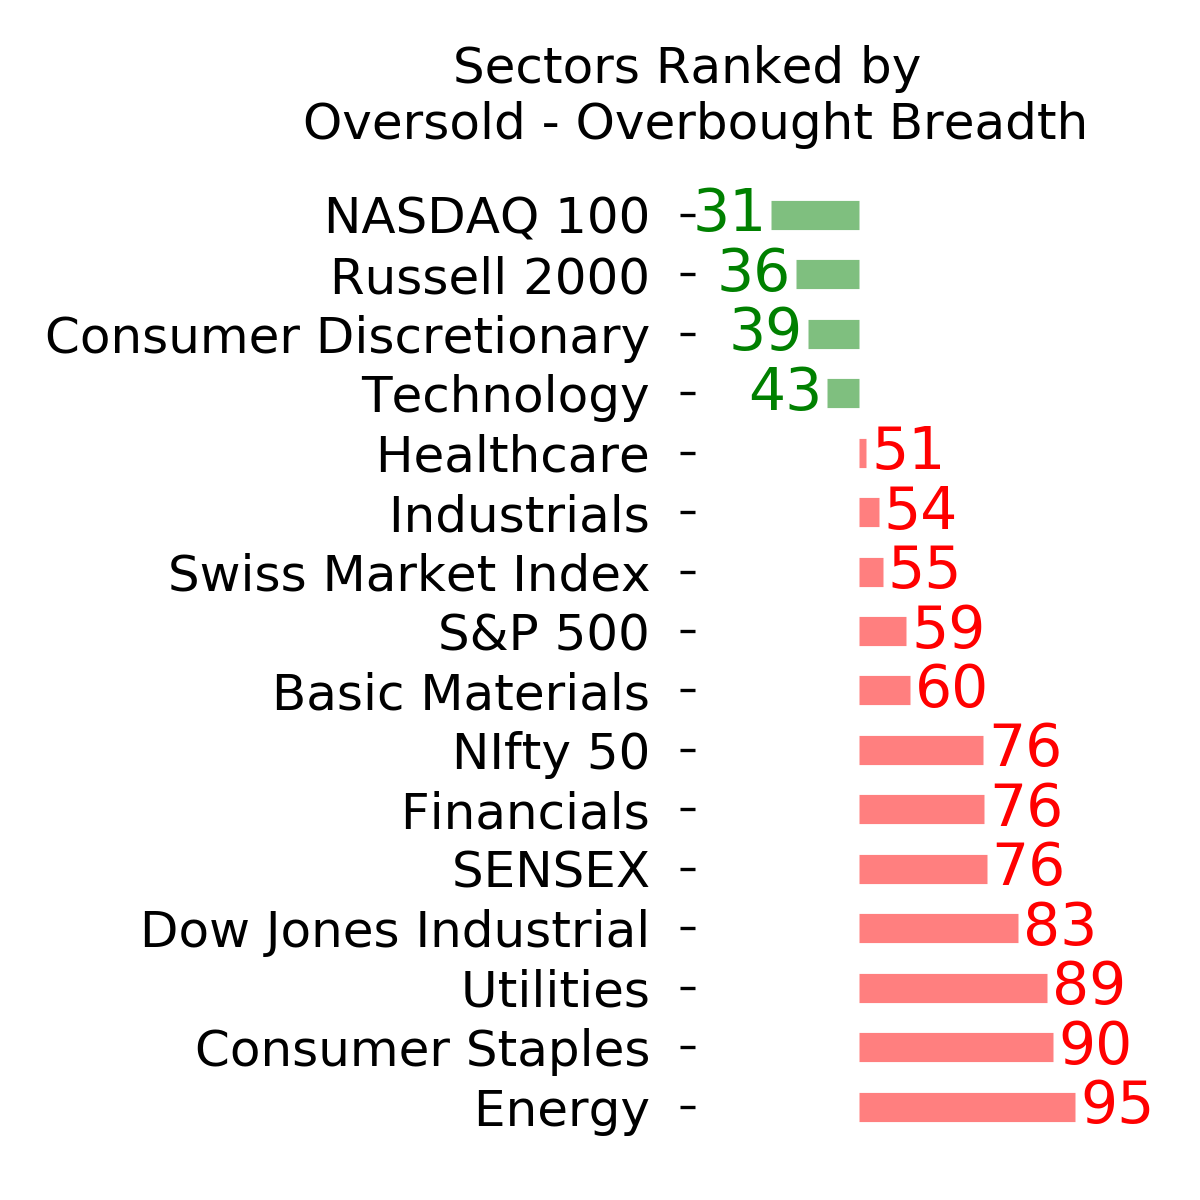
Ranks
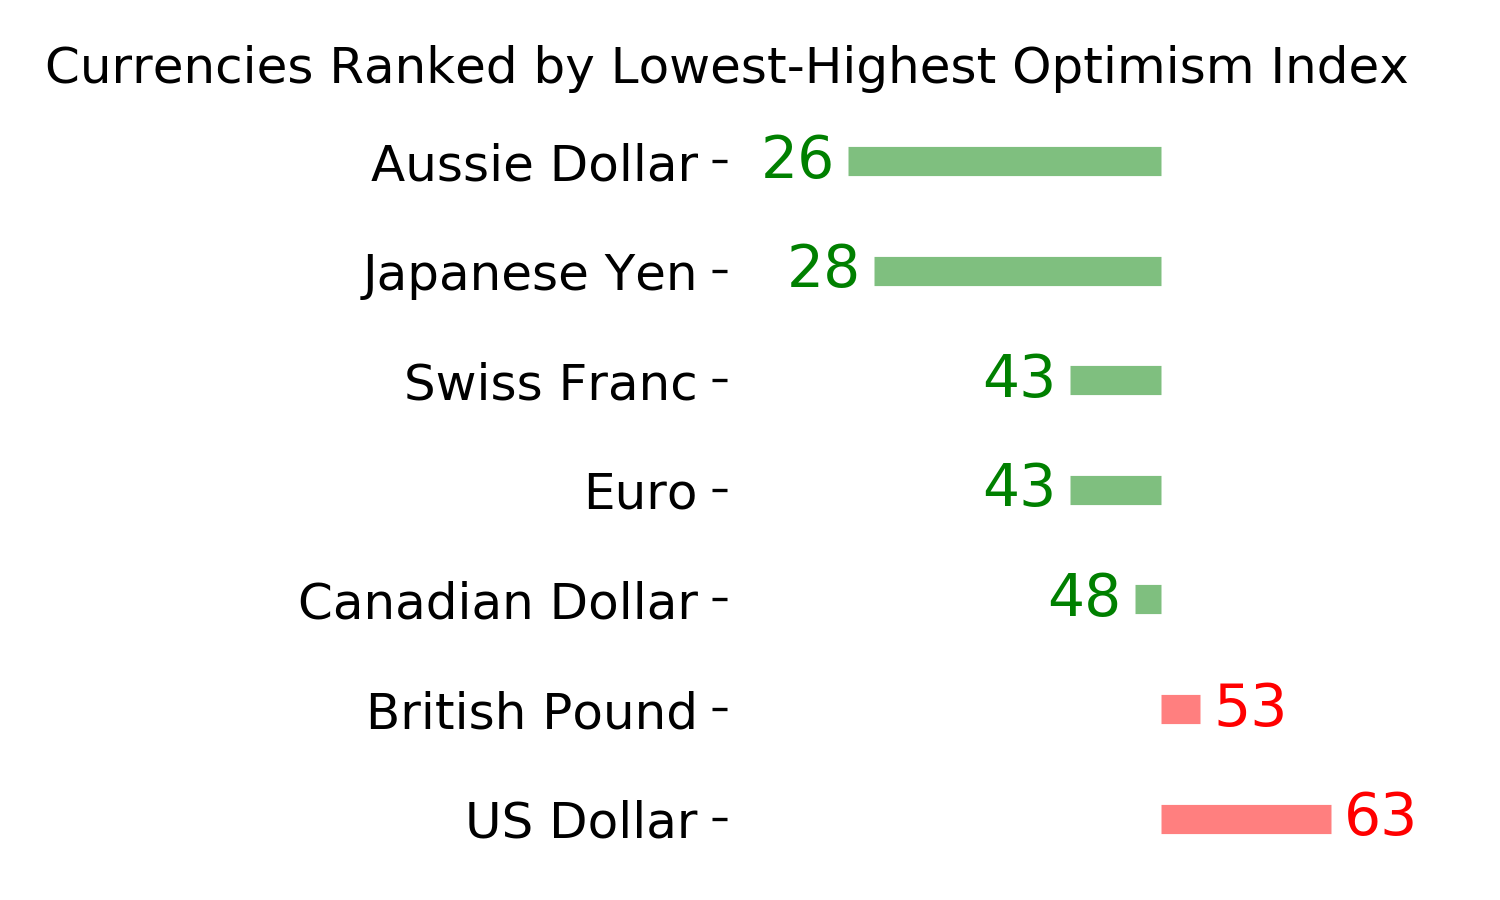
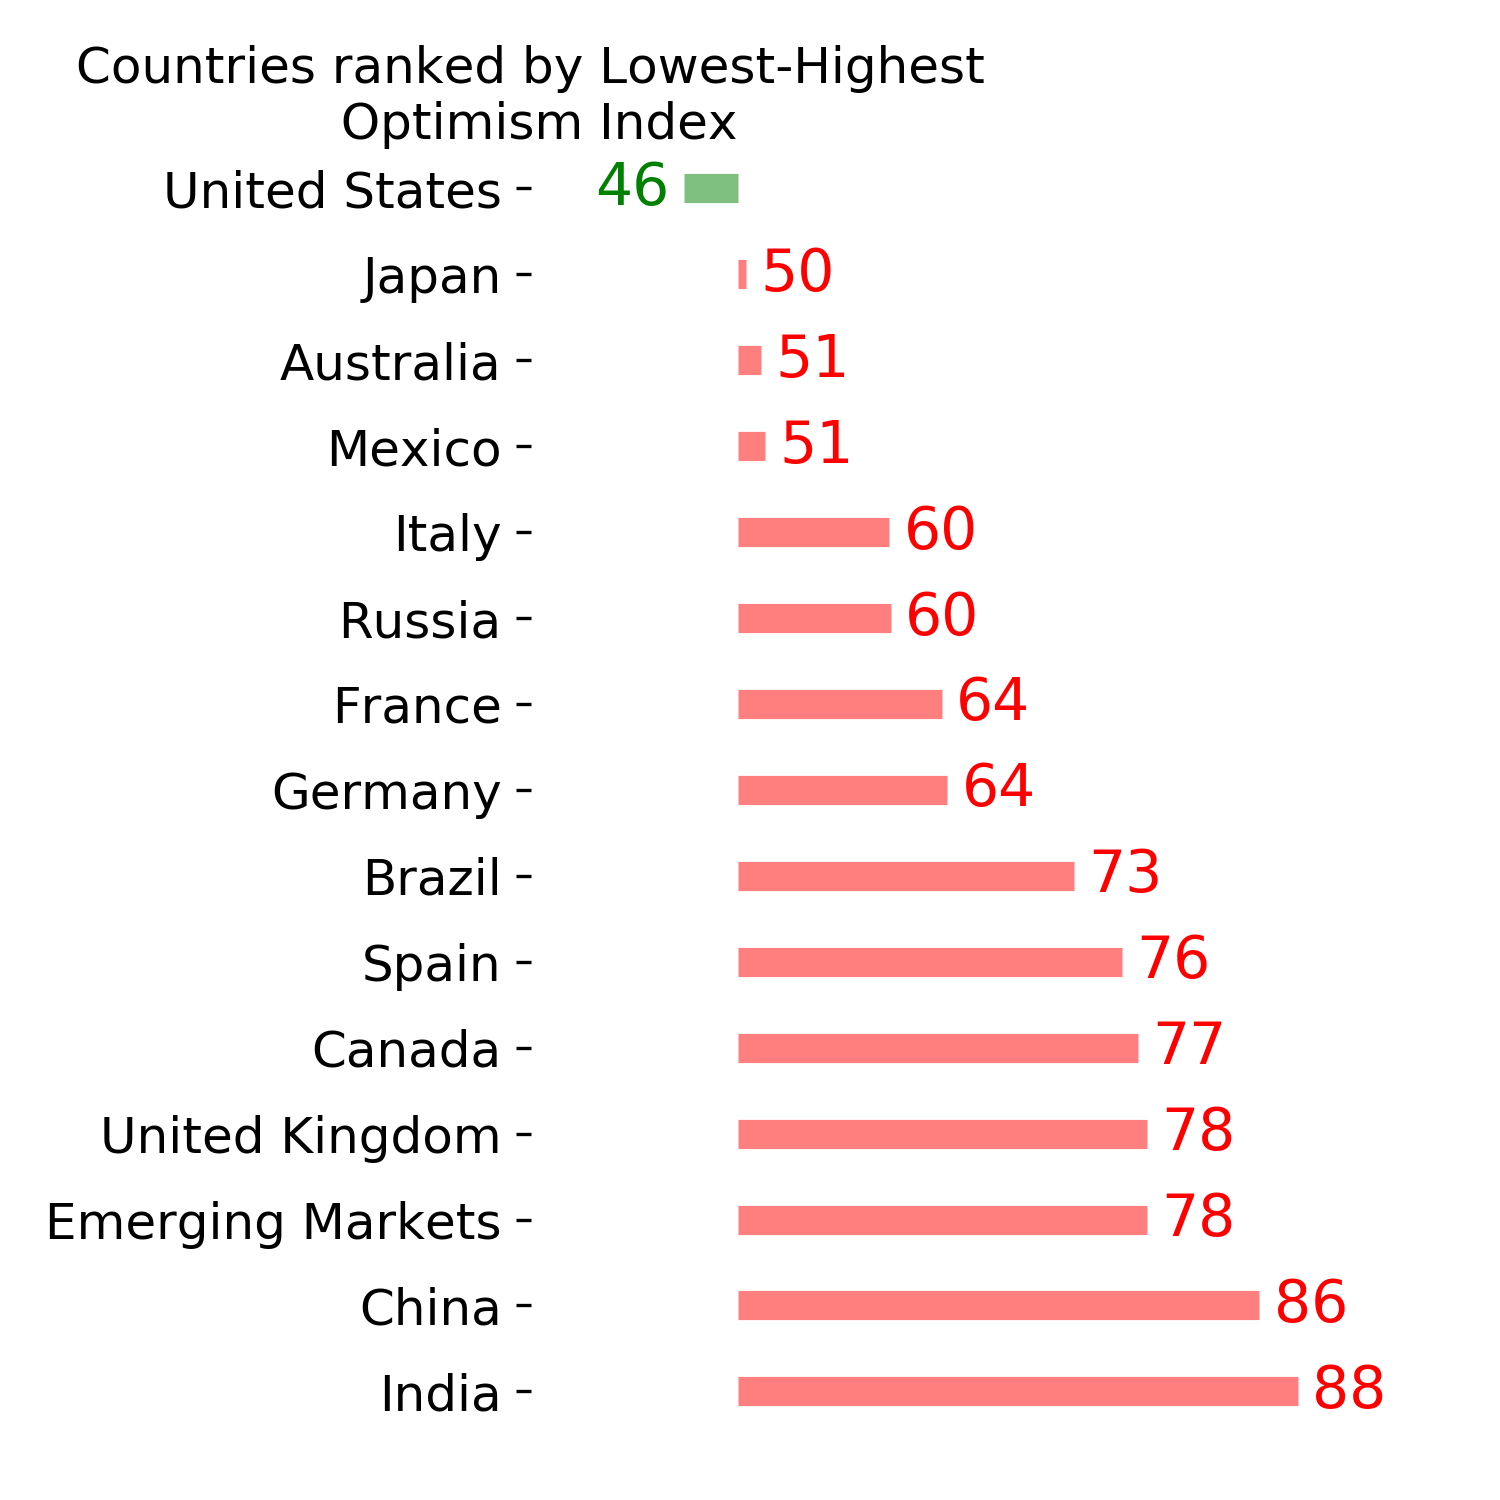
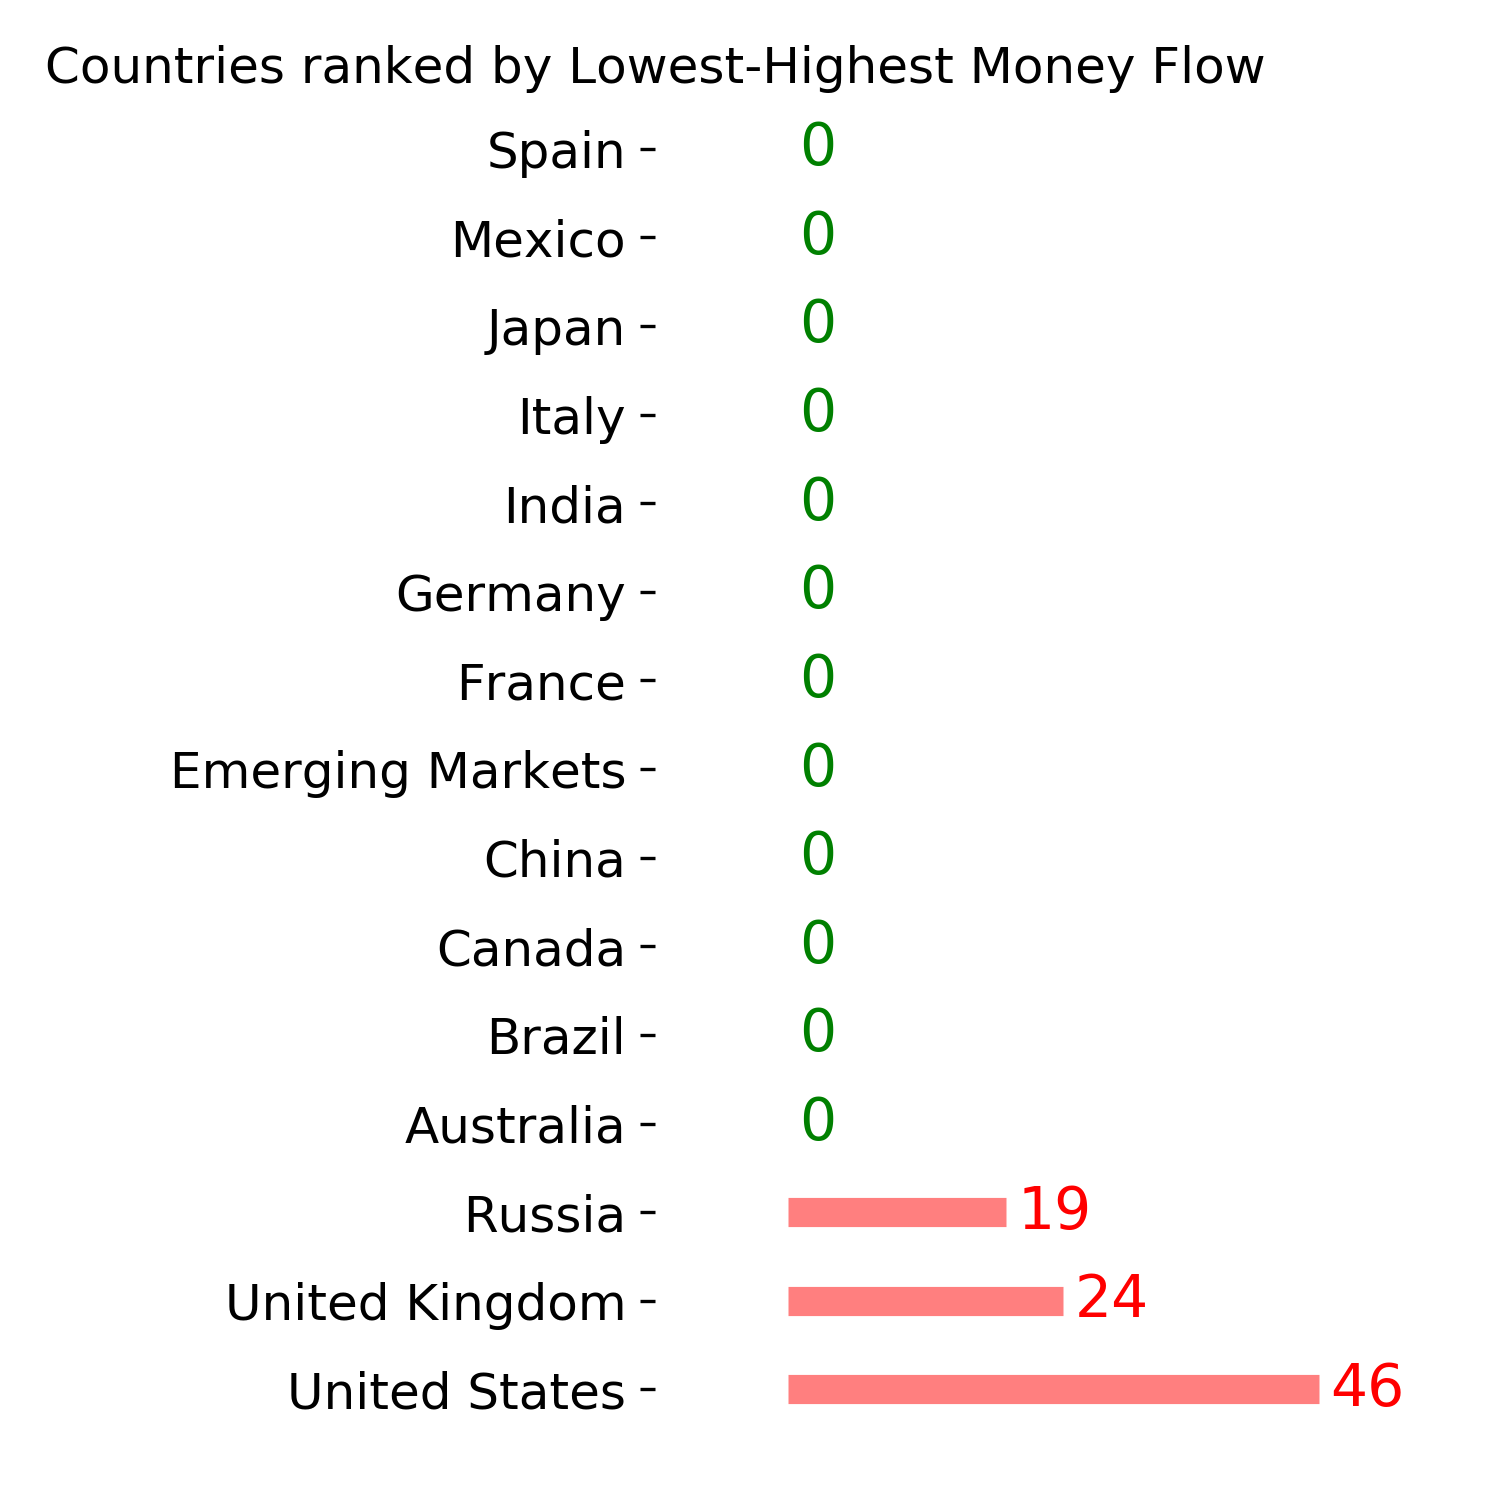
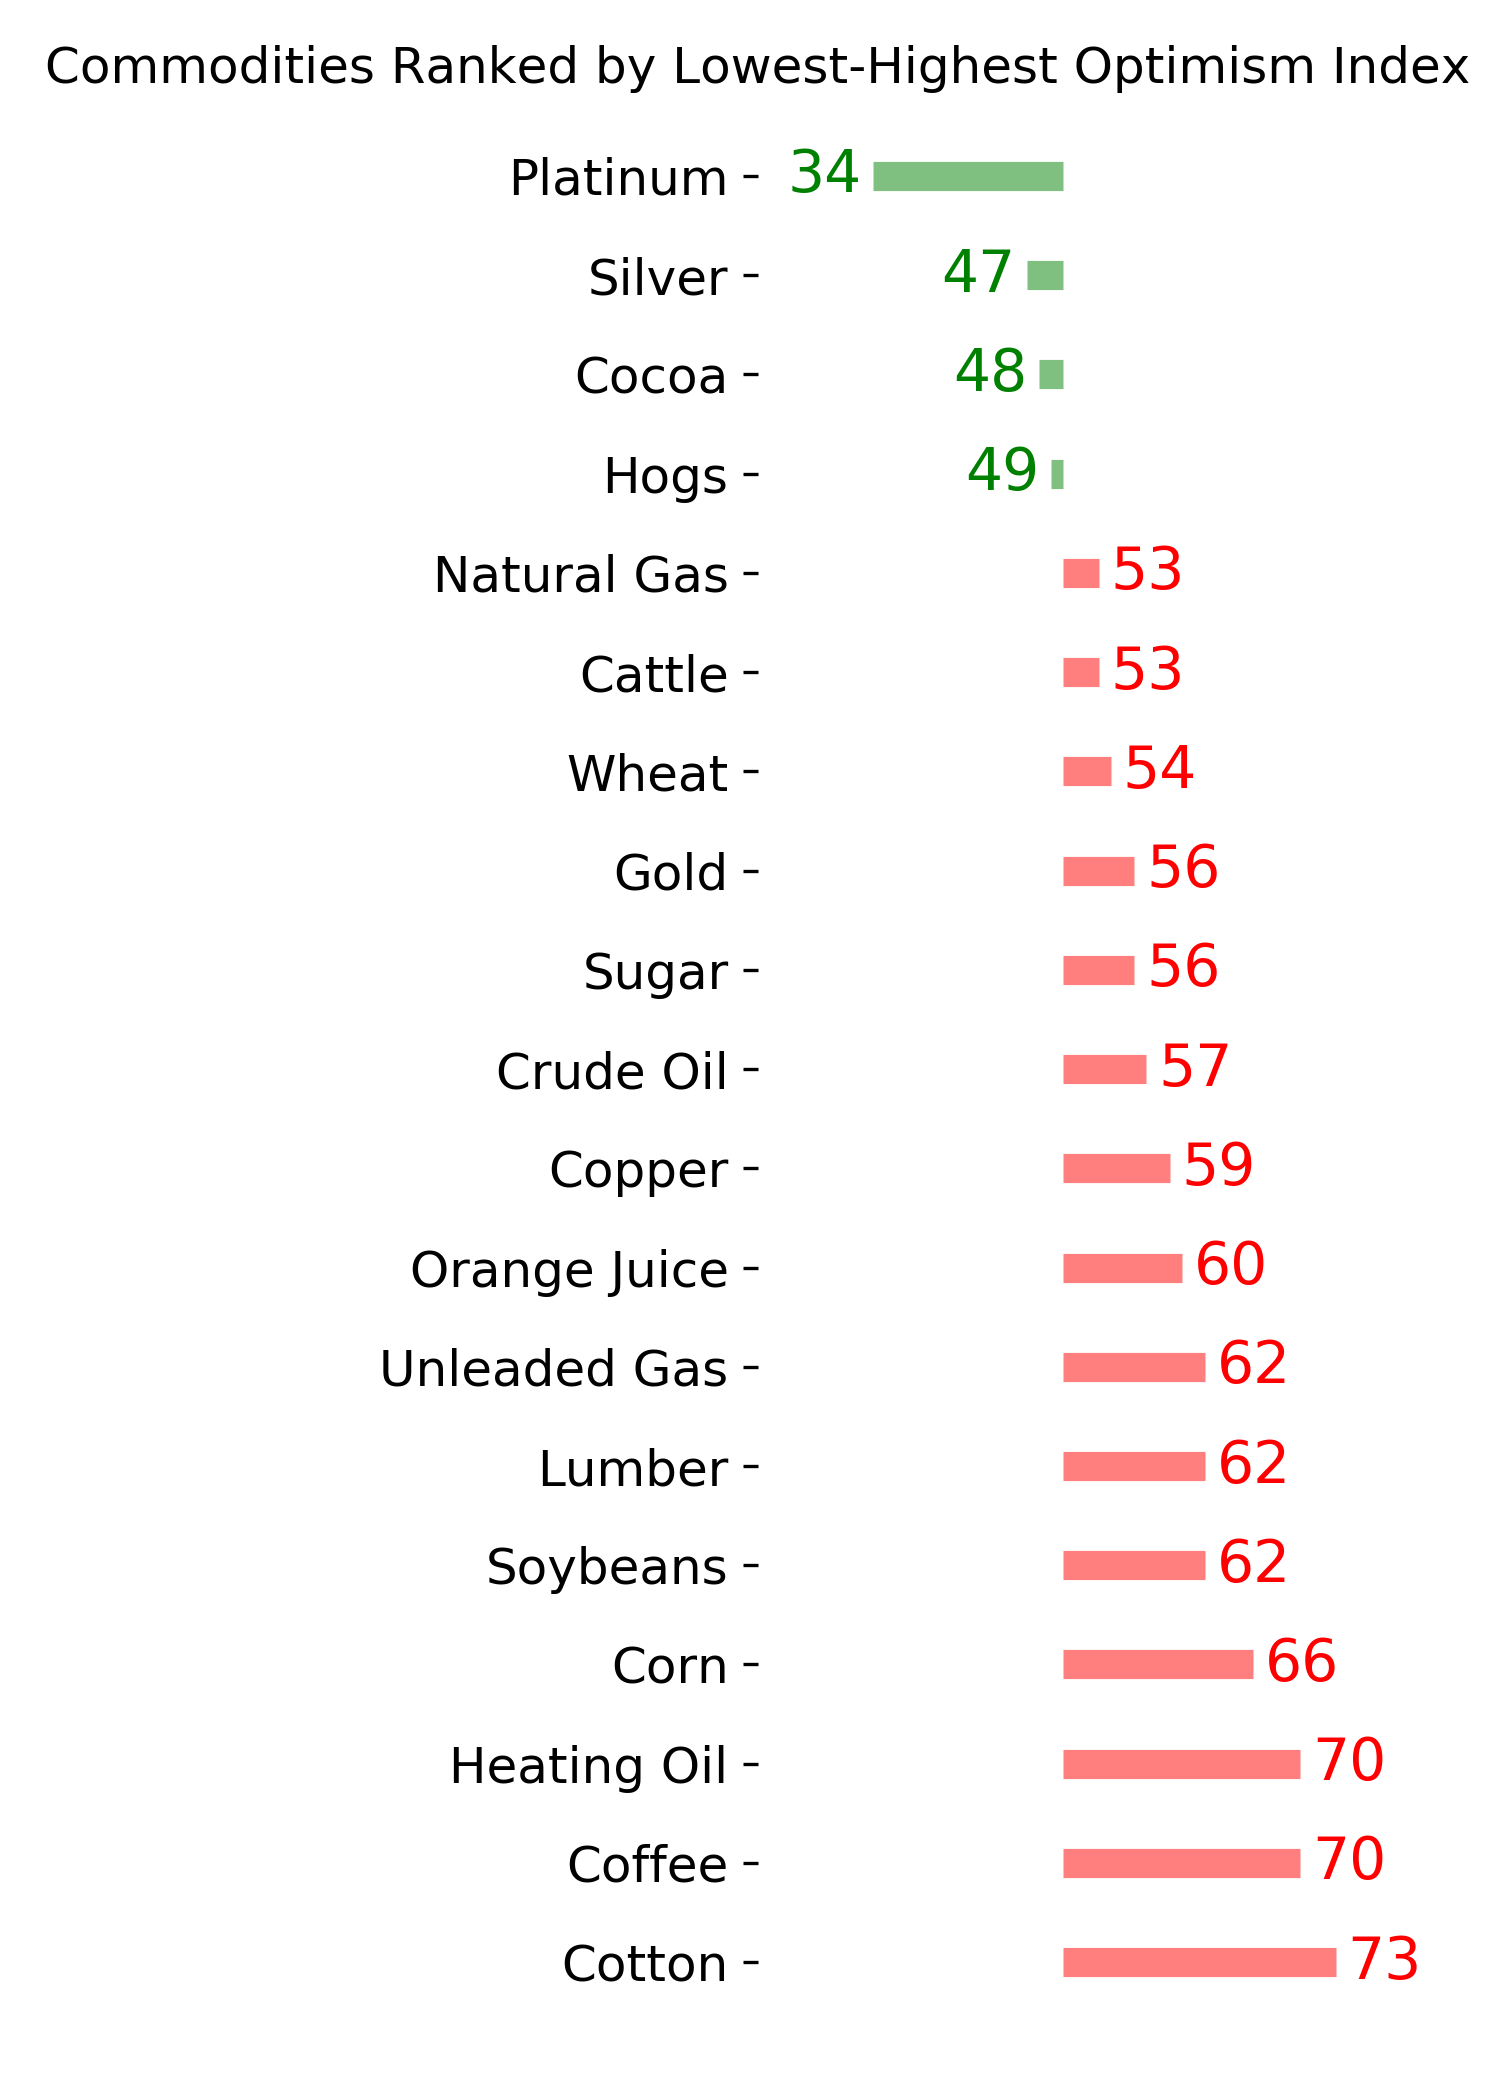
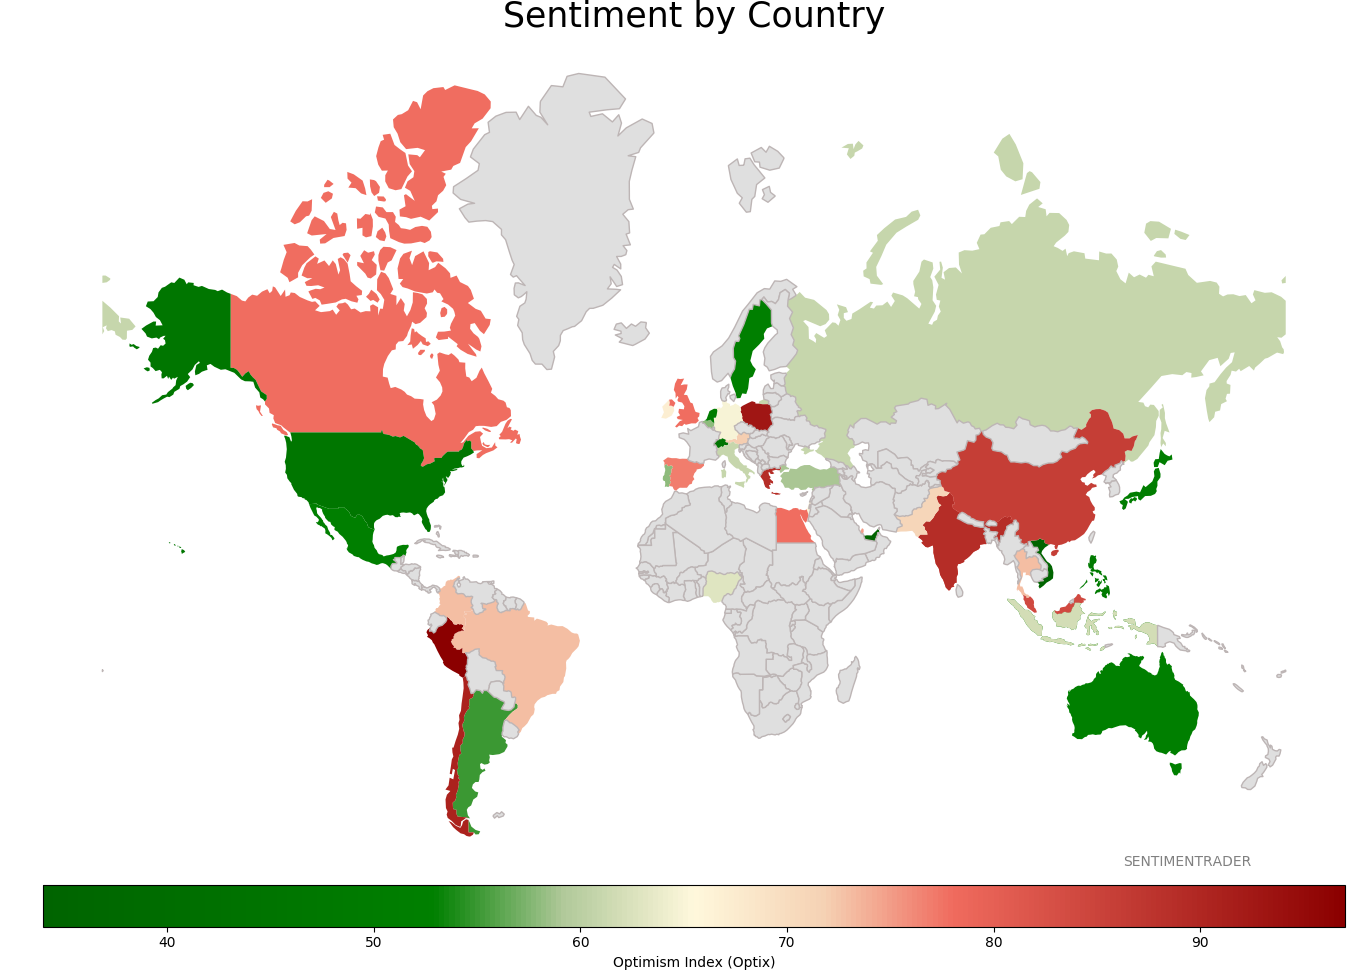
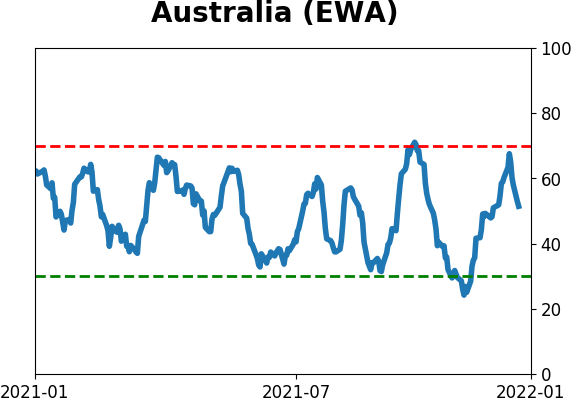
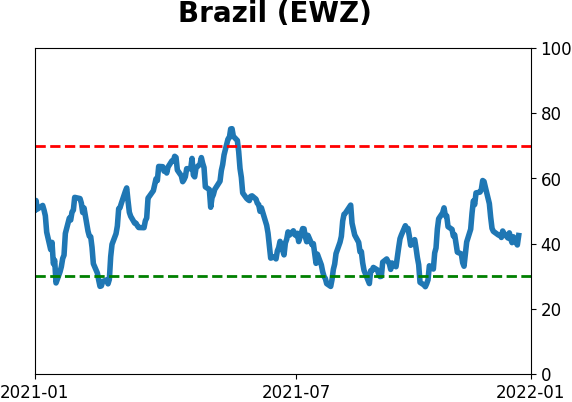
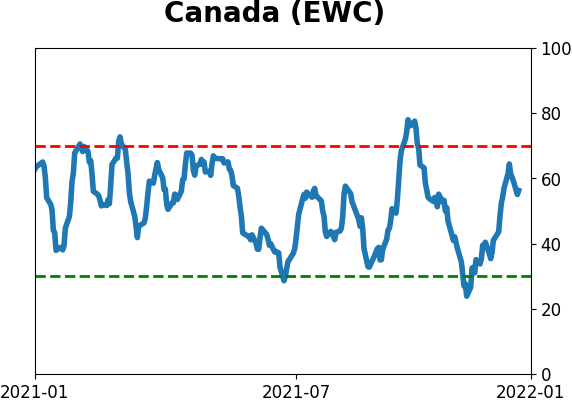
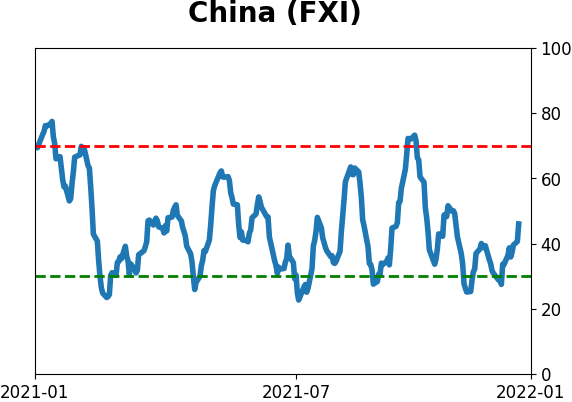
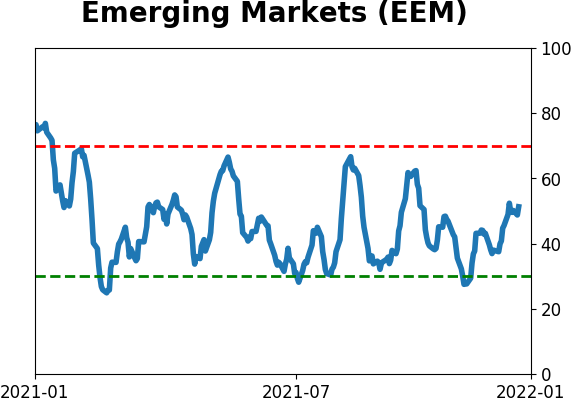
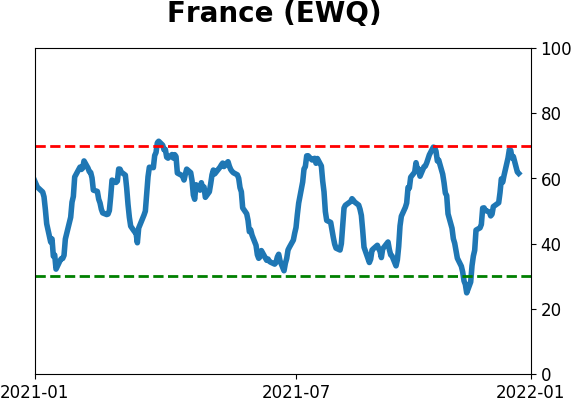
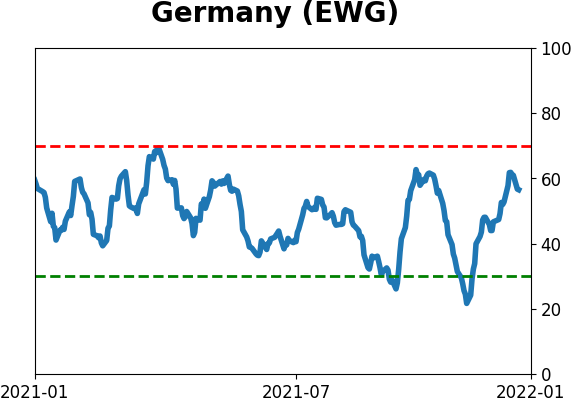
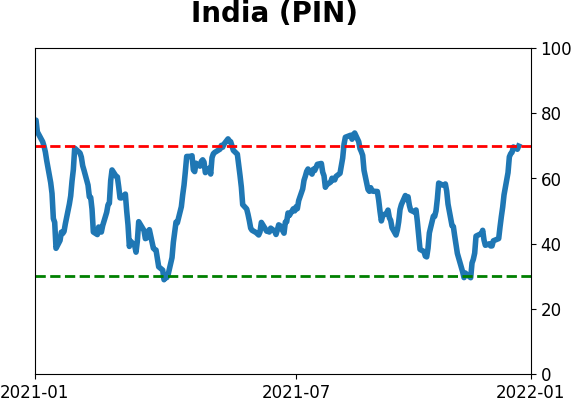
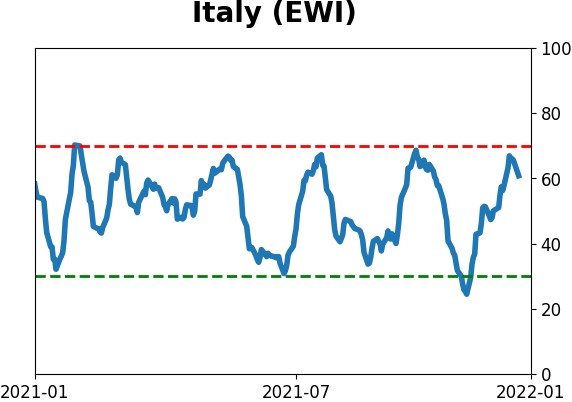
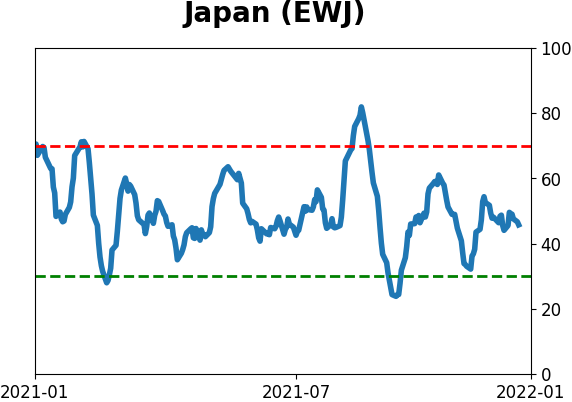
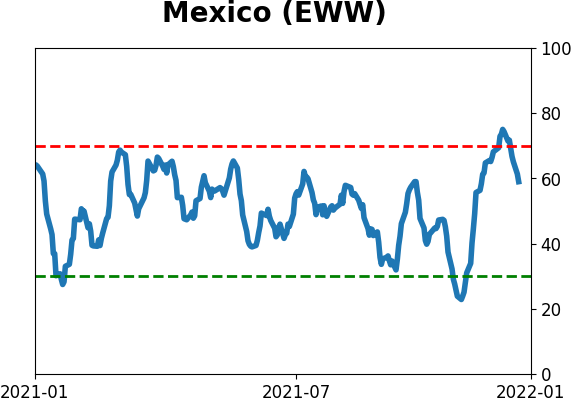
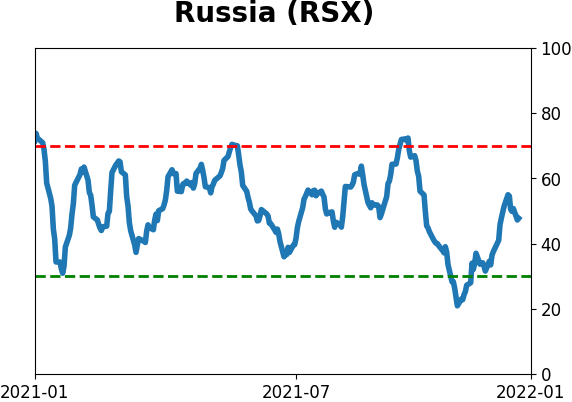
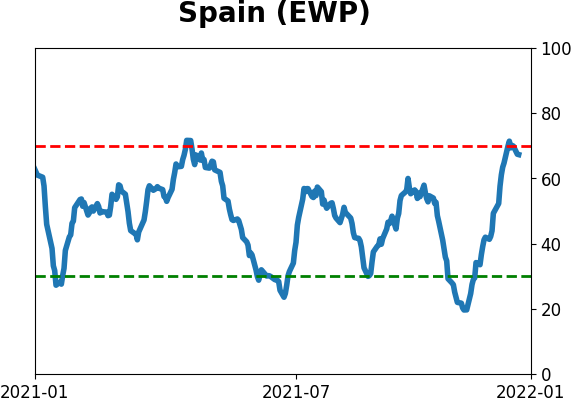
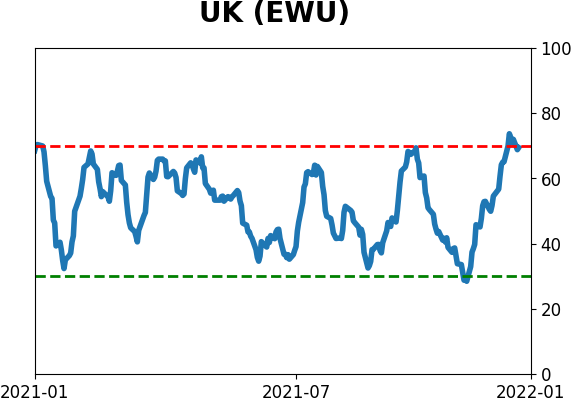
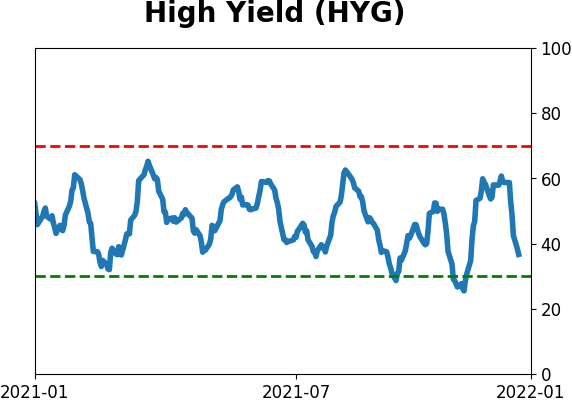
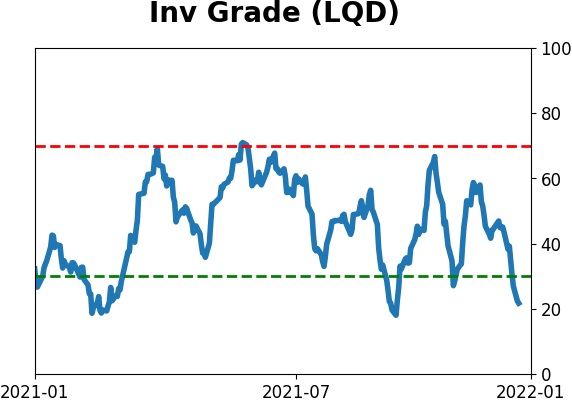
Sentiment Around The World
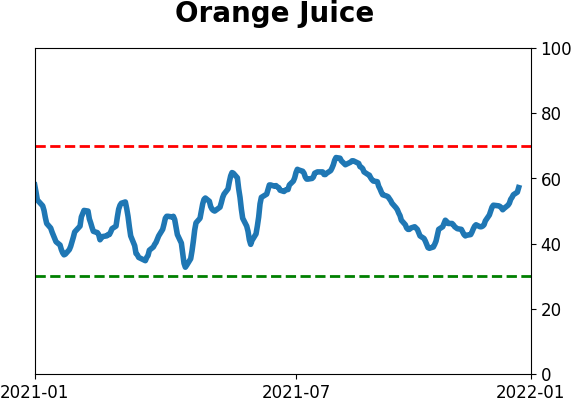
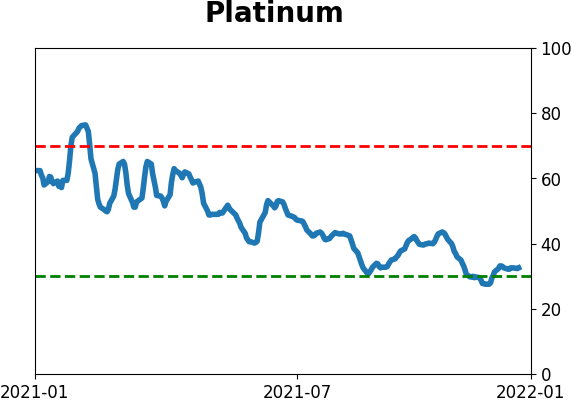
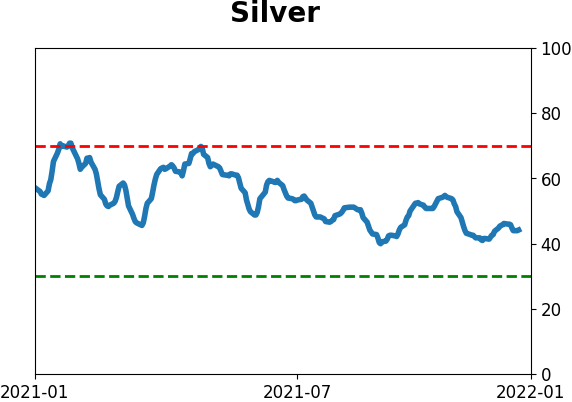
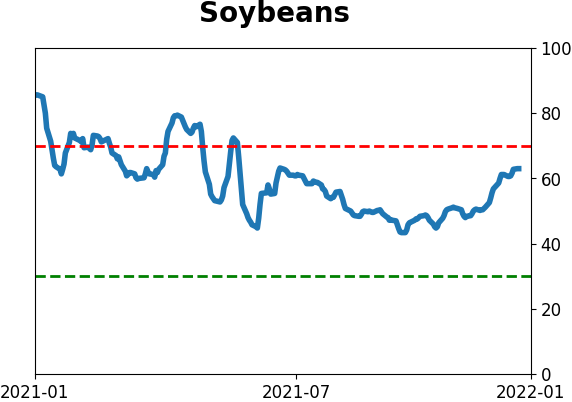
Optimism Index Thumbnails
|
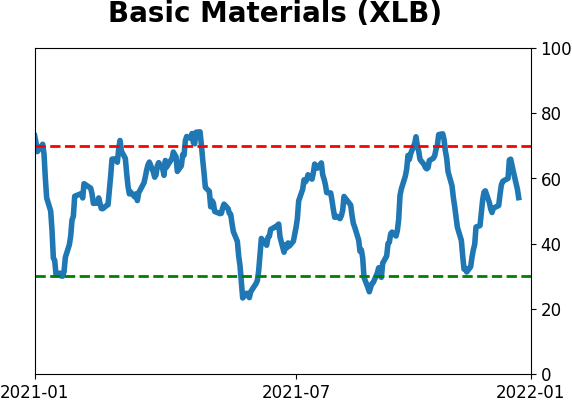
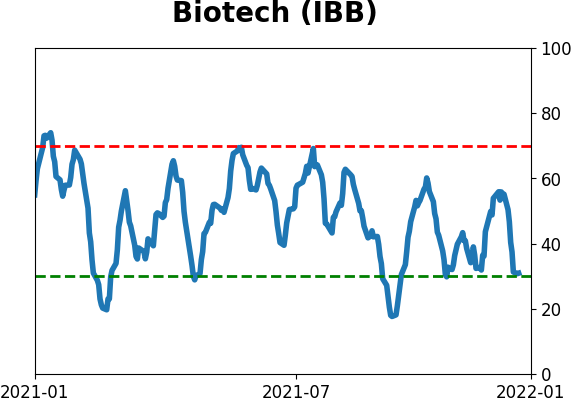
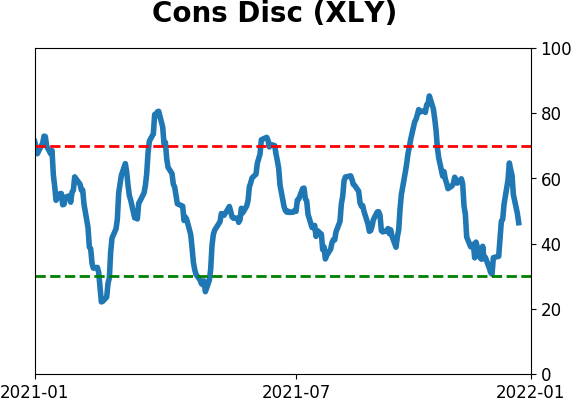
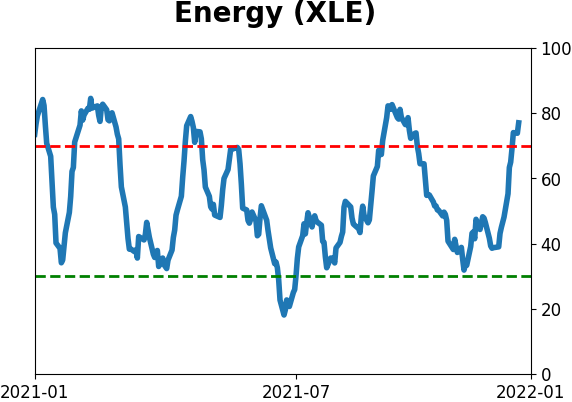
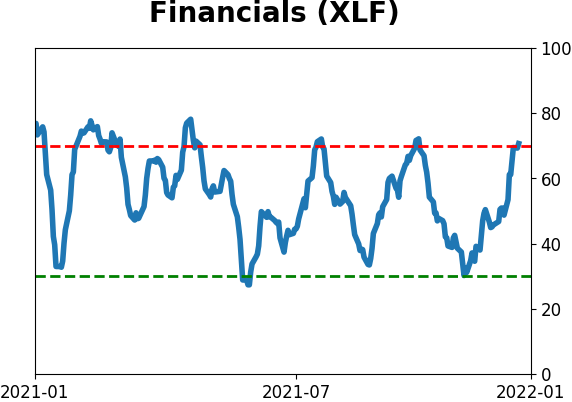
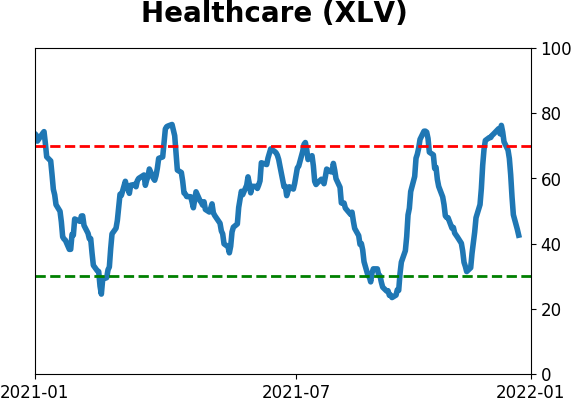
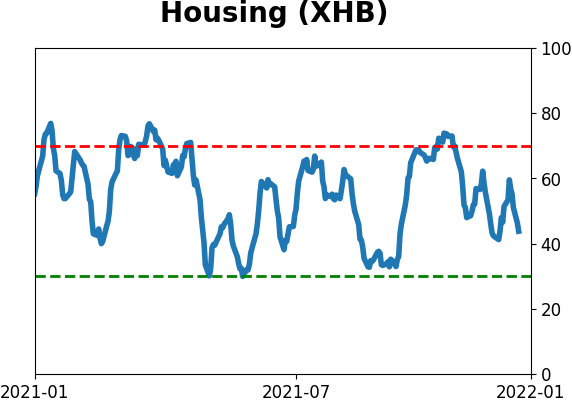
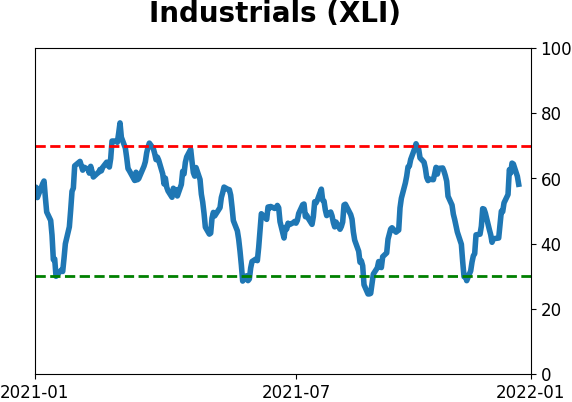
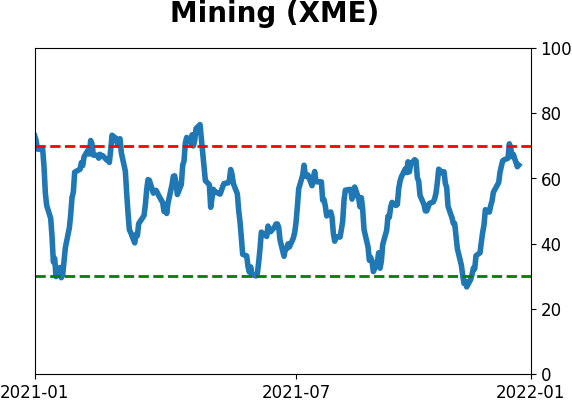
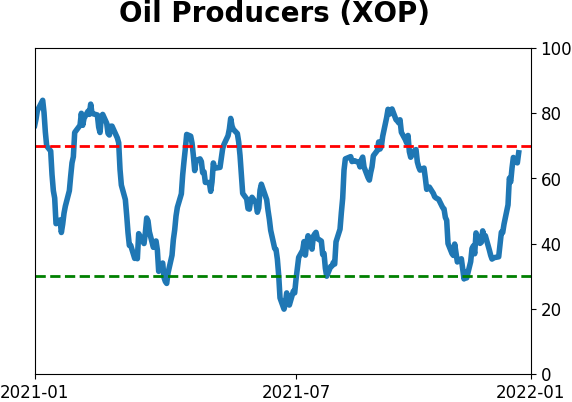
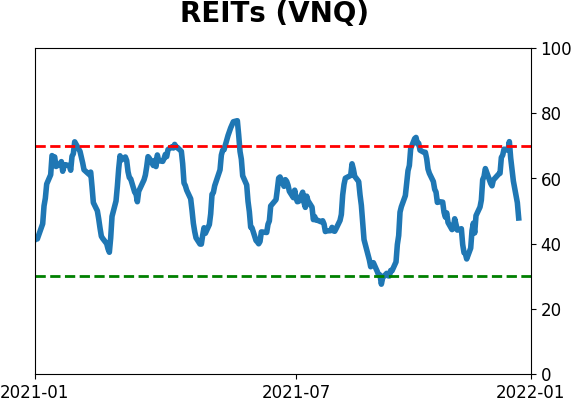
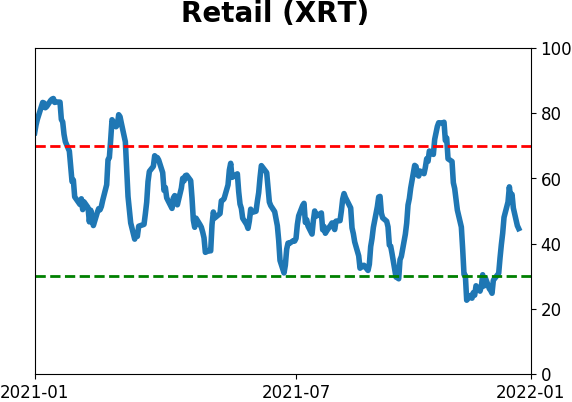
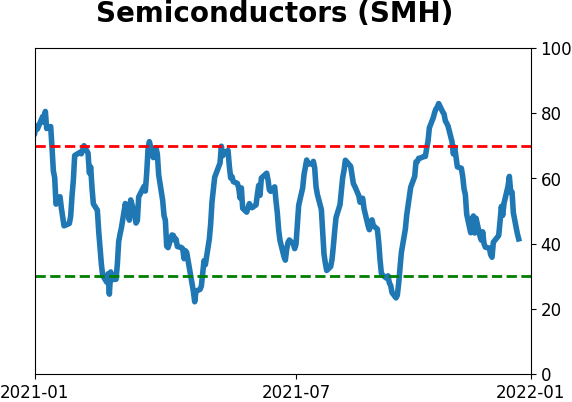
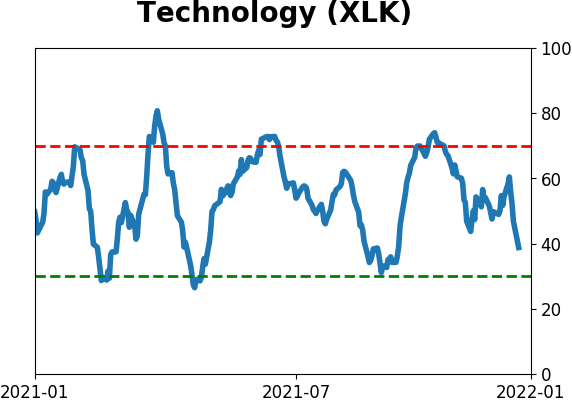
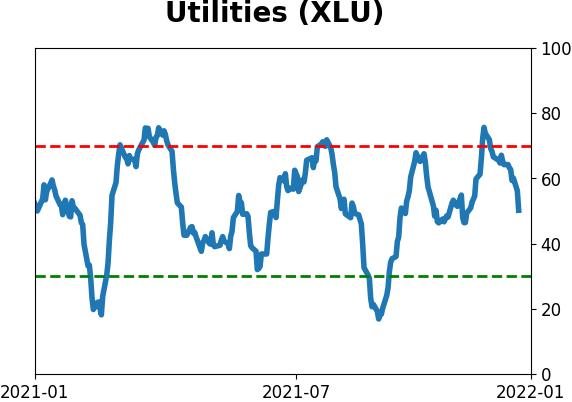
Sector ETF's - 10-Day Moving Average
|
|
|
Country ETF's - 10-Day Moving Average
|
|
|
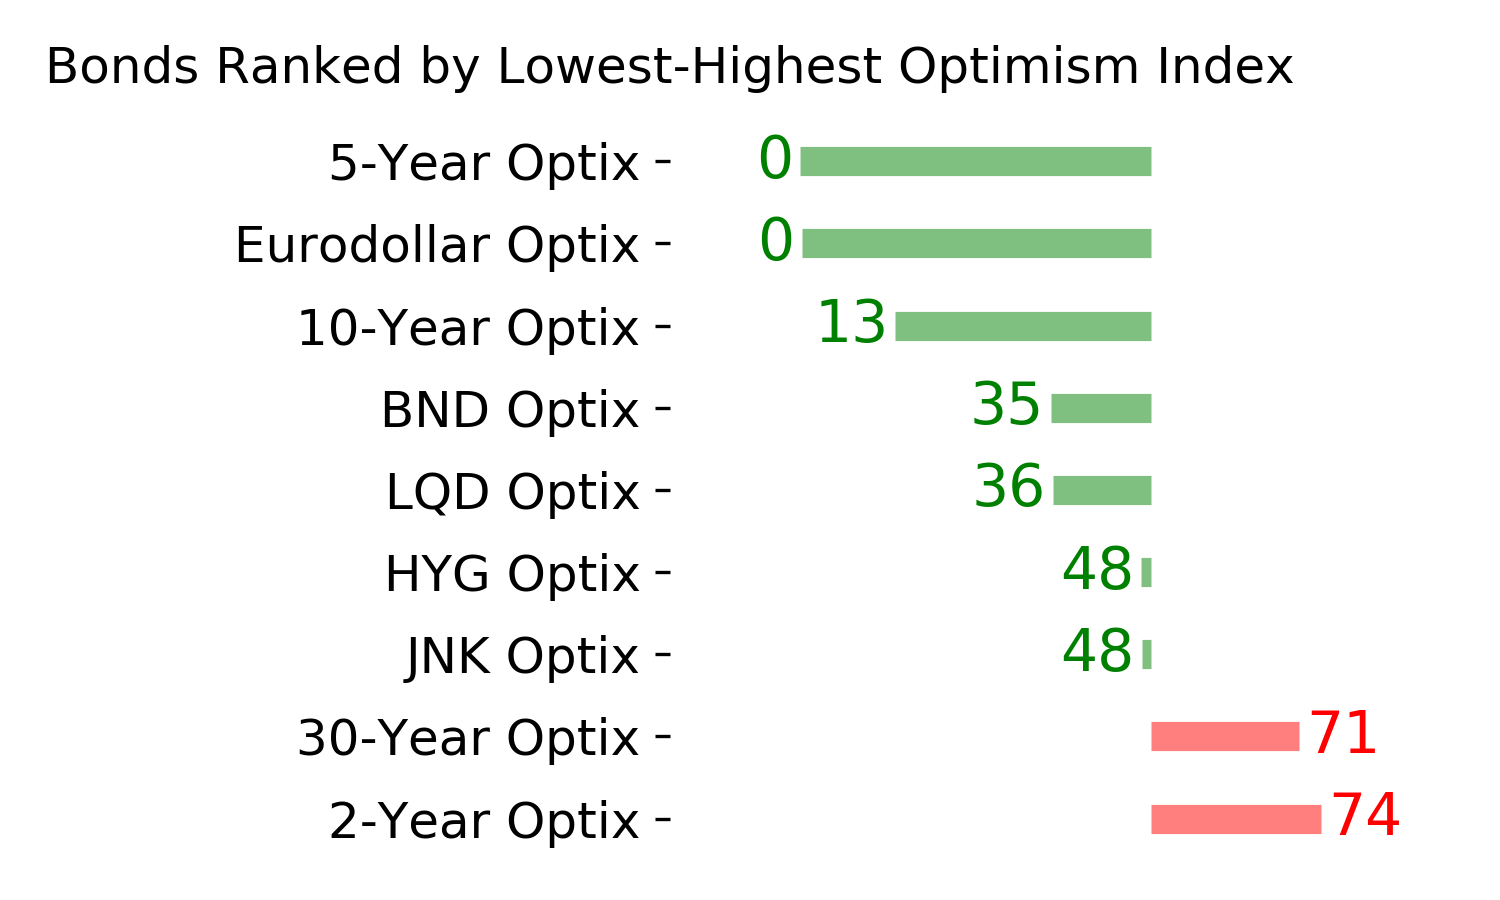
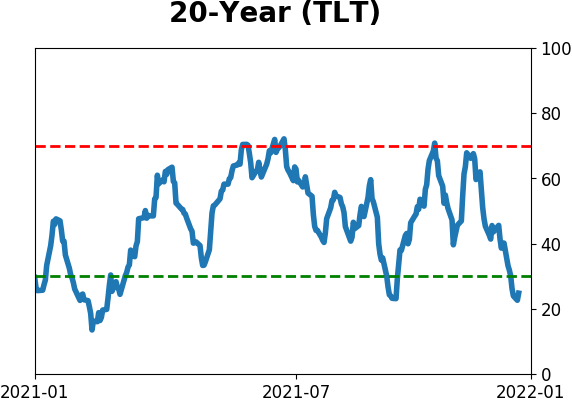
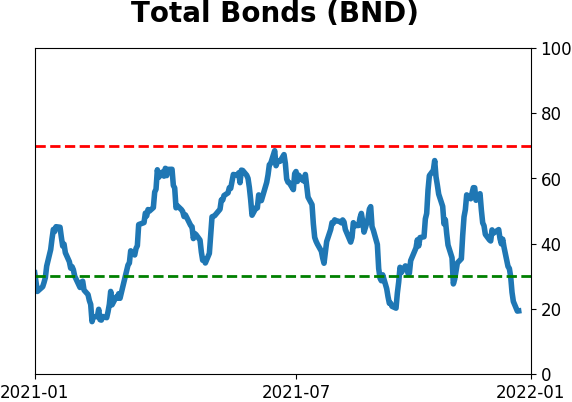
Bond ETF's - 10-Day Moving Average
|
|
|
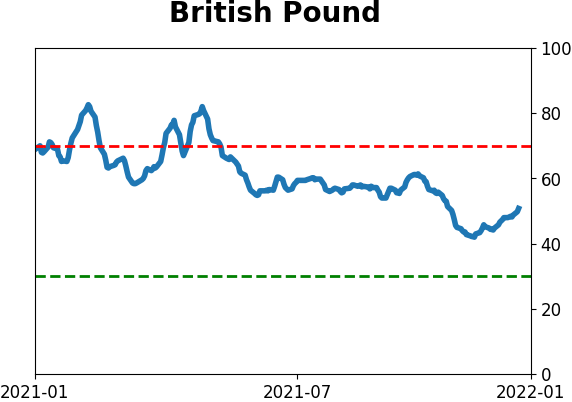
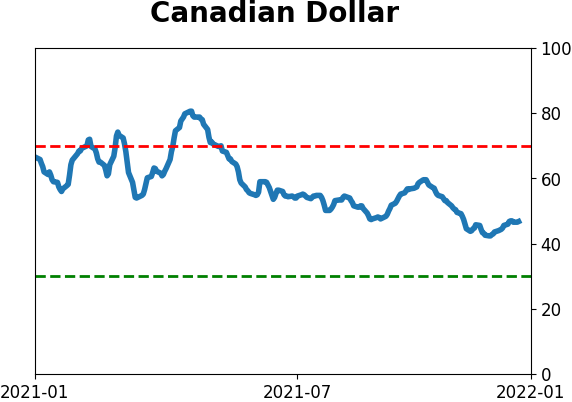
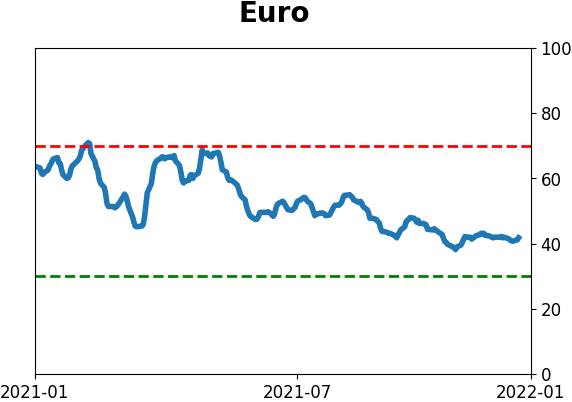
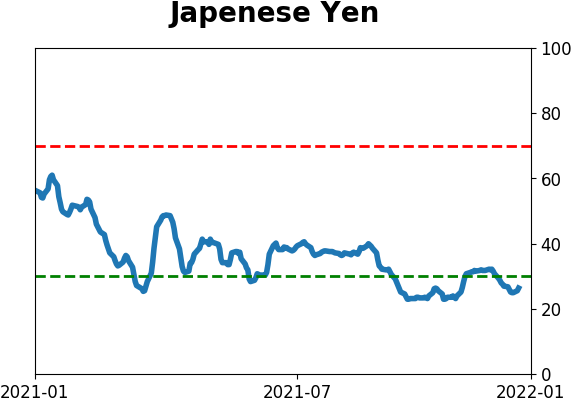
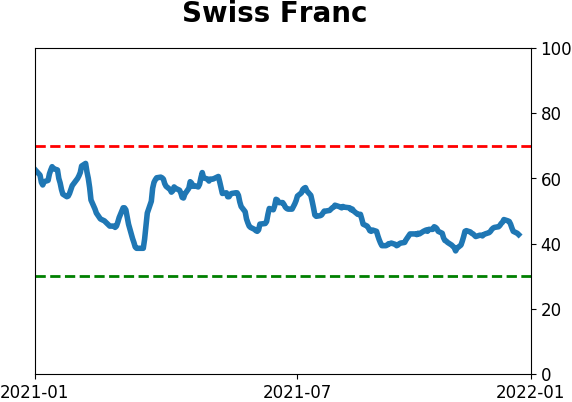
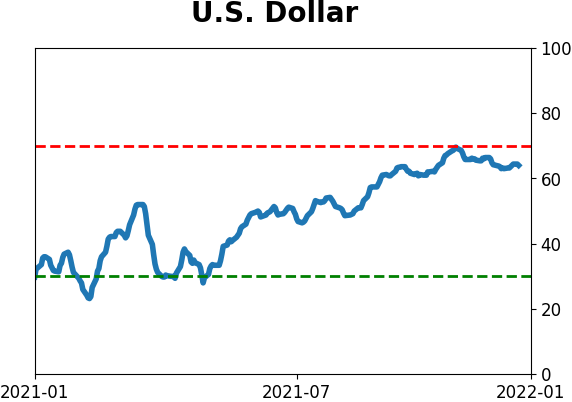
Currency ETF's - 5-Day Moving Average
|
|
|
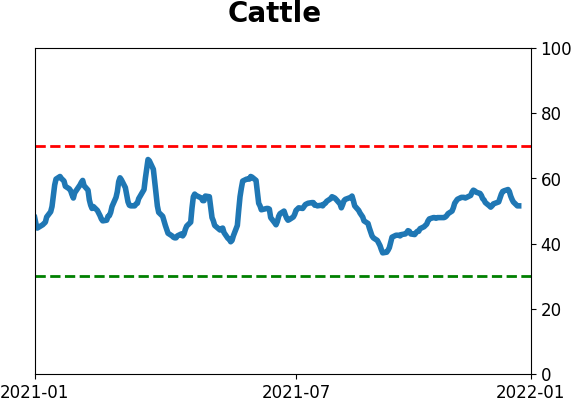
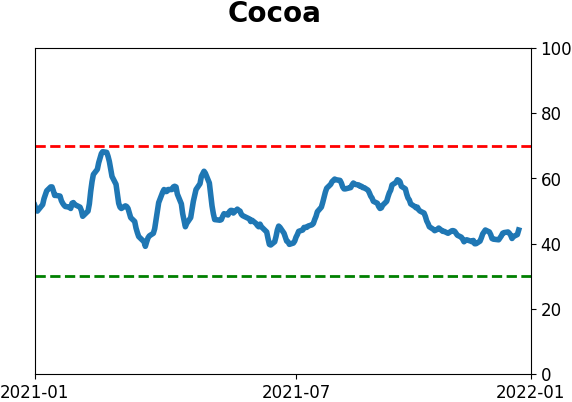
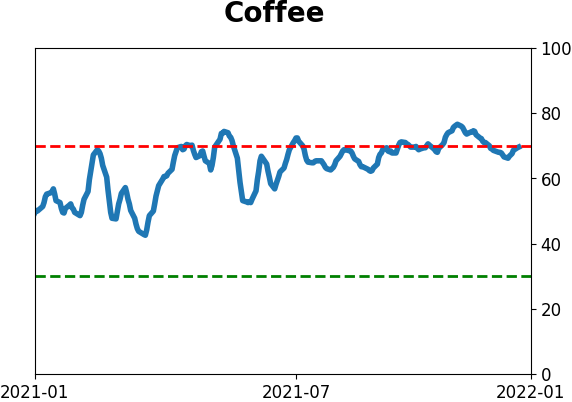
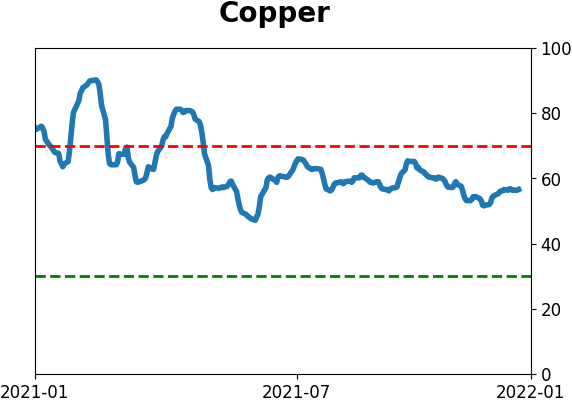
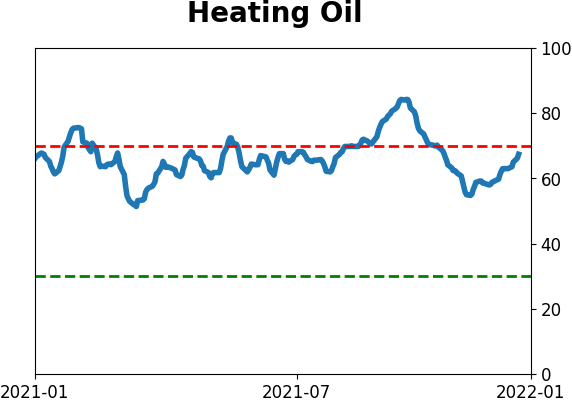
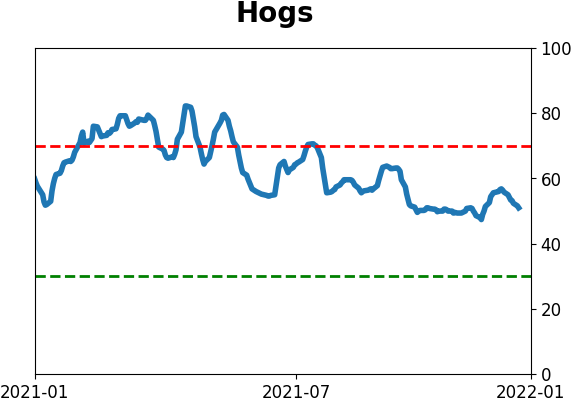
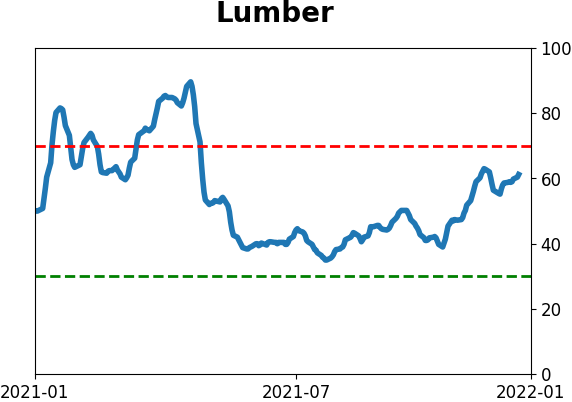
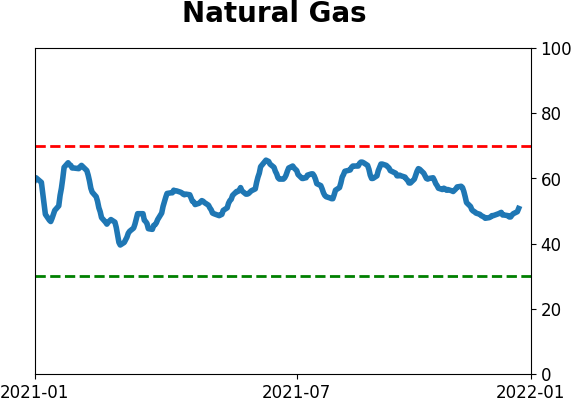
Commodity ETF's - 5-Day Moving Average
|
|