Headlines
|
|
The McClellan Summation Index for defensive sectors nears a record:
The McClellan Summation Index for Consumer Staples, Utilities, and Health Care are all above +1000. The combined value in these defensive sectors is now in the top 1% of all days since 1952. Prior signals led to consistent gains in the S&P 500 over the next 6-12 months.
|
Smart / Dumb Money Confidence
|
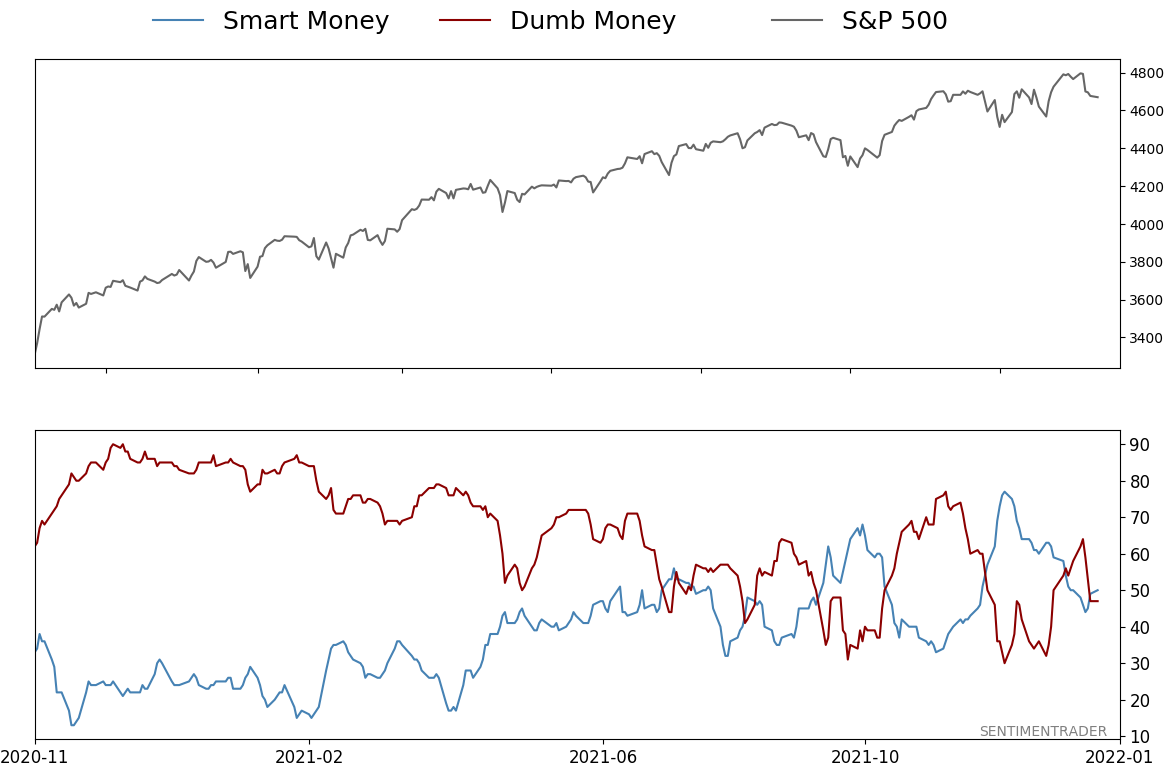
Smart Money Confidence: 50%
Dumb Money Confidence: 47%
|
|
Risk Levels
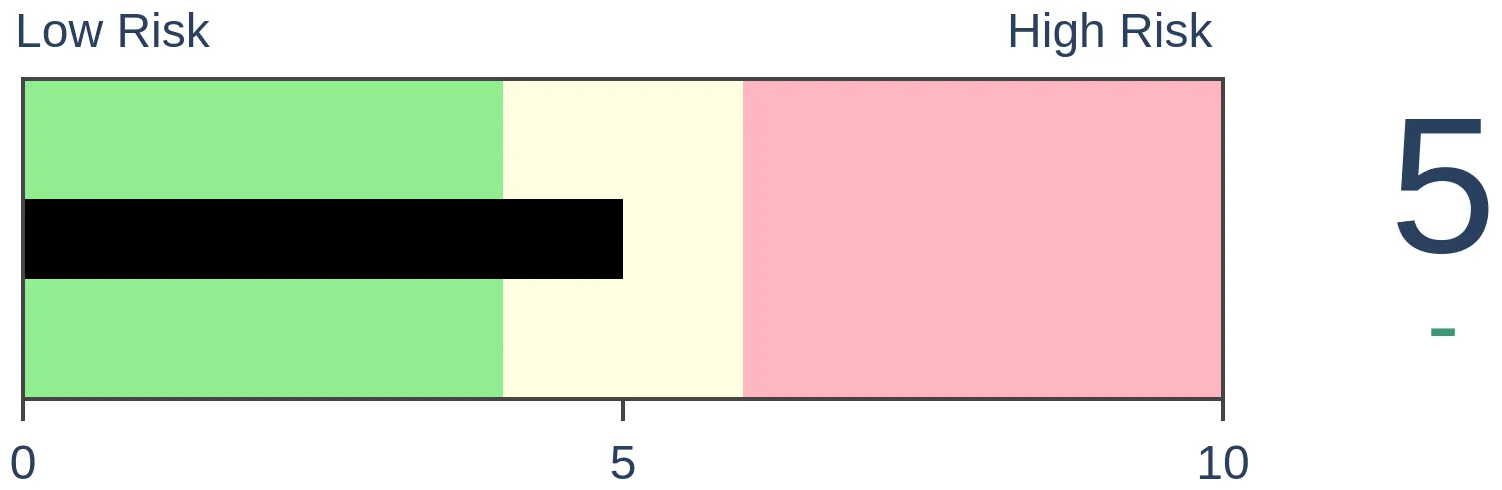
Stocks Short-Term

|
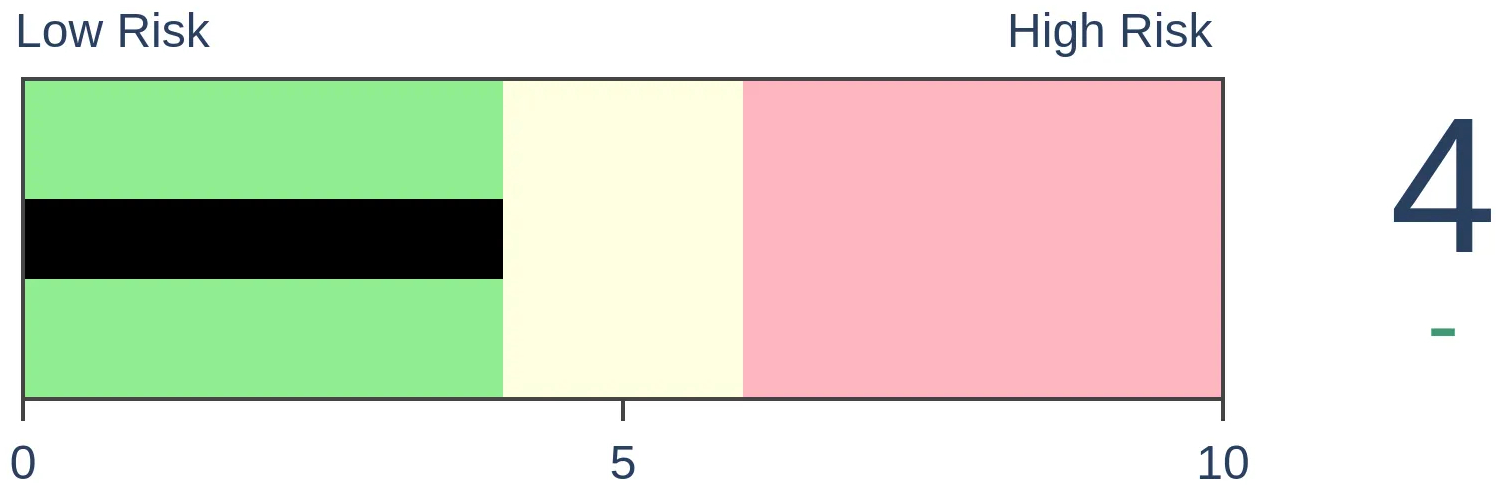
Stocks Medium-Term

|
|
Bonds
|
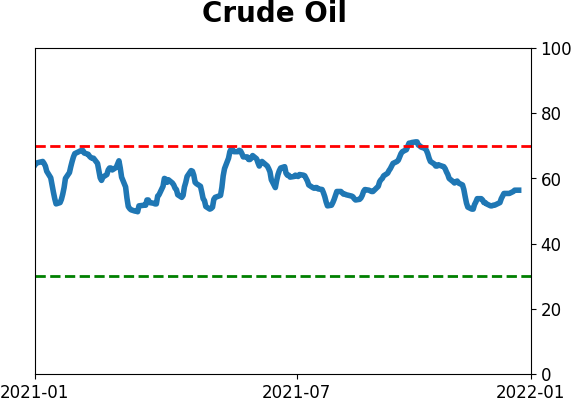
Crude Oil

|
|
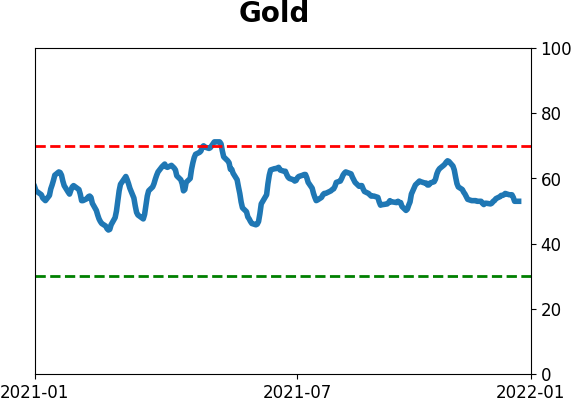
Gold
|
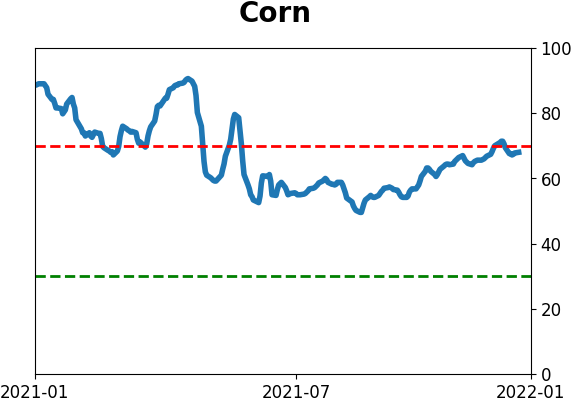
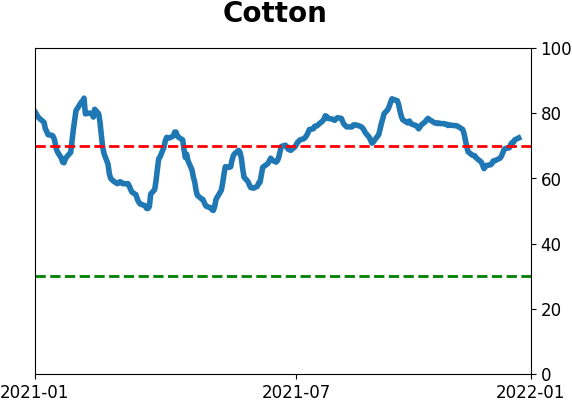
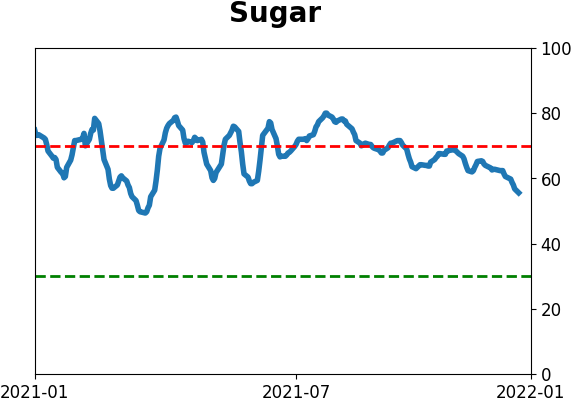
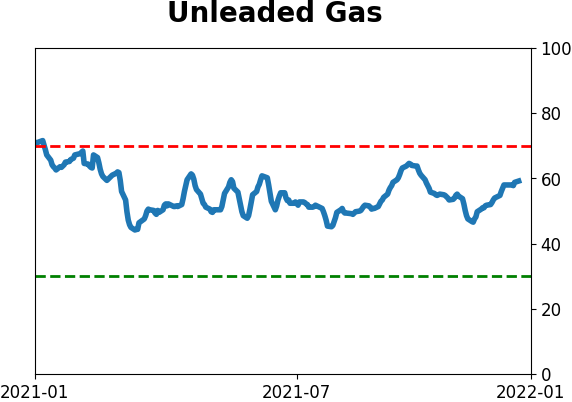
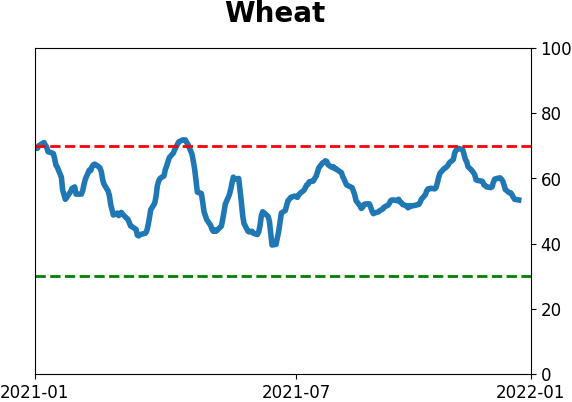
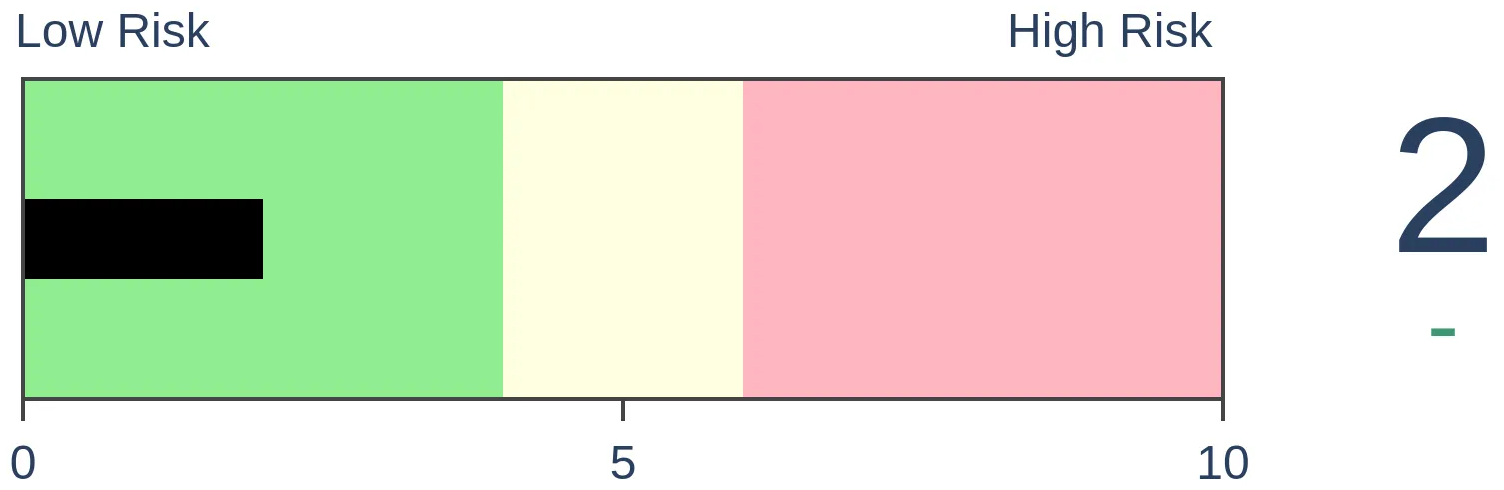
Agriculture
|
|
Research
By Jason Goepfert
BOTTOM LINE
The McClellan Summation Index for Consumer Staples, Utilities, and Health Care are all above +1000. The combined value in these defensive sectors is now in the top 1% of all days since 1952. Prior signals led to consistent gains in the S&P 500 over the next 6-12 months.
FORECAST / TIMEFRAME
SPY -- Up, Long-Term
|
Key points:
- The McClellan Summation Index for Staples, Utilities, and Health Care are all above +1000
- This is one of the strongest combined readings in those defensive sectors in 70 years
- Prior signals led to mostly higher stocks 6-12 months later
Impressive long-term internal recoveries in the most defensive sectors
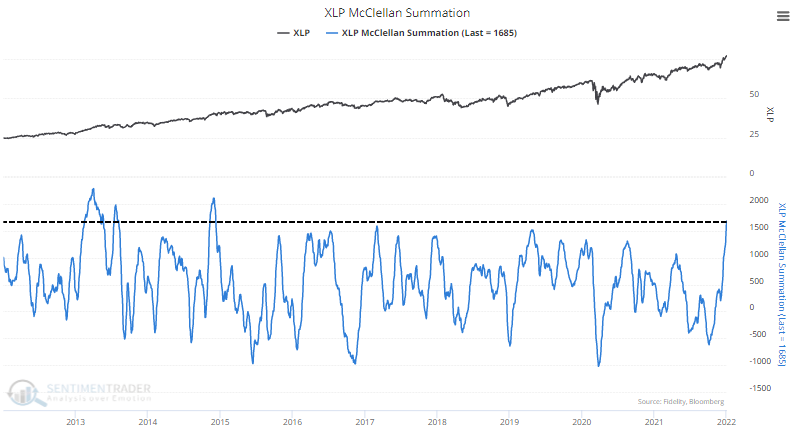
Consumer Staples stocks have been on a roll. In December, we saw that those stocks were seeing an impressive thrust and longer-term recovery, which has tended to see further gains in the months ahead.
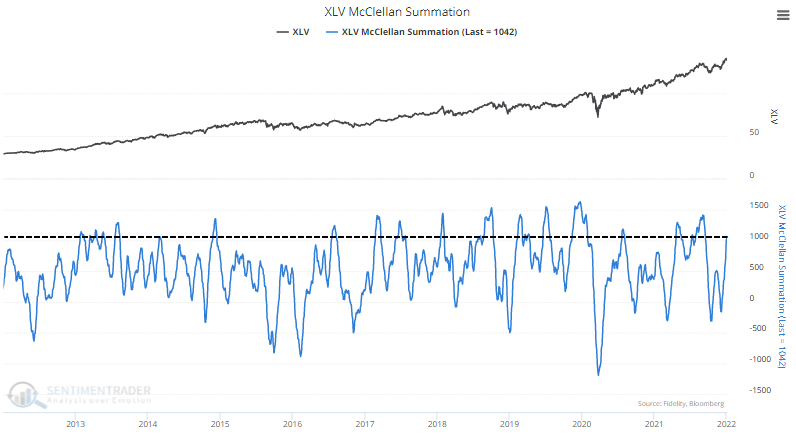
So far, that's been the case. The McClellan Summation Index for Staples is now well above +1000, one of its highest readings in a decade.
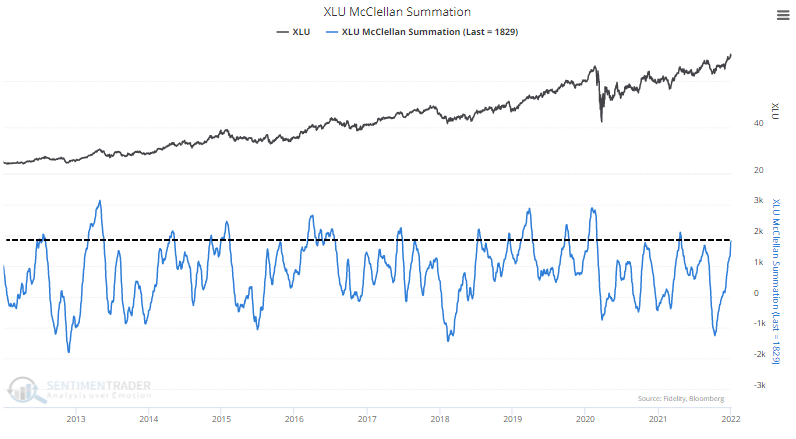
It's not just Staples. Another core defensive sector, Utilities, is also seeing impressive internal momentum.
And so is the other one, Health Care.
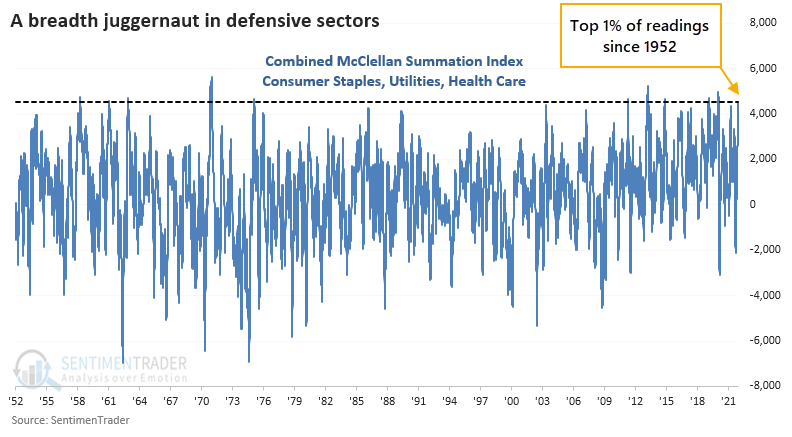
The Summation Index for all 3 sectors is now well above +1000, and their combined value is now in the top 1% of all days since 1952.
Not a sign of an impending bear market
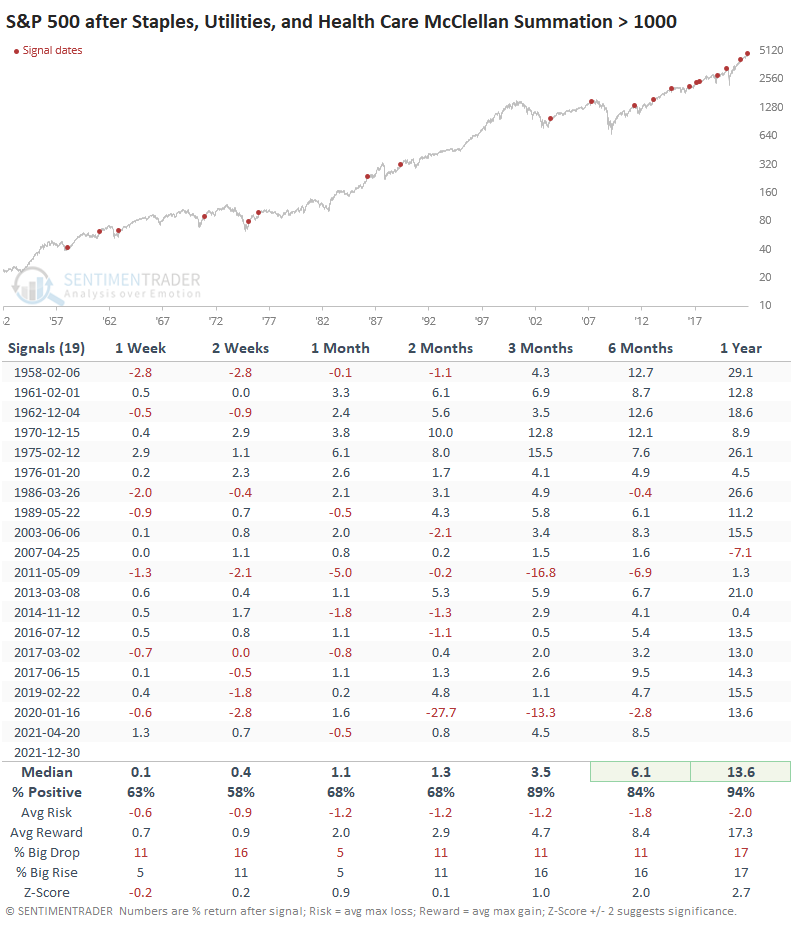
It's assumed that if investors are so hyper-focused on defensive stocks, it's a bad omen for the broader market. Not to be. While the S&P 500 didn't exactly go gangbusters after these signs of long-term internal momentum in the defensive sectors, it still showed above-average returns. It was rare to see a loss over the next 6-12 months.
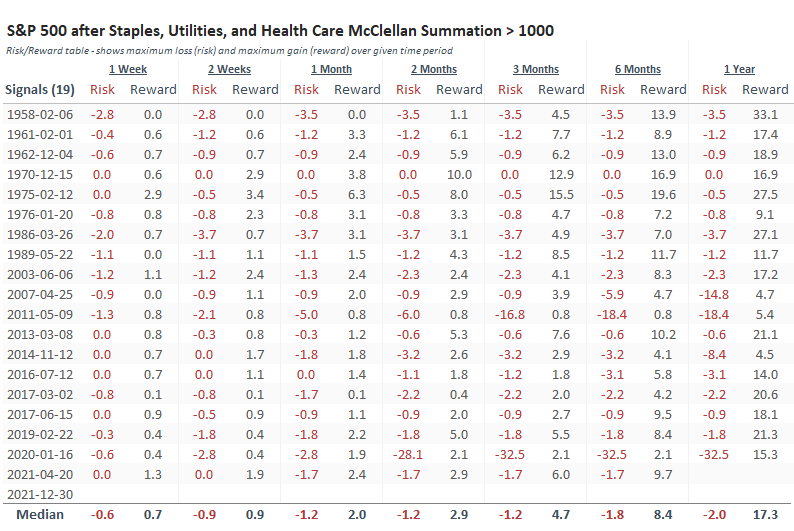
The Risk/Reward table shows small drawdowns with 2 exceptions (2011 and 2020). Outside of those two dates, the S&P didn't lose more than 6% at any point within the next 6 months. By comparison, 13 of the signals showed a gain of more than +6% at some point in the next 6 months.
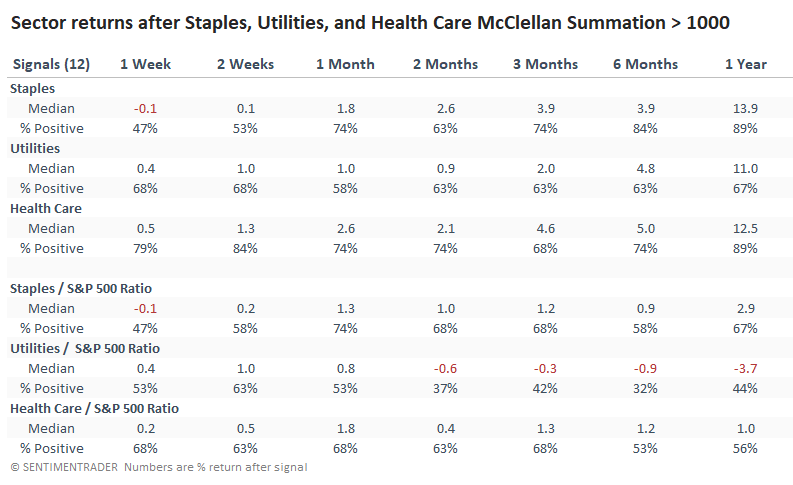
A (mostly) good sign for the sectors, too
The most impressive performance for the sectors themselves was longer-term, except for Utilities. That sector always seems to have problems holding any kind of upside momentum extreme.
The table below shows each sector's return following the signals in the tables above, as well as their performance relative to the S&P 500.
There are some signs of overheating. Earlier this week, 100% of Staples stocks traded above their 50-day moving averages. The Backtest Engine shows that XLP showed a positive return over the next 2 months after only 3 out of 18 prior signals.
What the research tells us...
There have been thrusts across various time frames in the broad market, within the S&P 500, and even more so in some defensive sectors. While that could be taken as a negative sign of risk-off behavior for stocks in general, historically, that has not been the case. Strong and broad recoveries in Staples, Utilities, and Health Care, have preceded medium- to long-term gains in the S&P 500 with few exceptions. The signals were also good for the defensive sectors, though not for Utilities.
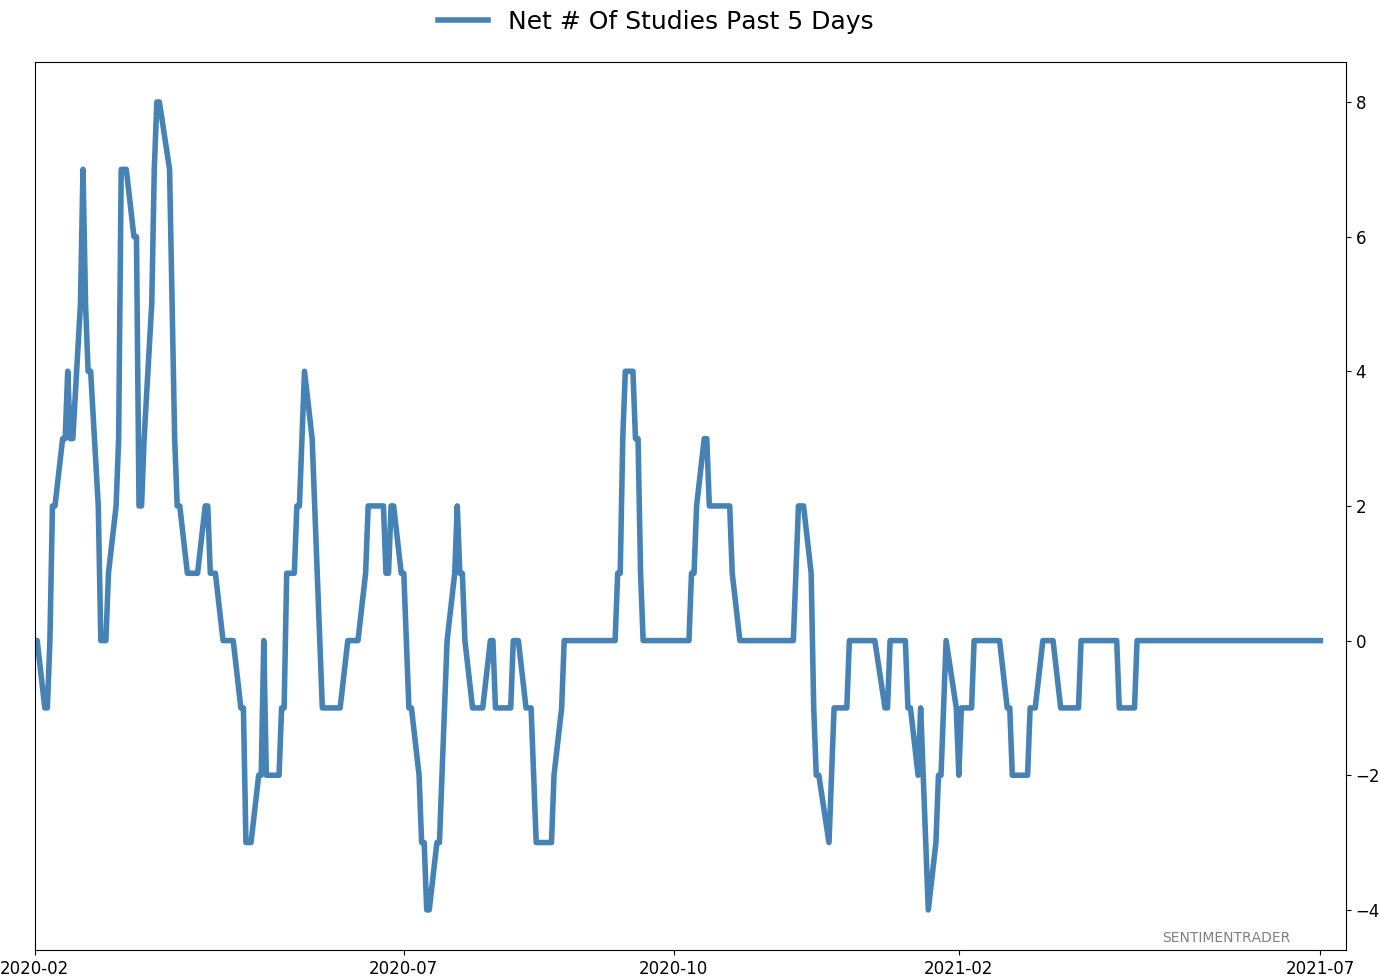
Active Studies
| Time Frame | Bullish | Bearish | | Short-Term | 2 | 0 | | Medium-Term | 13 | 2 | | Long-Term | 13 | 4 |
|
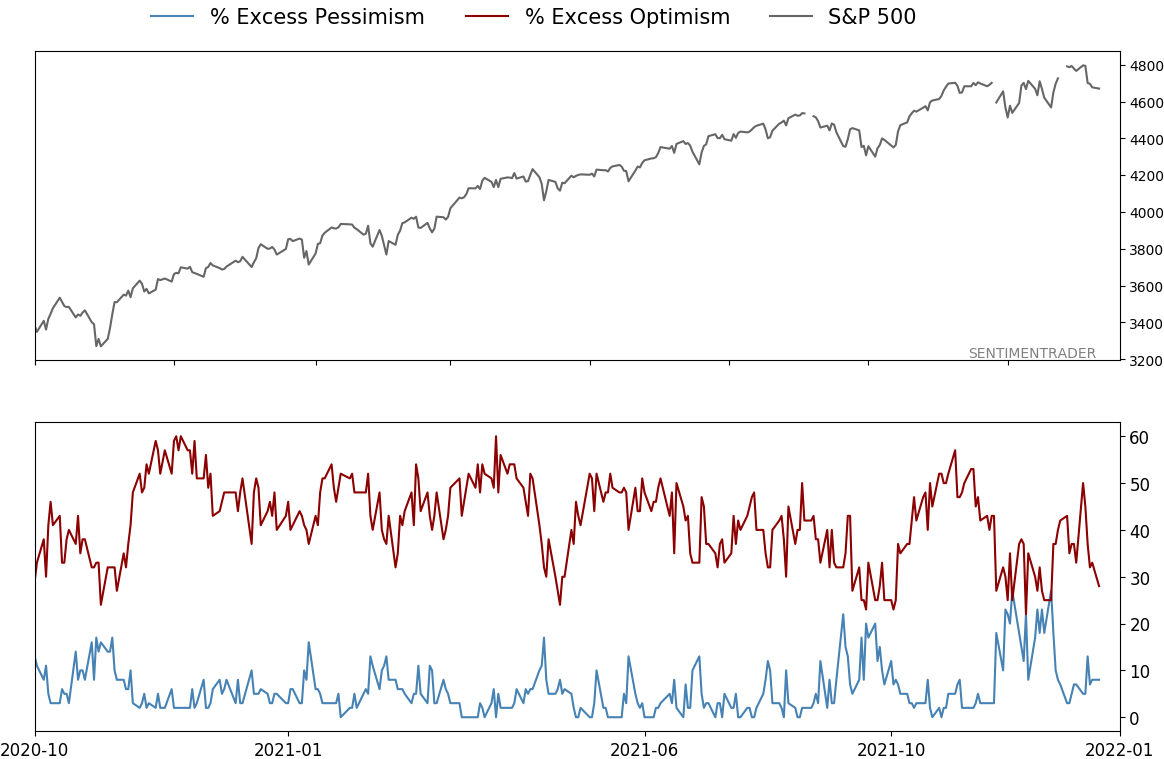
Indicators at Extremes
Portfolio
| Position | Description | Weight % | Added / Reduced | Date | | Stocks | RSP | 35.9 | Added 25.2% | 2022-01-03 | | Bonds | 32.7% BND, 7.1% SCHP | 39.8 | Added 8.3% | 2021-10-26 | | Commodities | GCC | 2.4 | Reduced 2.1%
| 2020-09-04 | | Precious Metals | GDX | 4.6 | Reduced 4.2% | 2021-05-19 | | Special Situations | 9.8% KWEB, 4.7% XLE, 2.9% PSCE | 17.3 | Added 9.78% | 2021-10-01 | | Cash | | 0.1 | | |
|
Updates (Changes made today are underlined)
Coinciding with the new year, there was a thrust in participation in the S&P 500 near the end of December. Thrusts have been among the most consistent signals over the decades, and this is hard to ignore. I have greater confidence in thrusts when coming off extreme pessimism, like the spring of 2020, as opposed to near all-time highs on low volume. Still, it's hard to justify not being at least neutral weight stocks given this behavior. Bond sentiment is trying to recover from a recent bout of pessimism, and gold stocks are doing their thing which is not much at all. They've been flat for six months. Chinese tech stocks were doing exactly what they're supposed to do, then did *not* by plunging to new lows. This is troubling on a shorter-term time frame, but this was never meant for a trade, rather a multi-year investment. Recent behavior is troubling and I will not be adding any exposure as long as that's the case. RETURN YTD: -0.3% 2021: +8.7%, 2020: +8.1%, 2019: +12.6%, 2018: +0.6%, 2017: +3.8%, 2016: +17.1%, 2015: +9.2%, 2014: +14.5%, 2013: +2.2%, 2012: +10.8%, 2011: +16.5%, 2010: +15.3%, 2009: +23.9%, 2008: +16.2%, 2007: +7.8%
|
|
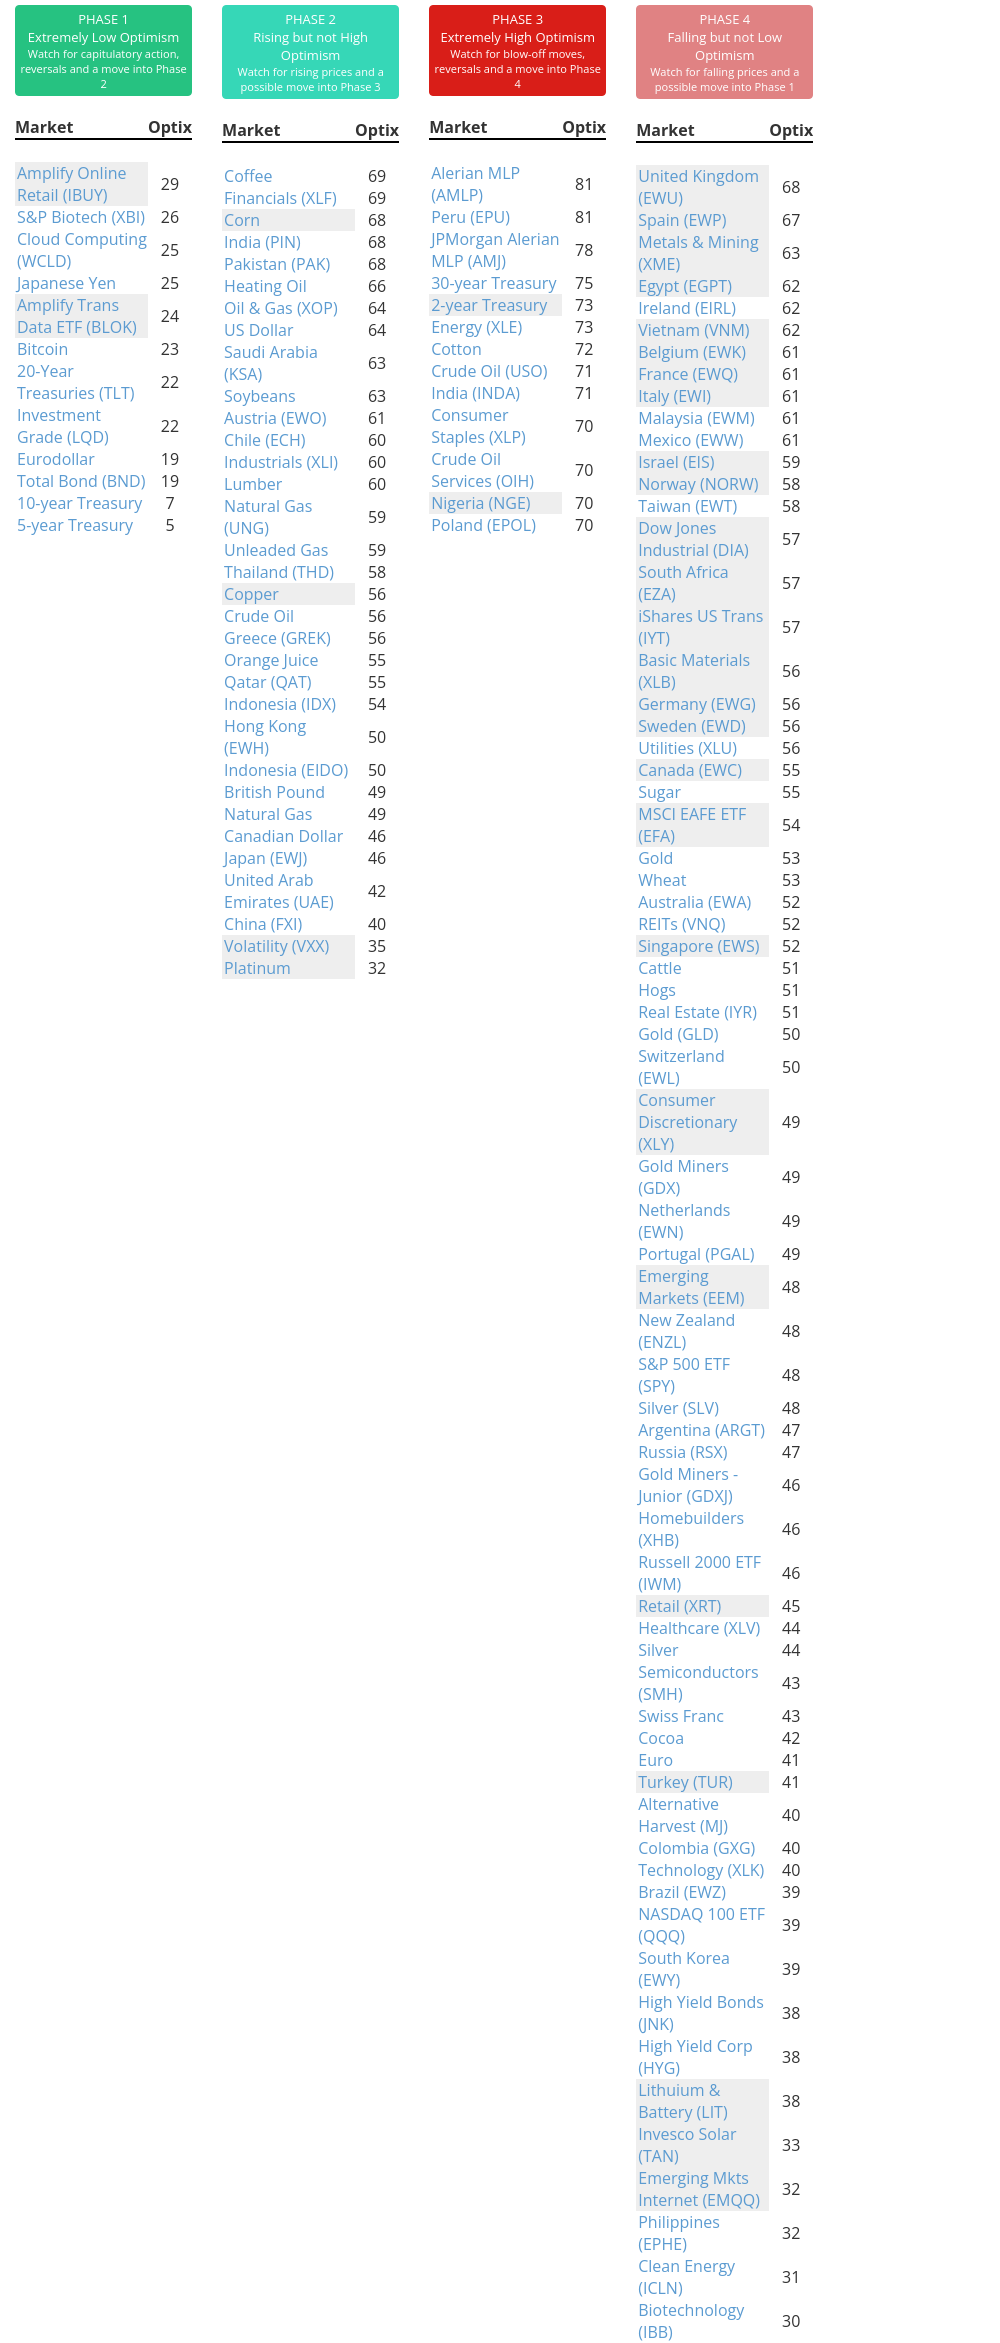
Phase Table
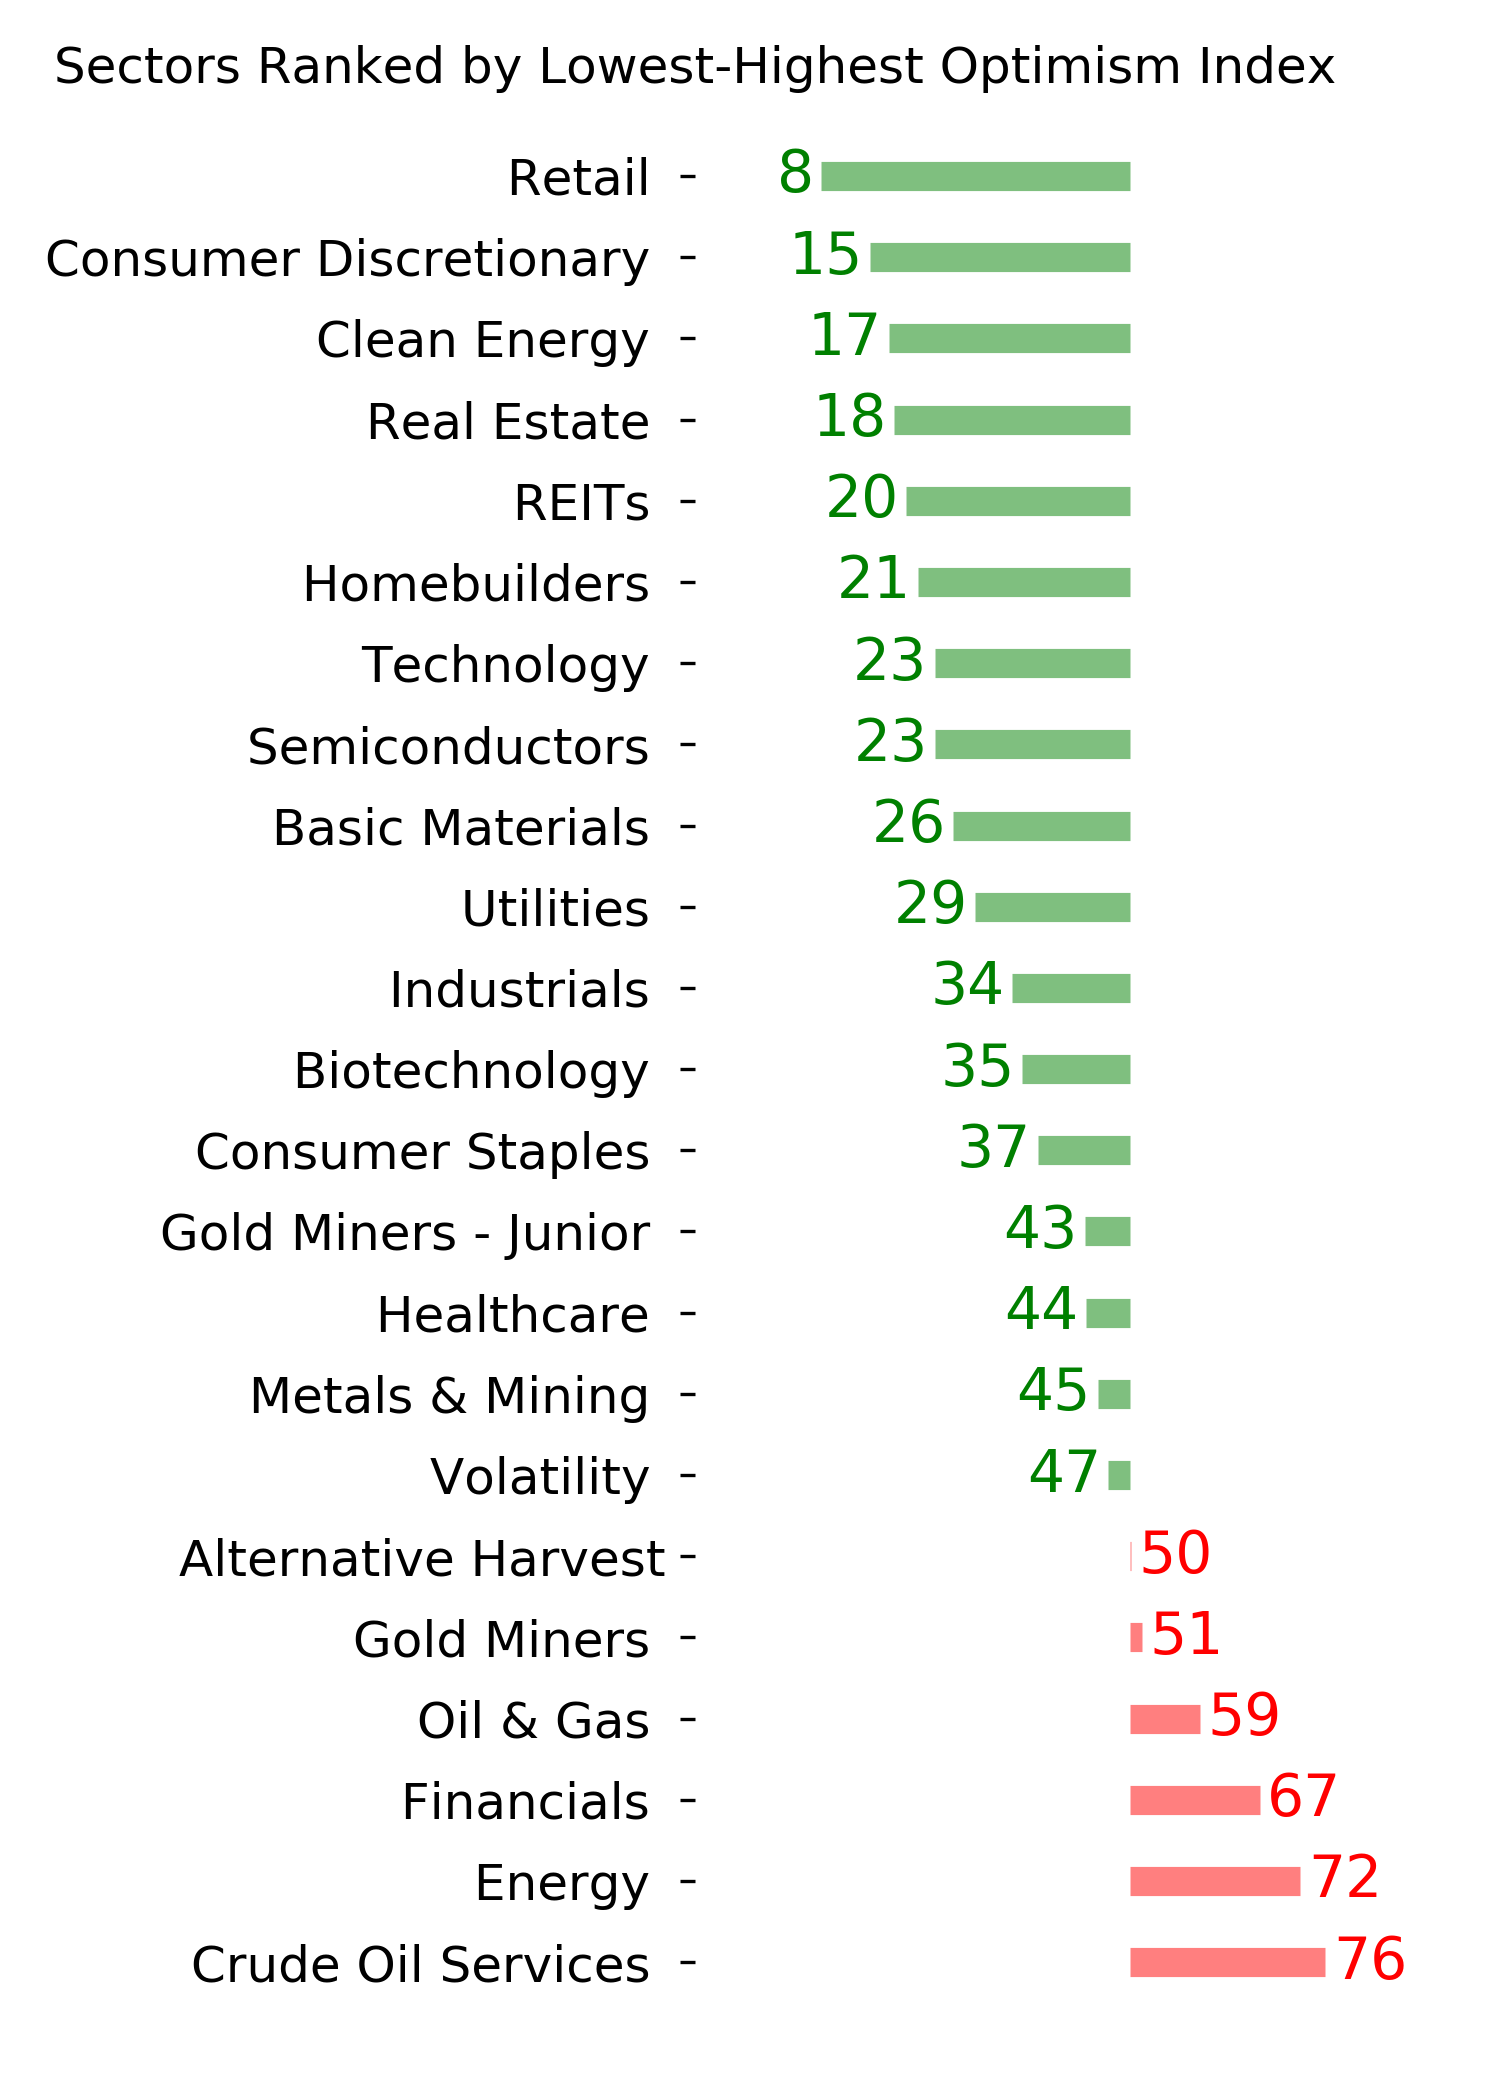
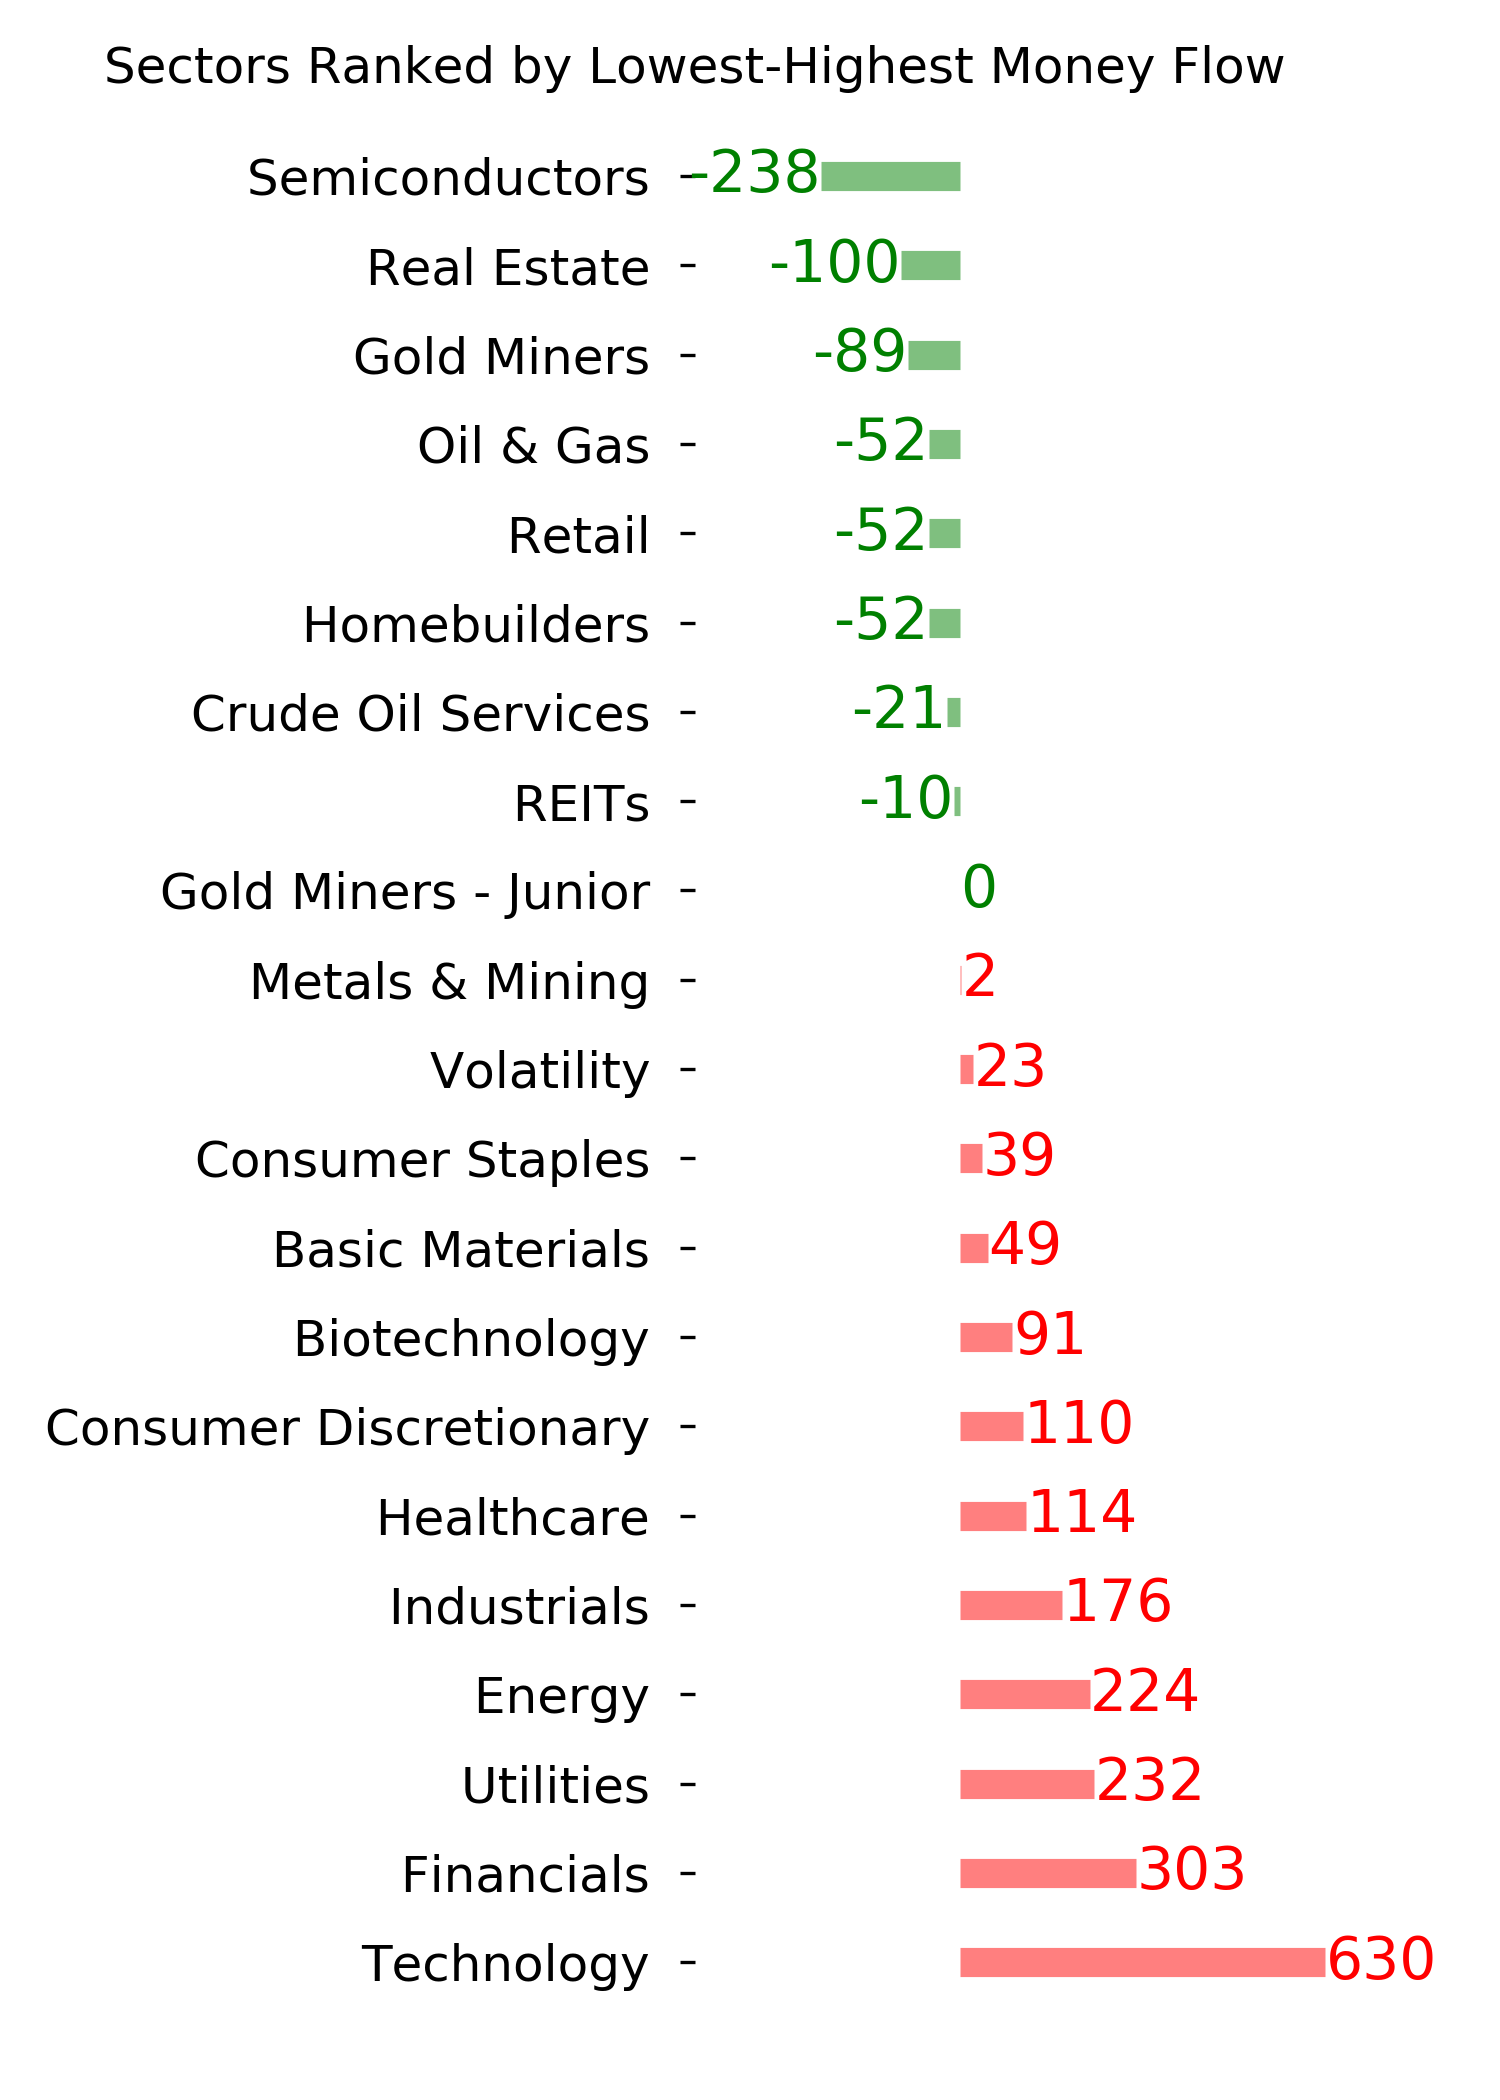
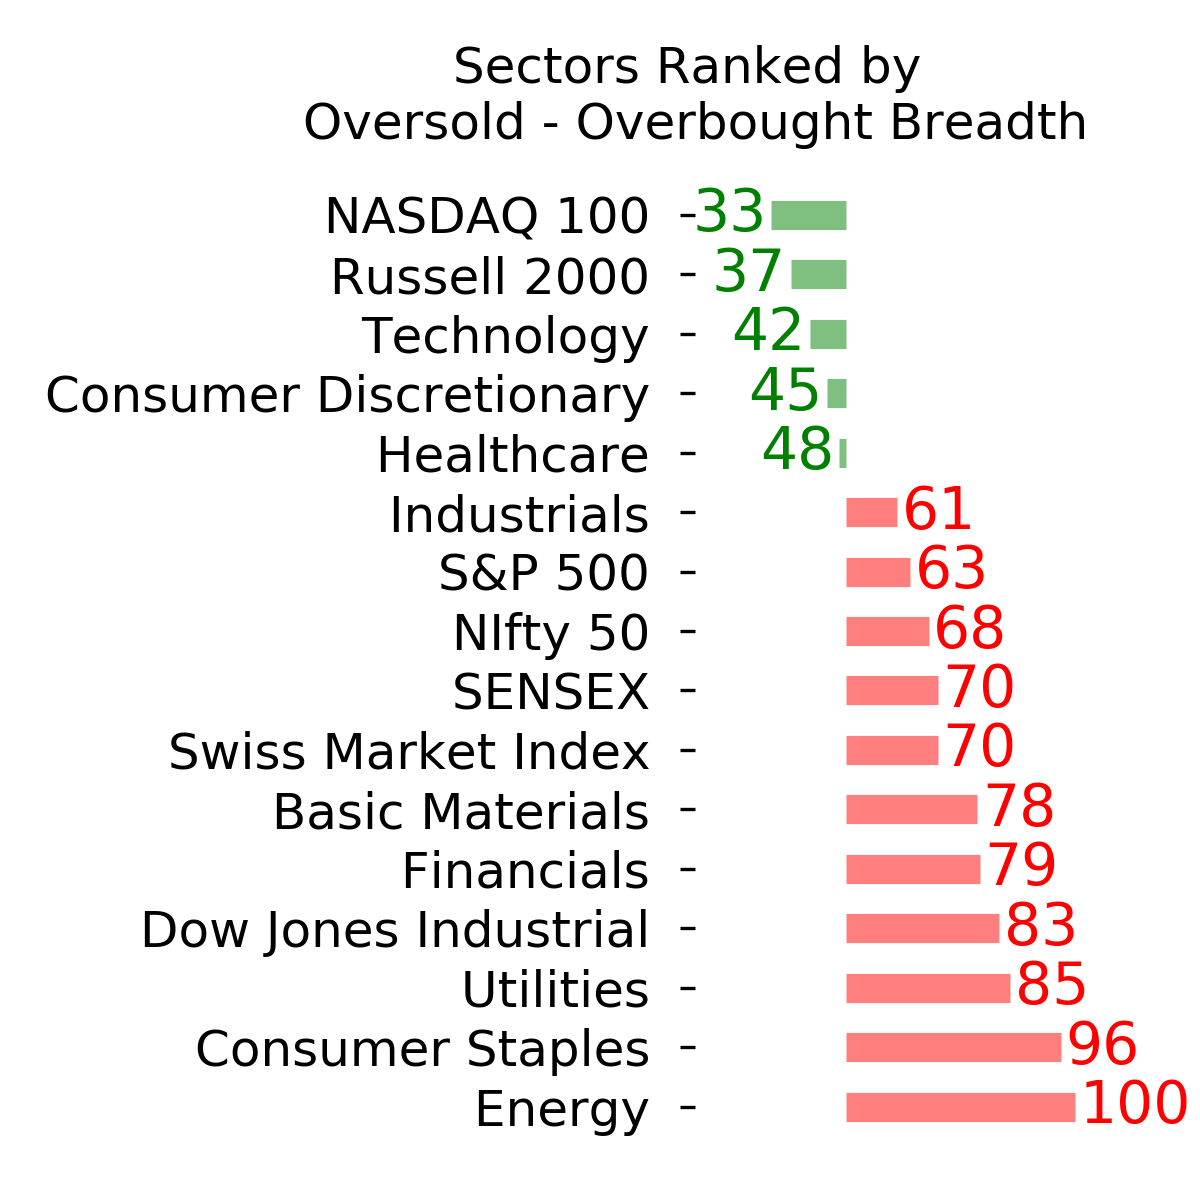
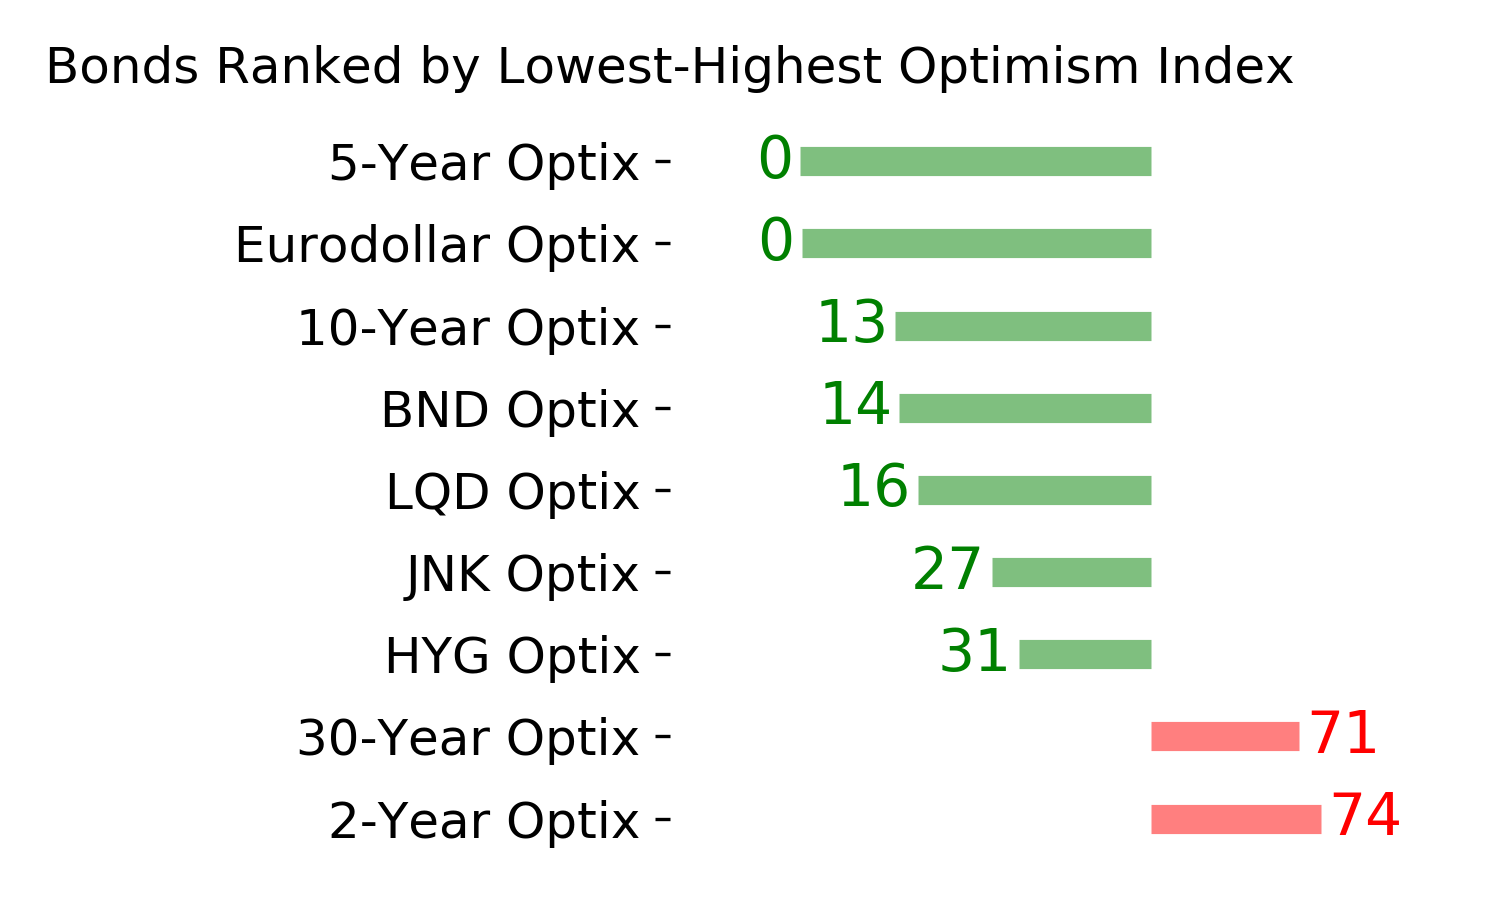
Ranks
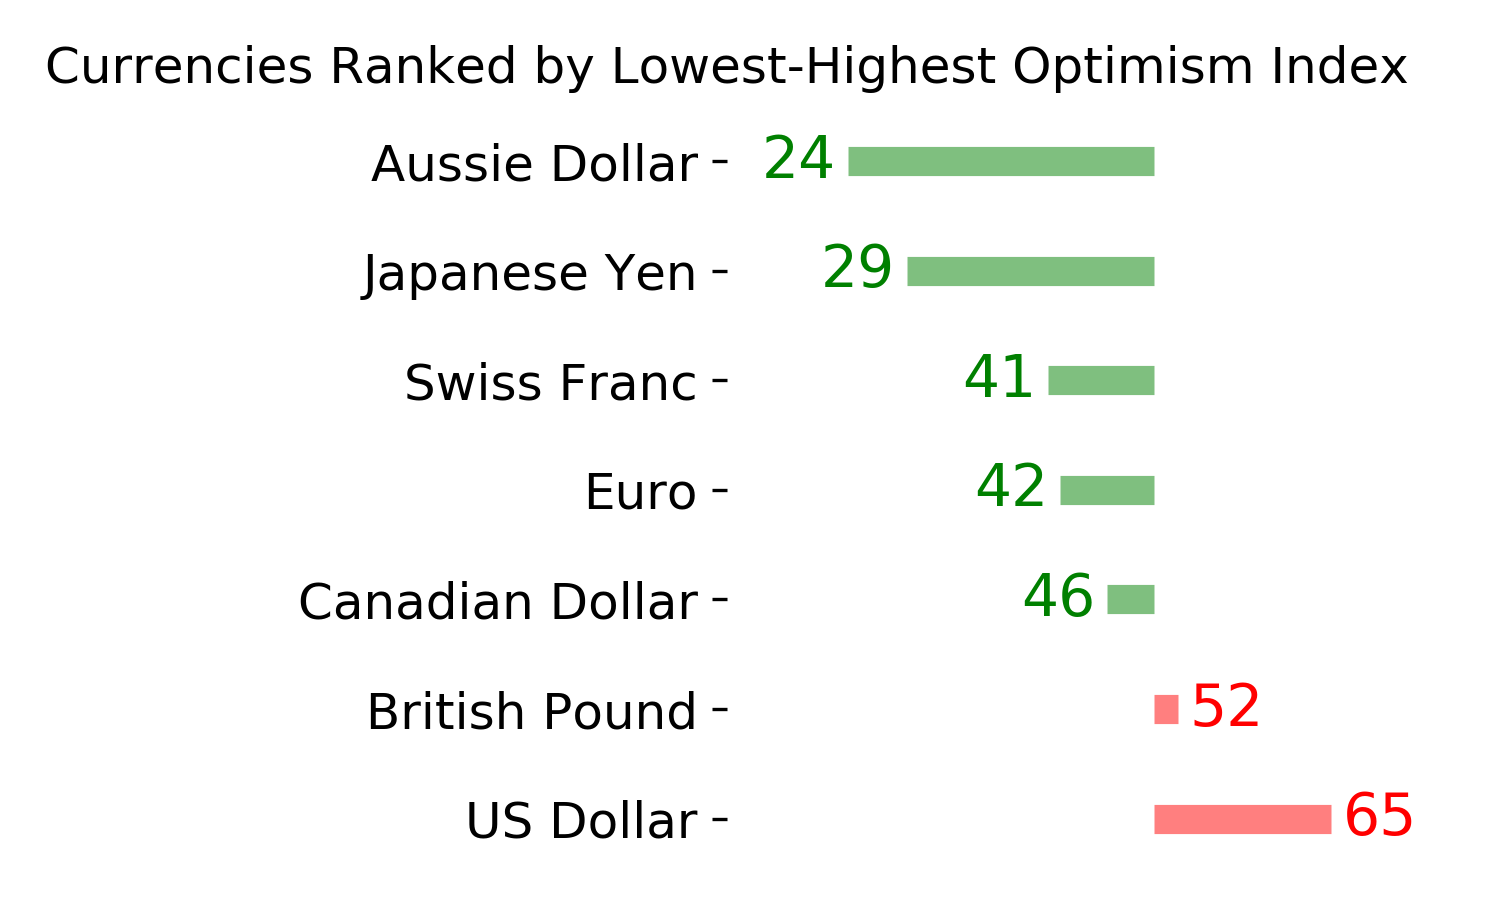
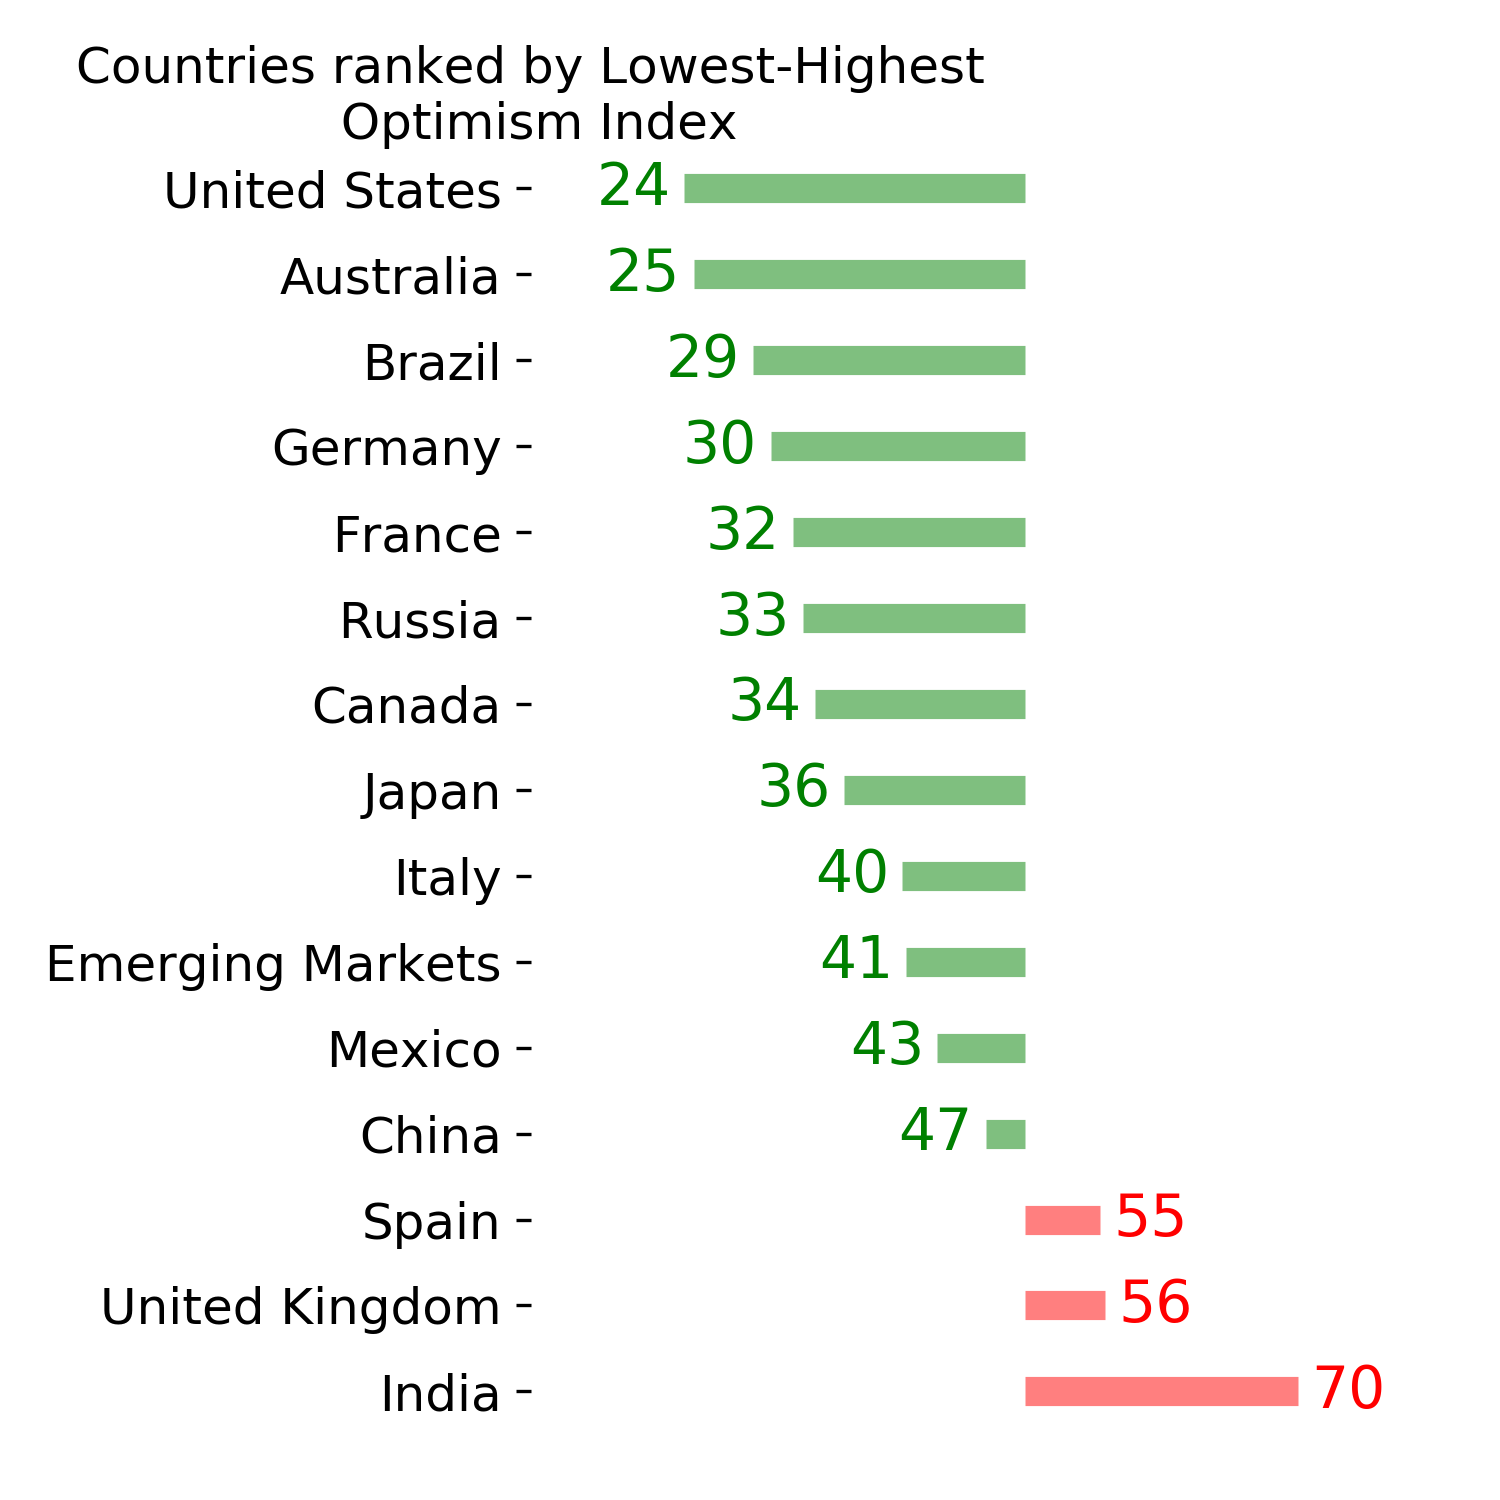
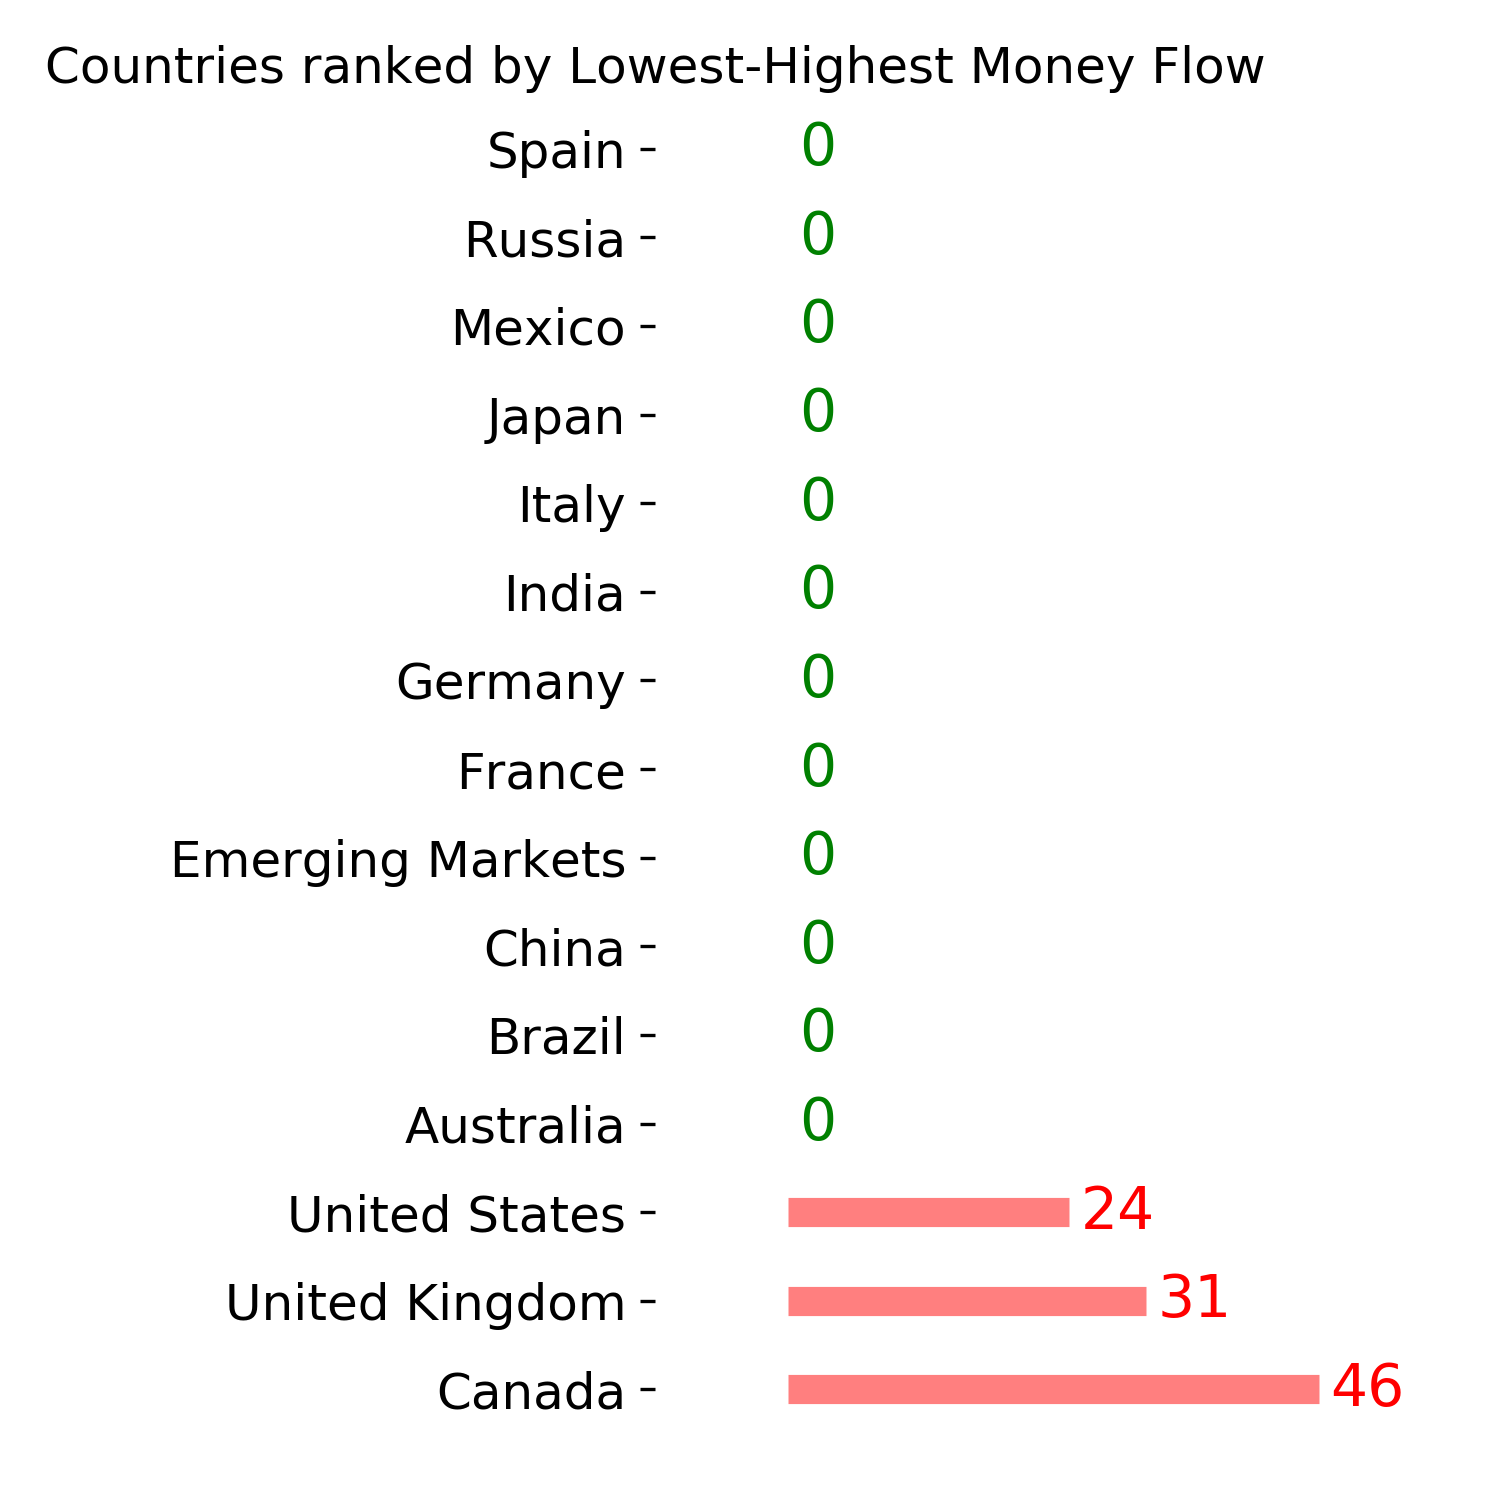
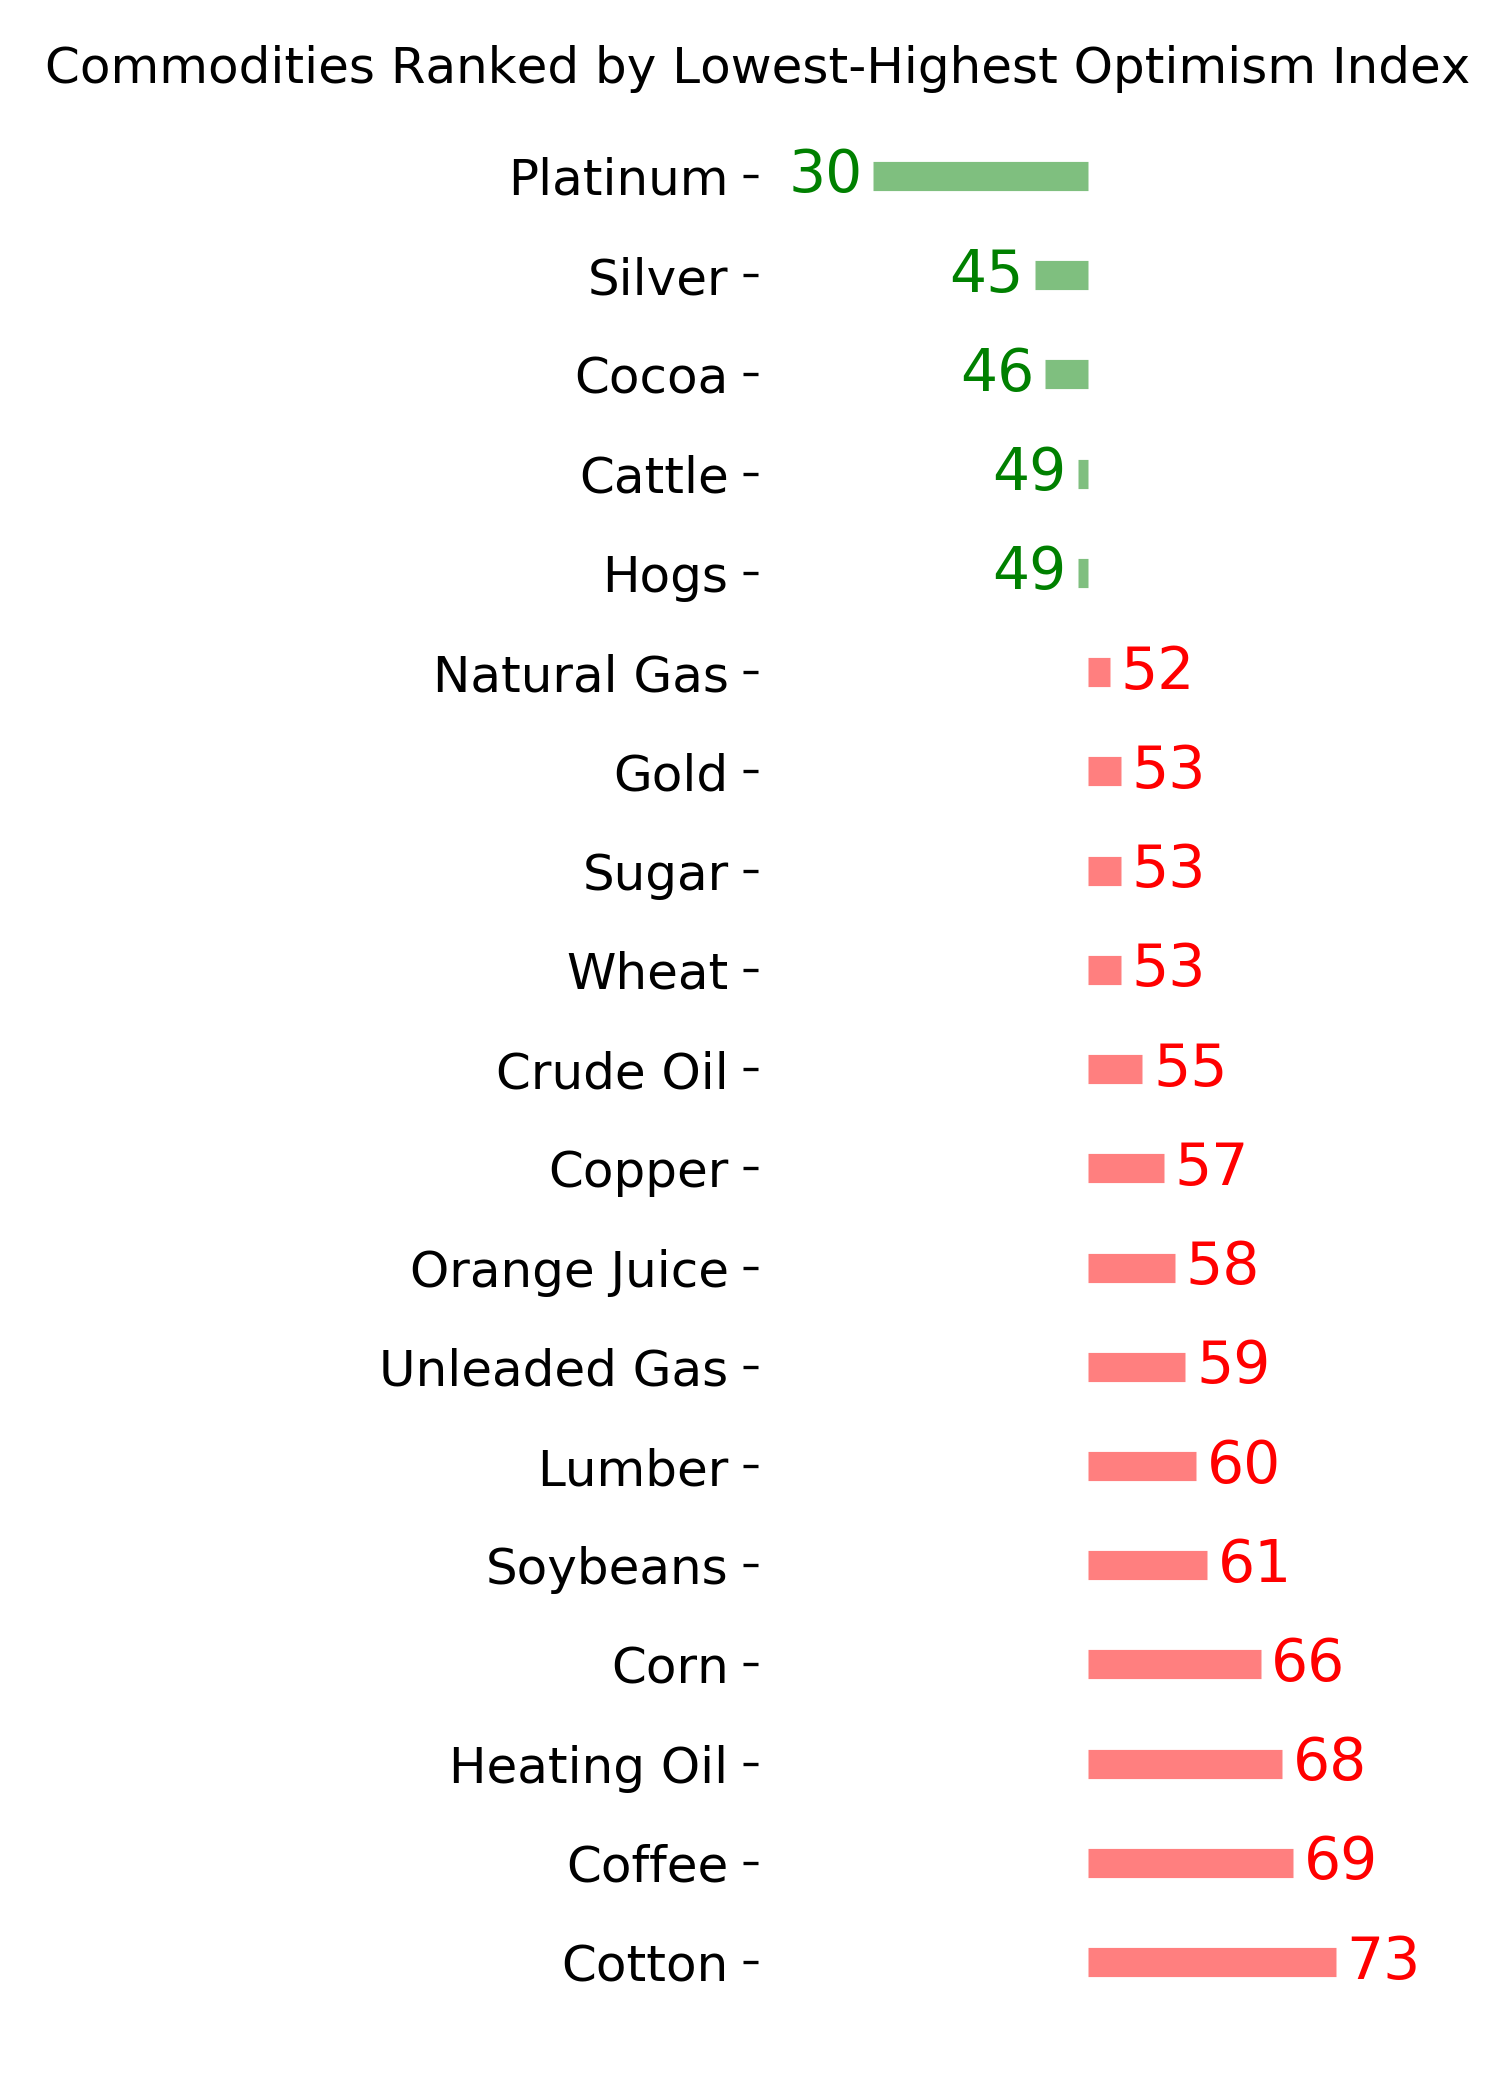
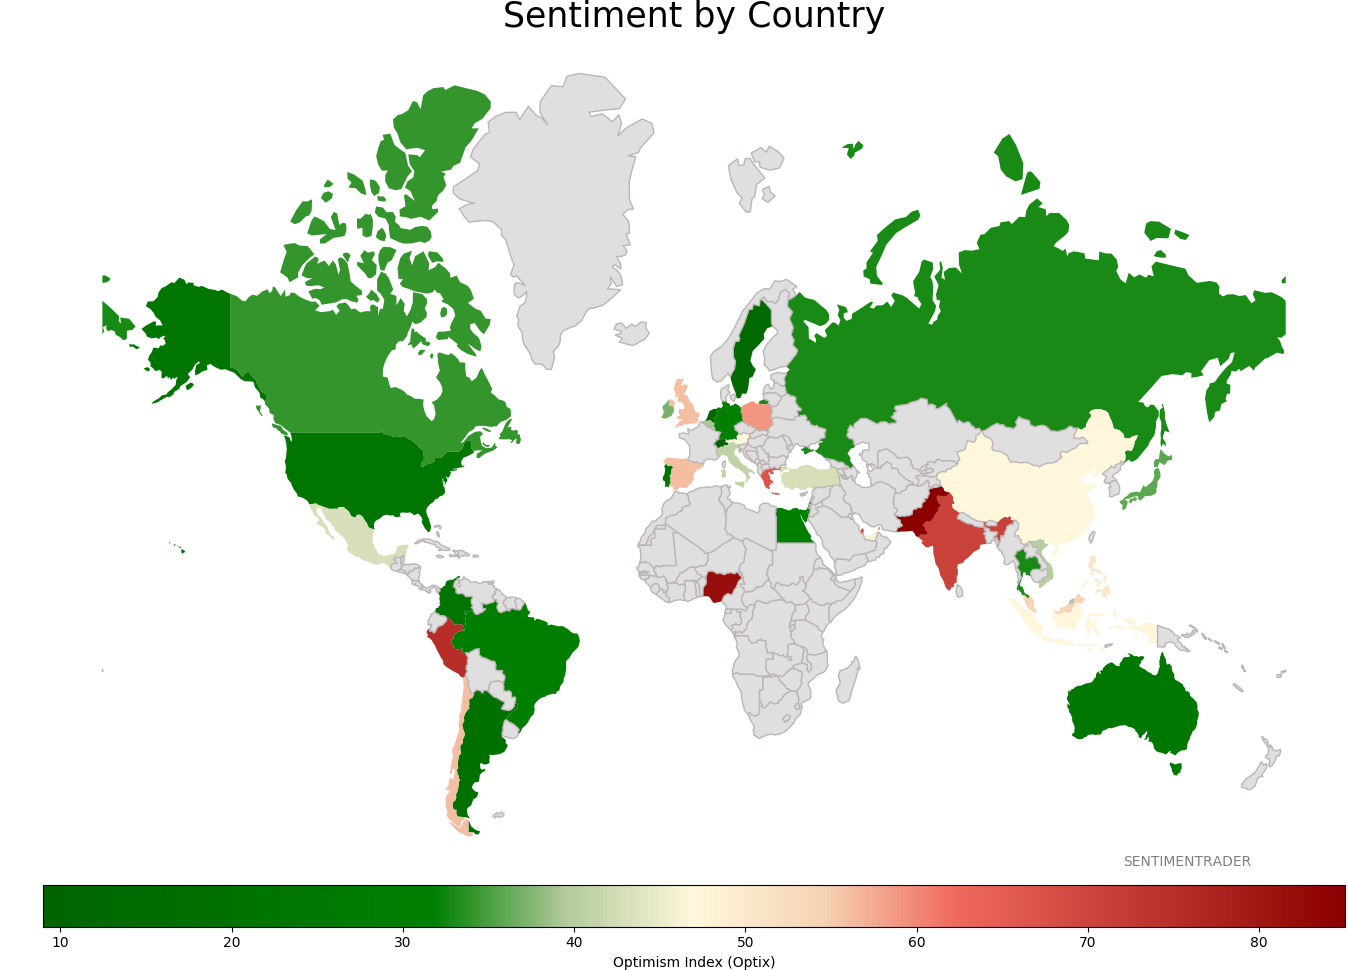
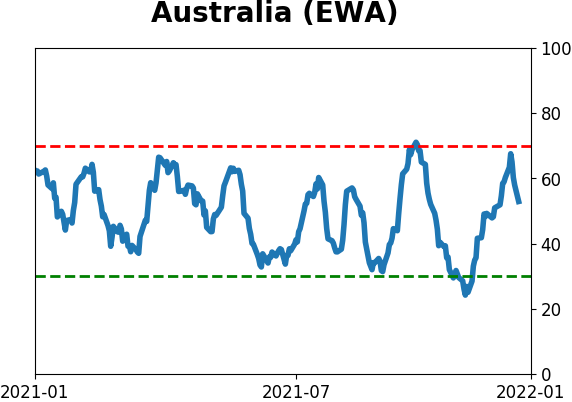
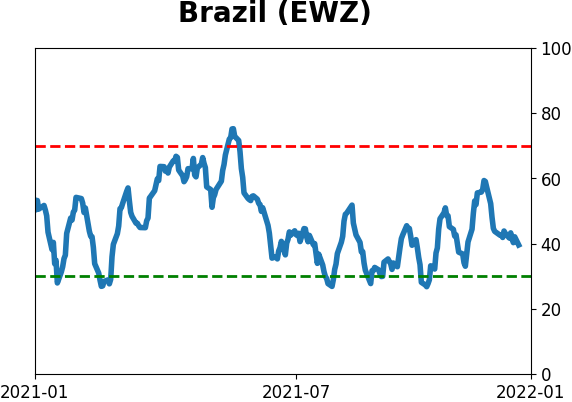
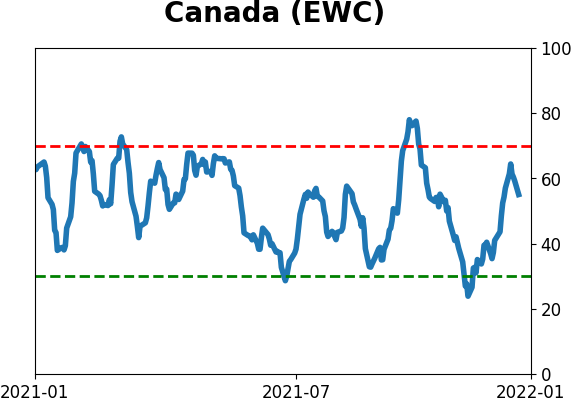
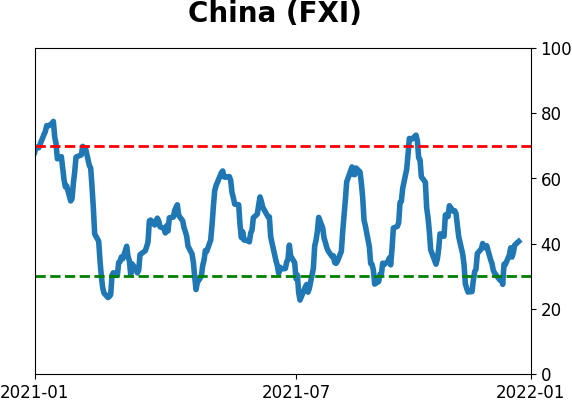
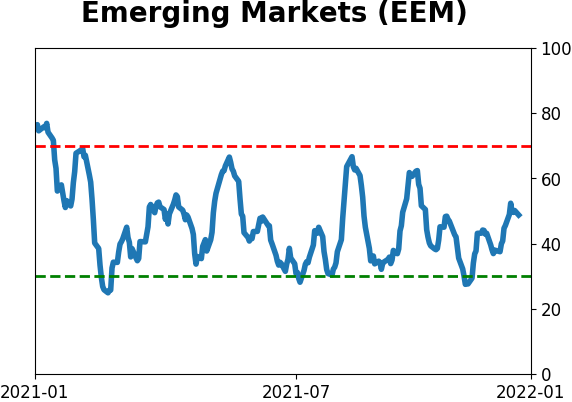
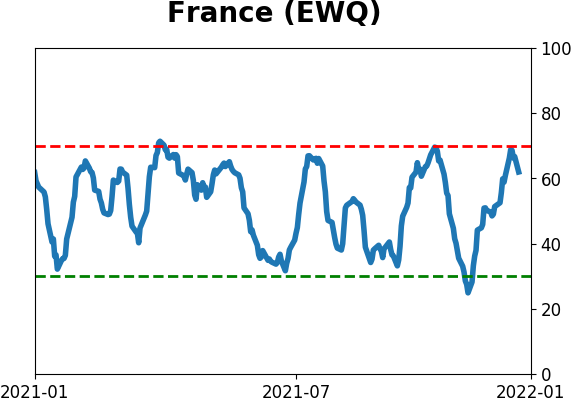
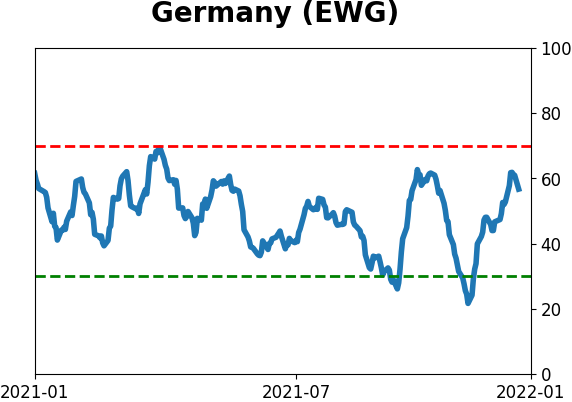
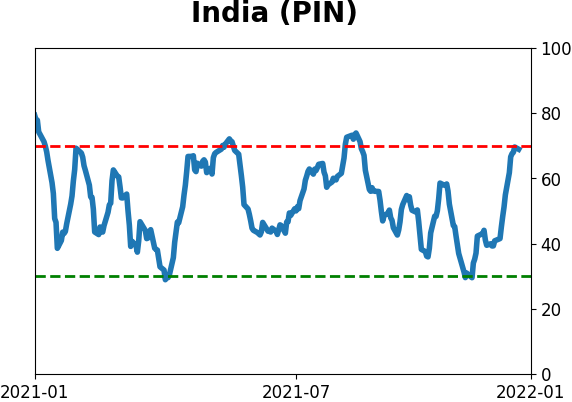
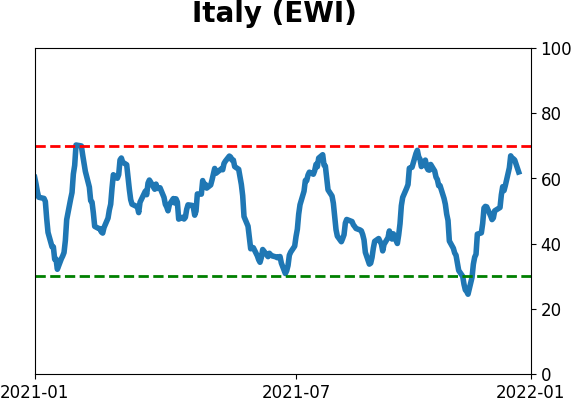
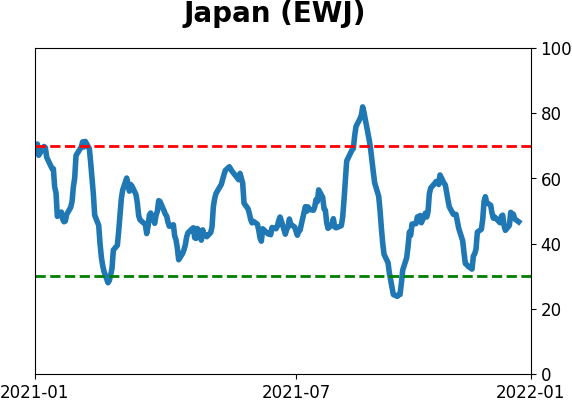
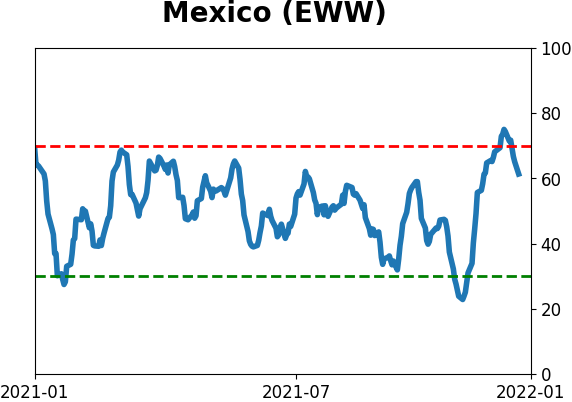
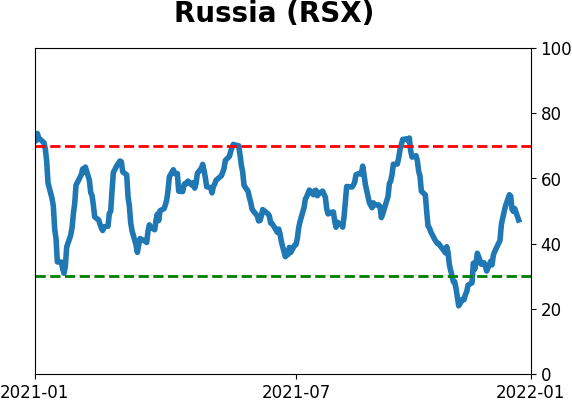
Sentiment Around The World
Optimism Index Thumbnails
|
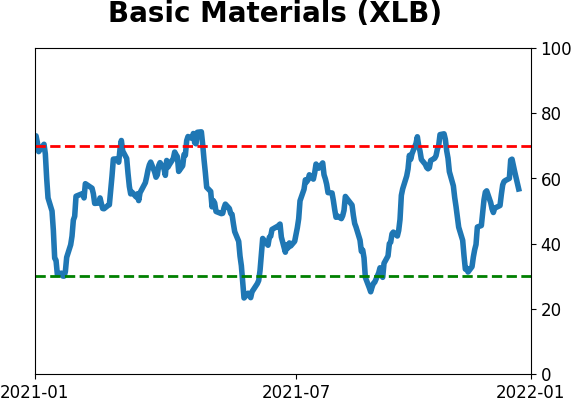
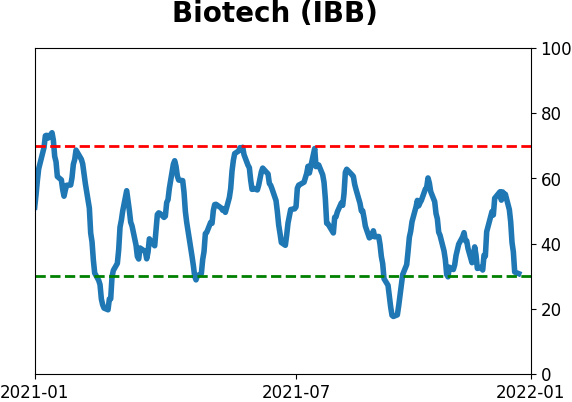
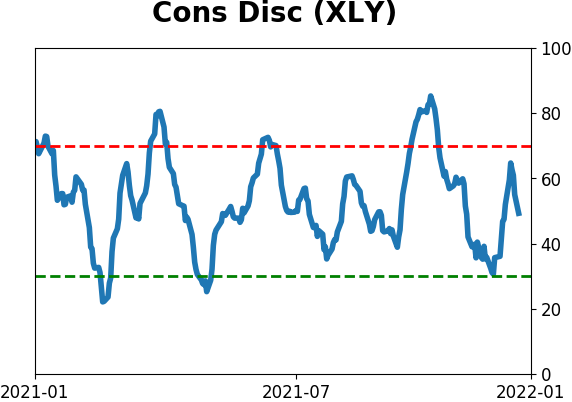
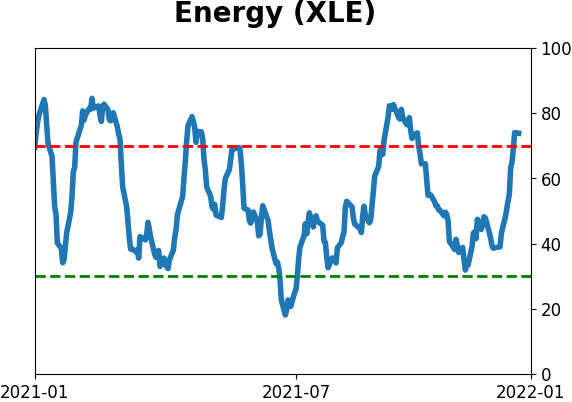
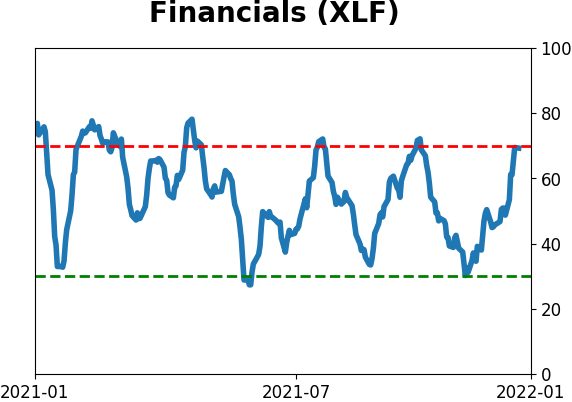
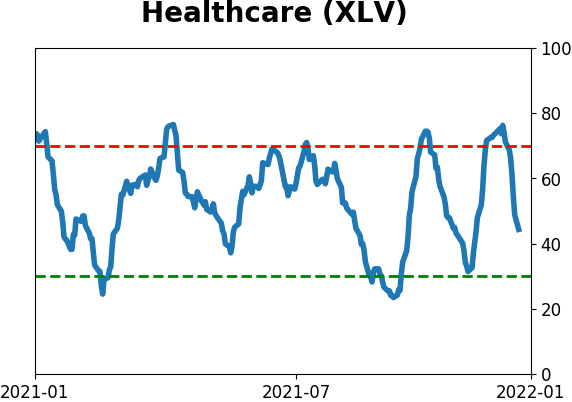
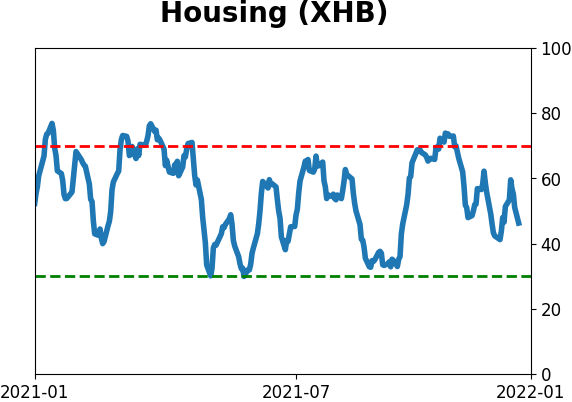
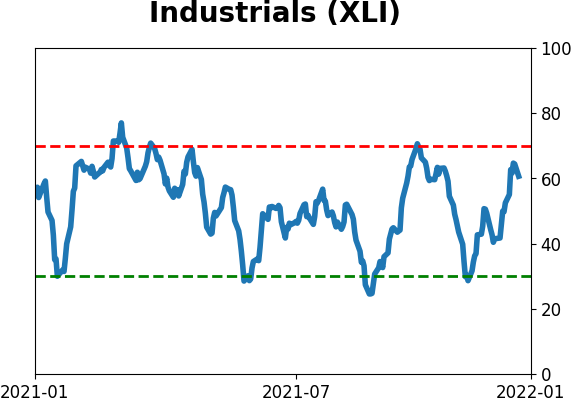
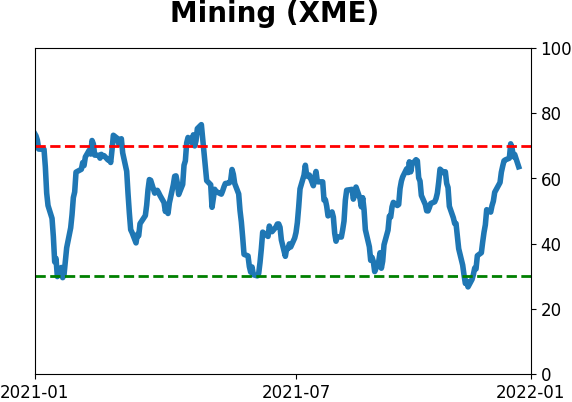
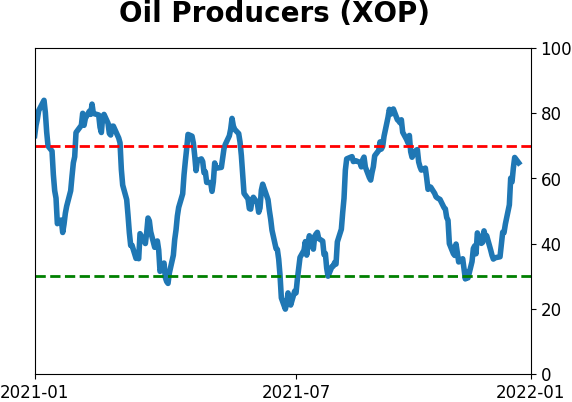
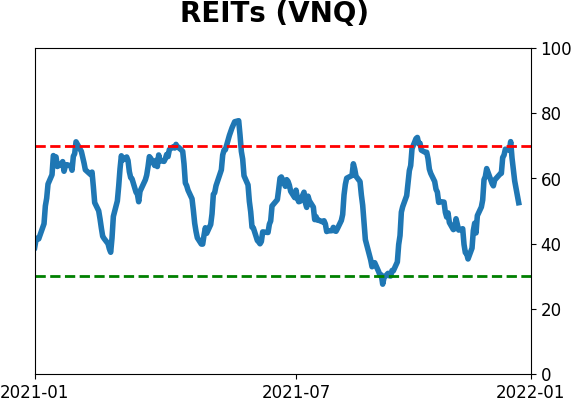
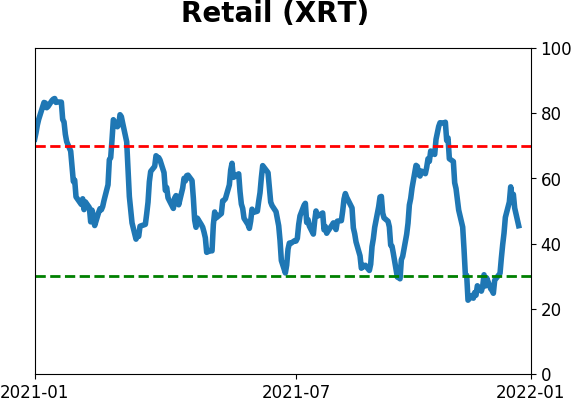
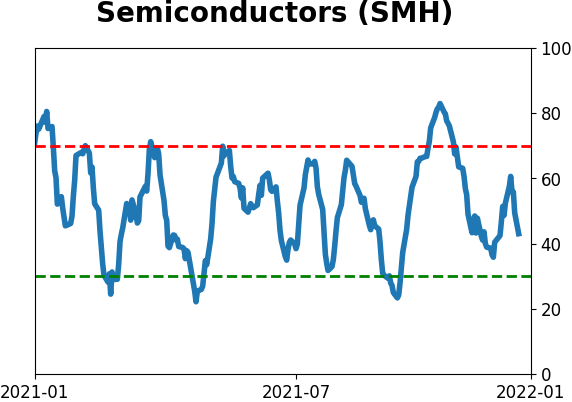
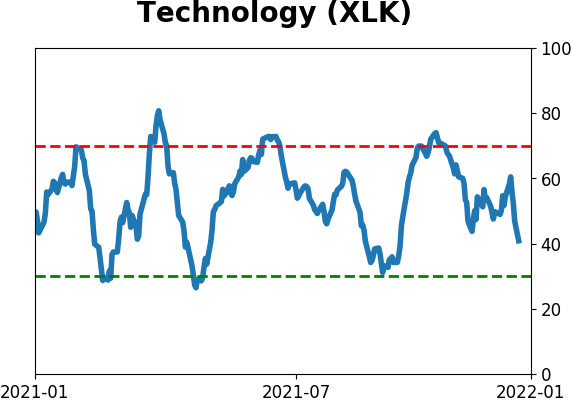
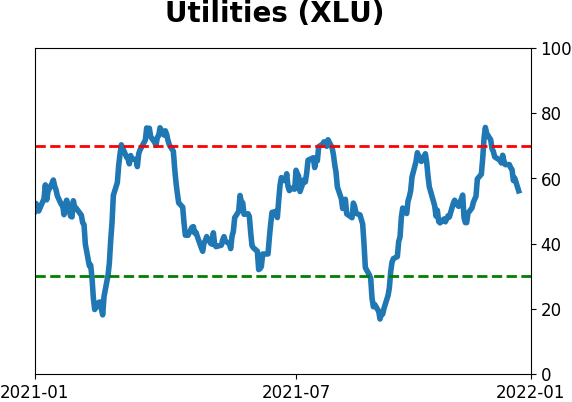
Sector ETF's - 10-Day Moving Average
|
|
|
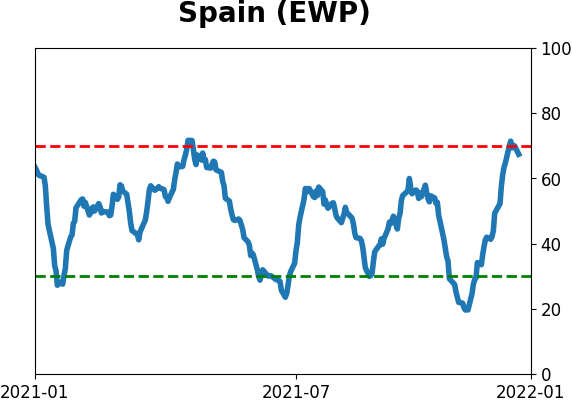
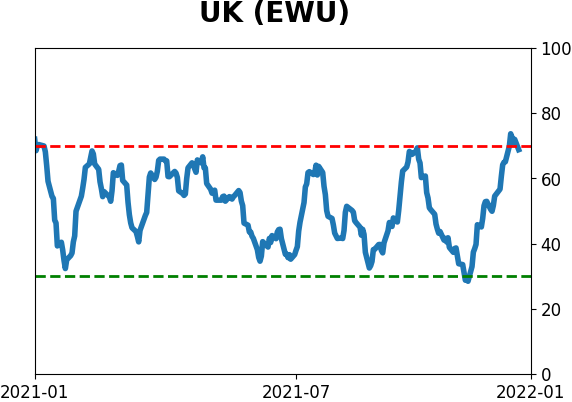
Country ETF's - 10-Day Moving Average
|
|
|
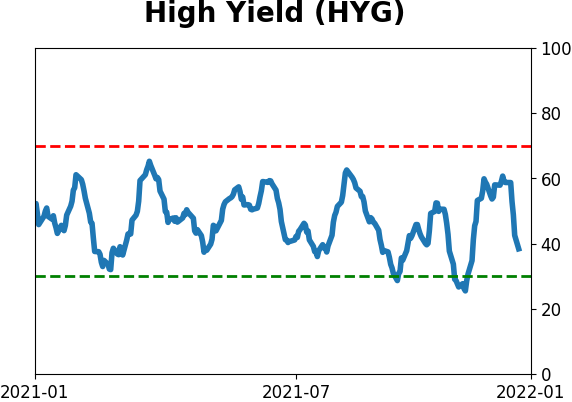
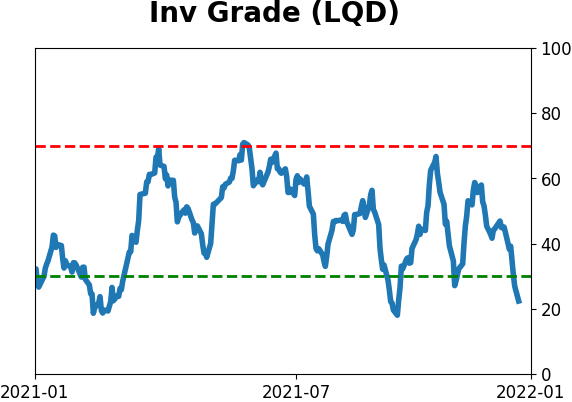
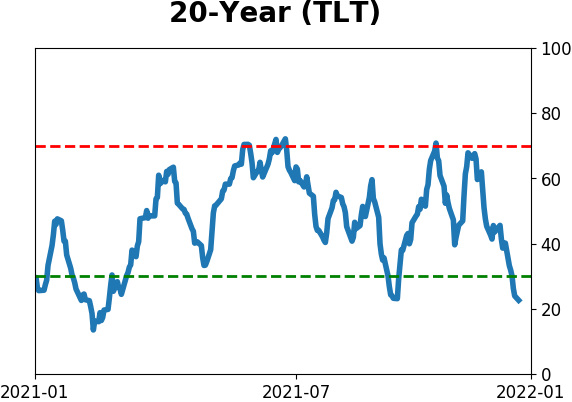
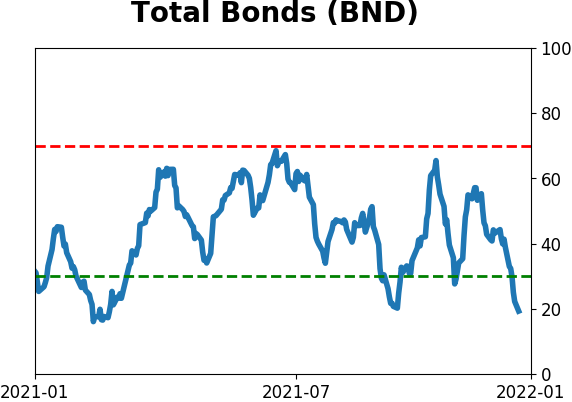
Bond ETF's - 10-Day Moving Average
|
|
|
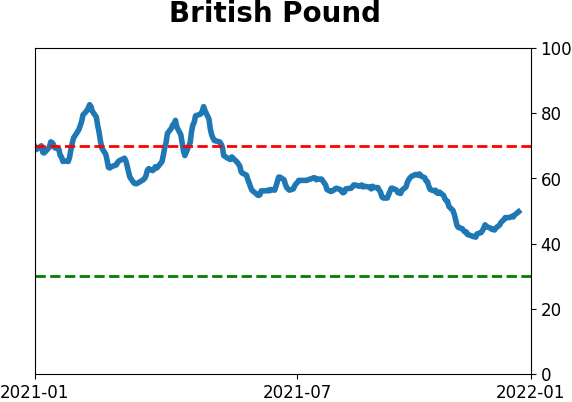
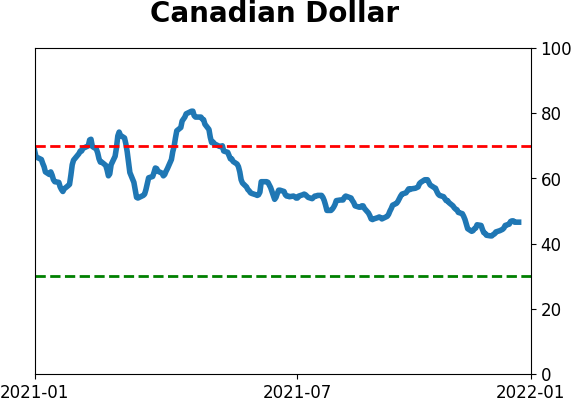
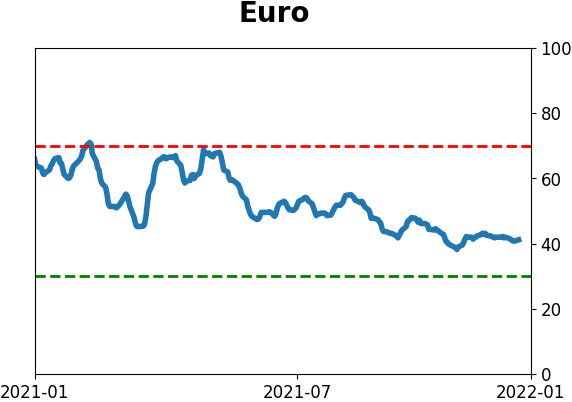
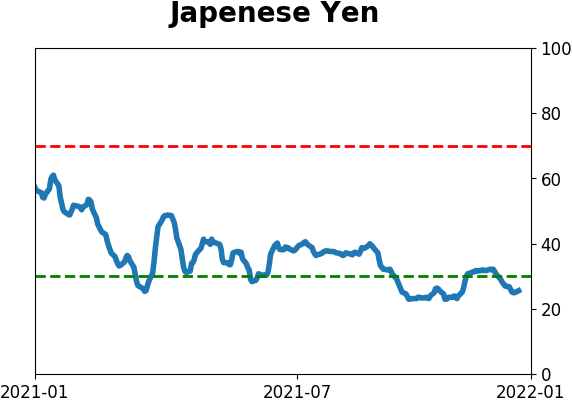
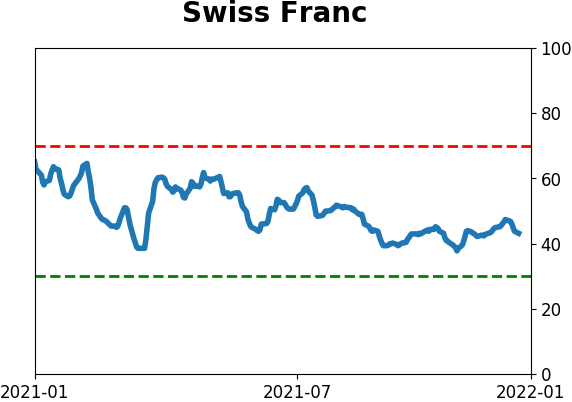
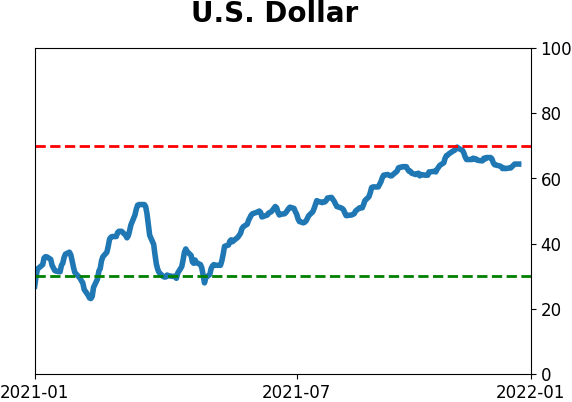
Currency ETF's - 5-Day Moving Average
|
|
|
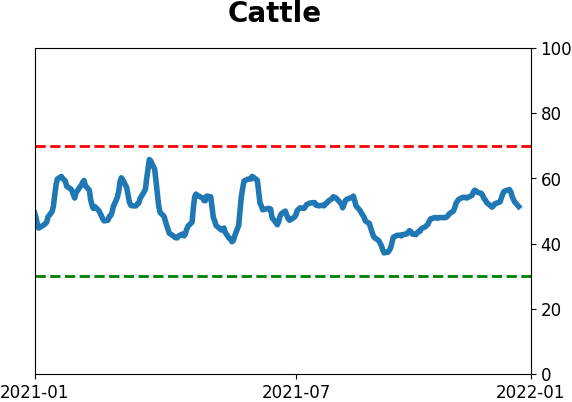
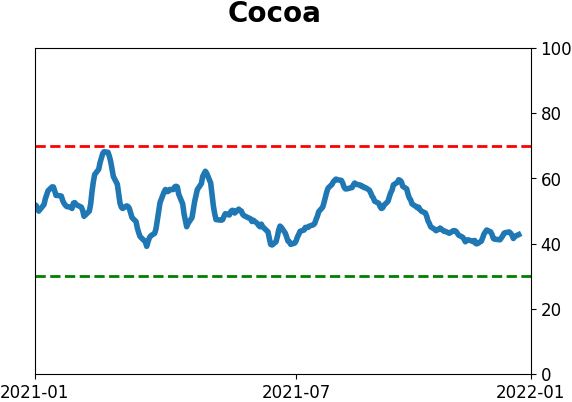
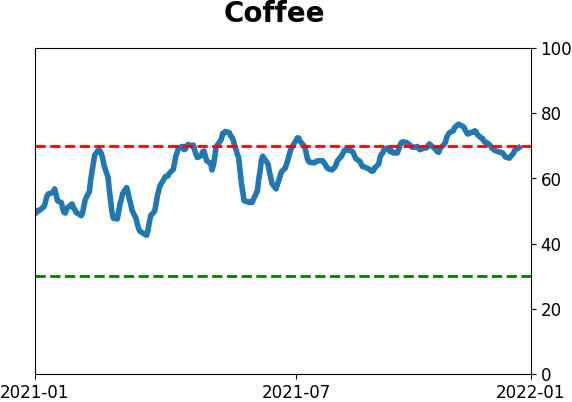
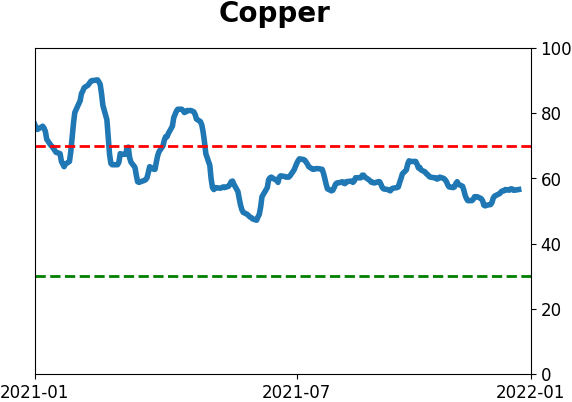
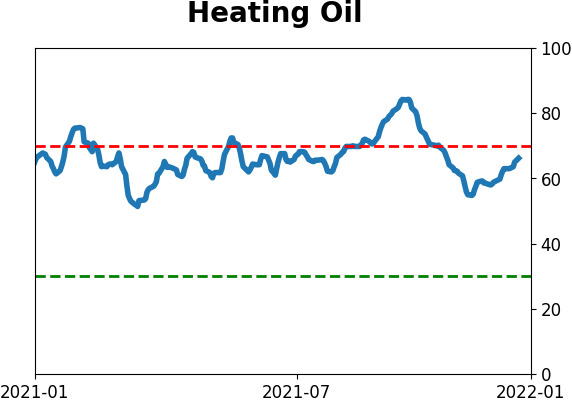
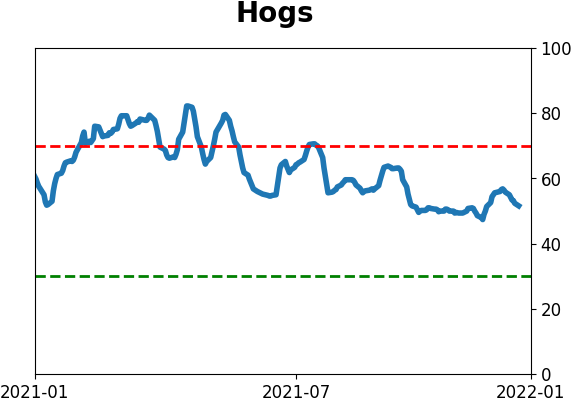
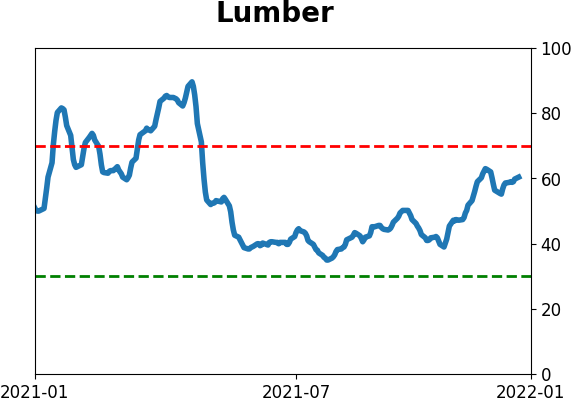
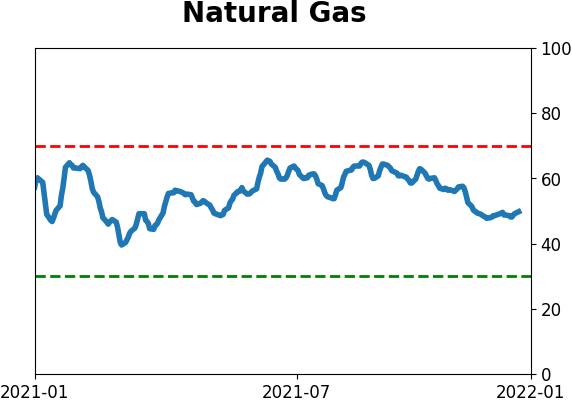
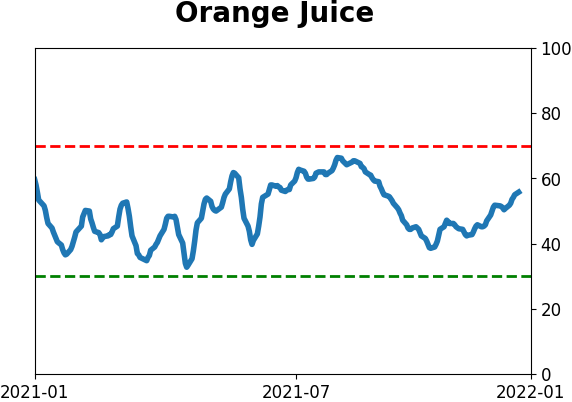
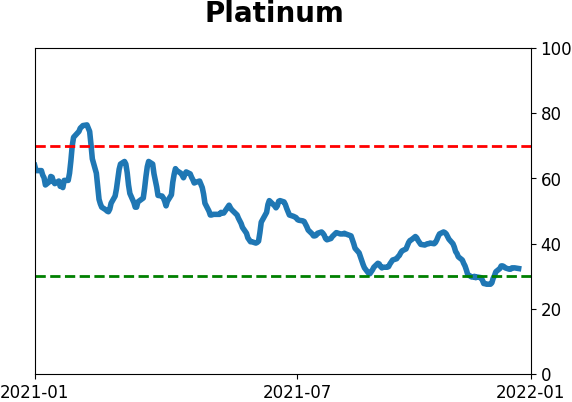
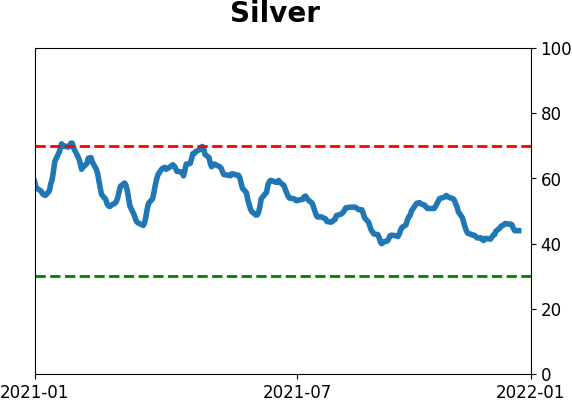
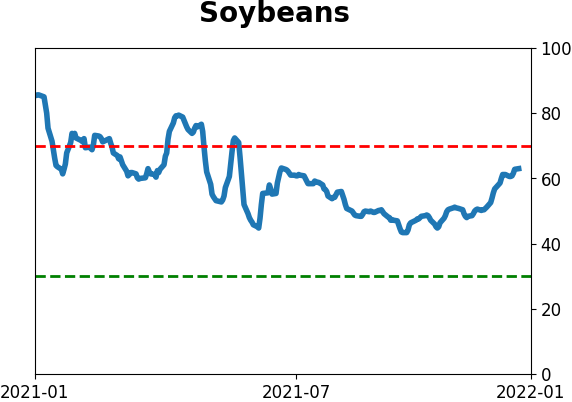
Commodity ETF's - 5-Day Moving Average
|
|