Headlines
|
|
A very quick dip out of historically extreme optimism:
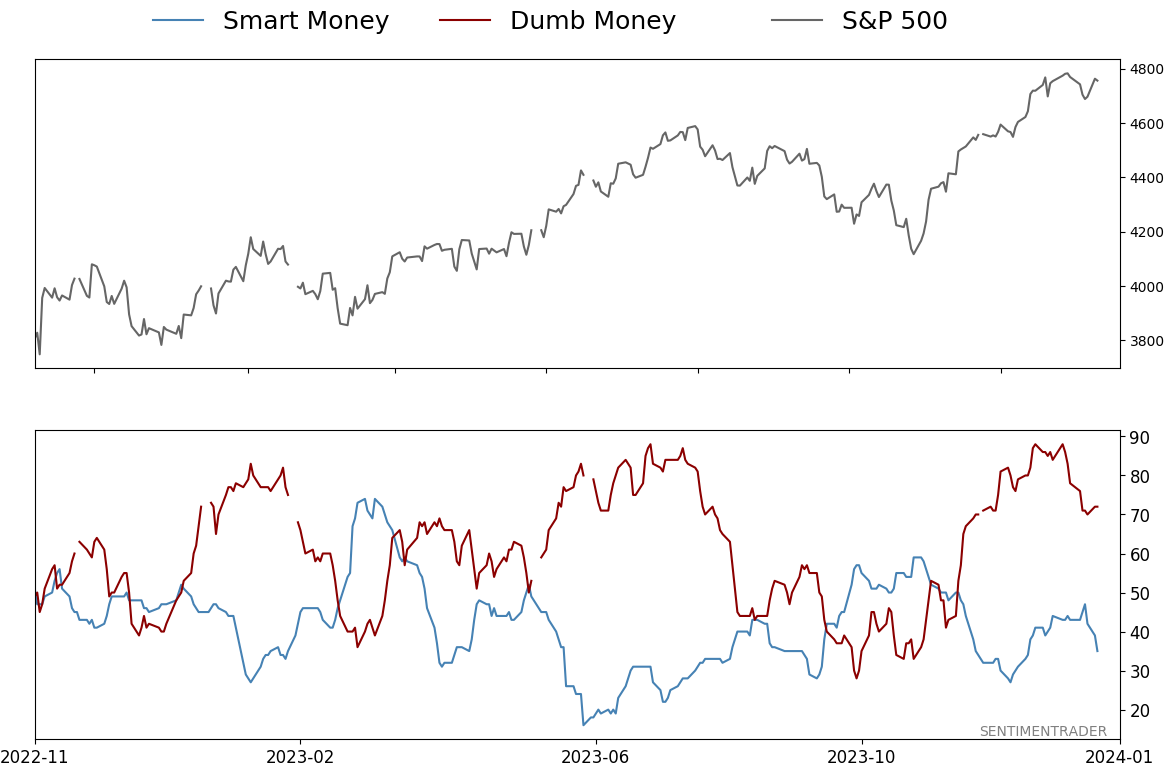
Dumb Money Confidence reached nearly 90% in December, one of the highest levels since we began the model in 1998. It has shifted quickly, back down to 70%, in only a week. Other times when Confidence cycled so quickly, the S&P 500 struggled in the short term but rarely suffered any large losses.
|
Smart / Dumb Money Confidence
|
Smart Money Confidence: 35%
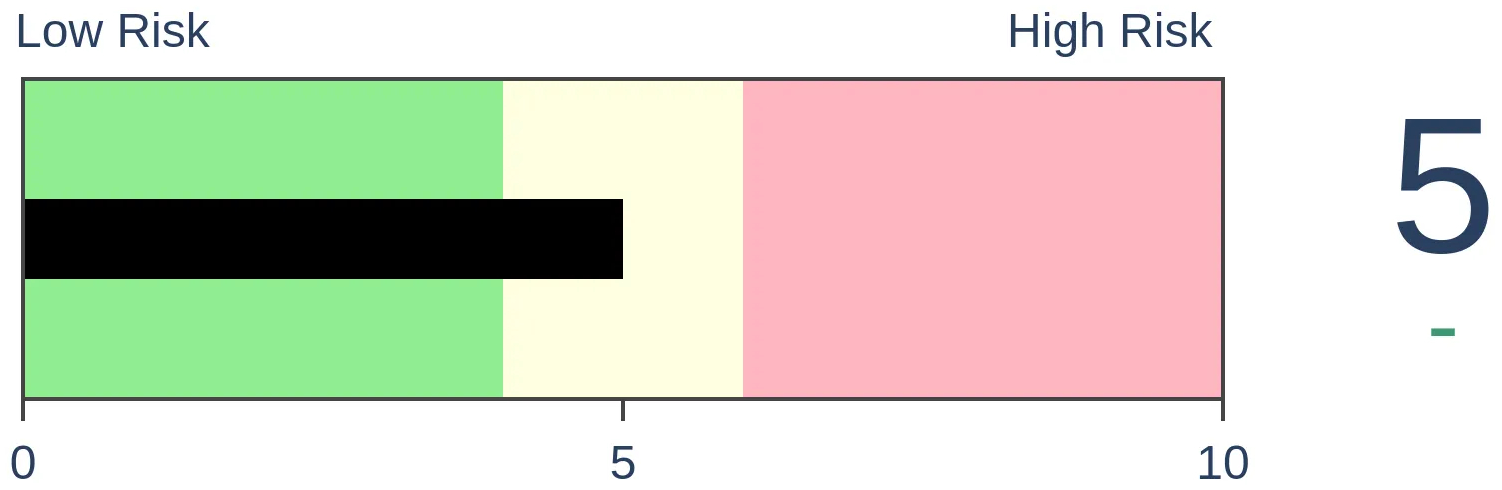
Dumb Money Confidence: 72%
|
|
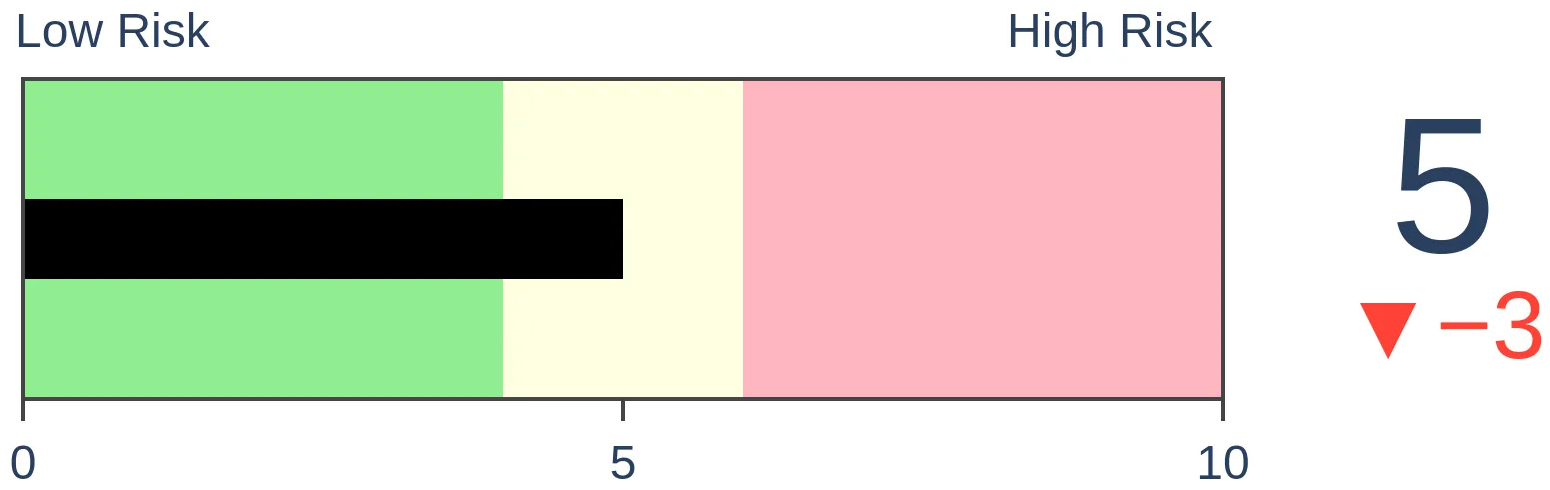
Risk Levels
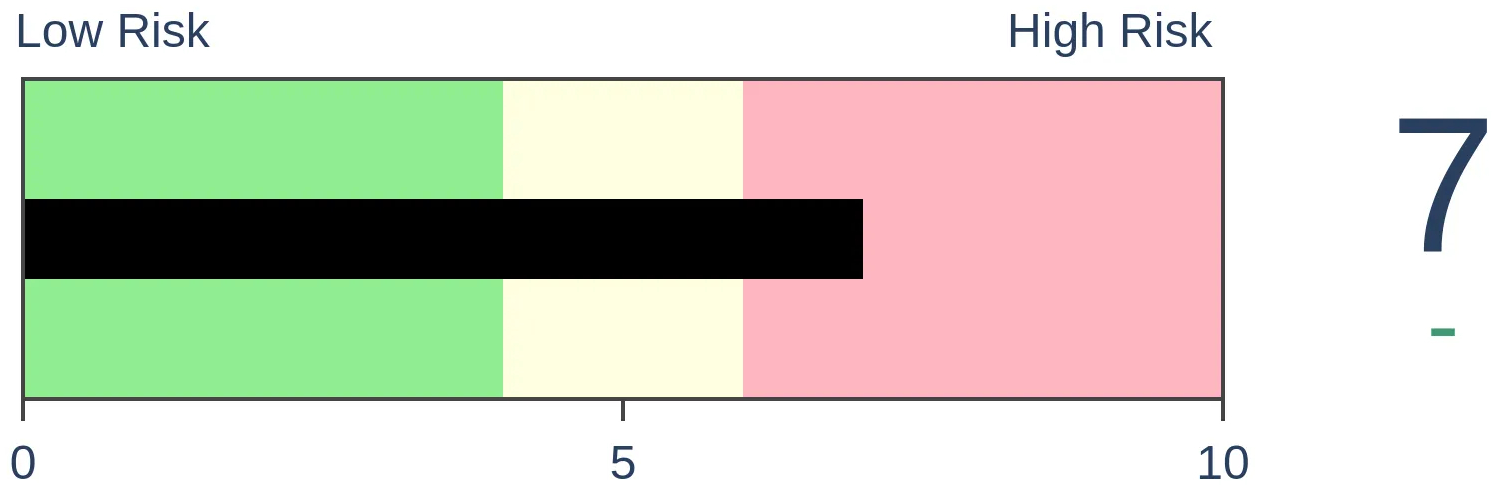
Stocks Short-Term
|
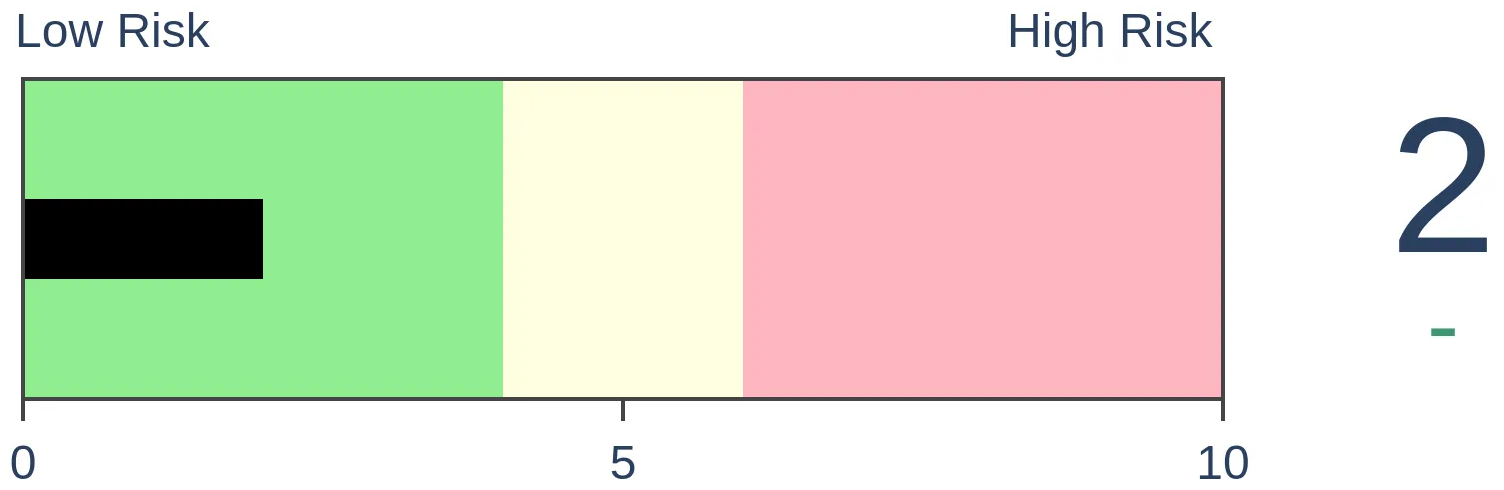
Stocks Medium-Term
|
|
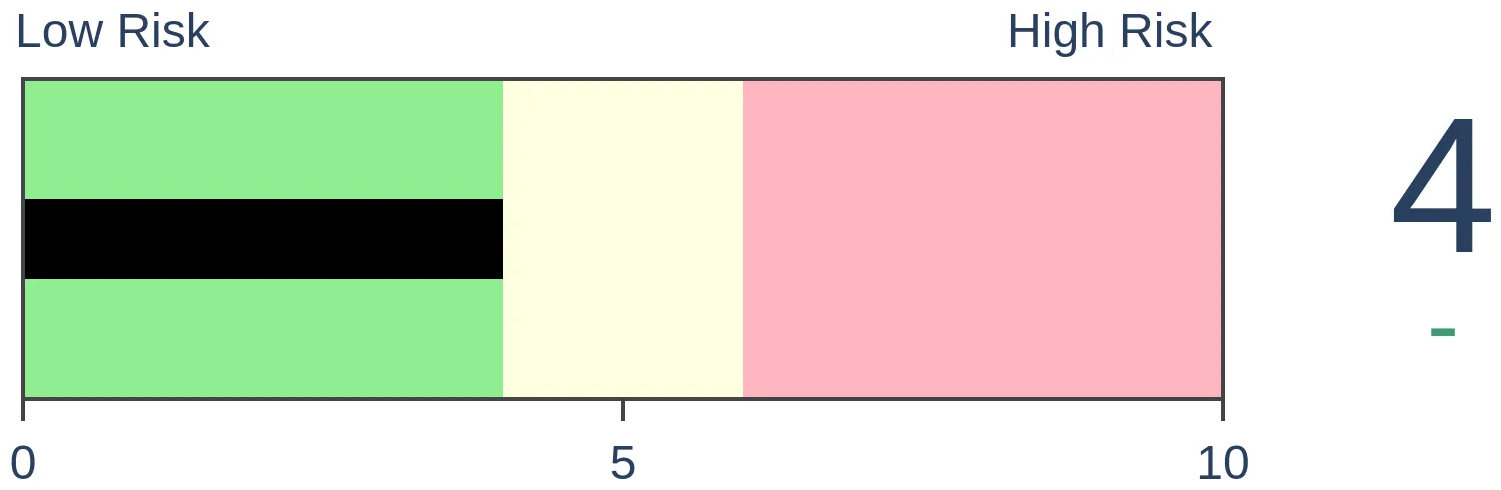
Bonds
|
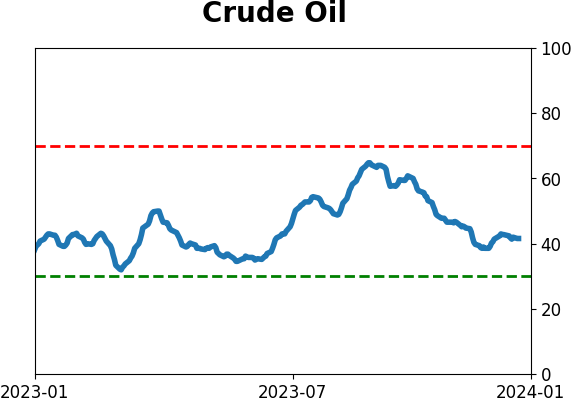
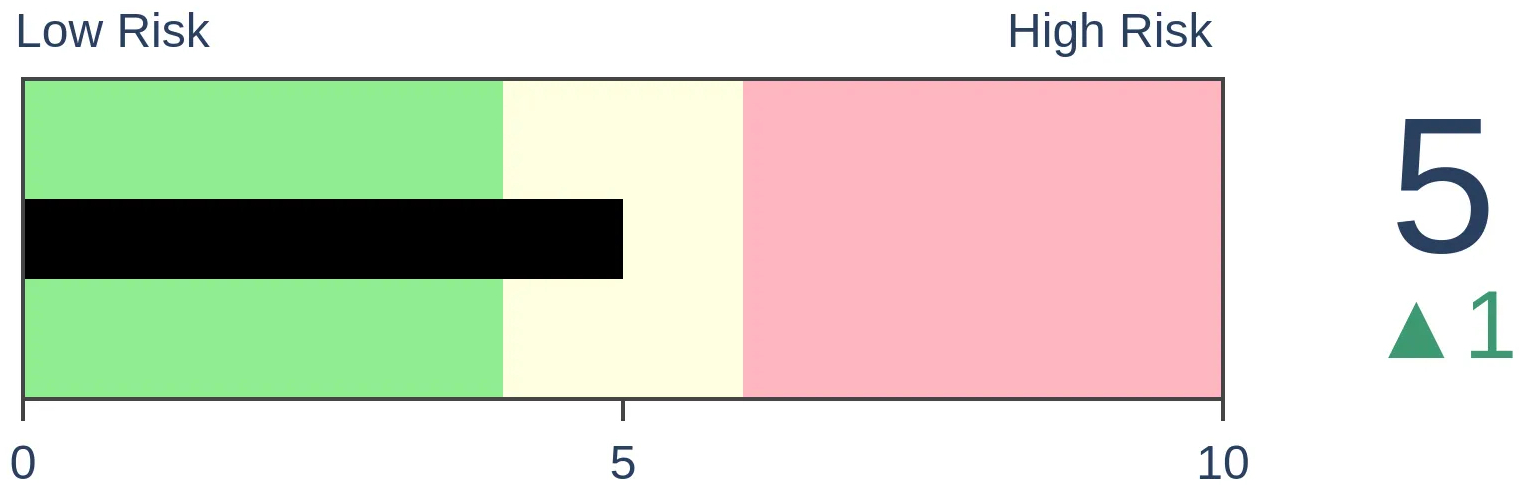
Crude Oil
|
|
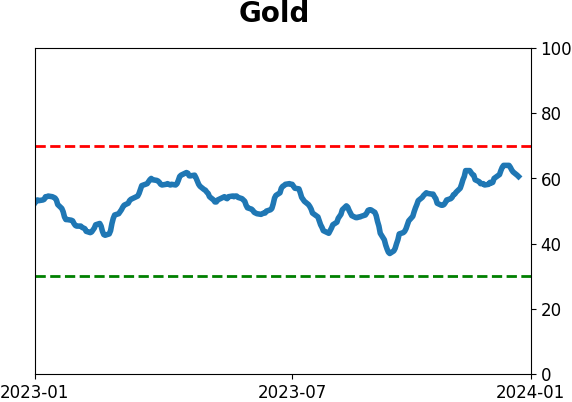
Gold
|
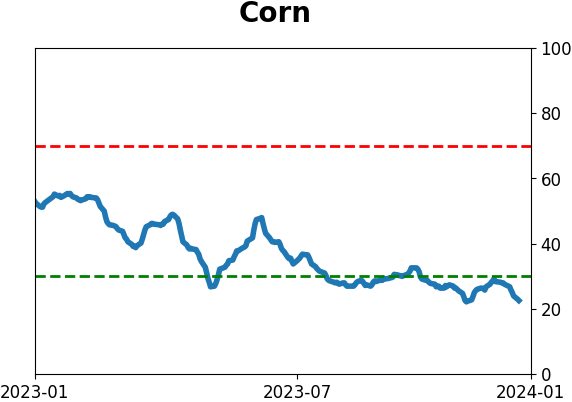
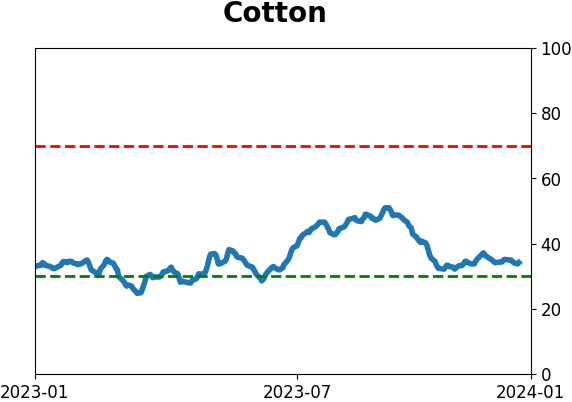
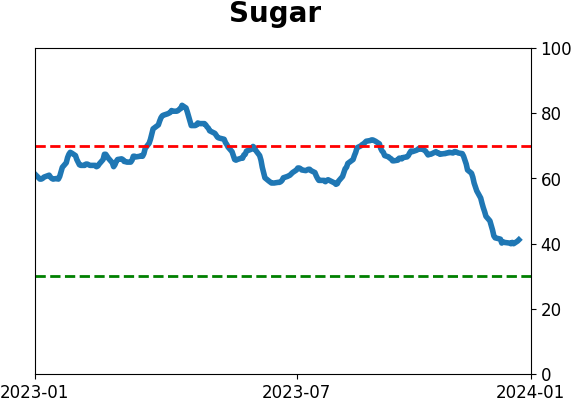
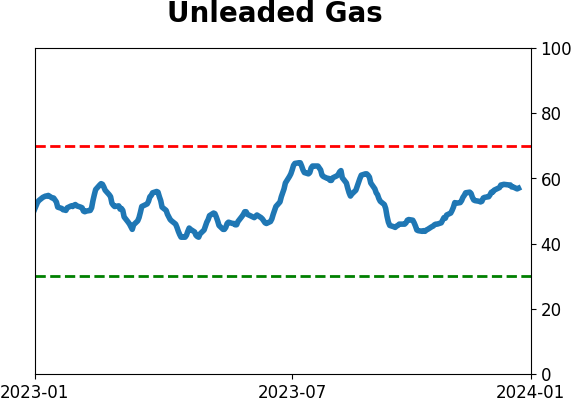
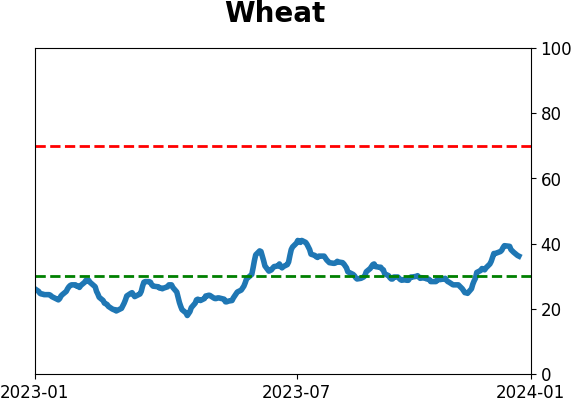
Agriculture
|
|
Research
By Jason Goepfert
BOTTOM LINE
Dumb Money Confidence reached nearly 90% in December, one of the highest levels since we began the model in 1998. It has shifted quickly, back down to 70%, in only a week. Other times when Confidence cycled so quickly, the S&P 500 struggled in the short term but rarely suffered any large losses.
FORECAST / TIMEFRAME
None
|
Key points:
- Dumb Money Confidence has retreated quickly from a historically high extreme
- The shift in sentiment has taken only a week, one of the quickest shifts in 25 years
- Rapidly declining sentiment has most often preceded further short-term declines, but longer-term gains
Trend-following traders are pulling back their expectations...quickly
As November came to an end, we looked at some signs that sentiment was becoming overheated. Among the most prominent examples was Dumb Money Confidence, which surged to nearly 90%, one of the most extreme levels since we began computing this in 1998.
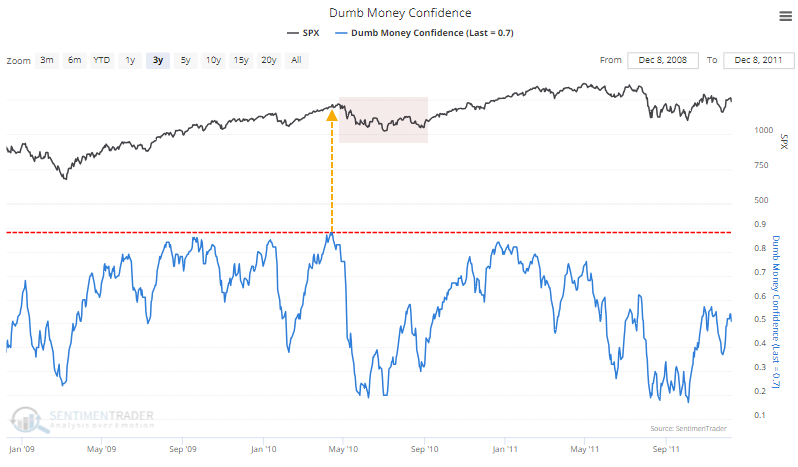
The few other times when trend-following traders got this confident, stocks struggled, except for the abnormal trend in 2021. In 2010, the S&P 500 peaked almost immediately after and fell into a multi-month pullback.
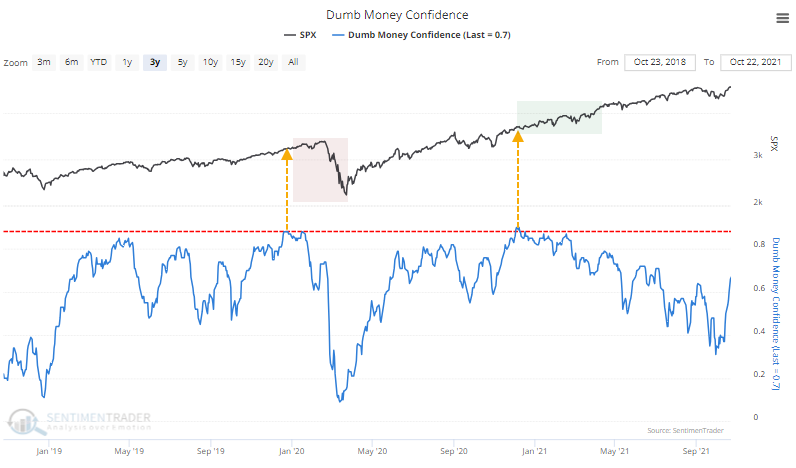
In 2020, stocks levitated for a while, then suffered the pandemic plunge. As sentiment was re-heated near the end of that year, there was no ill effect whatsoever on stocks for the following year.
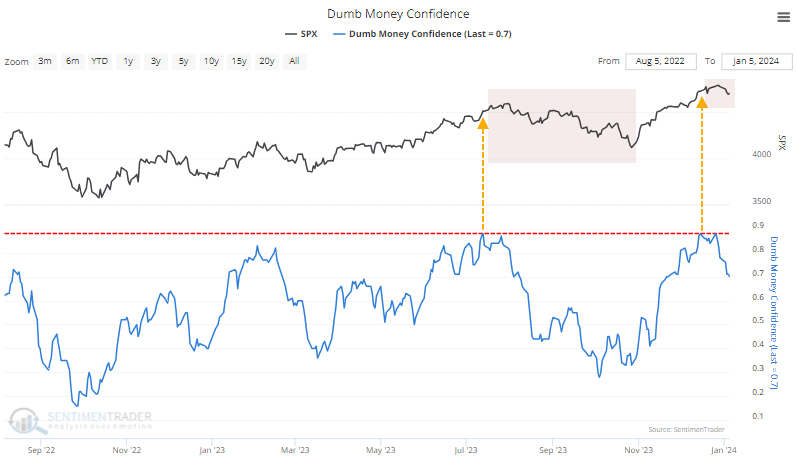
When we got to the next extreme, in the summer of last year, the S&P rallied for a couple more weeks, then corrected into October.
Rapid shifts in sentiment have preceded some short-term declines
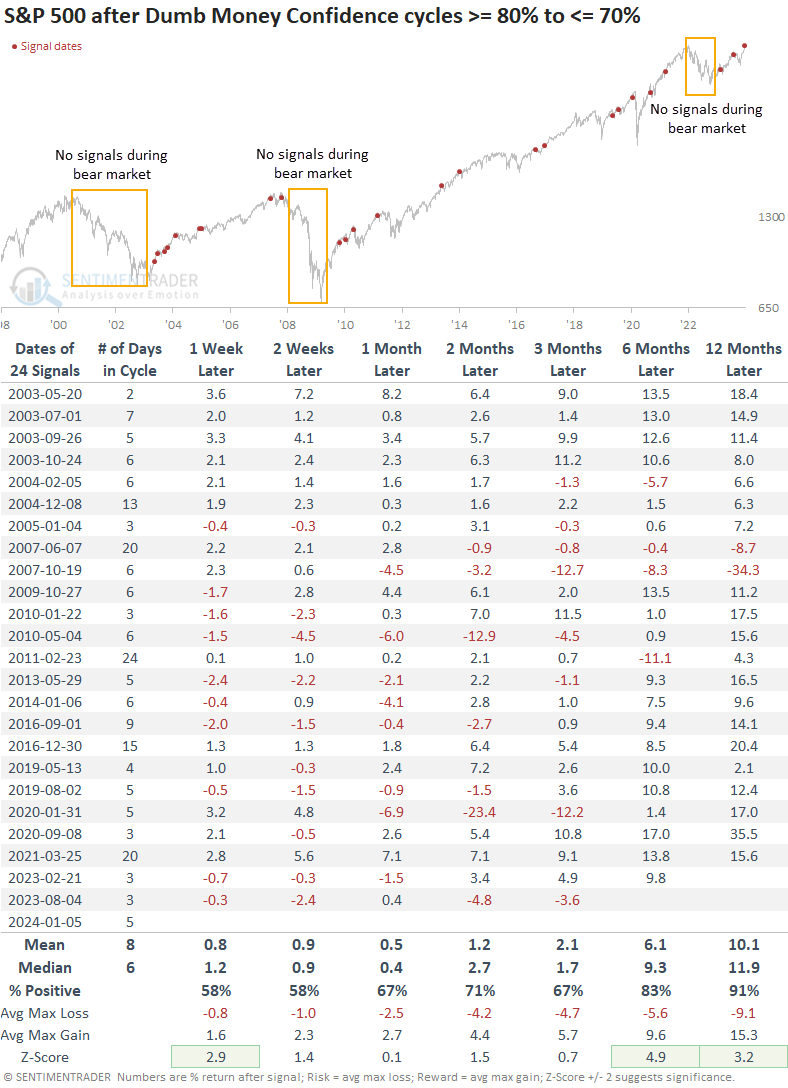
The table below shows lesser extremes when Dumb Money Confidence cycled from 80% or above to 70% or below. This shows us times when sentiment got ebullient and then started to recede.
The key with readings like this is that they don't happen during bear markets, or very rarely. So, forward returns tend to be somewhere between okay and above average. We see that in the table below as well, with the only negative one-year returns occurring ahead of the 2008 financial crisis.
A notable quirk with the current cycle is how quickly it occurred. Dumb Money Confidence plunged 10% in only five sessions, which is relatively fast. The table below filters the table to include only those times when confidence dropped to 70% or lower in a week or less.
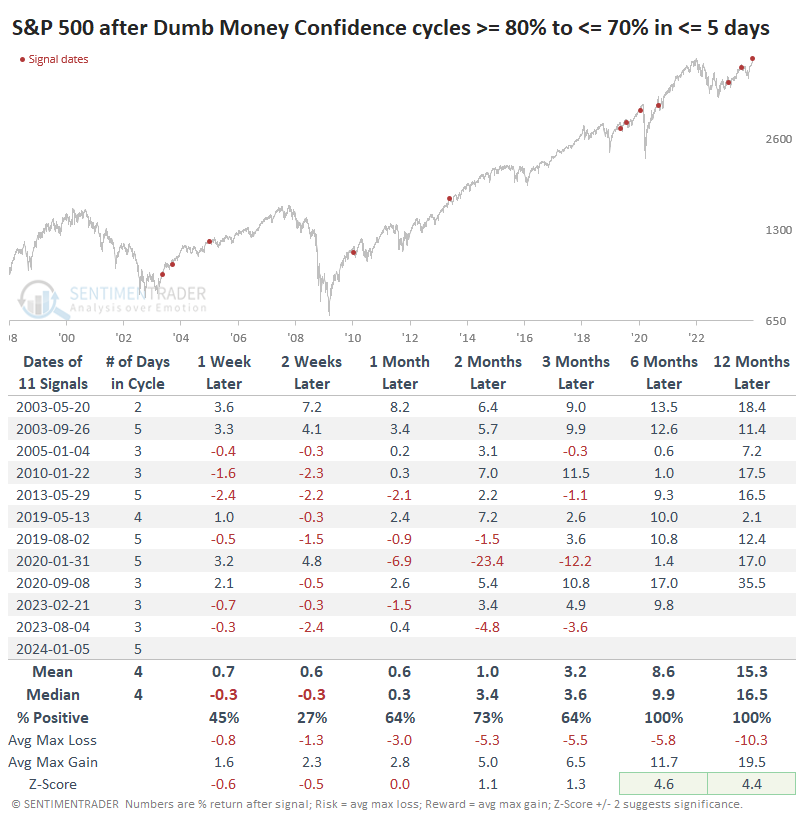
After these quick shifts in sentiment, the S&P struggled more in the short term. Only 3 out of 11 signals rallied over the next two weeks and one of those quickly gave up its gains. But over the next six months, only one precedent - the one that triggered ahead of the pandemic - witnessed more than a -6.3% drawdown.
What the research tells us...
Contrarian investing is challenging. The times when you think it should be easiest, when sentiment is genuinely extreme, are those times when it's not. Returns are actually more consistently negative after lesser extremes because those are the ones that occur during unhealthy market environments.
Still, the shift in sentiment over the past week has somewhat alleviated the extreme, and when it happens this fast, there is usually more to go. But it would be highly unusual if it morphed into a larger and persistent decline.
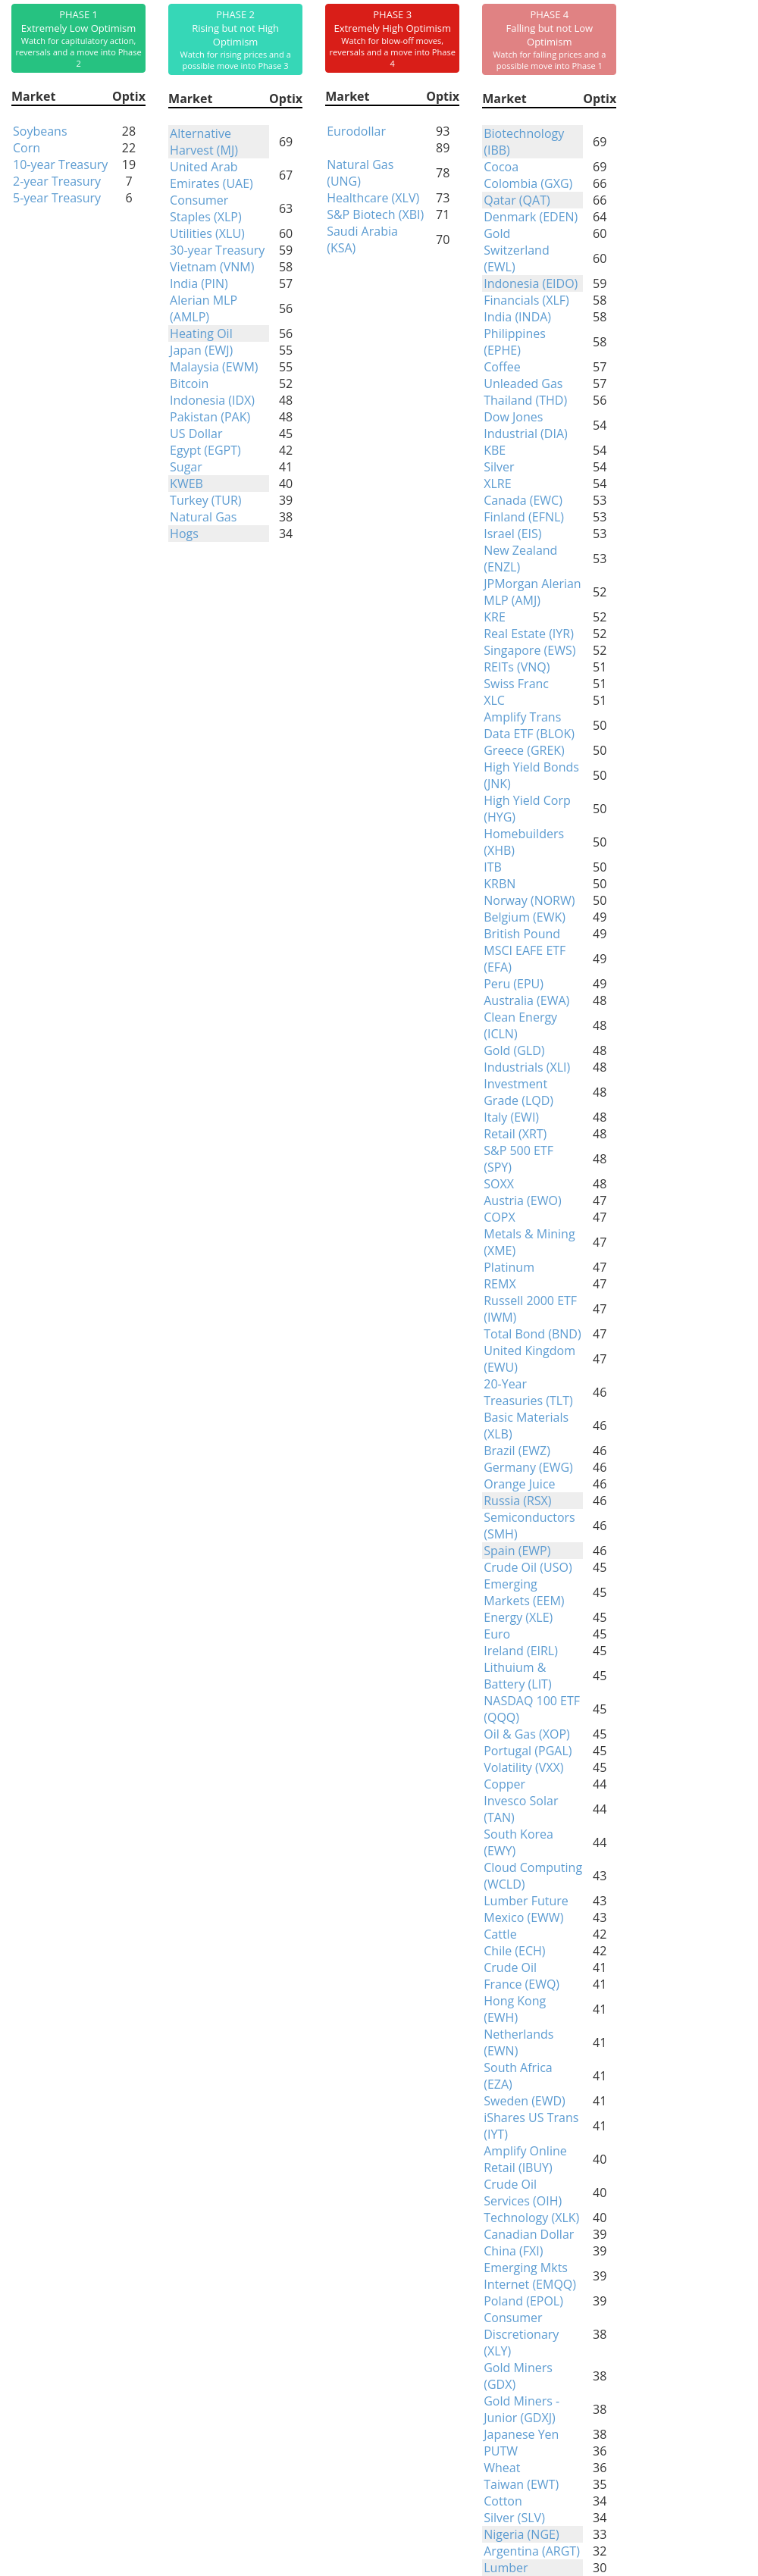
Indicators at Extremes
Phase Table
Ranks
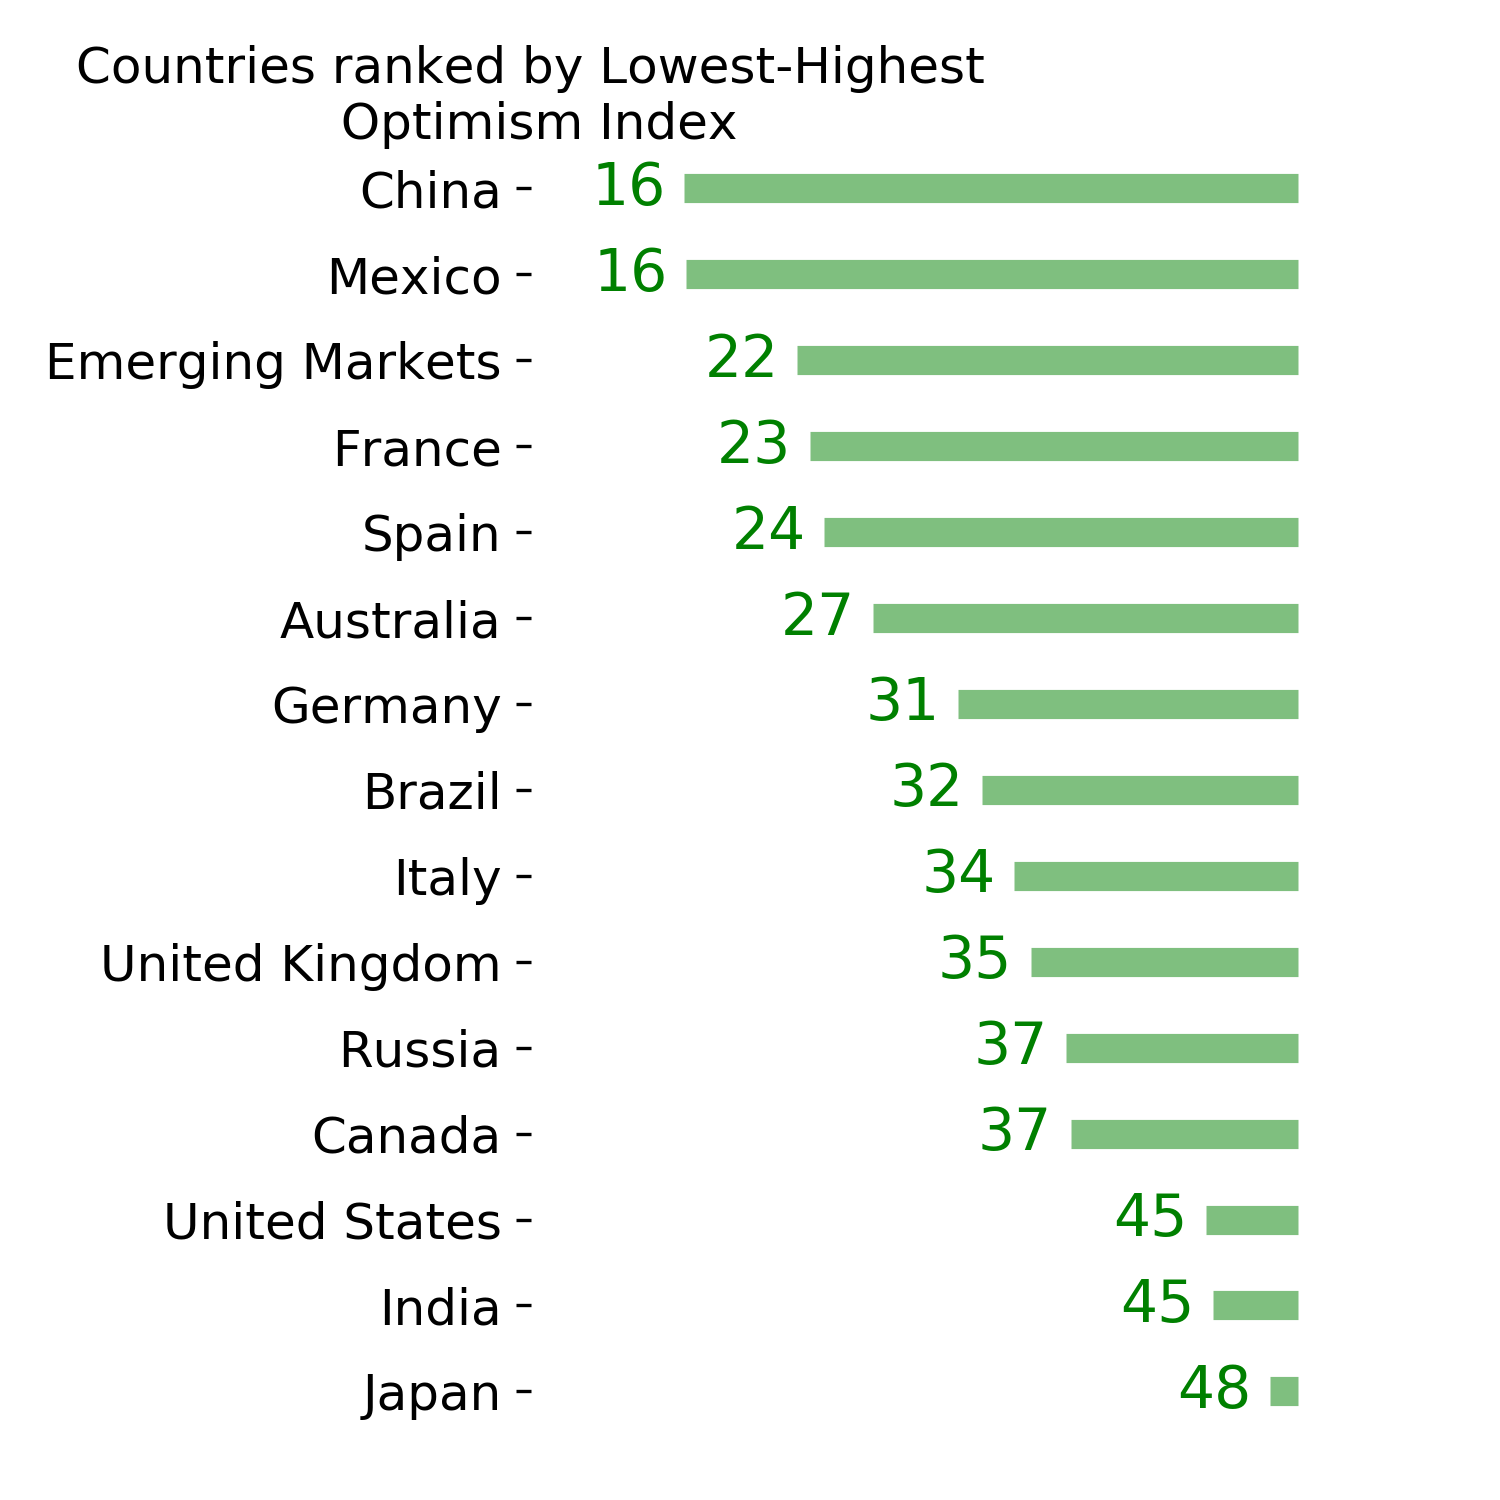
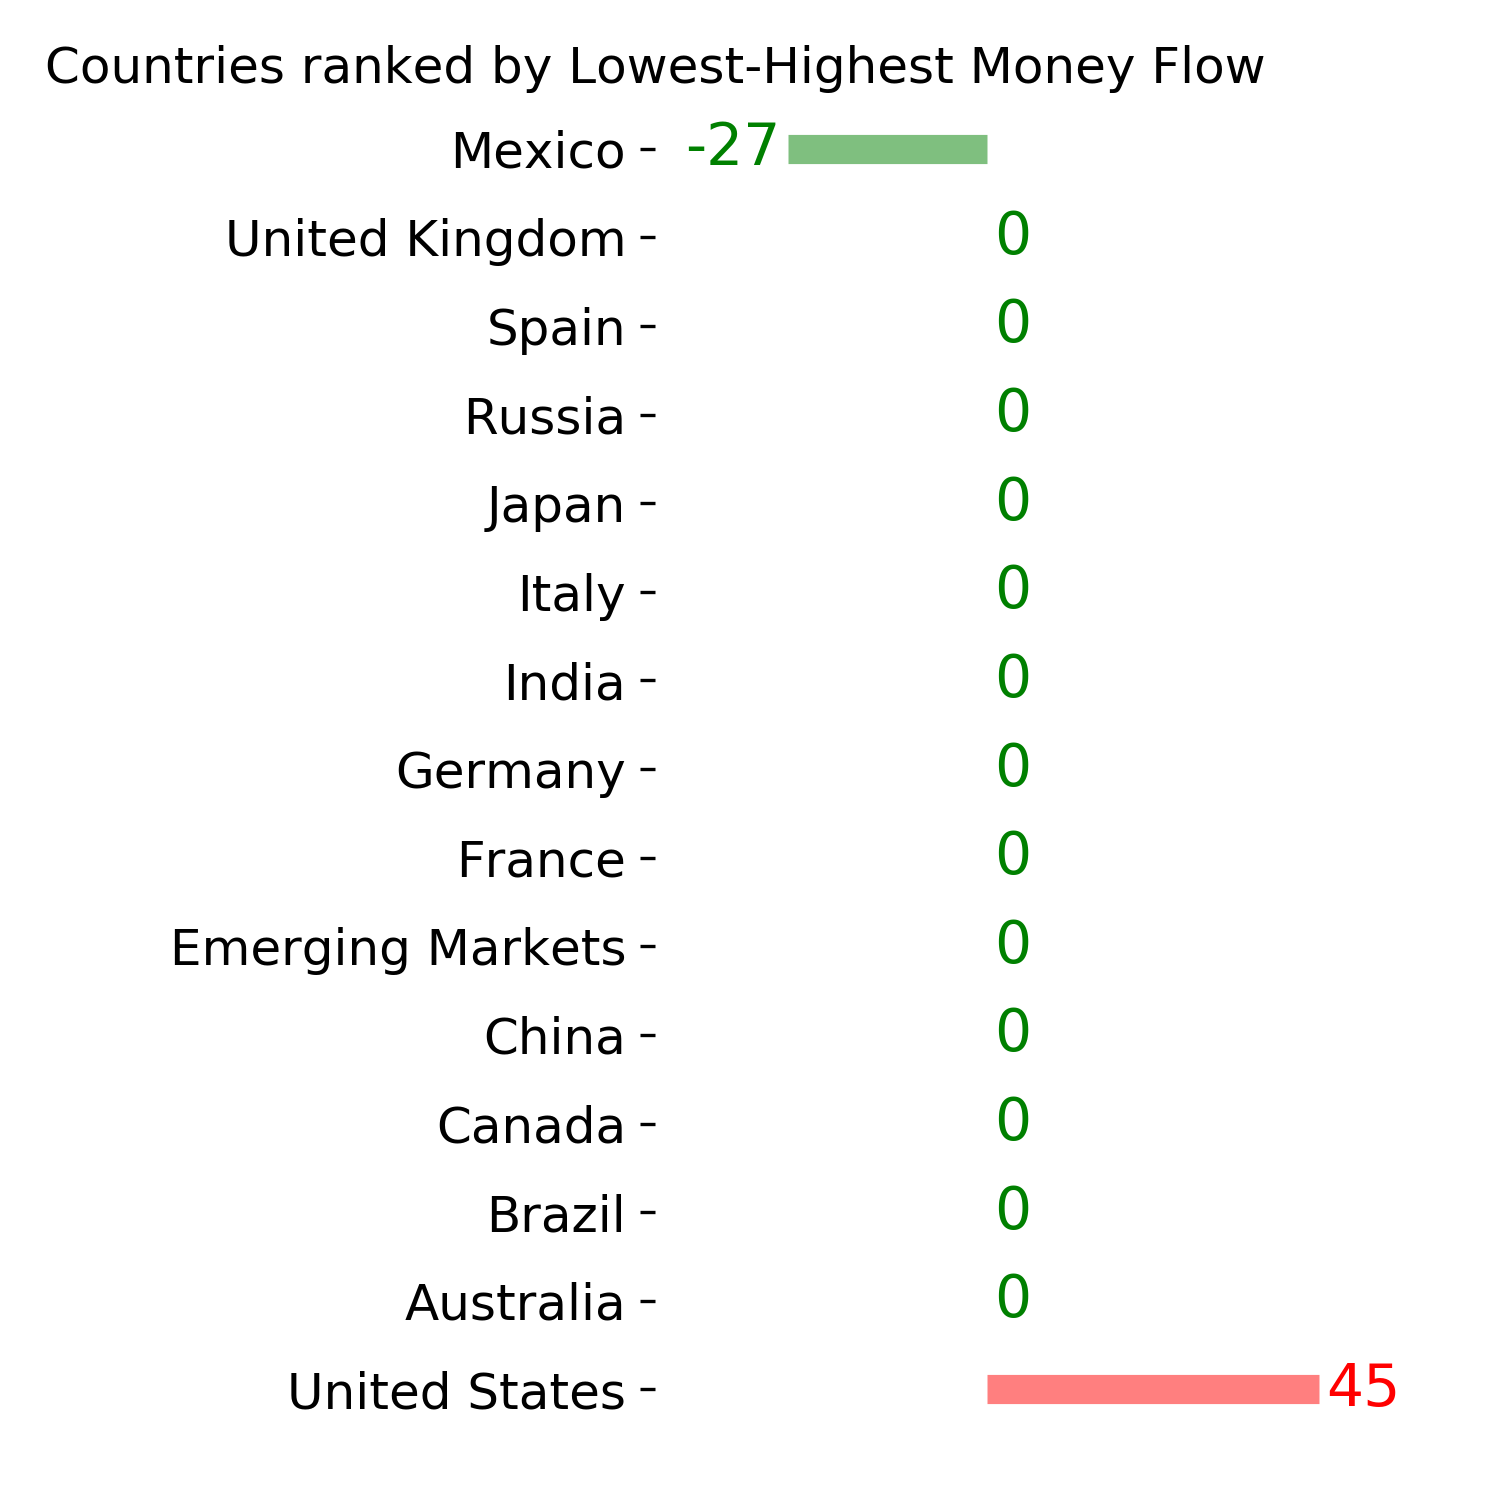
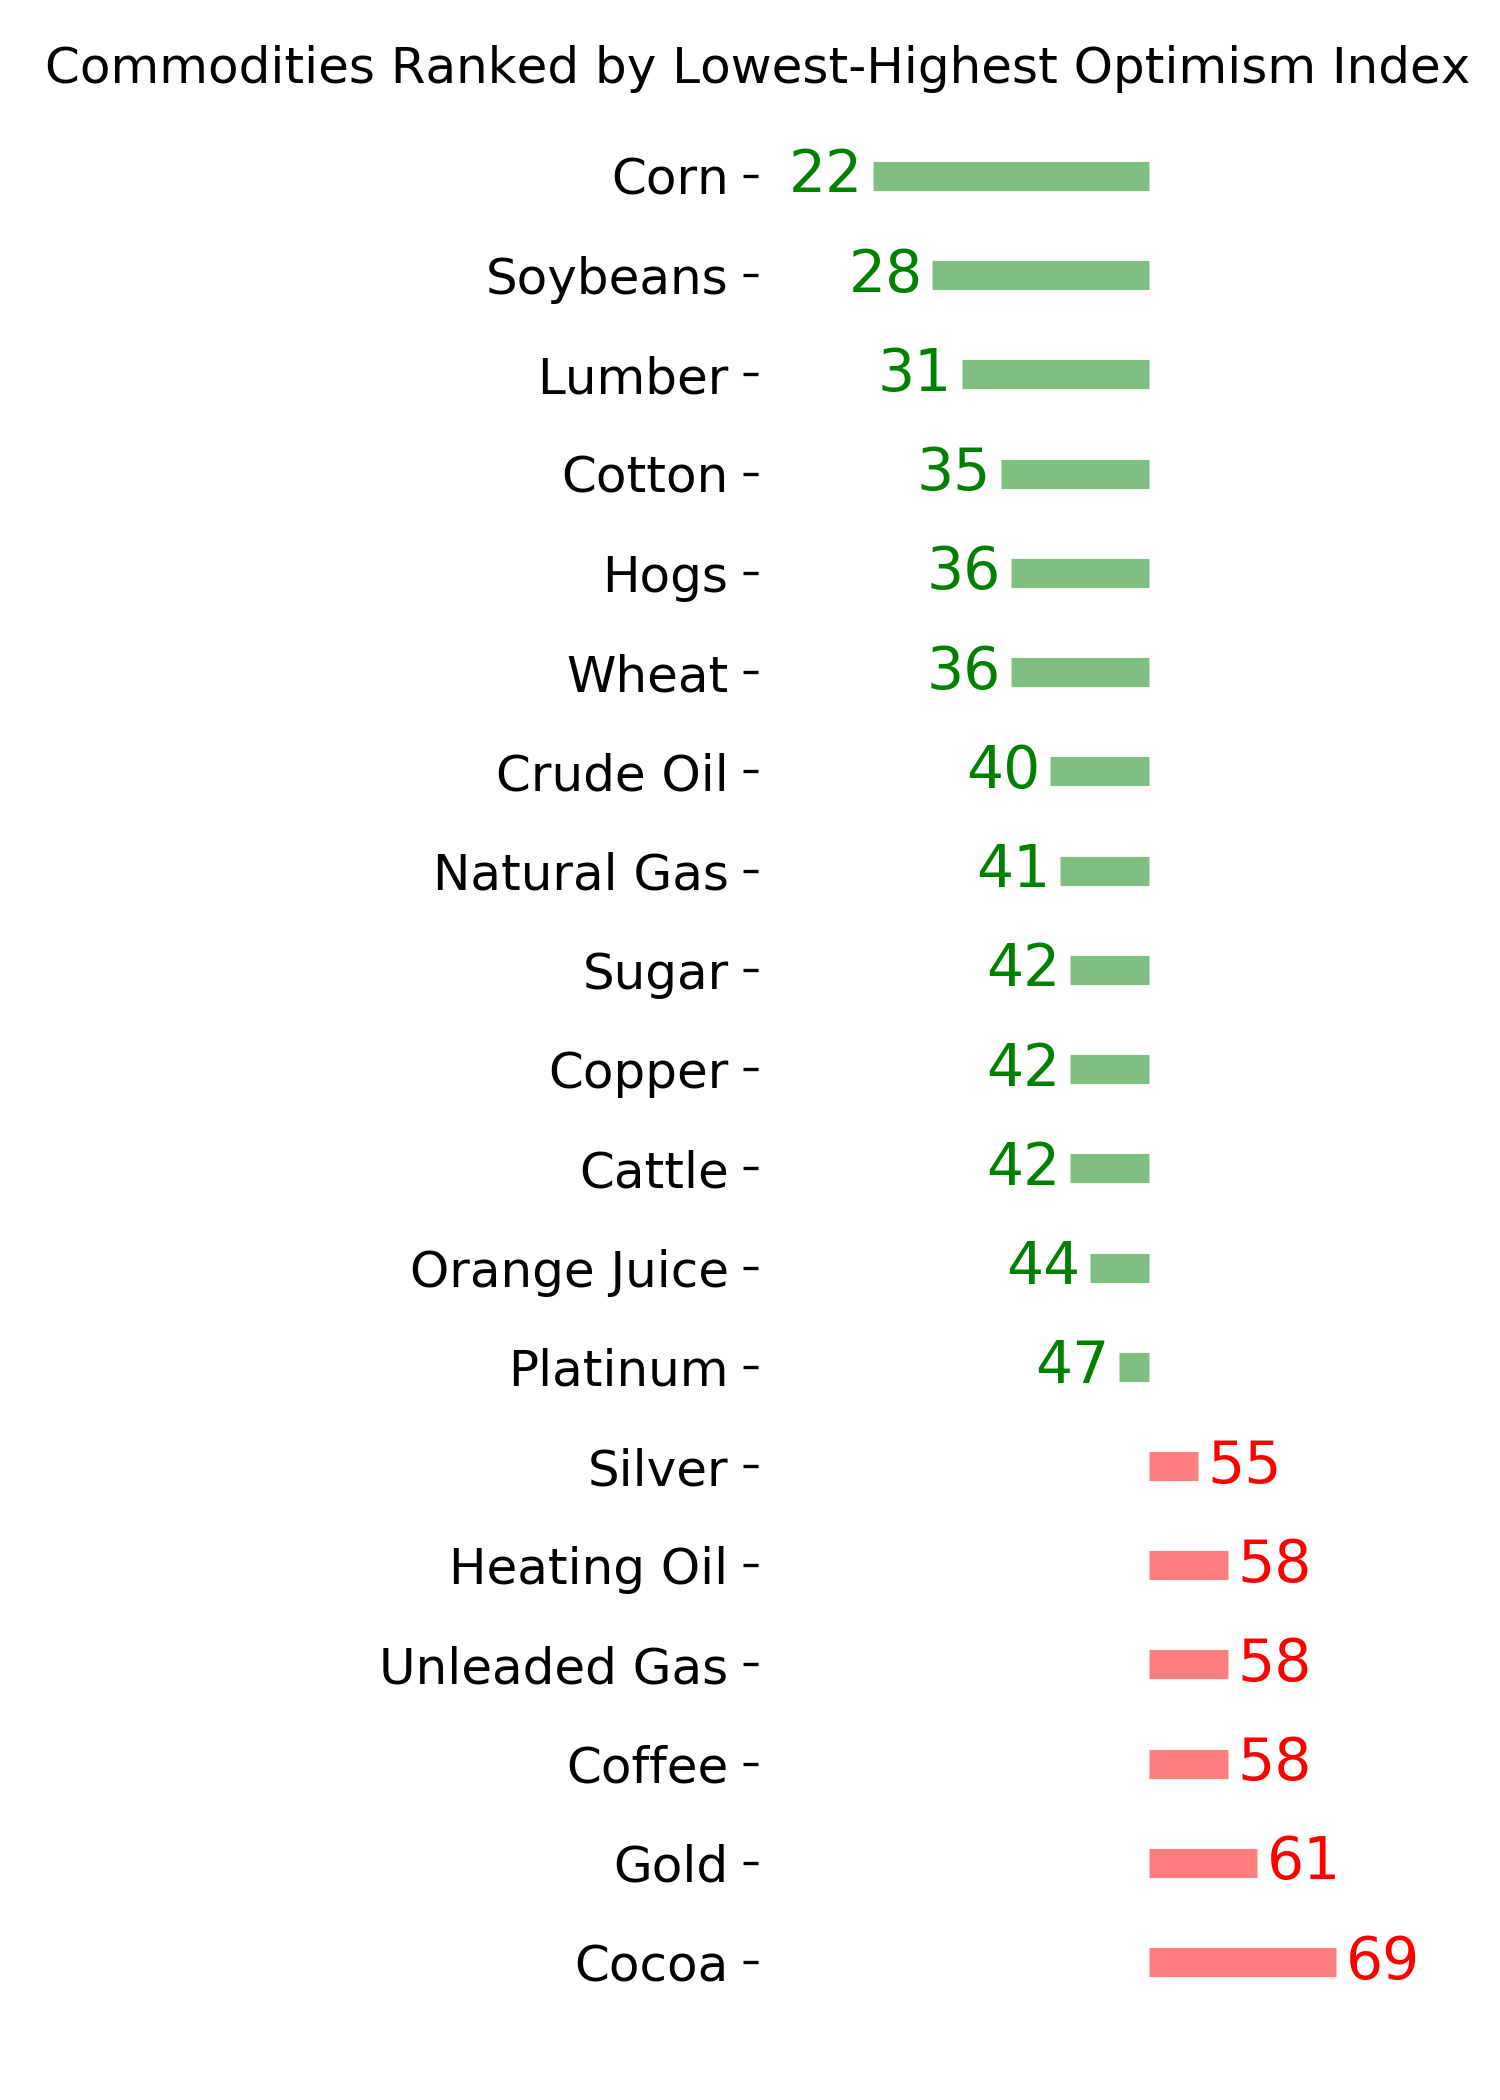
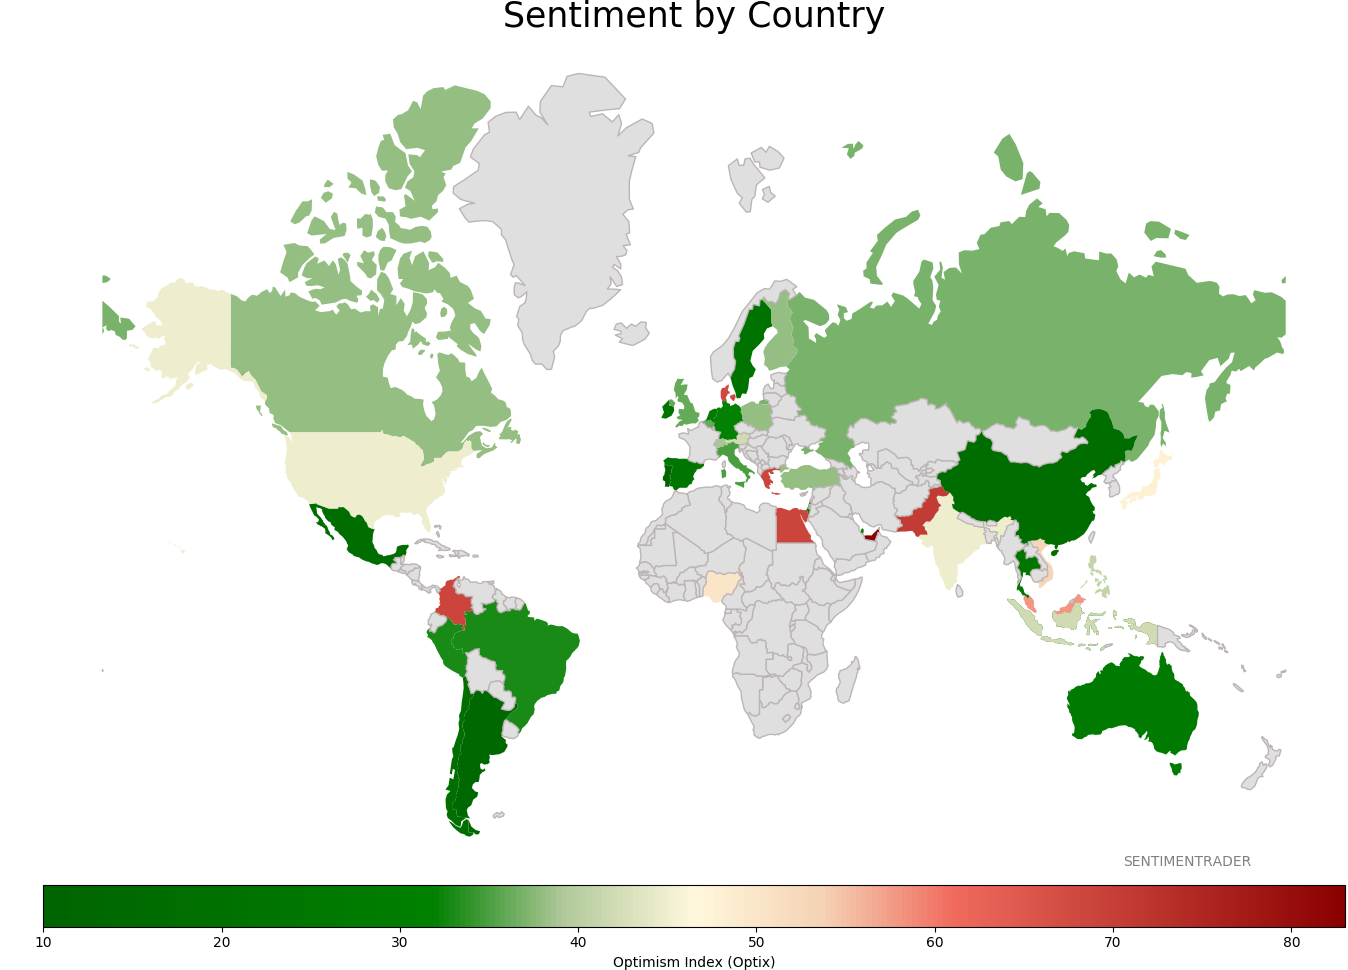
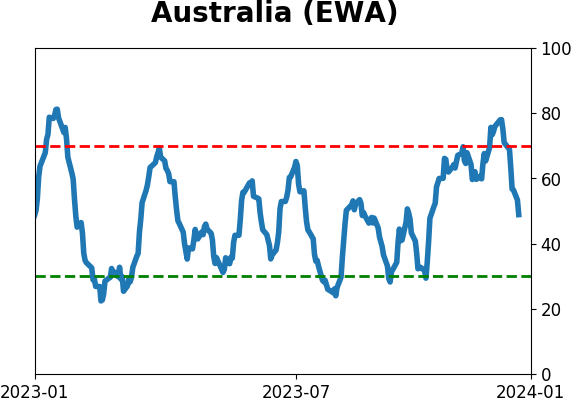
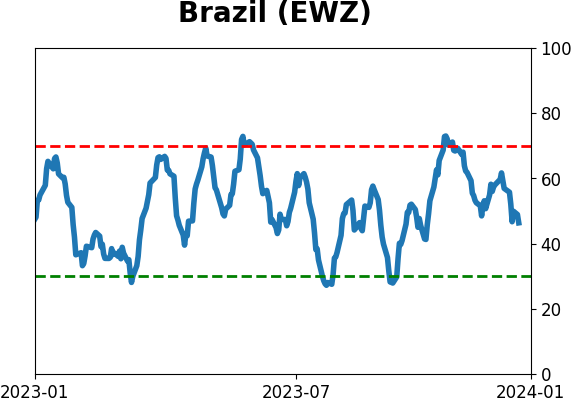
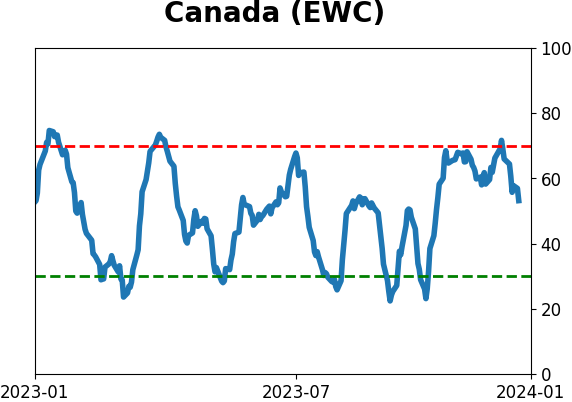
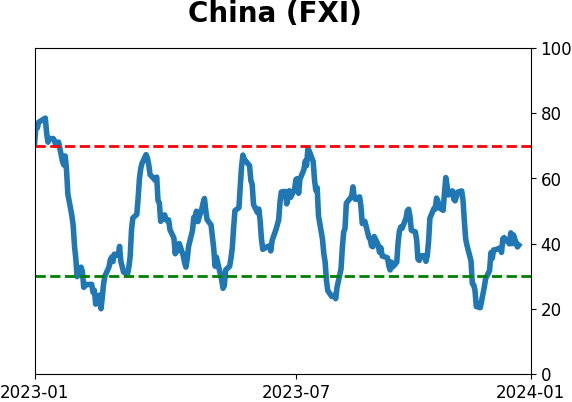
Sentiment Around The World
Optimism Index Thumbnails
|
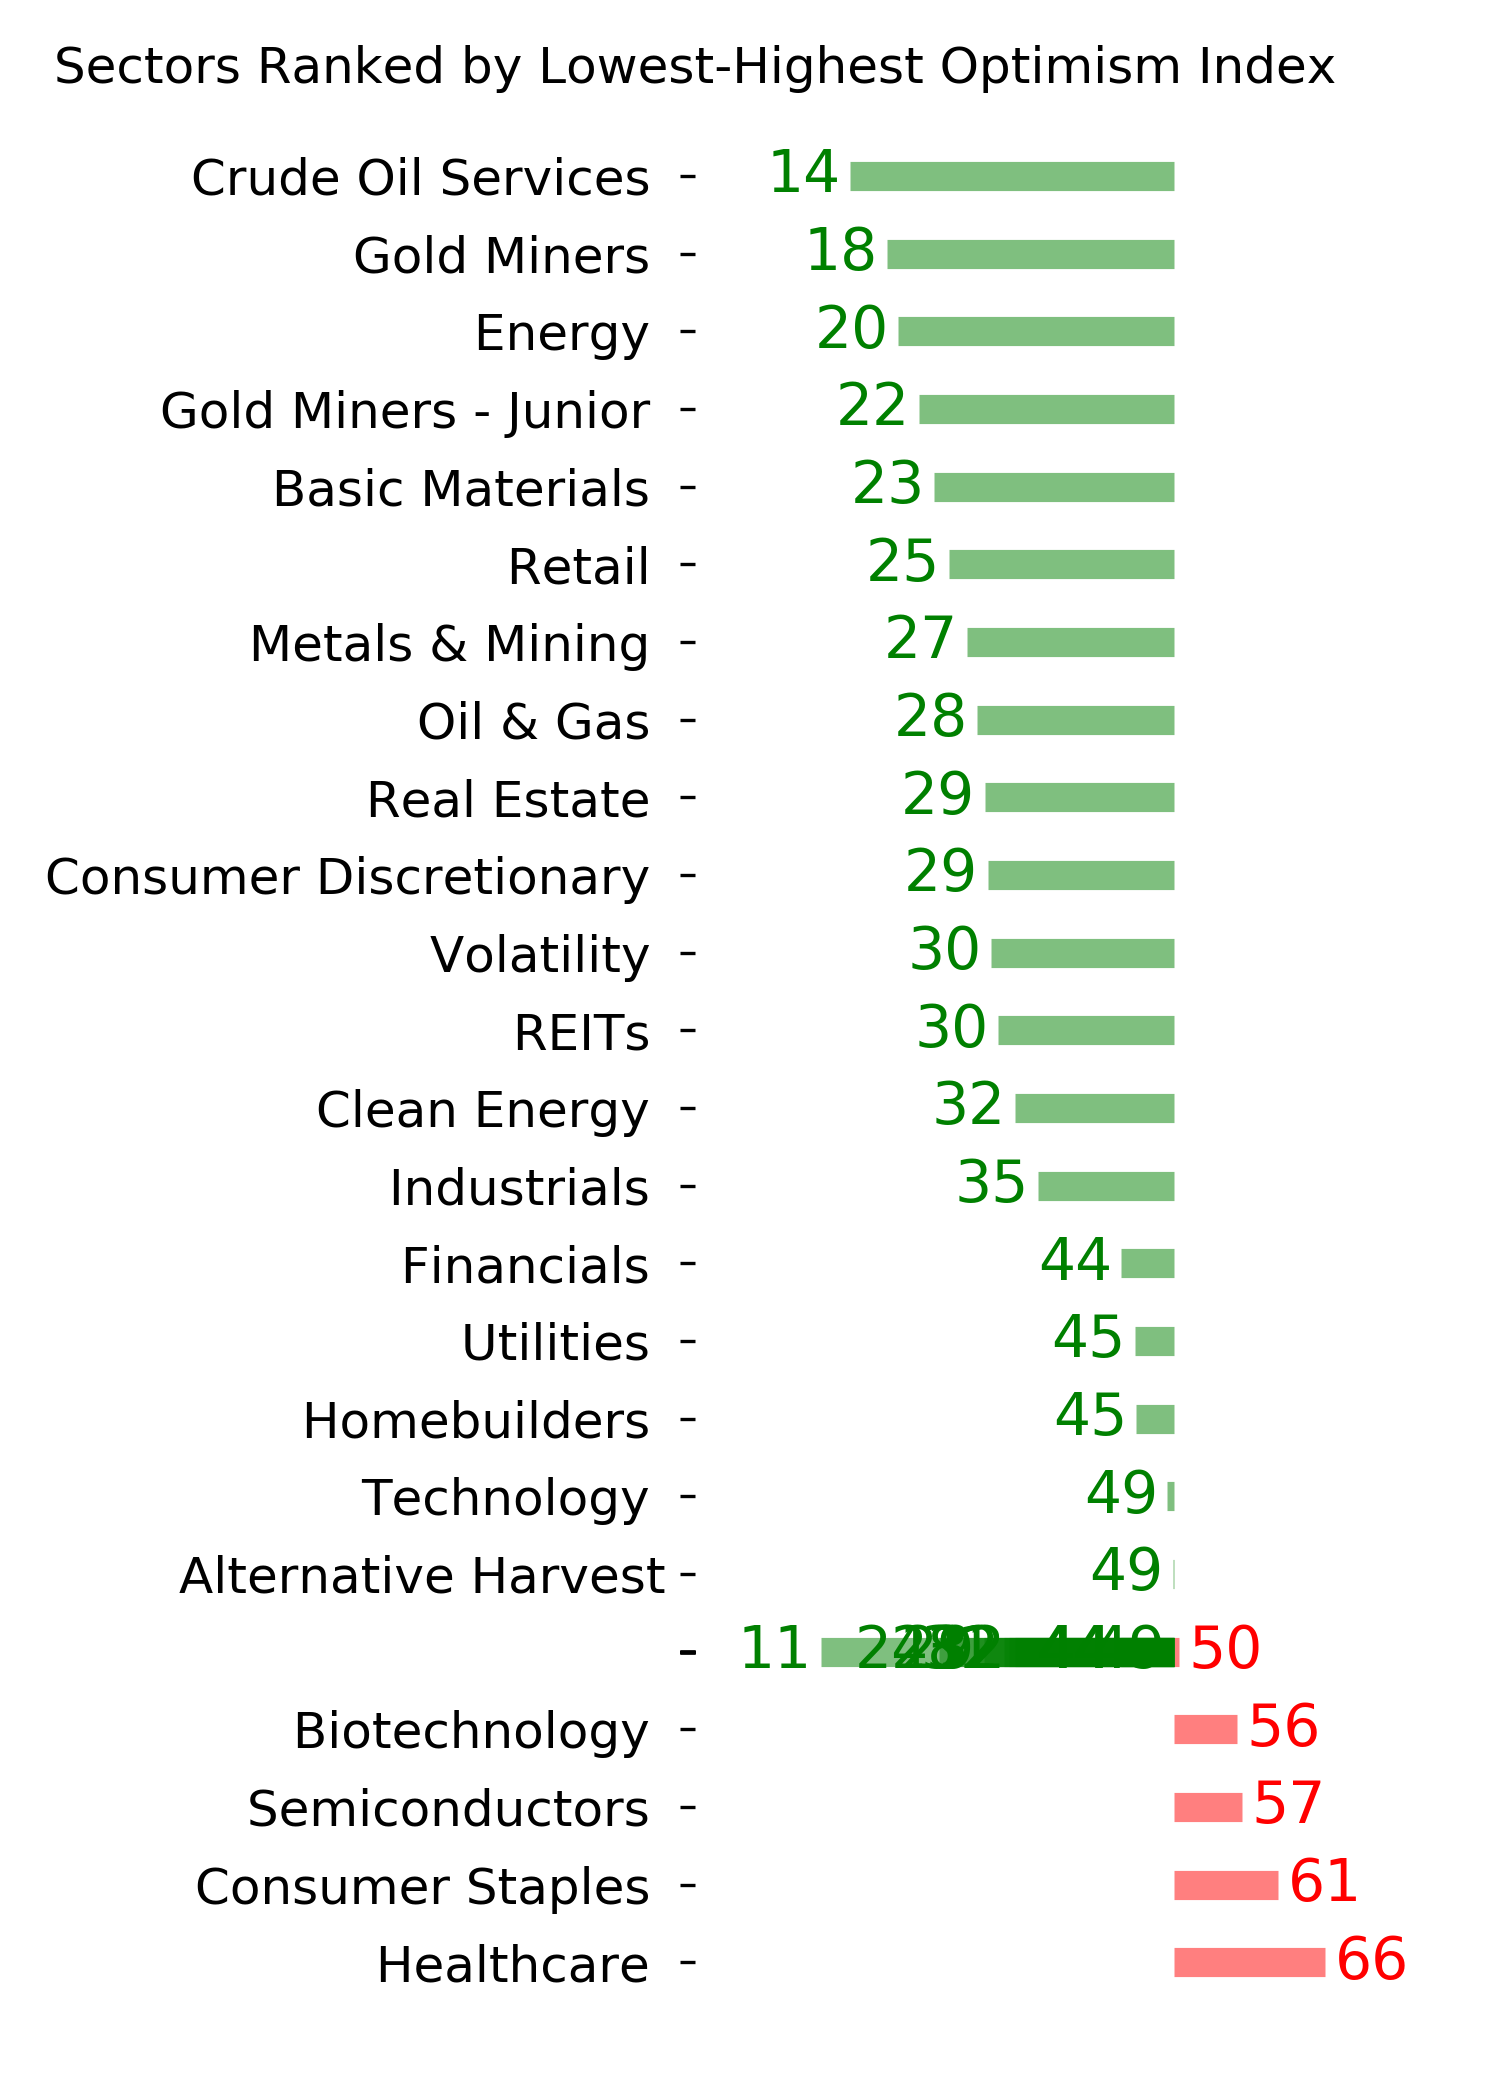
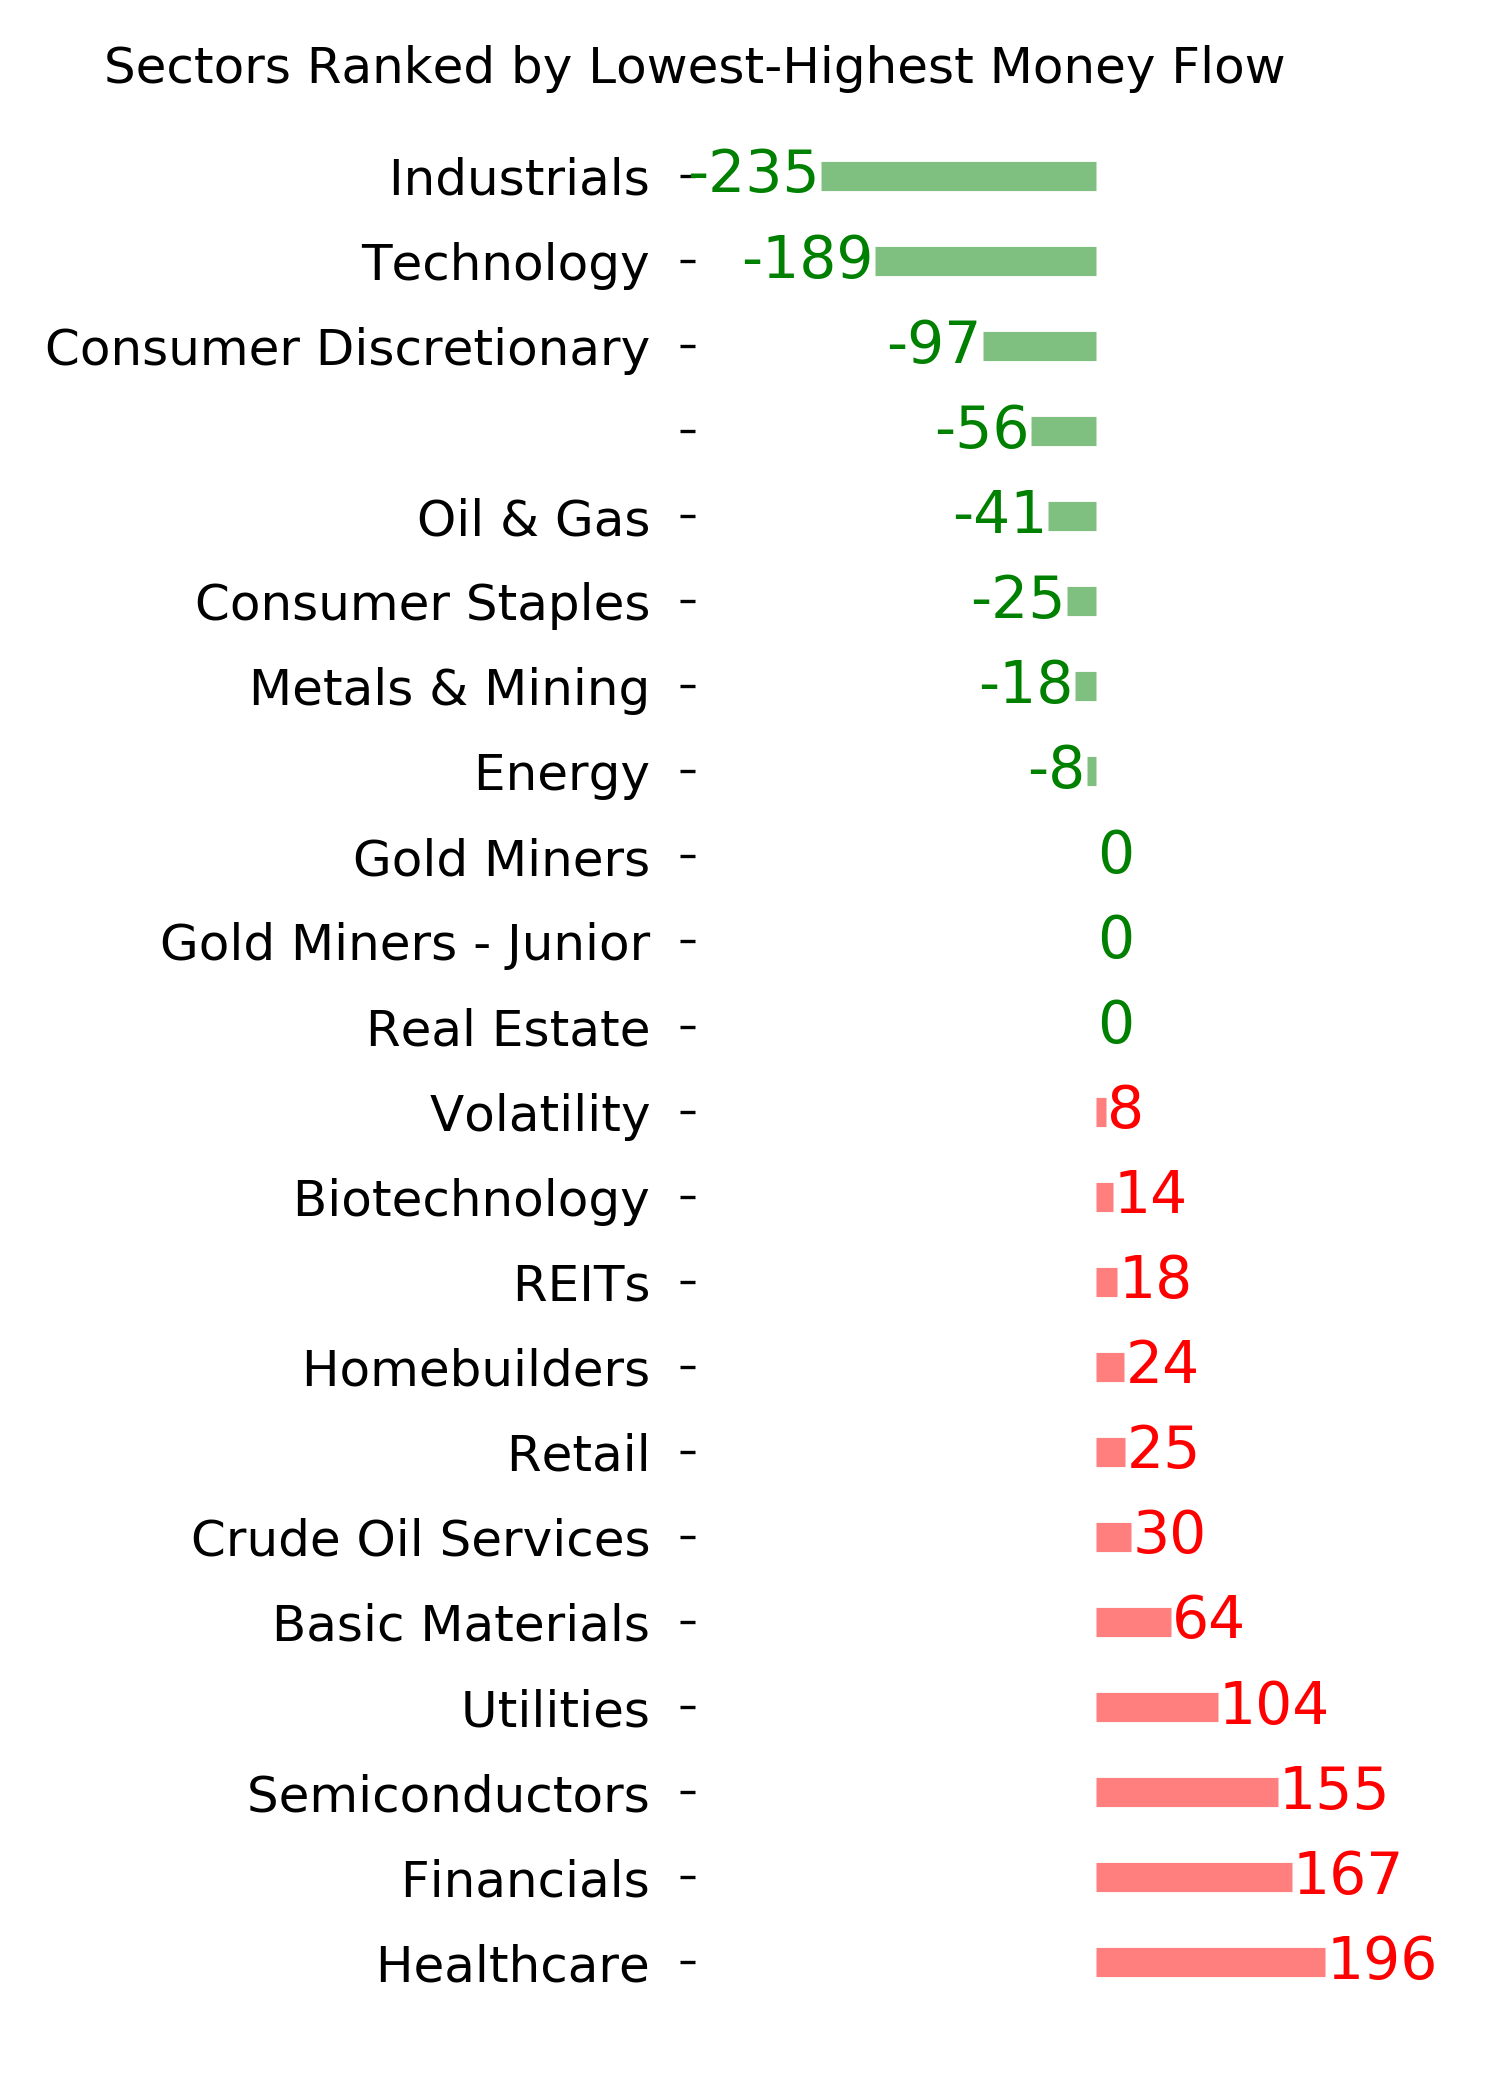
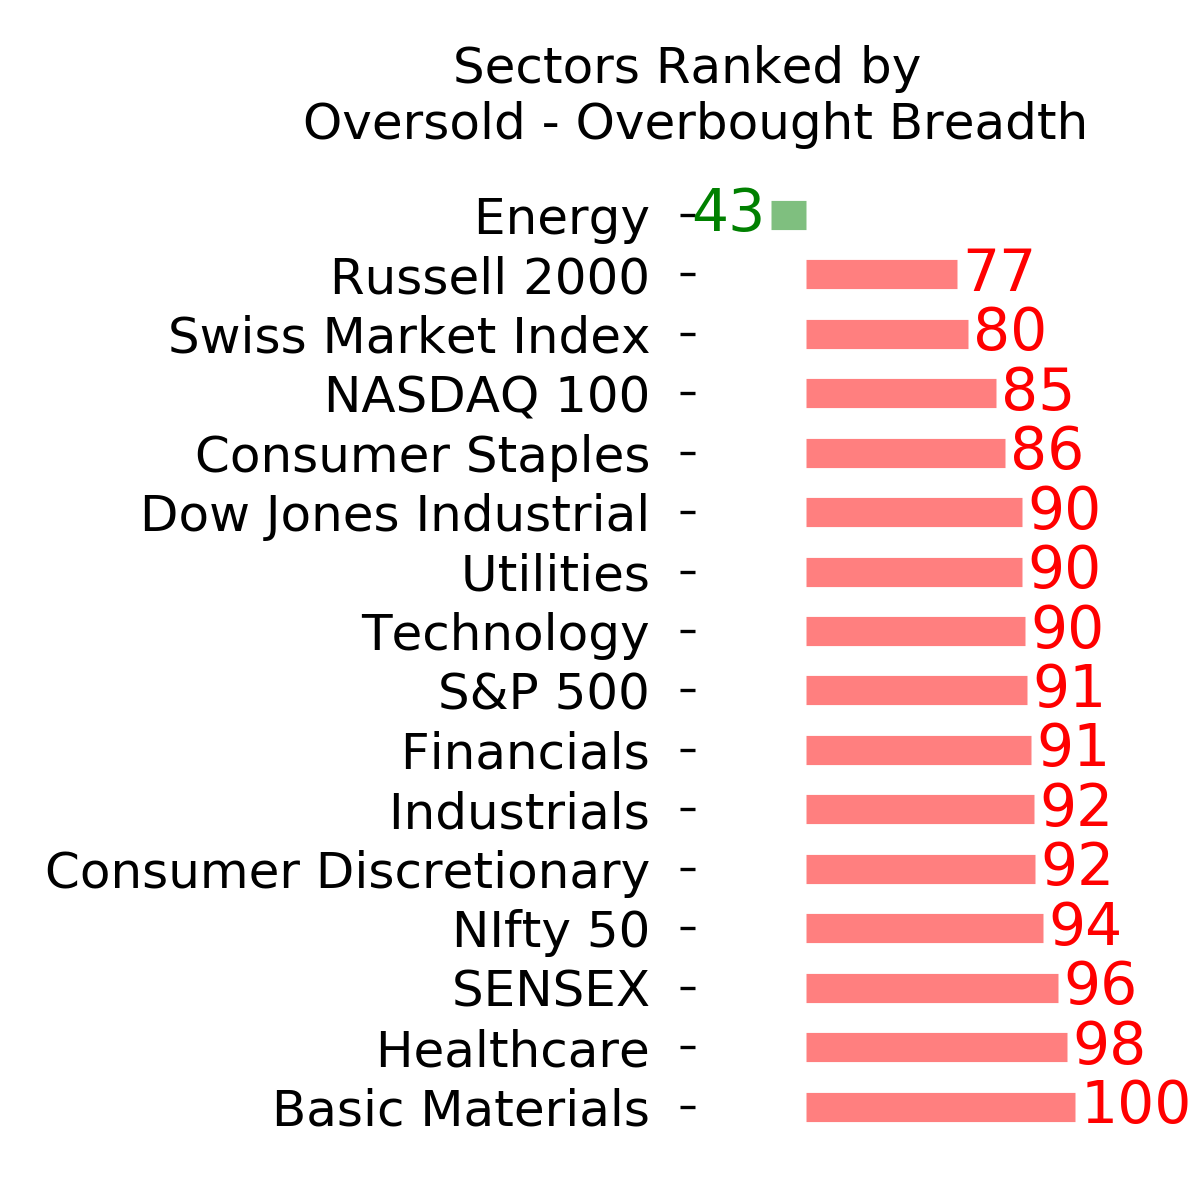
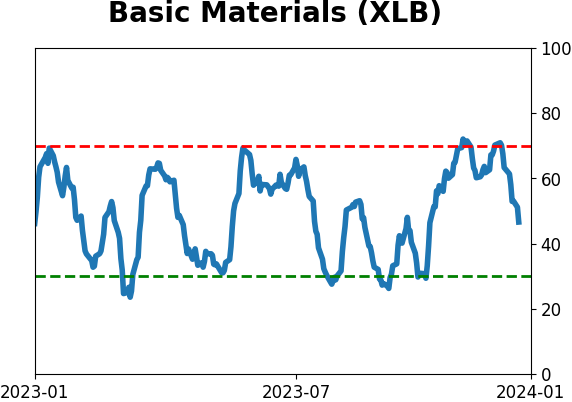
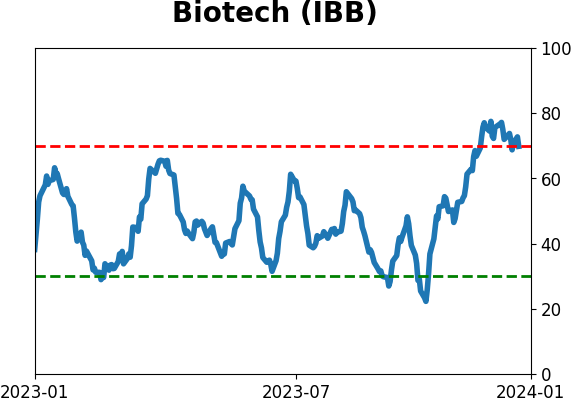
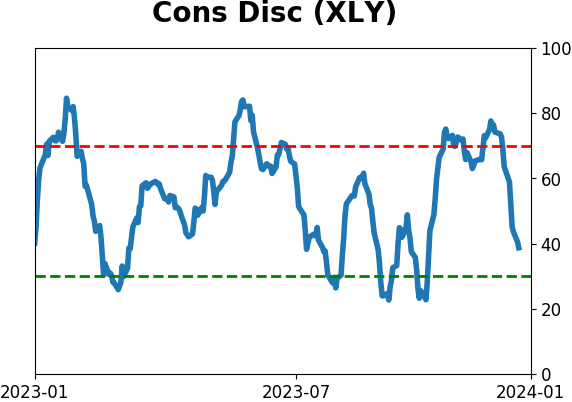
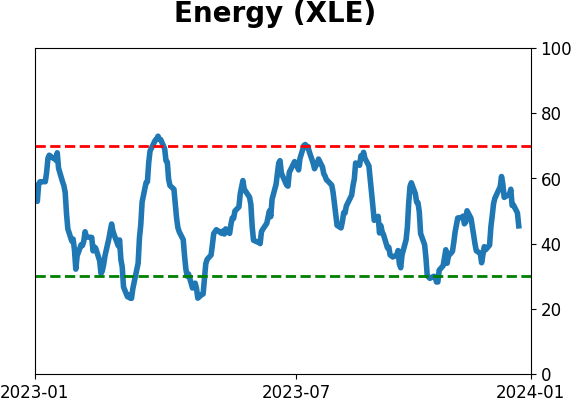
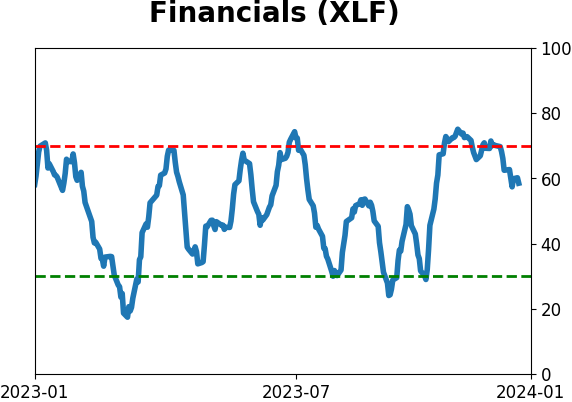
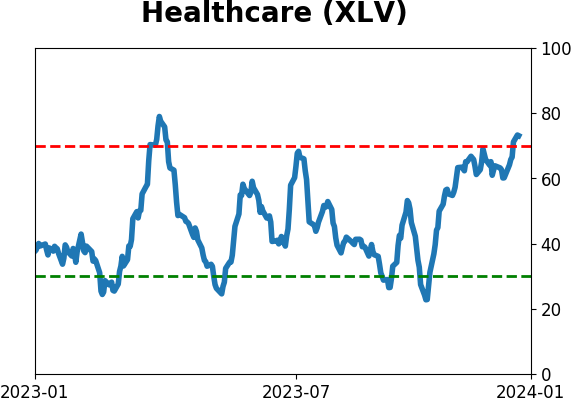
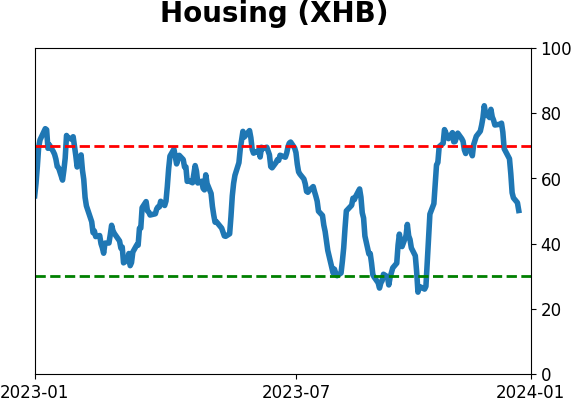
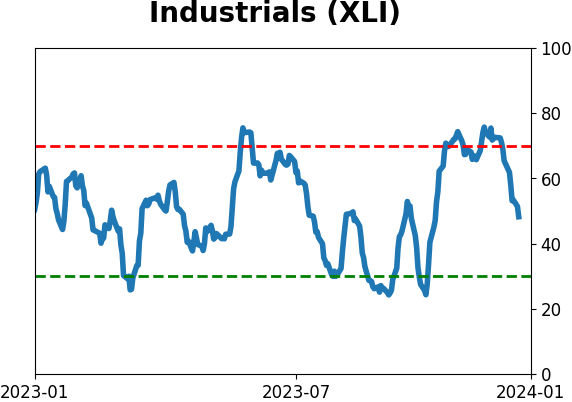
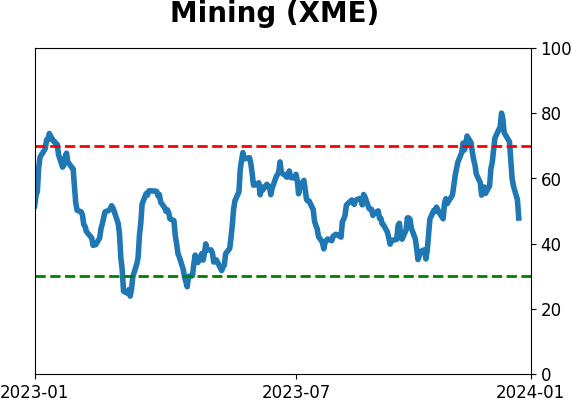
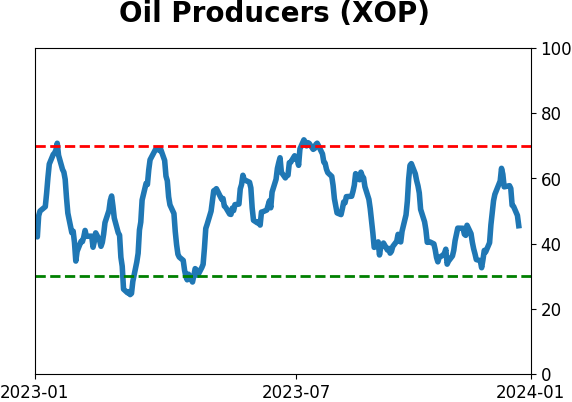
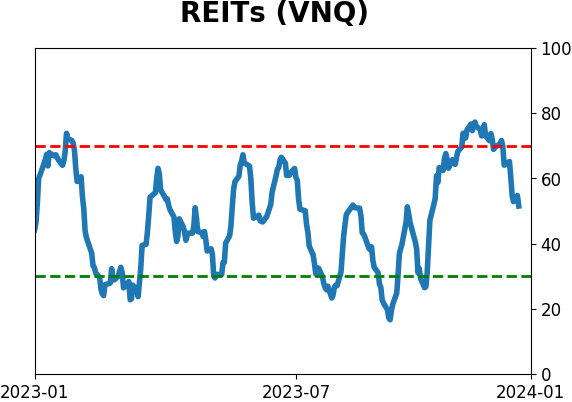
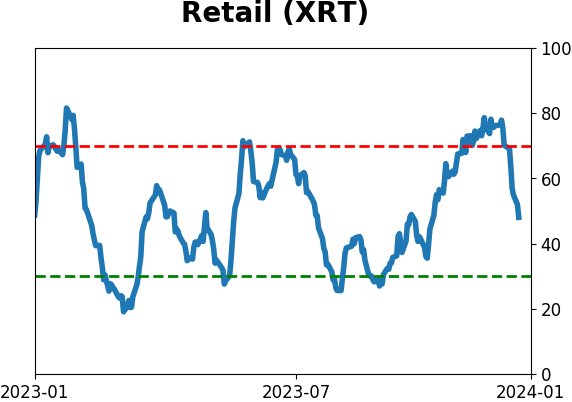
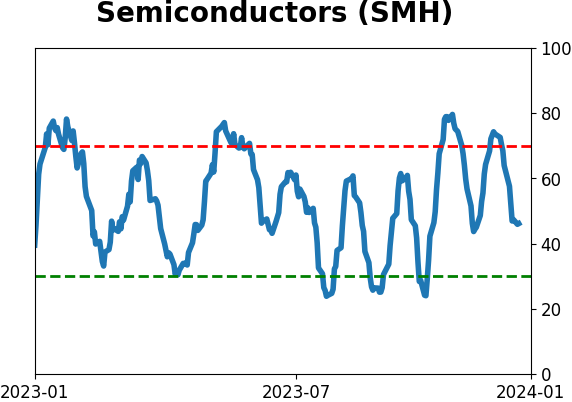
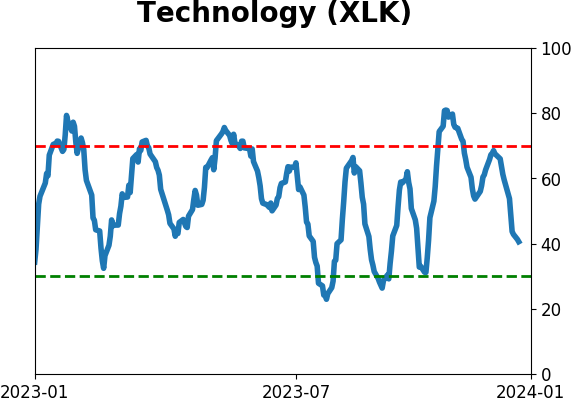
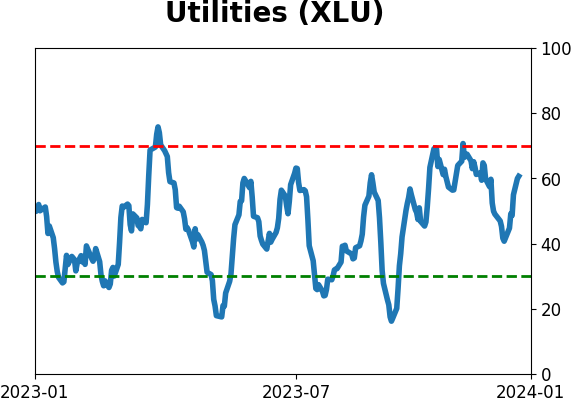
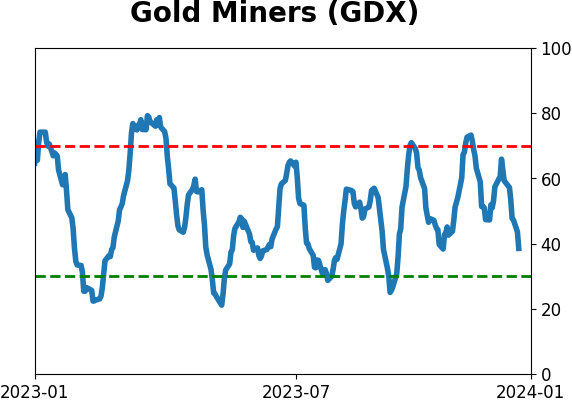
Sector ETF's - 10-Day Moving Average
|
|
|
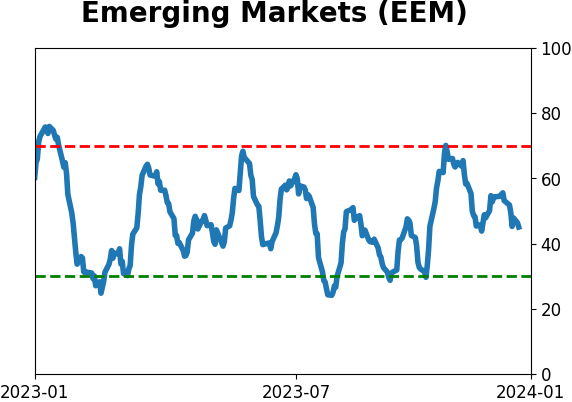
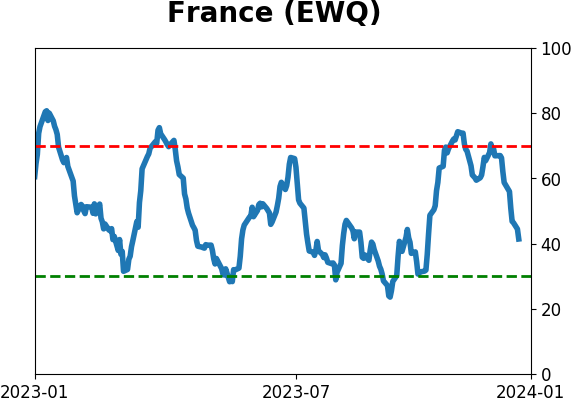
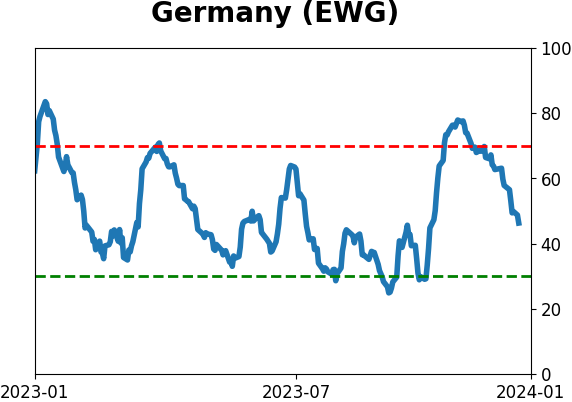
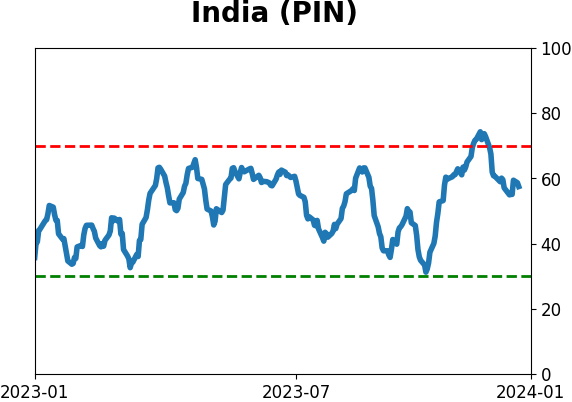
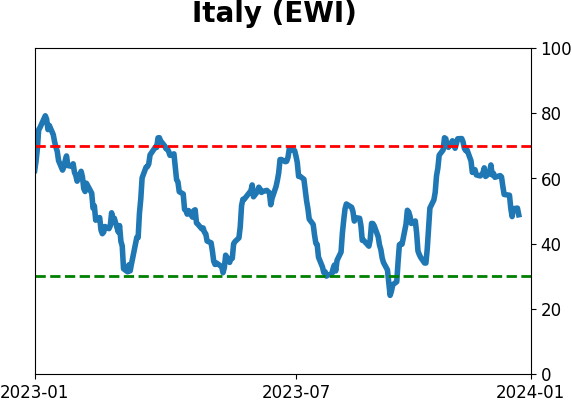
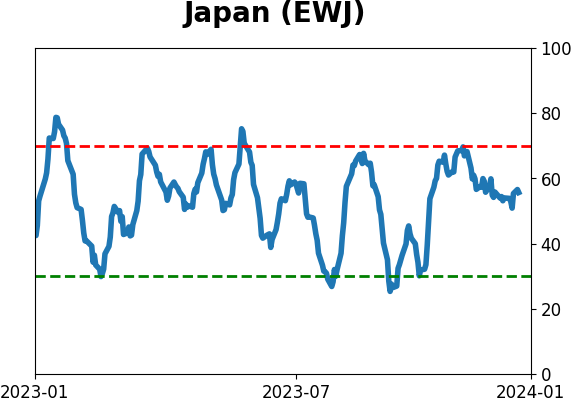
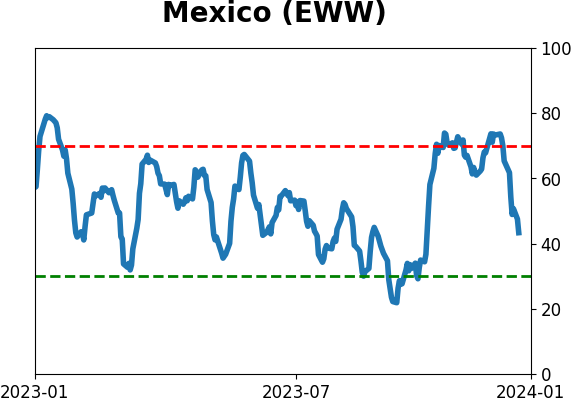
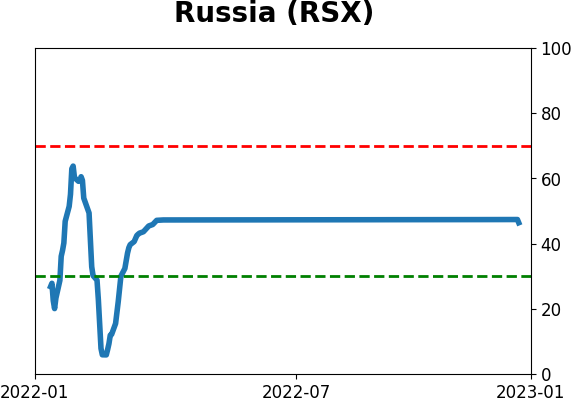
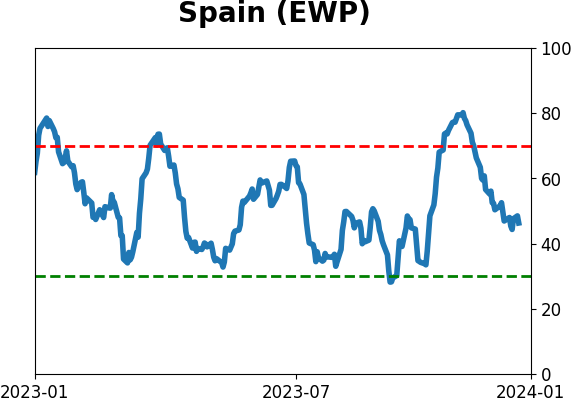
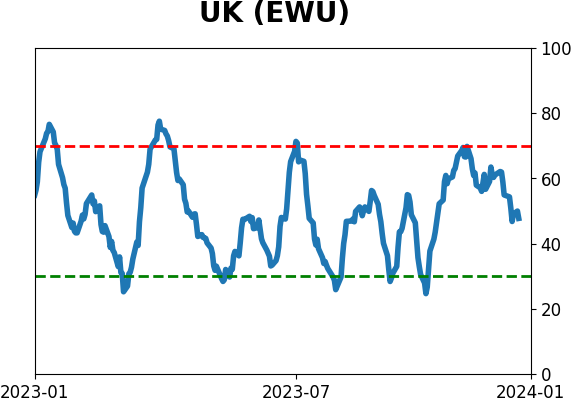
Country ETF's - 10-Day Moving Average
|
|
|
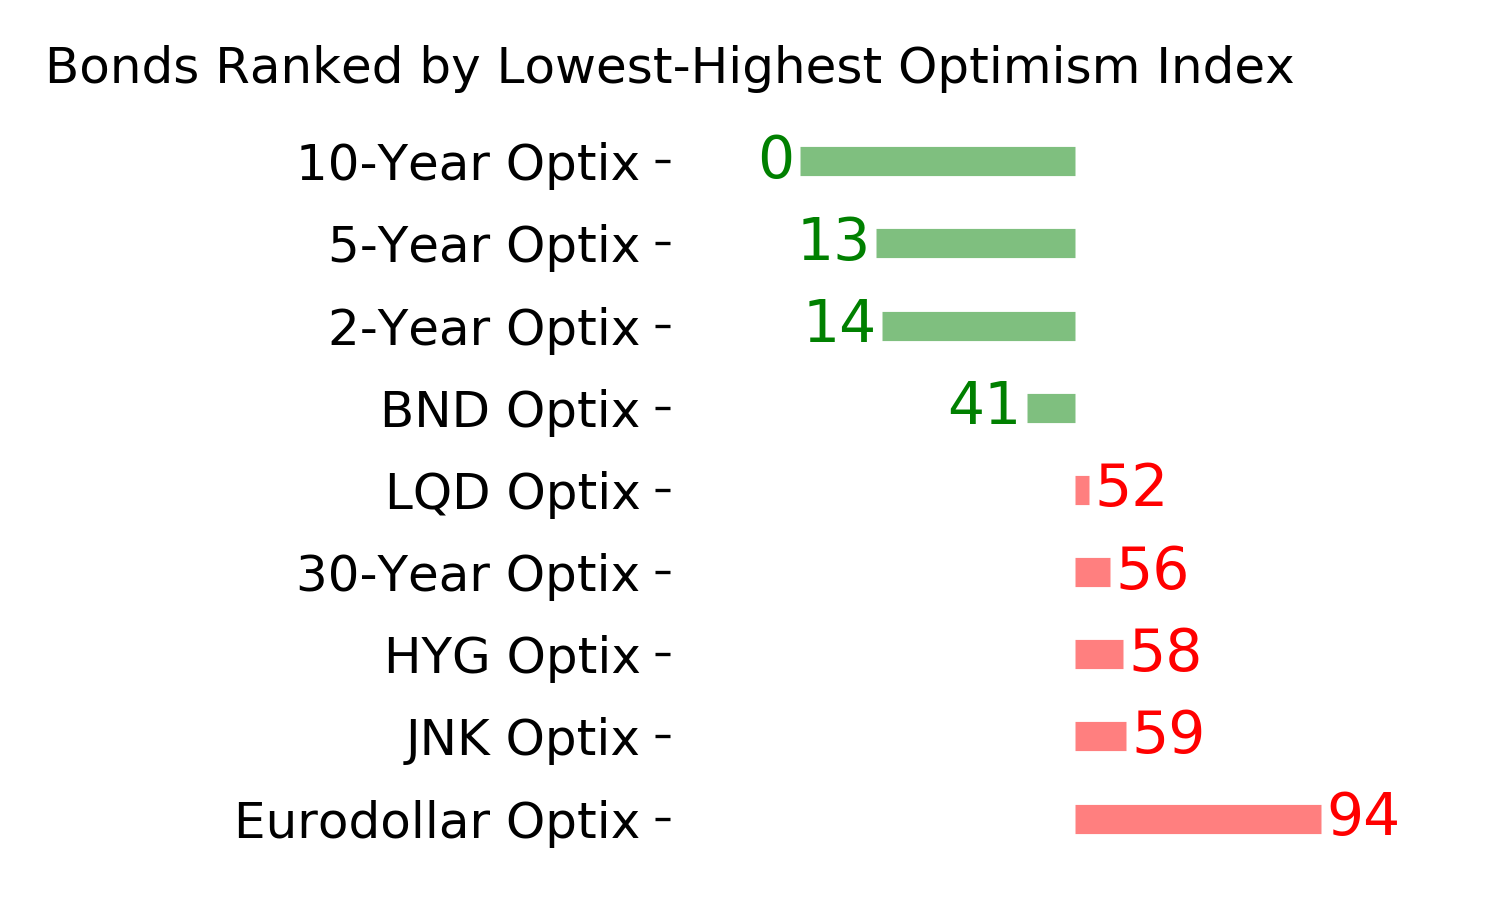
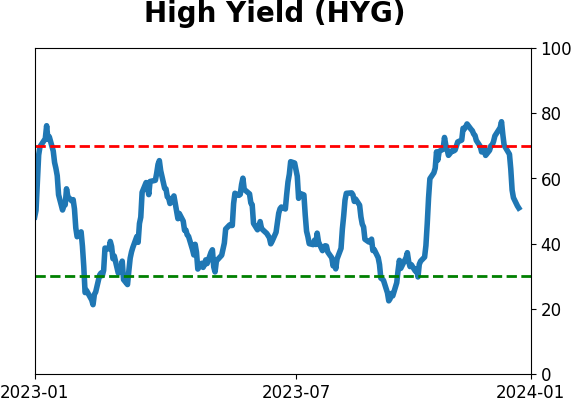
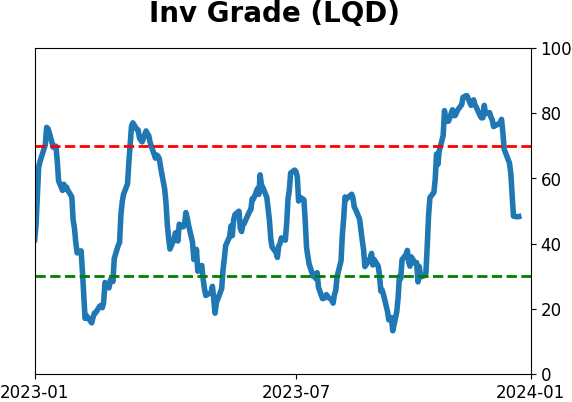
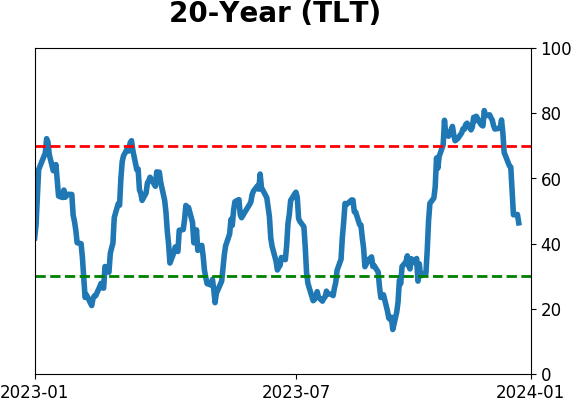
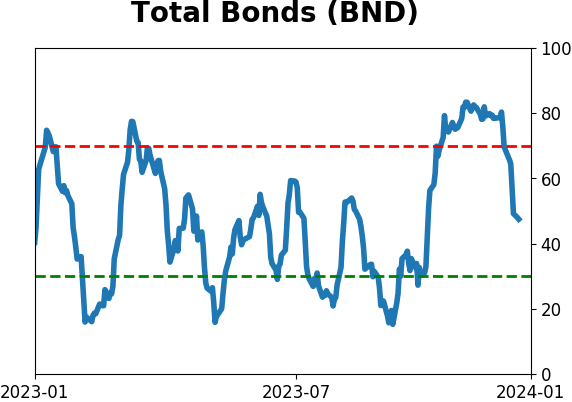
Bond ETF's - 10-Day Moving Average
|
|
|
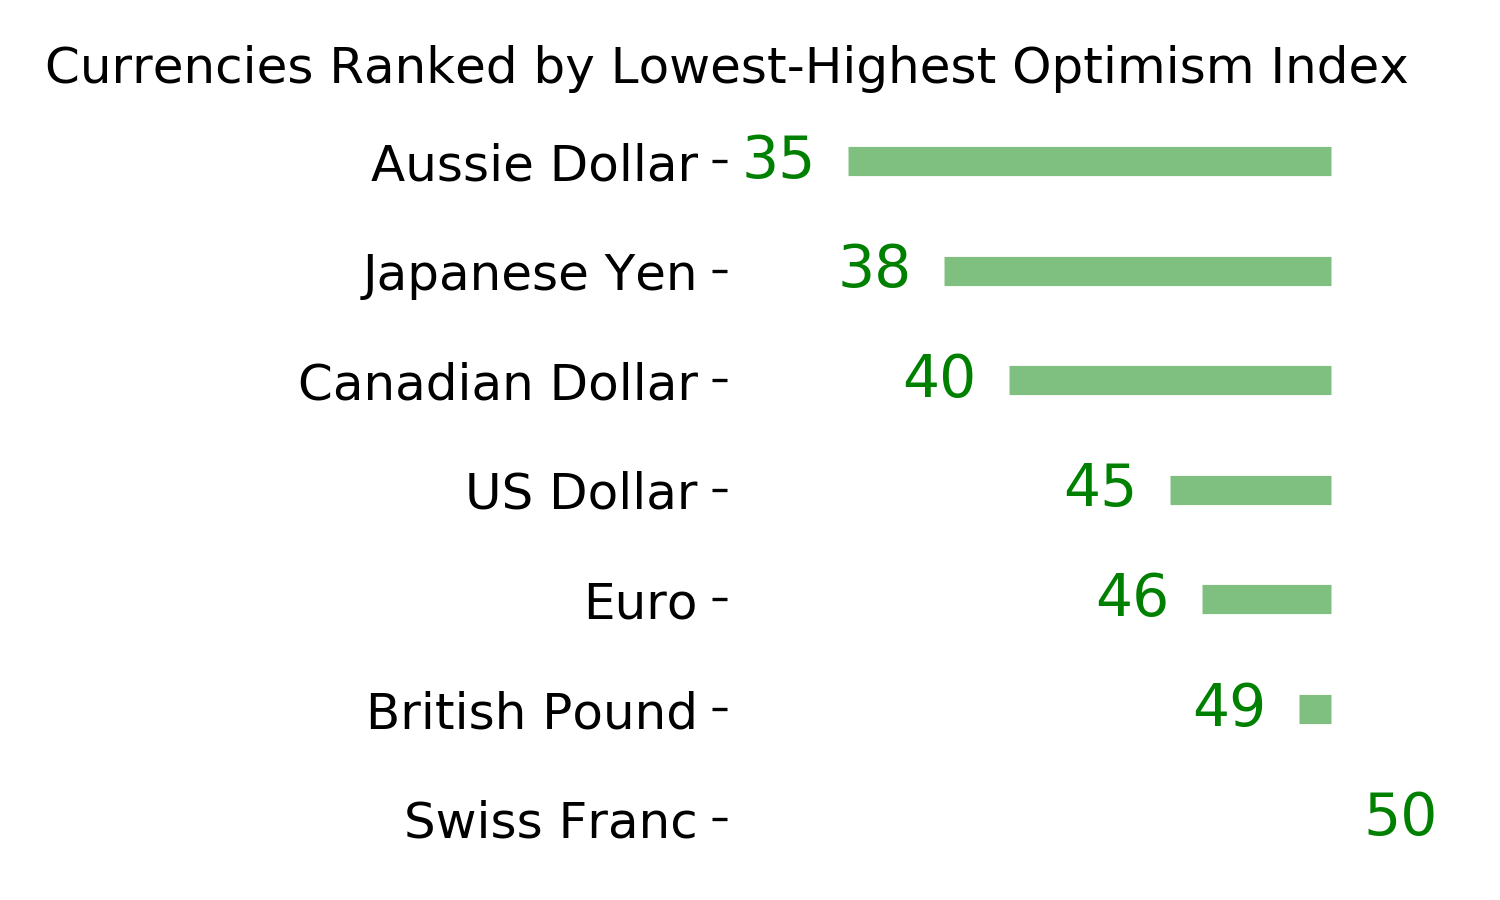
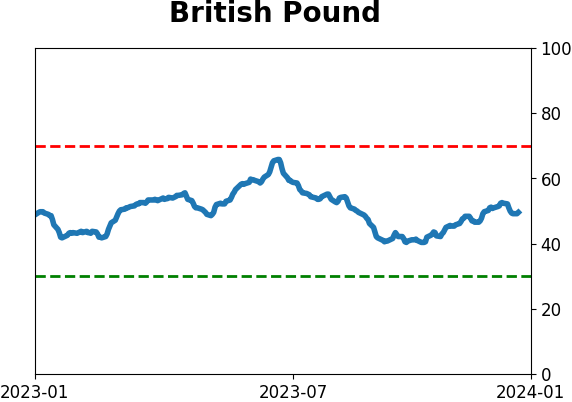
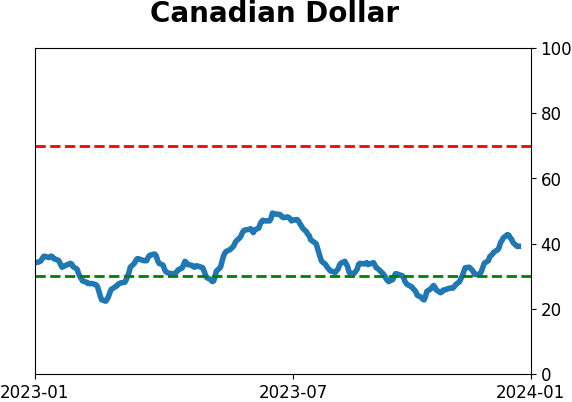
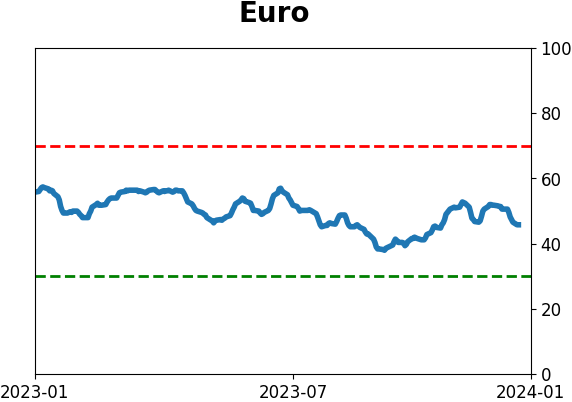
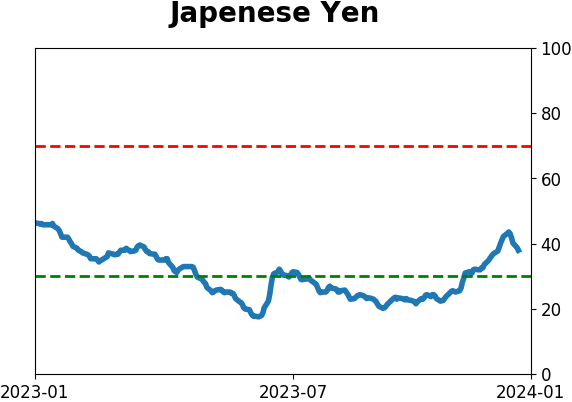
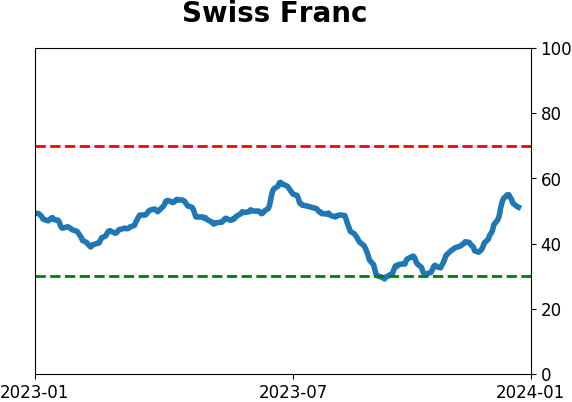
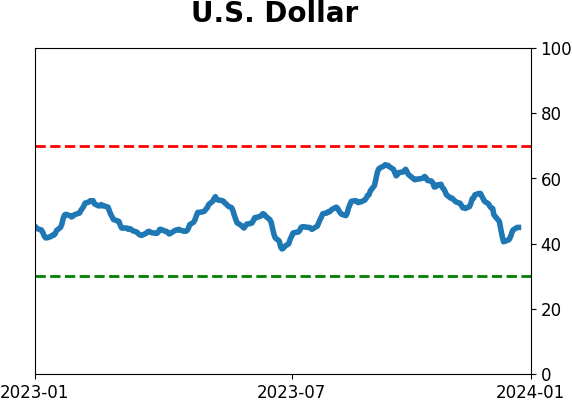
Currency ETF's - 5-Day Moving Average
|
|
|
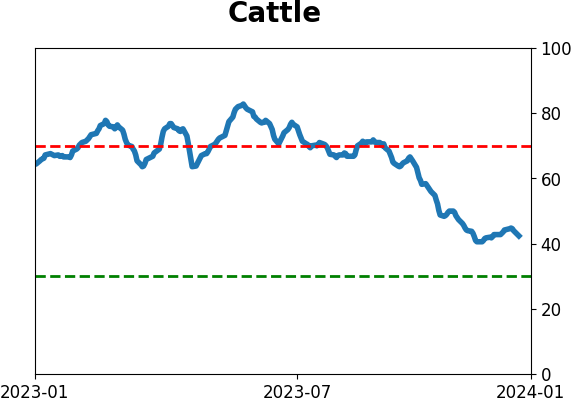
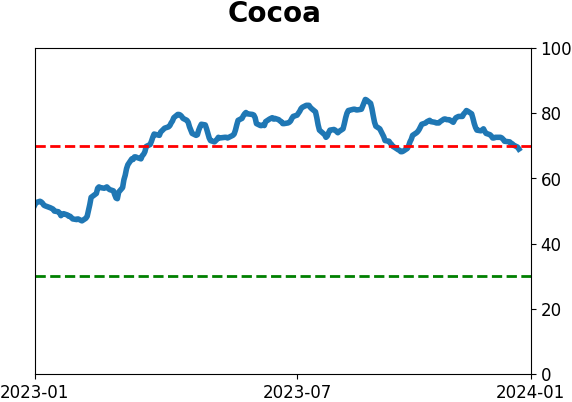
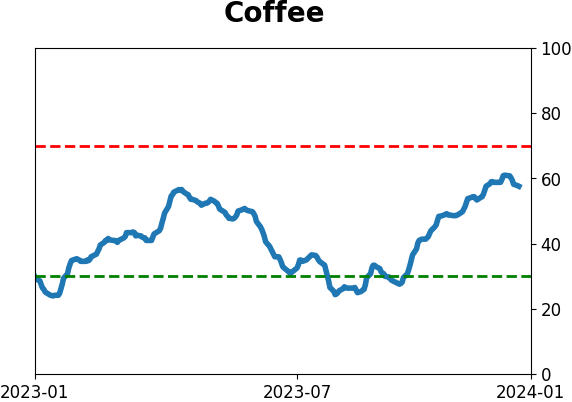
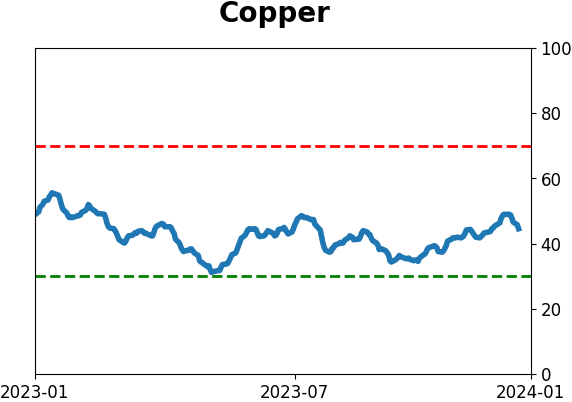
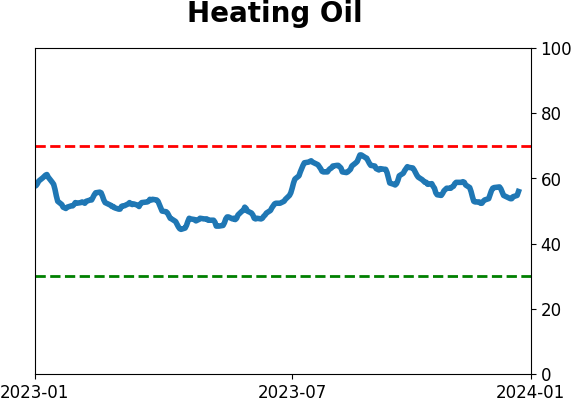
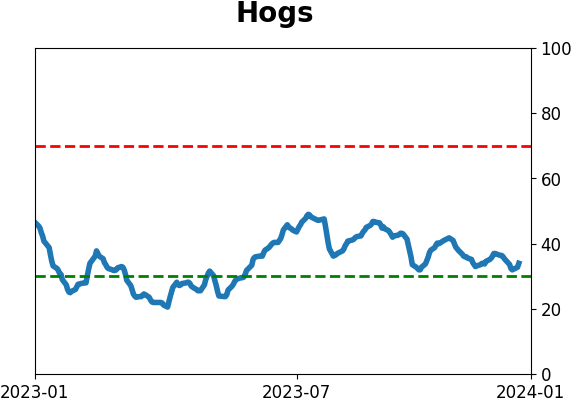
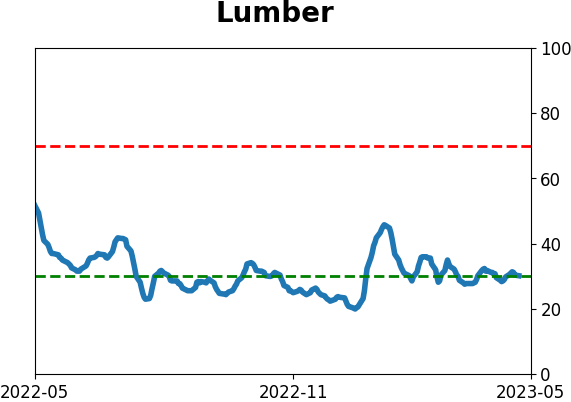
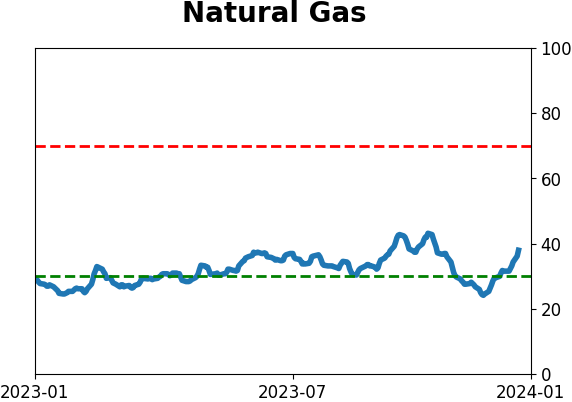
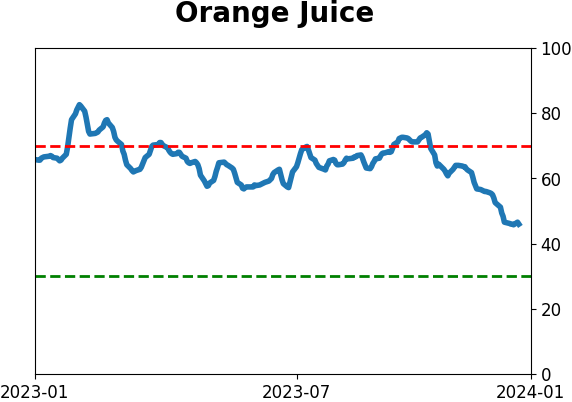
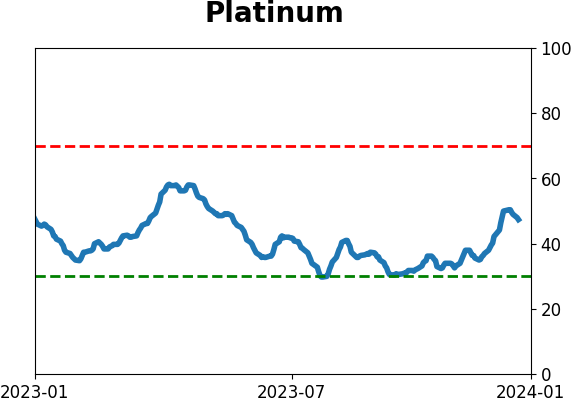
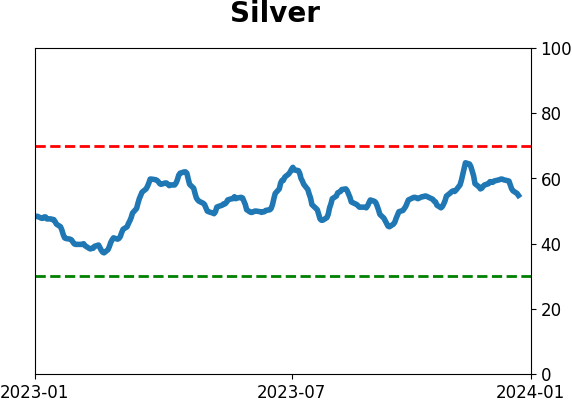
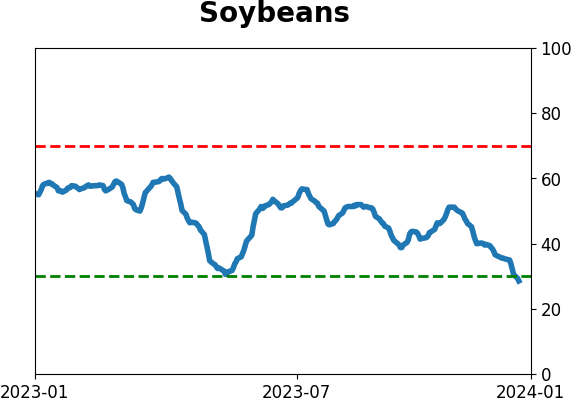
Commodity ETF's - 5-Day Moving Average
|
|