Daily Report : TradingEdge Weekly for Jan 5 - Strong quarter effect, historic internal momentum, bond golden cross

| View/Print a PDF version of this Report |
Headlines
|
TradingEdge Weekly for Jan 5 - Strong quarter effect, historic internal momentum, bond golden cross: This week, we saw that following an angst-free year like 2023 when the S&P 500 had only a couple of closes in negative year-to-date territory, returns tended to be muted. But the average stock is doing great, and internal momentum is historic, conditions which precede long-term gains almost without exception. There are some short-term worries, though. |
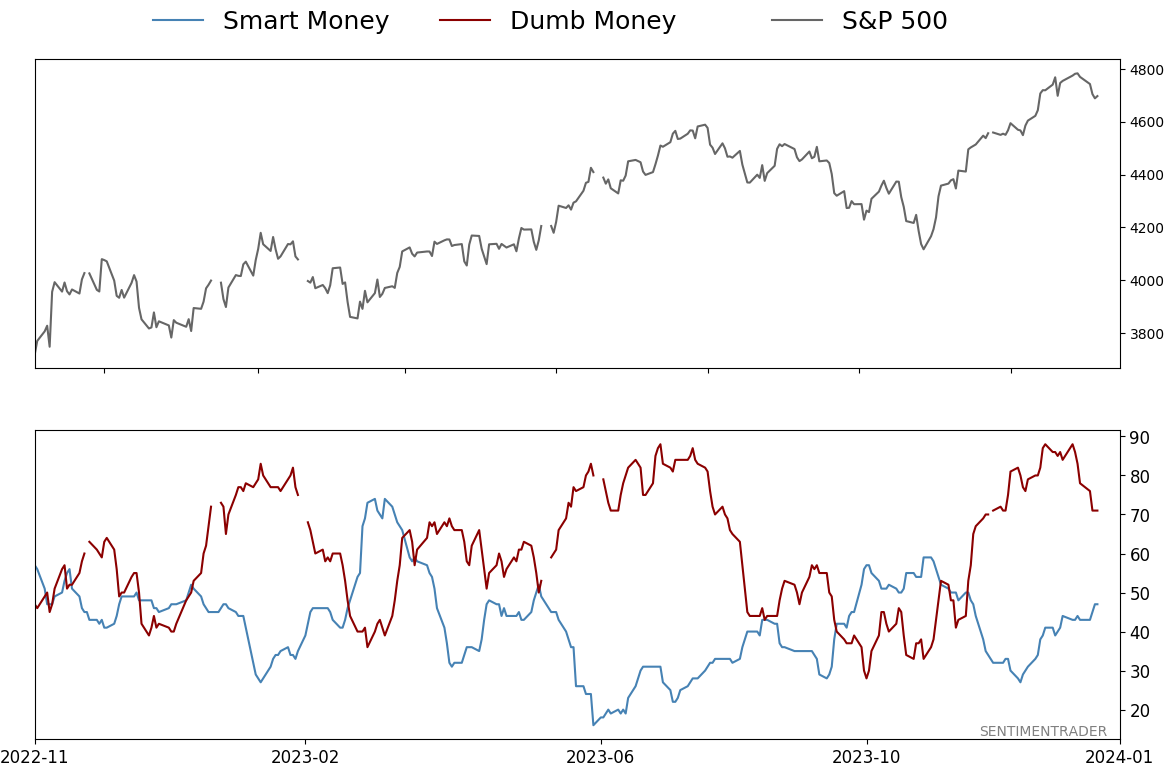
Smart / Dumb Money Confidence
|
|
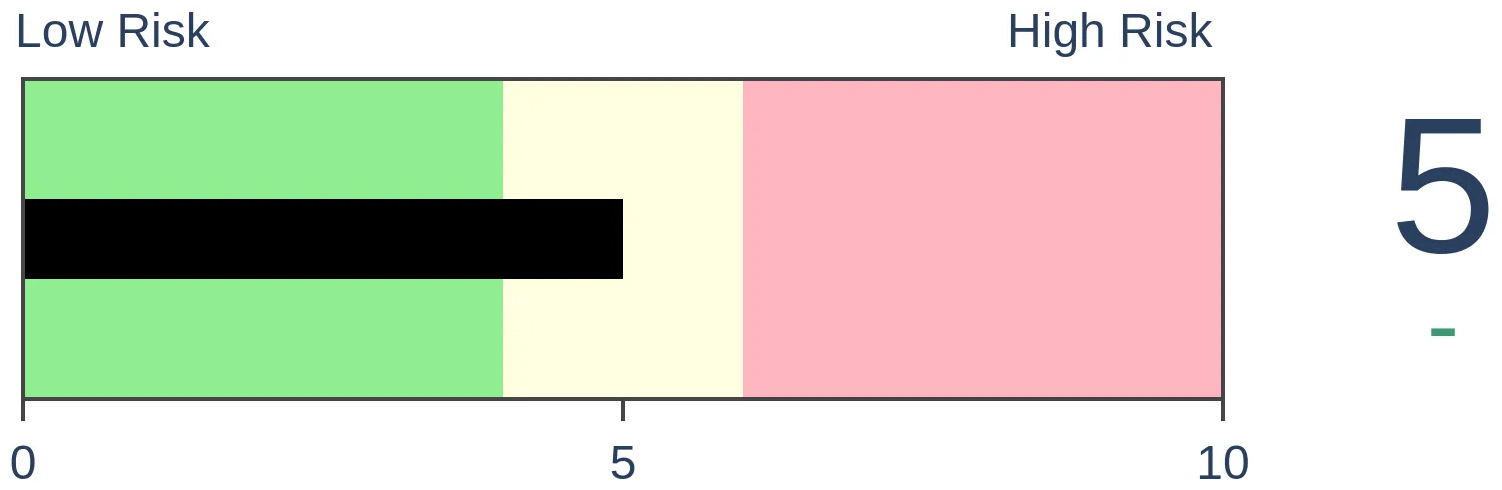
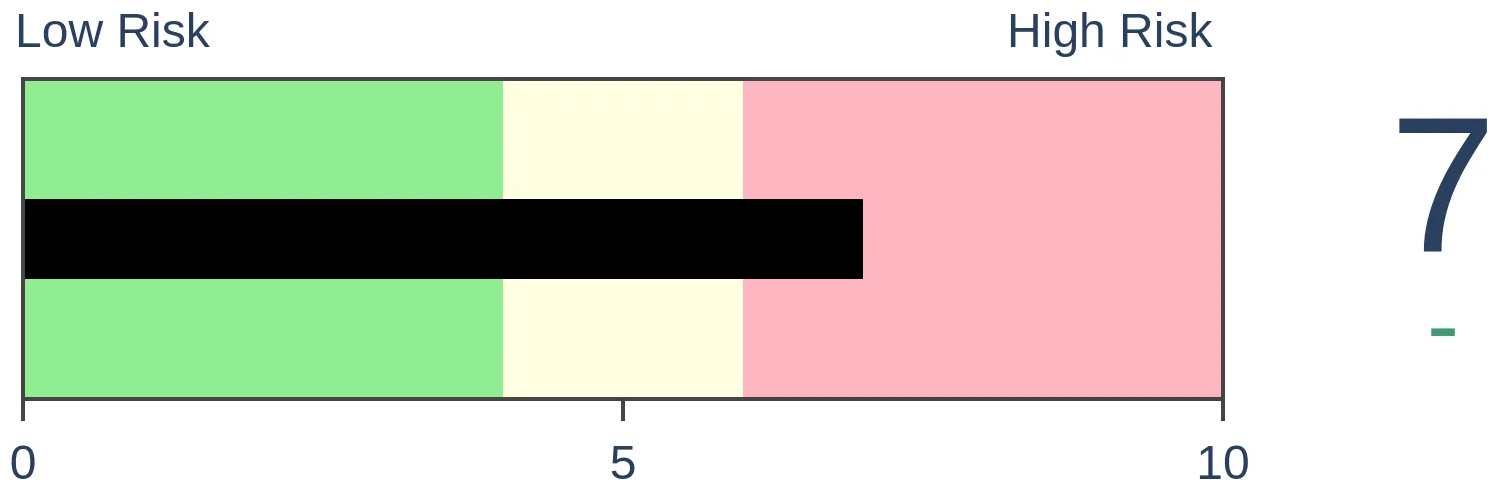
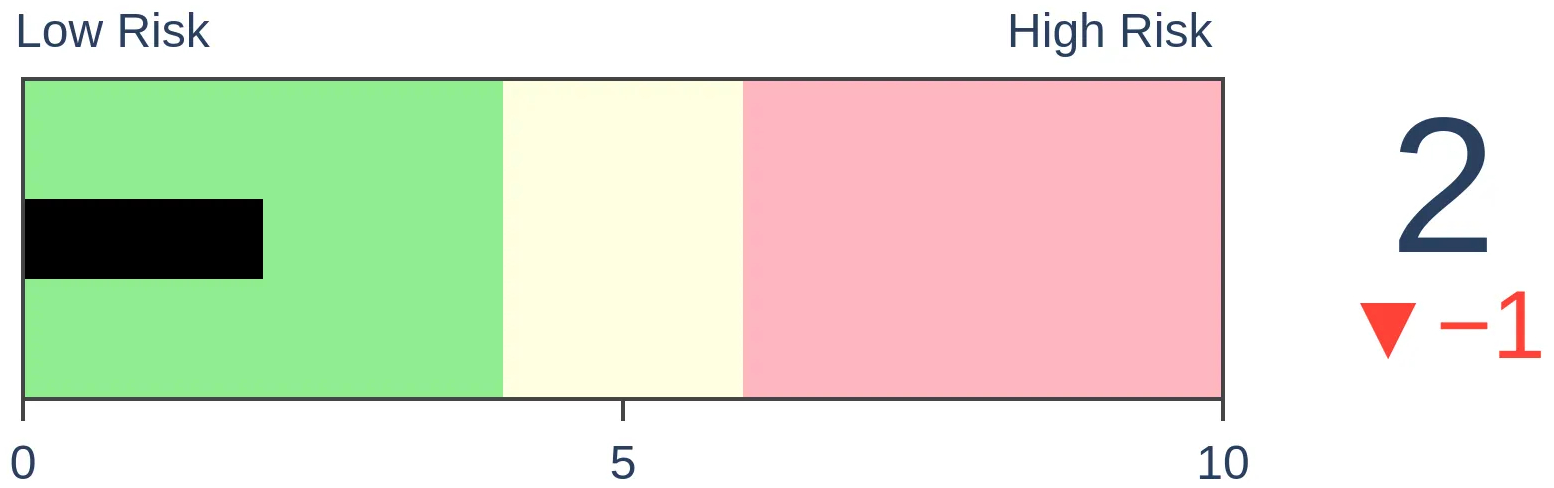
Risk Levels
|
|

|


Research
TradingEdge Weekly for Jan 5 - Strong quarter effect, historic internal momentum, bond golden crossBy Jason GoepfertBOTTOM LINEThis week, we saw that following an angst-free year like 2023 when the S&P 500 had only a couple of closes in negative year-to-date territory, returns tended to be muted. But the average stock is doing great, and internal momentum is historic, conditions which precede long-term gains almost without exception. There are some short-term worries, though. FORECAST / TIMEFRAME |
Key points:
- Strong quarters in stocks tend to beget even more strong quarters
- What happens following an angst-free year
- The average stock has been going great, and trend models have cycled into very positive territory
- Internal momentum in stocks is historic, which has preceded gains virtually without exception
- There are some indicators that are throwing off some (usually shorter-term) warning signs
- There was a Golden Cross in high-yield bonds
Strong quarters beget more strong quarters
The S&P 500 Index surged +11.2% during the fourth quarter of 2023. Jay examined the history of quarterly performance so investors could draw their conclusions about what this might mean going forward. In a word, it's good.
It is a relatively widely accepted opinion that the most bullish thing that stocks can do is go up in price. While that seems pretty evident, strength often tends to beget more strength in the stock market. We analyzed every quarter since 1920, looking at the 3-month returns at the end of every March, June, September, and December.
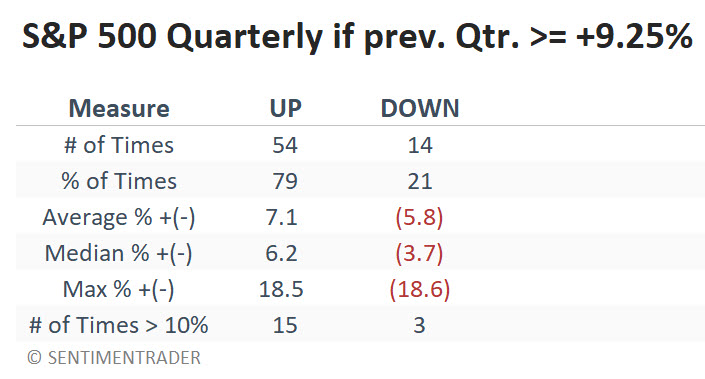
For this test, we will buy and hold the S&P 500 Index for three months at the end of any quarter that shows a gain of 9.25% or more for the S&P 500 Index. The chart below displays the growth of $1 invested in the S&P 500 Index for three months only if the previous quarter ended with a gain of +9.25% or more.
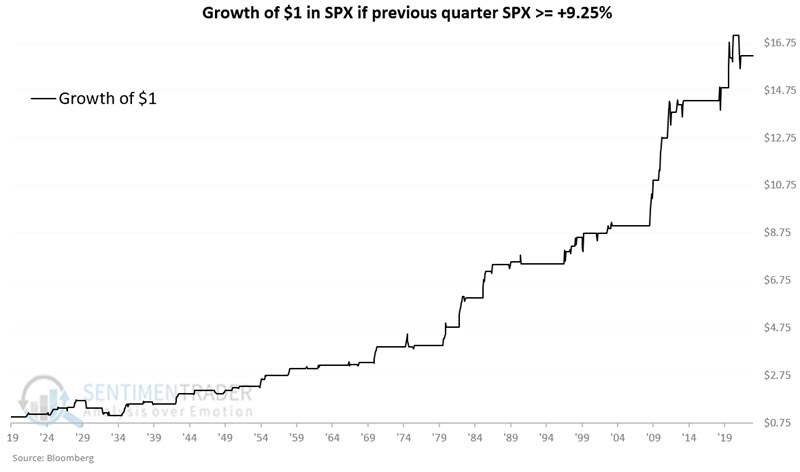
The 1930's saw the market take some hits even after a solid up quarter. Beyond that, the last 90 years have seen pretty consistent performance in the quarter following a +9.25% quarter.
The table below summarizes S&P 500 performance during these quarters. The critical difference from any random quarter is the significantly higher Win Rate (79% versus 64%) and the smaller average and median losses during down quarters. Note also that quarterly gains of +10% or more skew 15-to-3 in favor of up quarters following quarterly gains of +9.25% or more.
Another common theory is that if the stock market gets too far oversold, it will likely rally. For this test, we will buy and hold the S&P 500 Index for three months at the end of any quarter that shows a loss of -15% or more for the S&P 500 Index. The Win Rate was slightly better than average, with 2 of 3 periods (67%) showing a gain.
Now, let's look at all the other quarters inside the extremes. For this test, we will buy and hold the S&P 500 Index for three months at the end of any quarter that shows a return of less than +9.25% and more than -15%. The chart below displays the growth of $1 invested in the S&P 500 Index during these periods
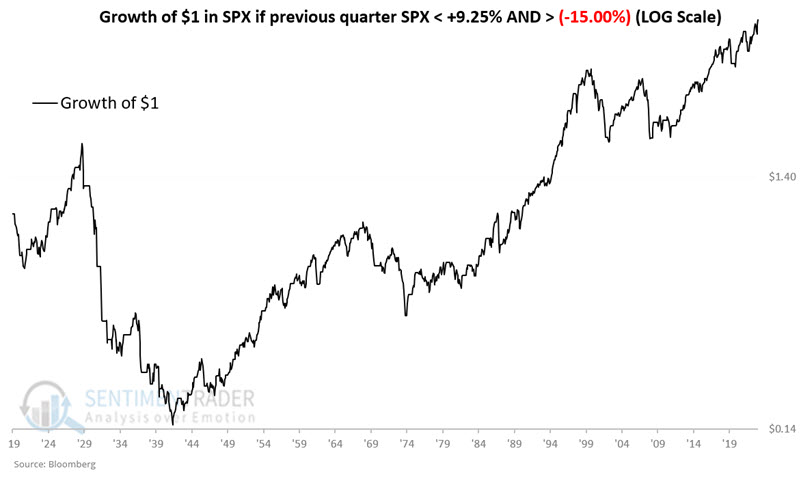
The Win Rate is below average at 60%, and the number of +10% and minus 10% quarters is roughly equal. There appears to be little predictive value to quarters that show a gain of less than +9.25% and more than -15.00%.
The results above seem to confirm an anomaly that confuses many investors. Periods of strength - and periods of extreme weakness - both have a tendency to be followed by better-than-average price performance. While 2024 is off to a highly lackluster start, history suggests the potential for things to improve significantly before the first quarter winds down.
An angst-free year
It was a wonderfully angst-free year for investors in 2023. The most benchmarked index in the world, the S&P 500, spent only two sessions in negative year-to-date (YTD) territory during the entire year.
As much as investors ever deserve anything, they deserved this respite. It followed 2022, one of the worst years in history for financial assets. Last year, by contrast, suffered 248 sessions in negative YTD territory, one of the worst on record.
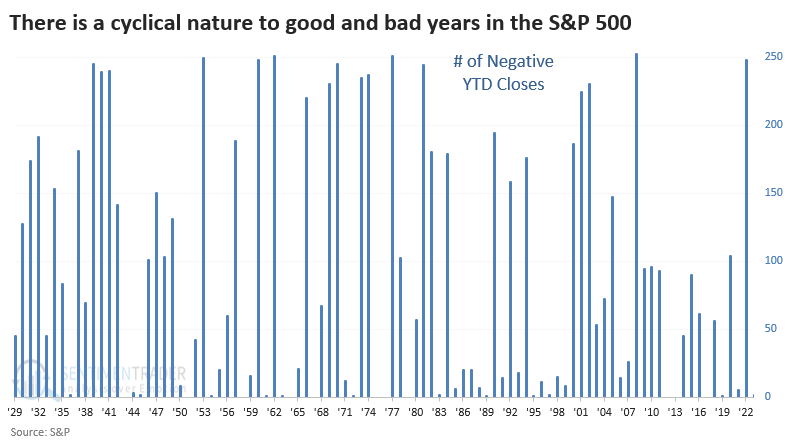
Historically, there has been a slight positive correlation between the number of negative YTD closes one year and the percentage return in the S&P 500 the following year. Most of the S&P's best returns occurred after years with the most closes in negative territory.
After years with two or fewer negative YTD closes, the S&P gained more than +20% the following year only 23% of the time. After years with 100 or more negative closes, 43% of years enjoyed a +20% or greater return.
The table below shows S&P 500 returns after years with the fewest closes in negative YTD territory. While it enjoyed a positive return on average across all time frames, those returns were modest, and the risk/reward was uninspiring. Over the next year, the average risk was -10.6% versus reward of only +13.6%, not a significant edge in any sense.
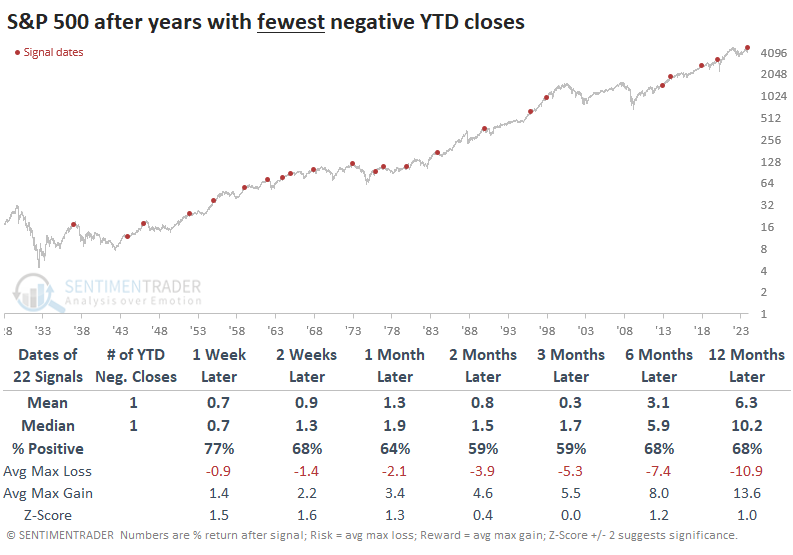
Contrast that with returns following years with the most days when the index was negative YTD. There was a greater tendency to rebound in the short- and long-term, with higher average returns and reward, but also more variability, especially during February-March.
Returning to tendencies following years with few negative YTD days, Small Caps and Value stocks tended to put in the best, most consistent performance. It's a bit surprising that Defensive sectors didn't perform significantly better than Cyclical ones.
While returns following an "easy" year were modest, the average stock is showing positive signs
A composite trend model for the equal-weighted S&P 500 index increased to a perfect score of ten. Dean showed that similar composite shifts led to outstanding results for the index that assigns equal weights to each member.
Now that both internal and external trend indicators are in agreement, the likelihood of the sustainability of the cyclical uptrend that commenced in October 2022 looks more compelling. With a tailwind at our back, traders and investors should concentrate on pinpointing the strongest sectors, industries, and stocks using a simple but effective concept like relative strength.
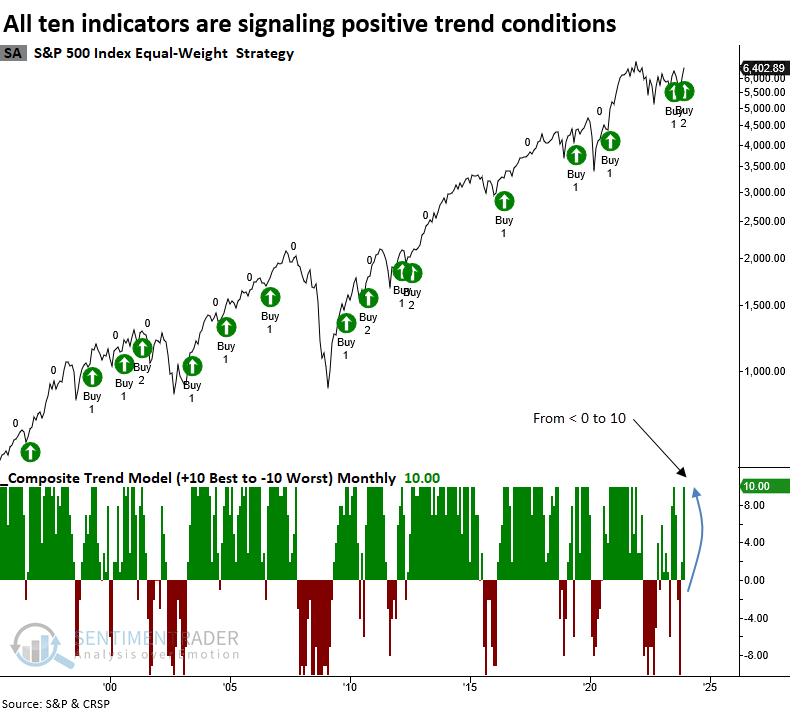
Whenever the composite trend model for the equal-weighted S&P 500 shifted from below zero to a perfect score of ten, the index displayed excellent returns and win rates.
While the previous signal from July 2023 marked a multi-month peak for stocks, the occurrence of a second signal in a five-month period, like now, is a rarity. The last instance of back-to-back alerts in five months or fewer took place in 2012, and it resulted in an exceptionally bullish market.
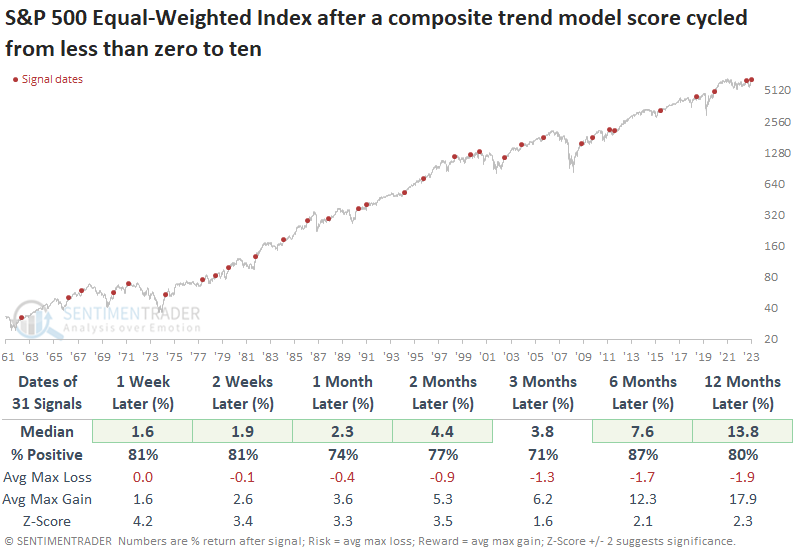
The median return for the equal-weighted S&P 500 index exceeded the cap-weighted version across all time frames, with win rates ranging from 63% to 77%.
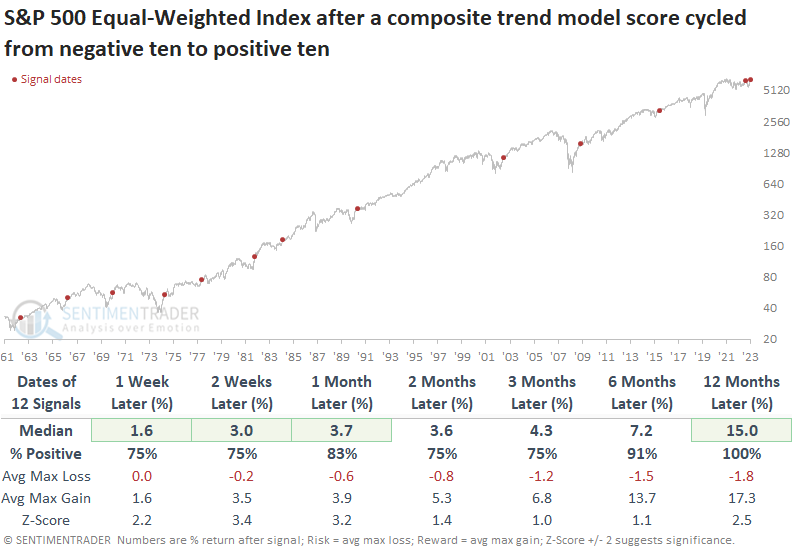
While the sample size is smaller, when the composite cycled from negative ten to positive ten, like now, the equal-weighted S&P 500 index was higher a year later every time.
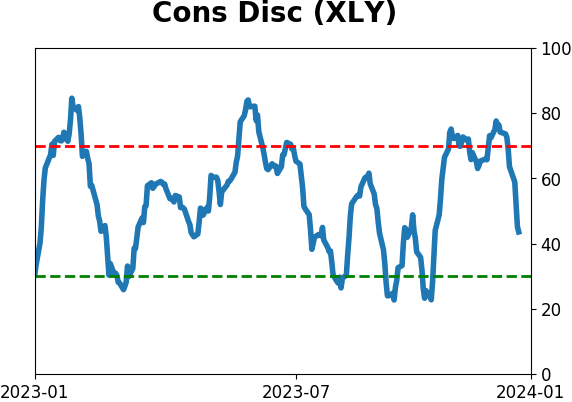
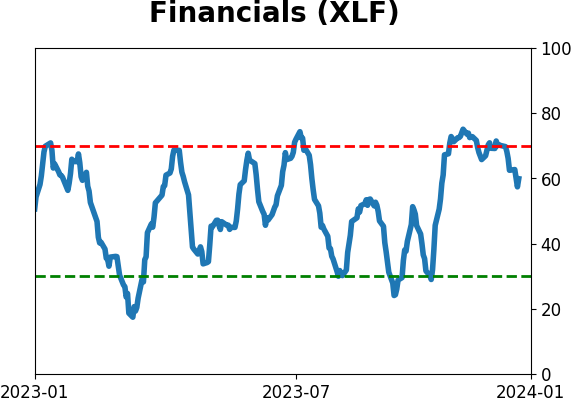
The cap-weighted S&P 500 sectors continue to favor growth-oriented groups like Technology, Consumer Discretionary, and Communication Services, which are dominated by a handful of meg-cap members. However, Financials maintain a positive relative trend score, which is even more pronounced at the industry level.
Internal momentum is historic
We've spent much time since October 2022 discussing internal momentum across indexes and sectors. With the latest push higher, many of those metrics confirm the participation that typically precedes further gains.
The McClellan Summation Index for the NYSE has pushed above +1000 after having been severely oversold. A very high reading is typically a good sign of lasting internal momentum.
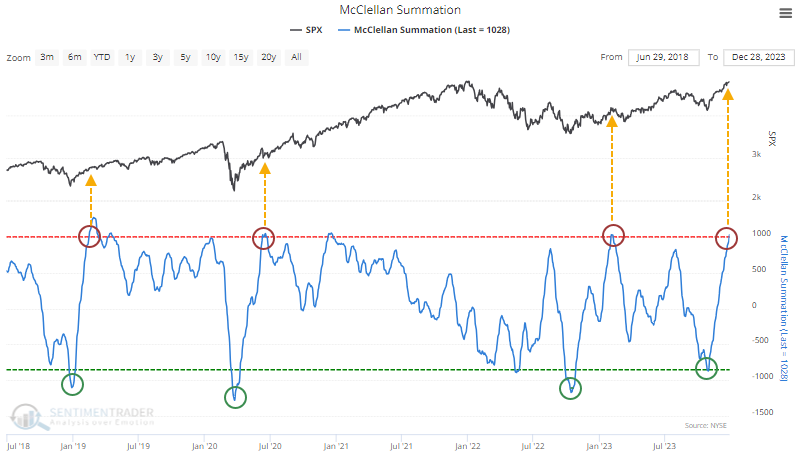
The +1000 level was not breached during prior ongoing bear markets, only when the bear markets had run their courses. It didn't happen at any point during the 2000-02 or 2008 bear markets, or at all during the 1970s and early 80s bears.
Let's go back and look at major negative-to-positive cycles in the Summation Index. The table below shows other times when the indicator cycled from below -850 to above +1000, regardless of how long it took. After these signals, the next couple of weeks were hit-and-miss, but medium- to long-term returns were exceptional, and there were no losses over the next year.
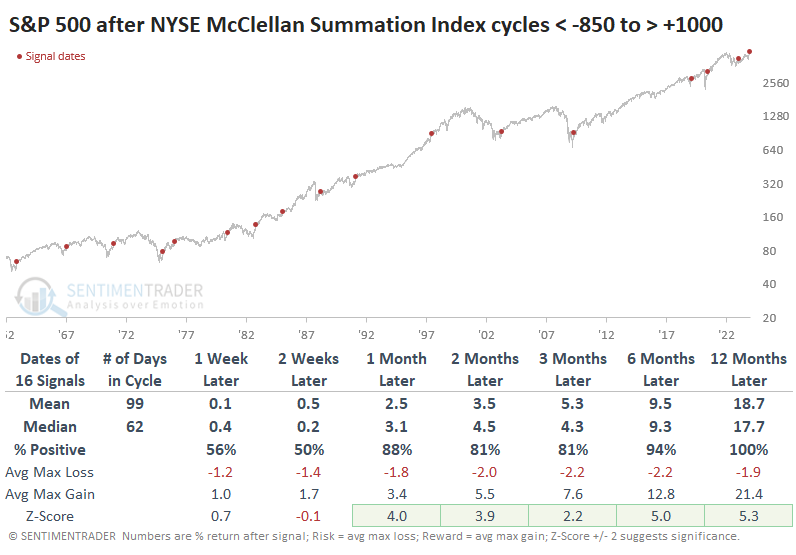
The risk/reward table shows some of the most skewed results we've ever seen. No signal suffered more than a -6.8% drawdown at any point within the following year, yet every signal enjoyed a double-digit gain at some point. After the shortest cycles, when momentum shifted so notably in fewer than 50 sessions, the S&P's future returns were even more impressive.
Scrolling through the McClellan Summation Indexes for other indexes and sectors, a remarkable number are over +1000. A handful of them are at all-time highs.
Perhaps none of these are as important as the one for the S&P 500, the most benchmarked equity index in the world. Its McClellan Summation Index has climbed above +1500 for only the 2nd time in 25 years. If we go back to 1950, it's clear that what we're seeing is historic. Only two other dates reached this level, after bear markets in the 1970s.
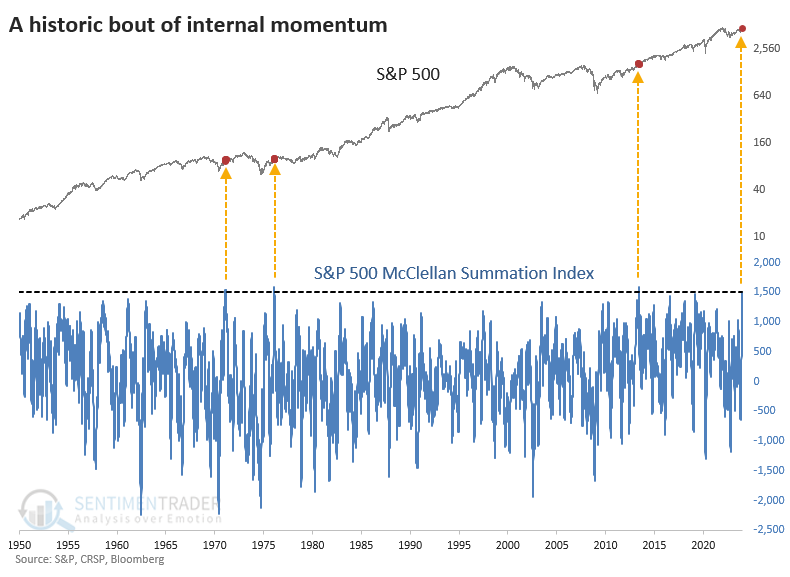
After each of these surges, the S&P had some difficulty adding to its gains over the short term, but overall risk was relatively low up to a year later. If we relax the Summation Index threshold to anything above +1250, we get more precedents and further confirmation that momentum like this is a notable signal for long-term returns. There was only one negative signal from 2018.
Some warning signs
Jay noted that trend-following and momentum indicators suggest that stocks, bonds, and gold are all presently in uptrends. While not enough to trigger a "sell everything" signal, some sentiment warning signs have appeared recently.
The historical action of Dumb Money suggests that they are often wrong at the extremes. As the market declines, they become more gloomy, and as the market rallies, they become more euphoric. The chart below highlights those dates when the 20-day moving average for Dumb Money Confidence crossed above 0.82.
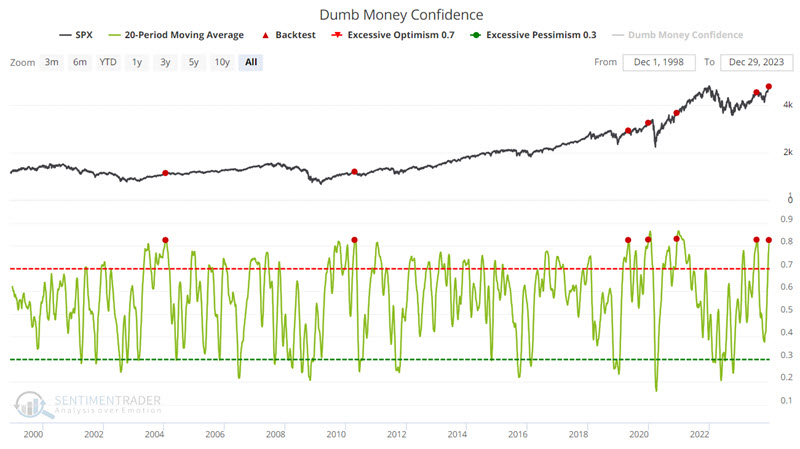
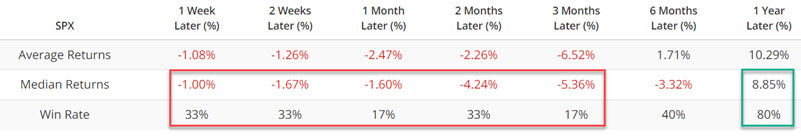
Two key things to note: 1-month and 3-month returns show a Win Rate of just 17%. This suggests the potential for the market to consolidate recent gains in the months ahead. The other key thing to note is the tendency for the market to rally from 3 months to 12 months after a signal.
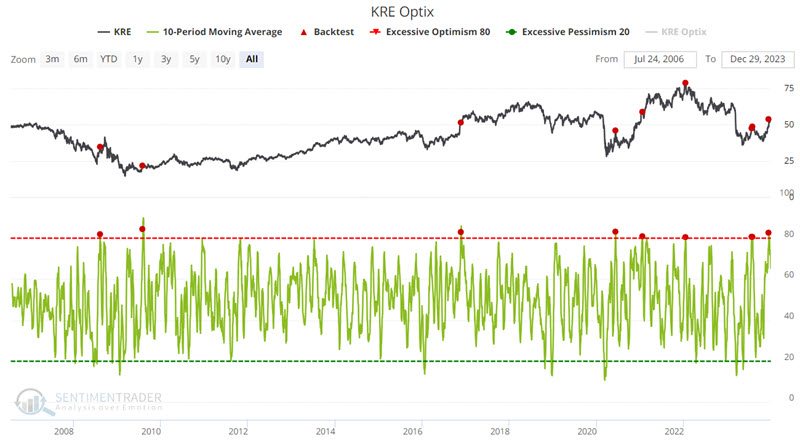
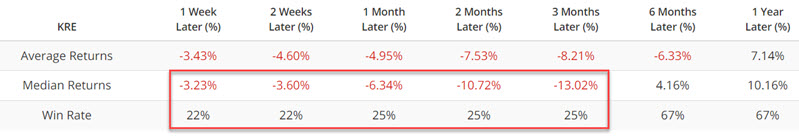
Bank stocks tend to move in bursts. As such, they offer the potential for fast gains and sharp losses. Bank stock trader sentiment also tends to swoop and soar as prices move. The chart below highlights all dates when the 10-day moving average for the SPDR S&P Regional Banking ETF (ticker KRE) Optix crossed above 80%.
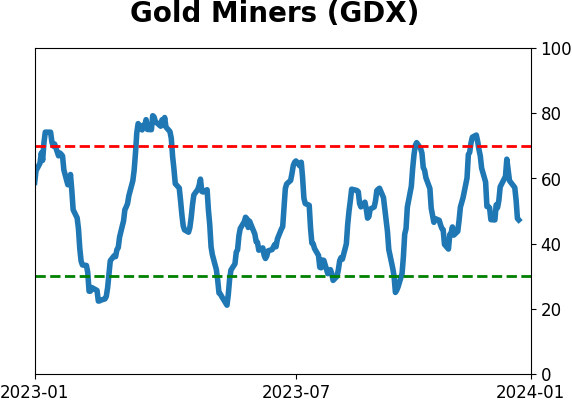
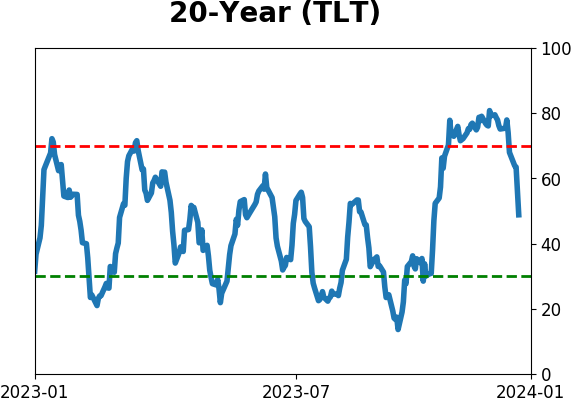
Jay also highlighted recent extremes in bonds (via TLT) and gold miners (via GDX).
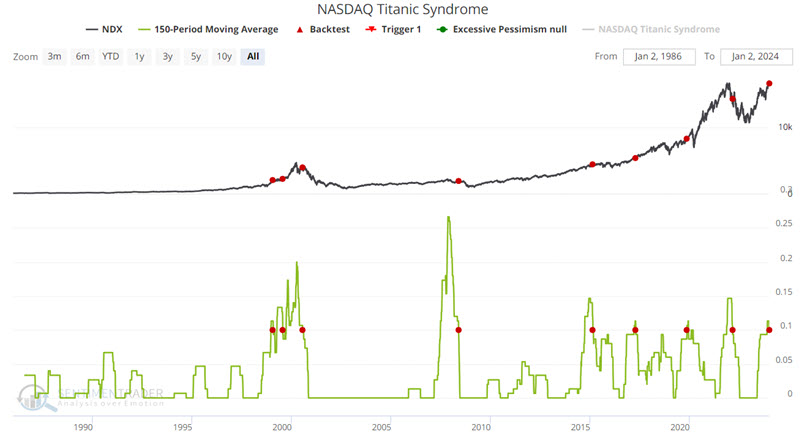
He further noted that the NASDAQ Titanic Syndrome indicator just flashed a warning sign - which has tended to portend short-term market weakness
Bill Omaha created the Titanic Syndrome in the 1960s. It highlights a technical market condition when stocks have recently been at a high, and then there is a sudden jump in new 52-week lows versus highs on the Nasdaq.
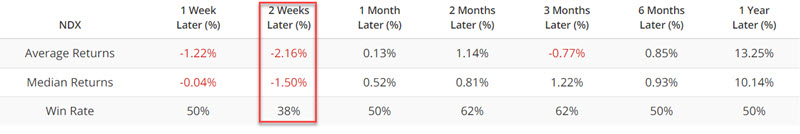
The chart below highlights those dates when the 150-day moving average of the NASDAQ Titanic Syndrome crossed below 0.1 for the first time in three months. The 2017 and 2019 signals were incorrect. All others saw the Nasdaq 100 witness a sharp short-term selloff between one week and two months after the signal date.
While Nasdaq highs and lows appear to be causing potential short-term trouble, they may also have set the stage for another leg higher in 2024. Jay looked at the position of the Nasdaq High/Low Ratio and the Panic/Euphoria model, which are suggesting that any short-term weakness would likely be just that - short-term.
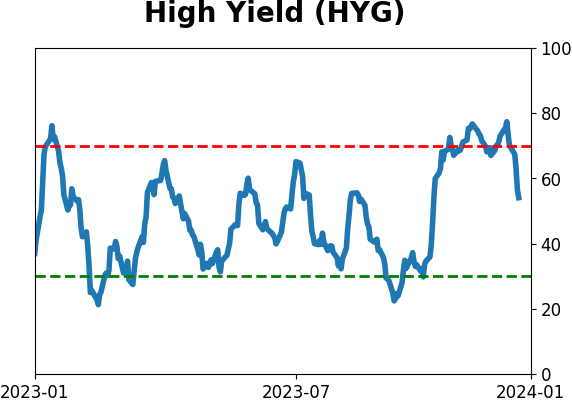
A Golden Cross for high-yield bonds
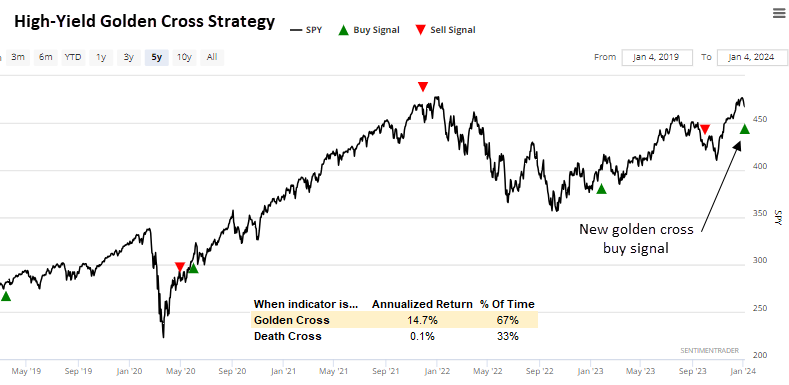
Dean noted that the advance-decline line for high-yield bonds registered a golden cross buy alert, signaling risk-on for stocks. Golden cross signals produced excellent returns for the S&P 500, especially compared to death cross periods.
One critical driver of the improvement in the stock market has been bond yields, as they have fallen sharply, with the FOMC signaling a pause in the interest hiking cycle. With Treasury yields reversing from uptrends to downtrends, high-yield bonds, the most economically sensitive category in corporate credit, surged higher, producing a bullish market breadth backdrop.
On Thursday, the high-yield bond landscape gained additional encouraging news as its advance-decline line triggered a golden cross buy signal. A golden cross occurs when the advance-decline line 50-day moving average crosses above the 200-day average, indicating more high-yield bonds are rising than falling.
When high-yield bonds trigger a golden cross alert, the S&P 500 produces an impressive 14.7% annualized return. Conversely, a death cross signal reduces the world's most benchmarked index to an annualized return of only 0.01%.
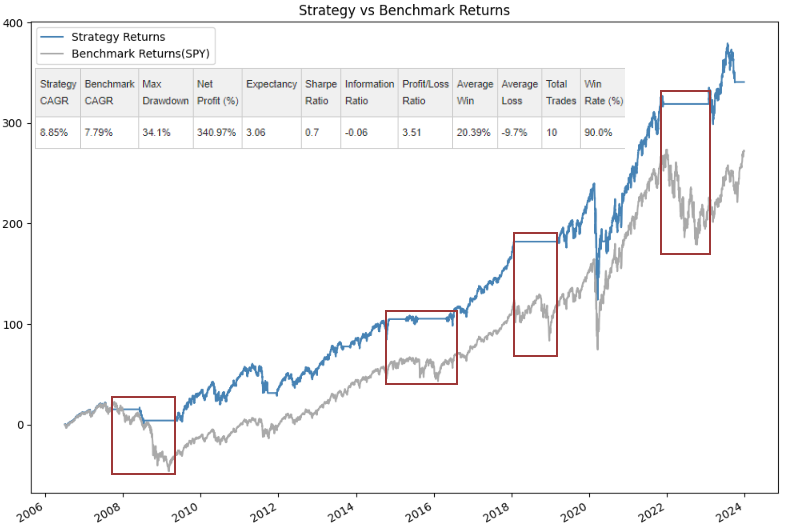
While the strategy slightly outperforms buy-and-hold, with a CAGR of 8.85% versus 7.79% for the S&P 500, the true value lies in its ability to sidestep substantial drawdowns.
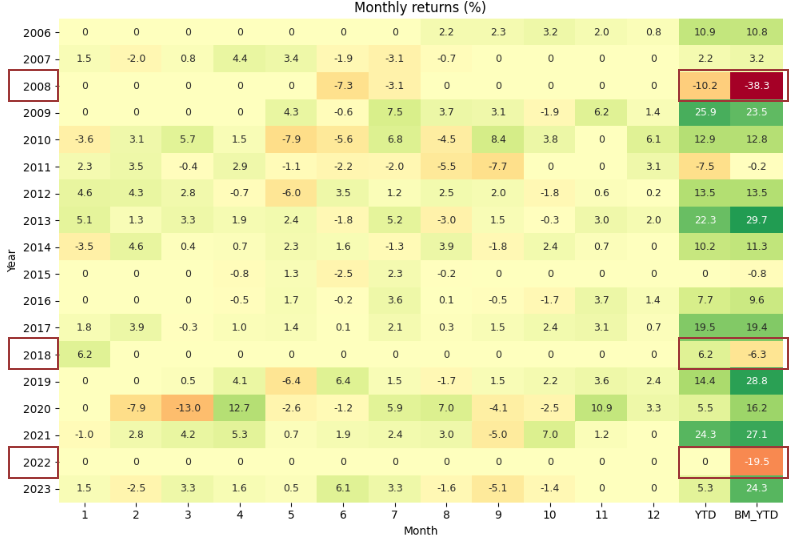
The avoidance of significant drawdowns was clearly evident in 2008, 2018, and 2022. The "YTD" and "Benchmark YTD" columns are new additions to the monthly returns table so an investor can compare the strategy's returns to a benchmark index.
The strategy is even more impressive when switching into other assets, such as GLD, during the negative periods.
About TradingEdge Weekly...
The goal of TradingEdge Weekly is to summarize some of the research published to SentimenTrader over the past week. Sometimes there is a lot to digest, and this summary highlights the highest conviction or most compelling ideas we discussed. This is NOT the published research; rather, it pulls out some of the most relevant parts. It includes links to the published research for convenience, and if you don't subscribe to those products, it will present the options for access.
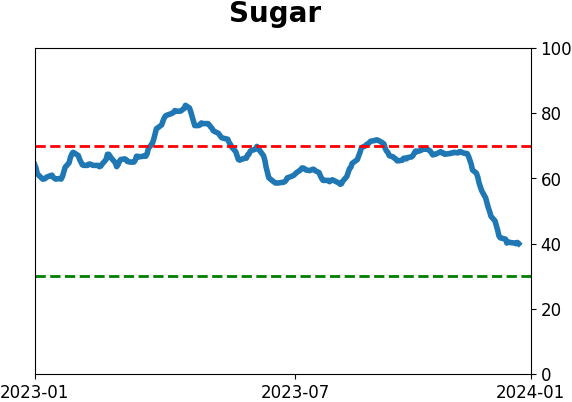
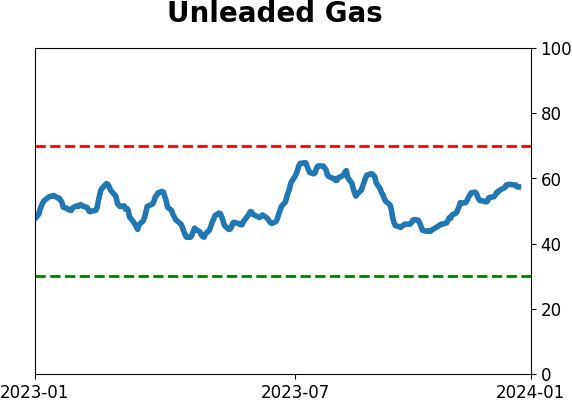
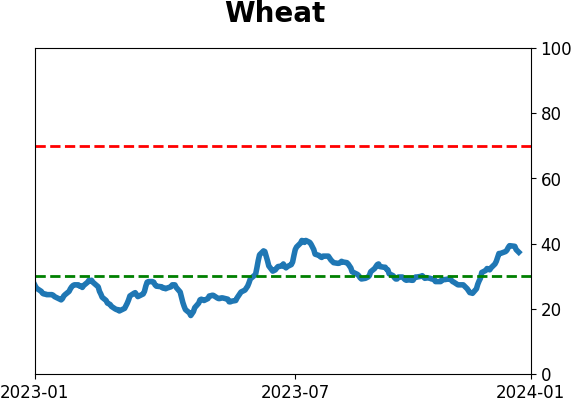
Indicators at Extremes
|
|
|
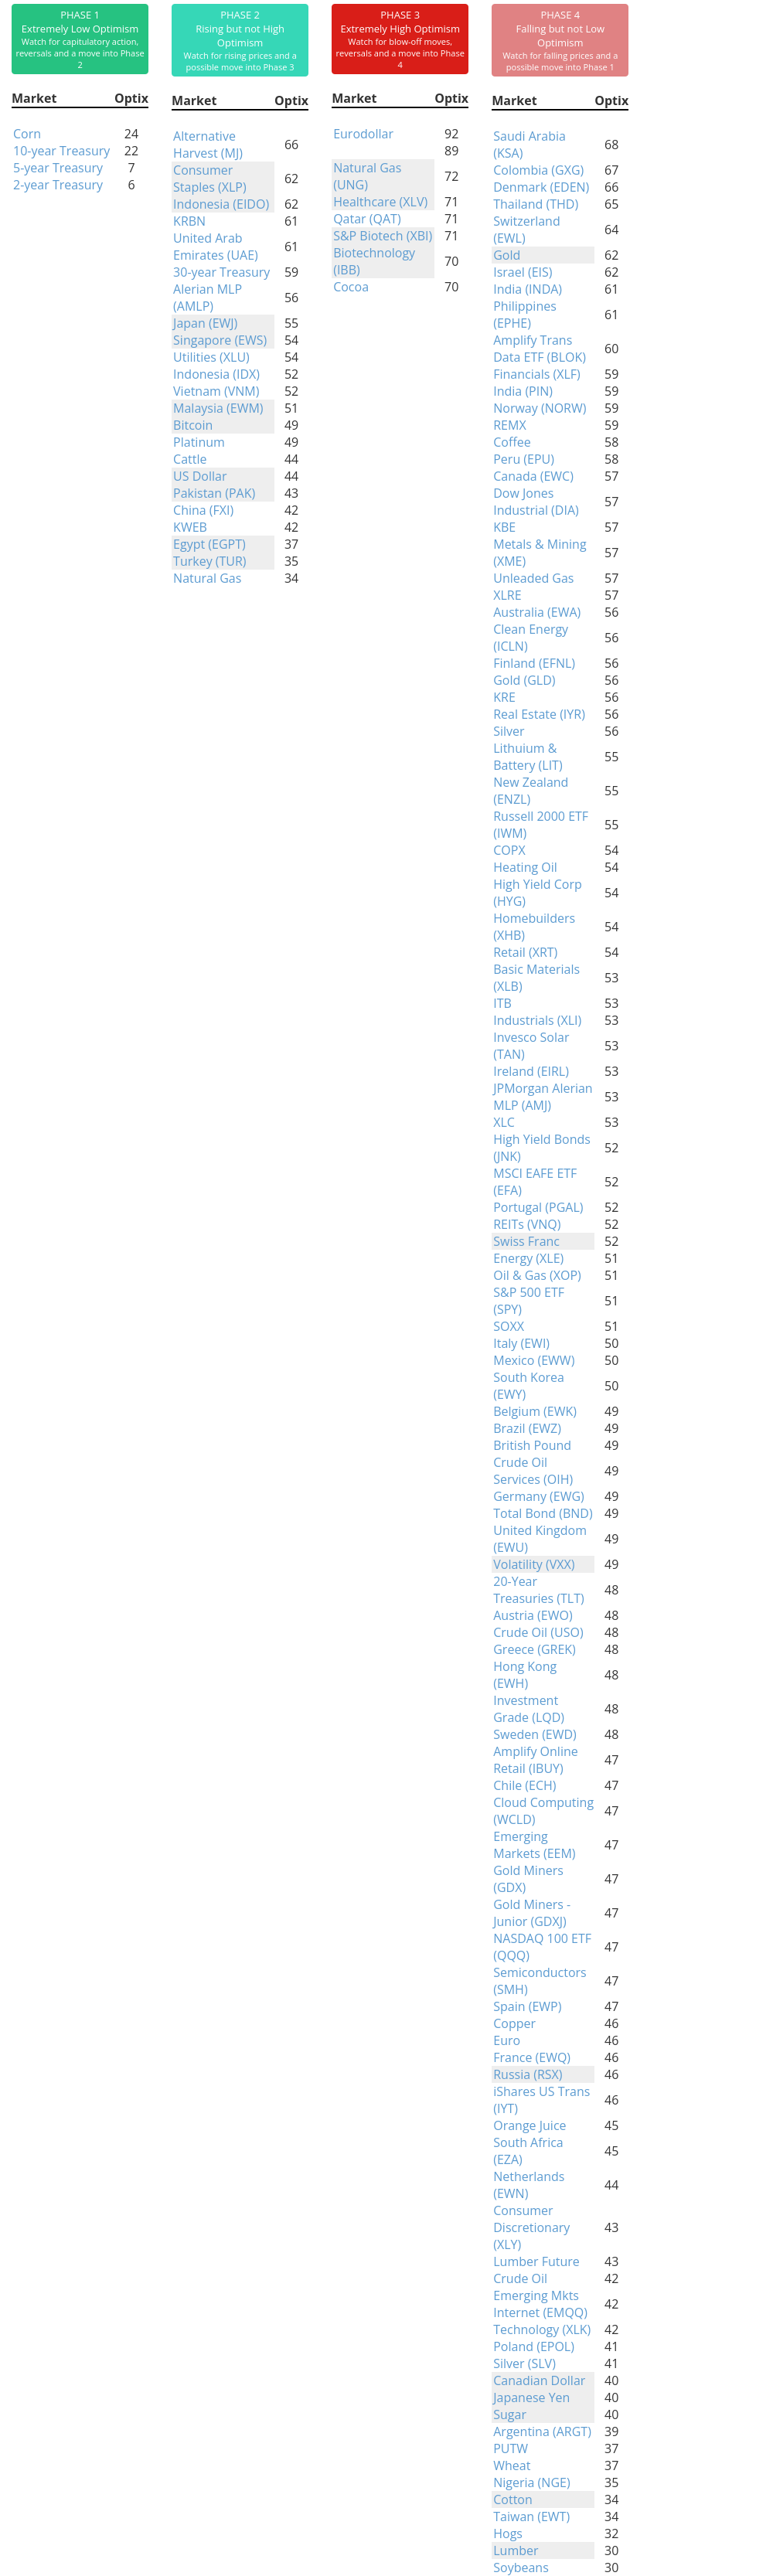
Phase Table
|
|
|
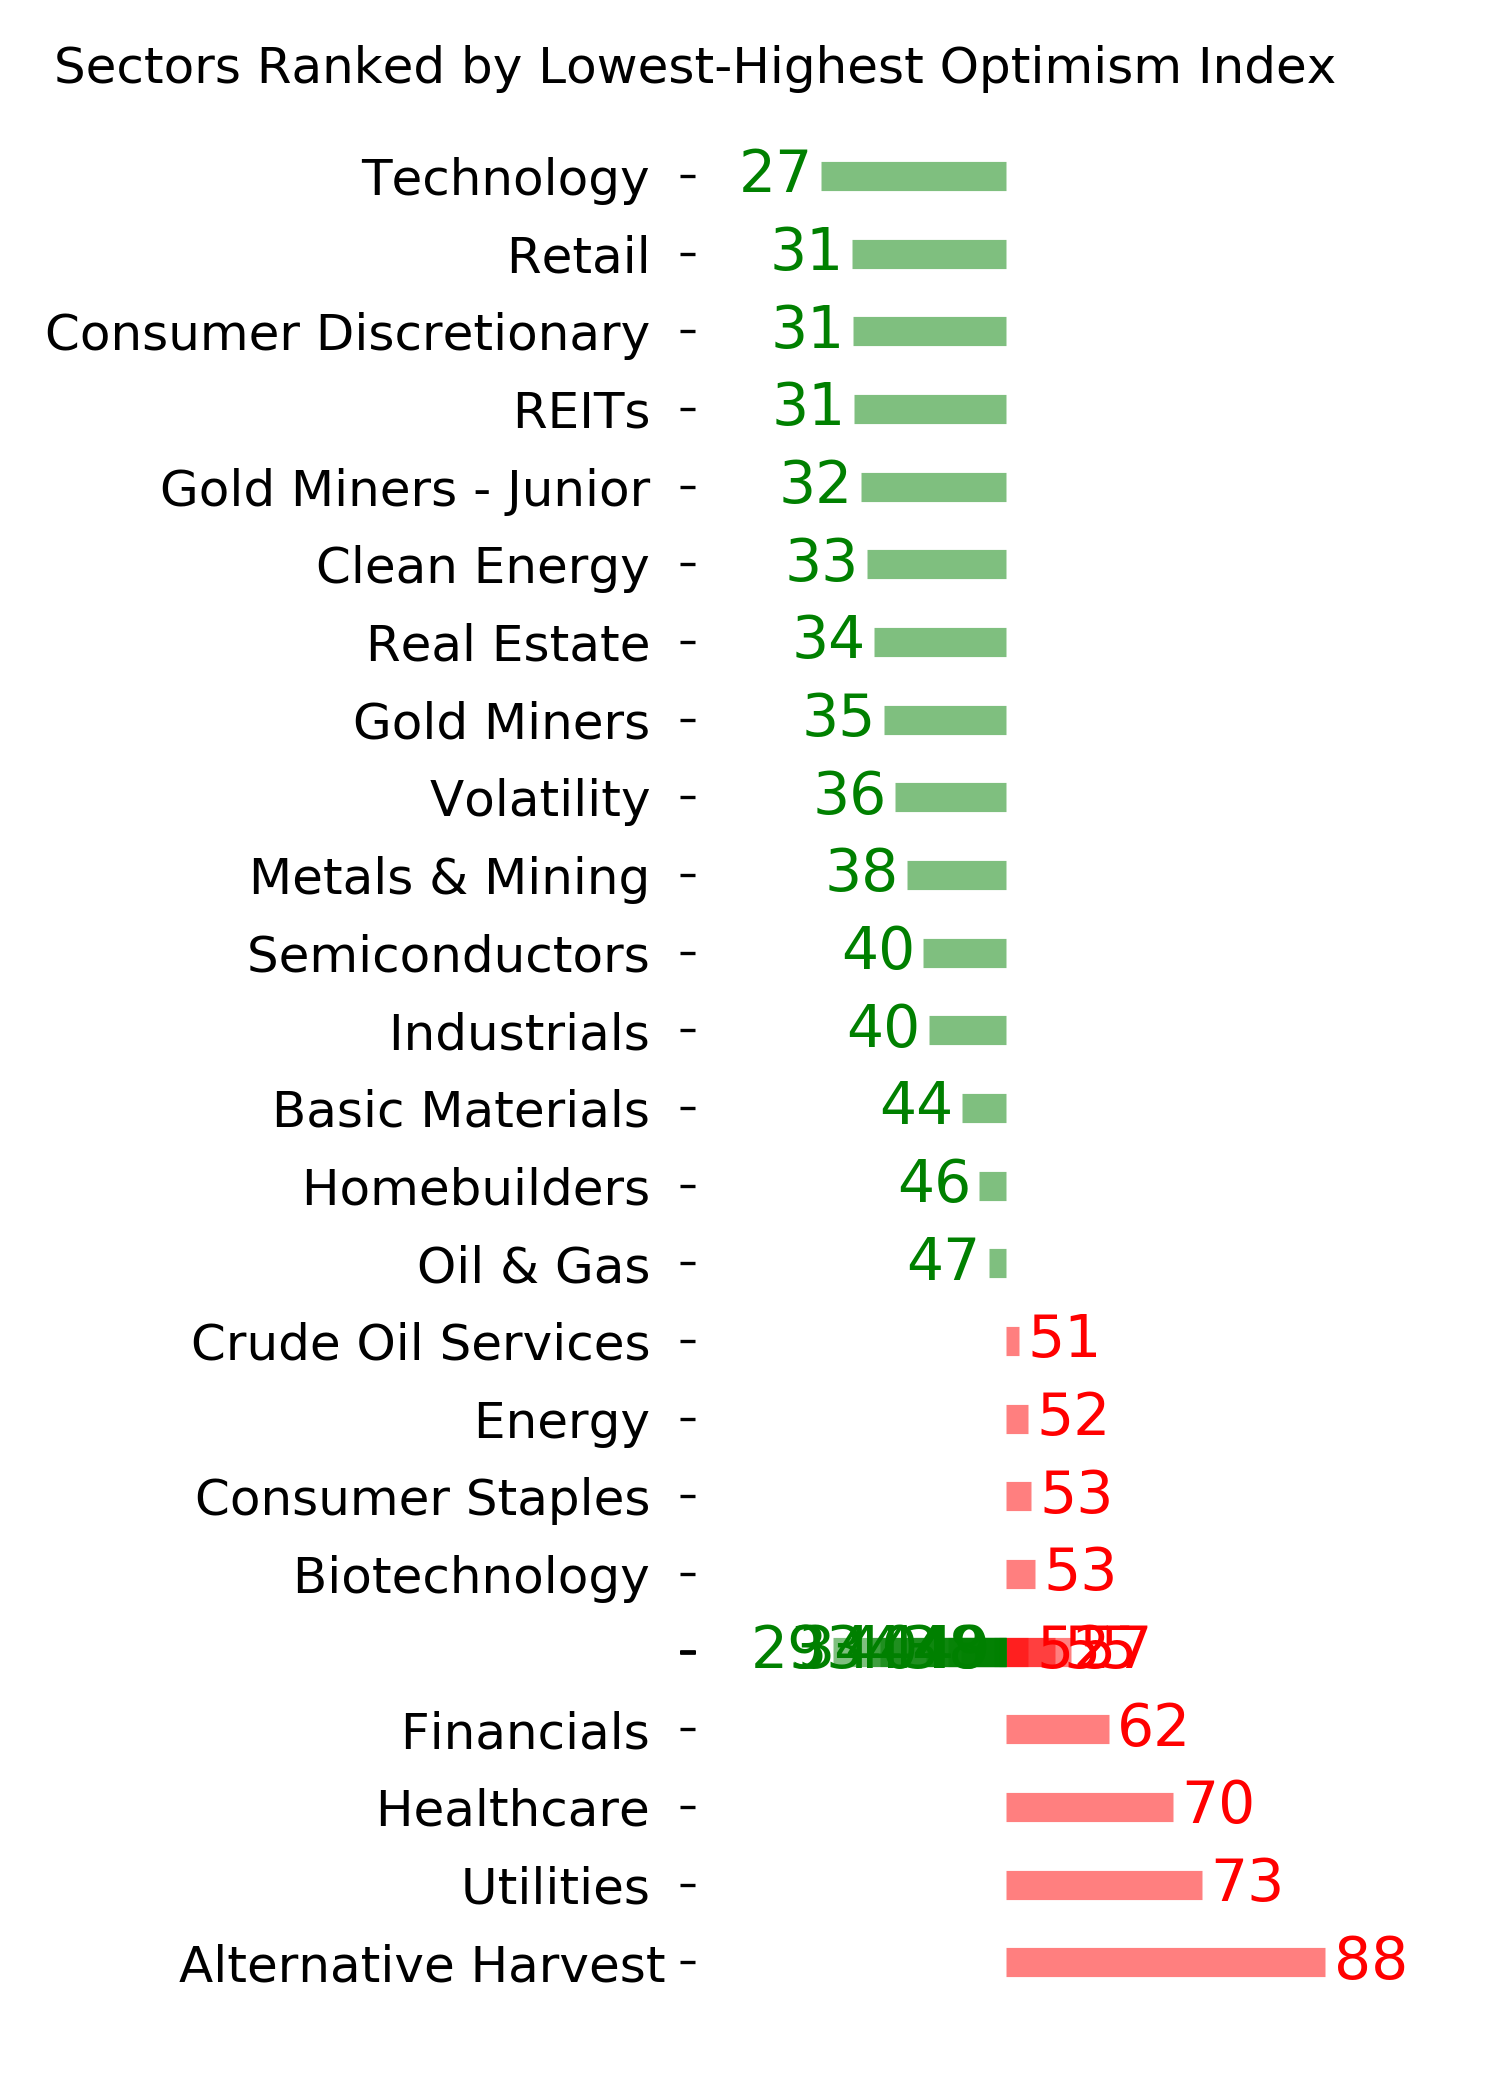
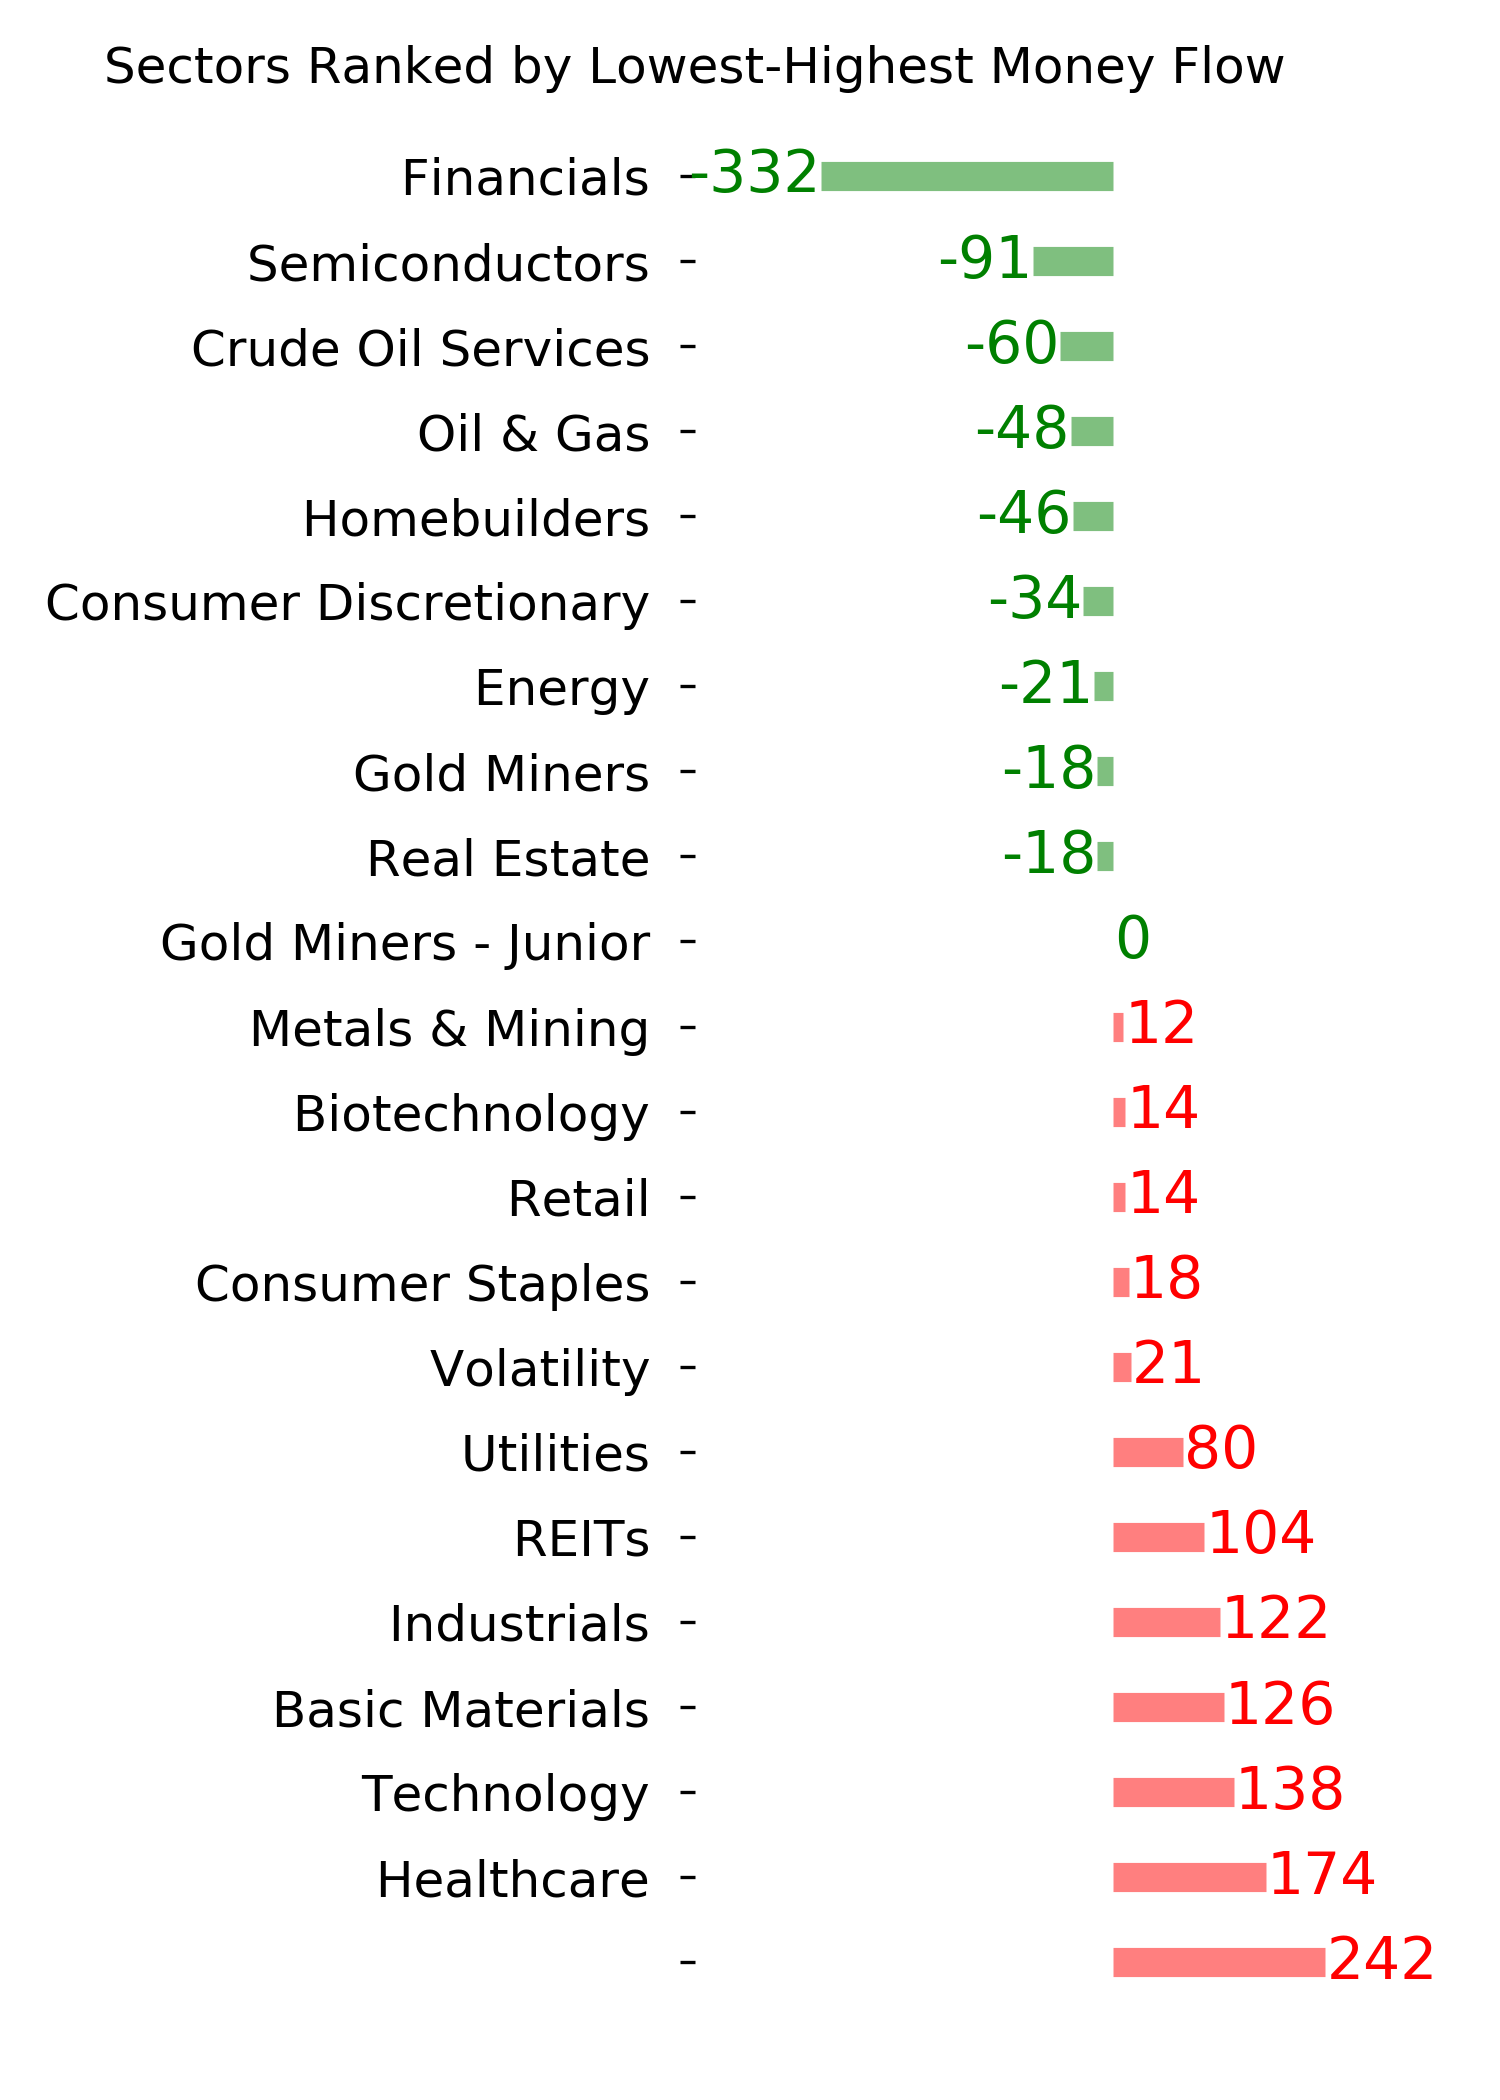
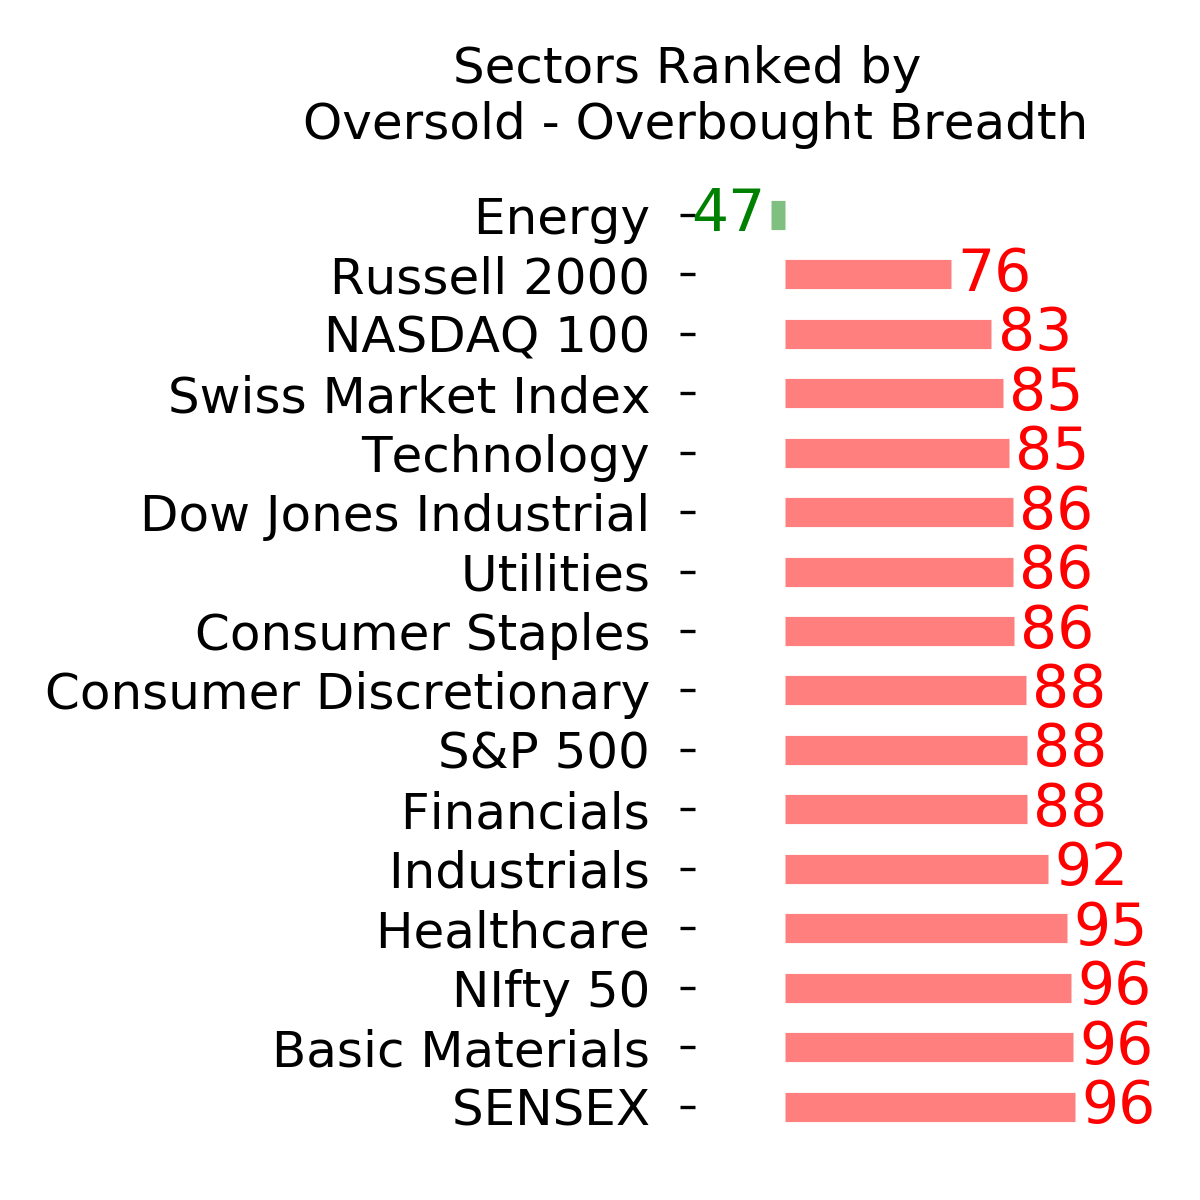
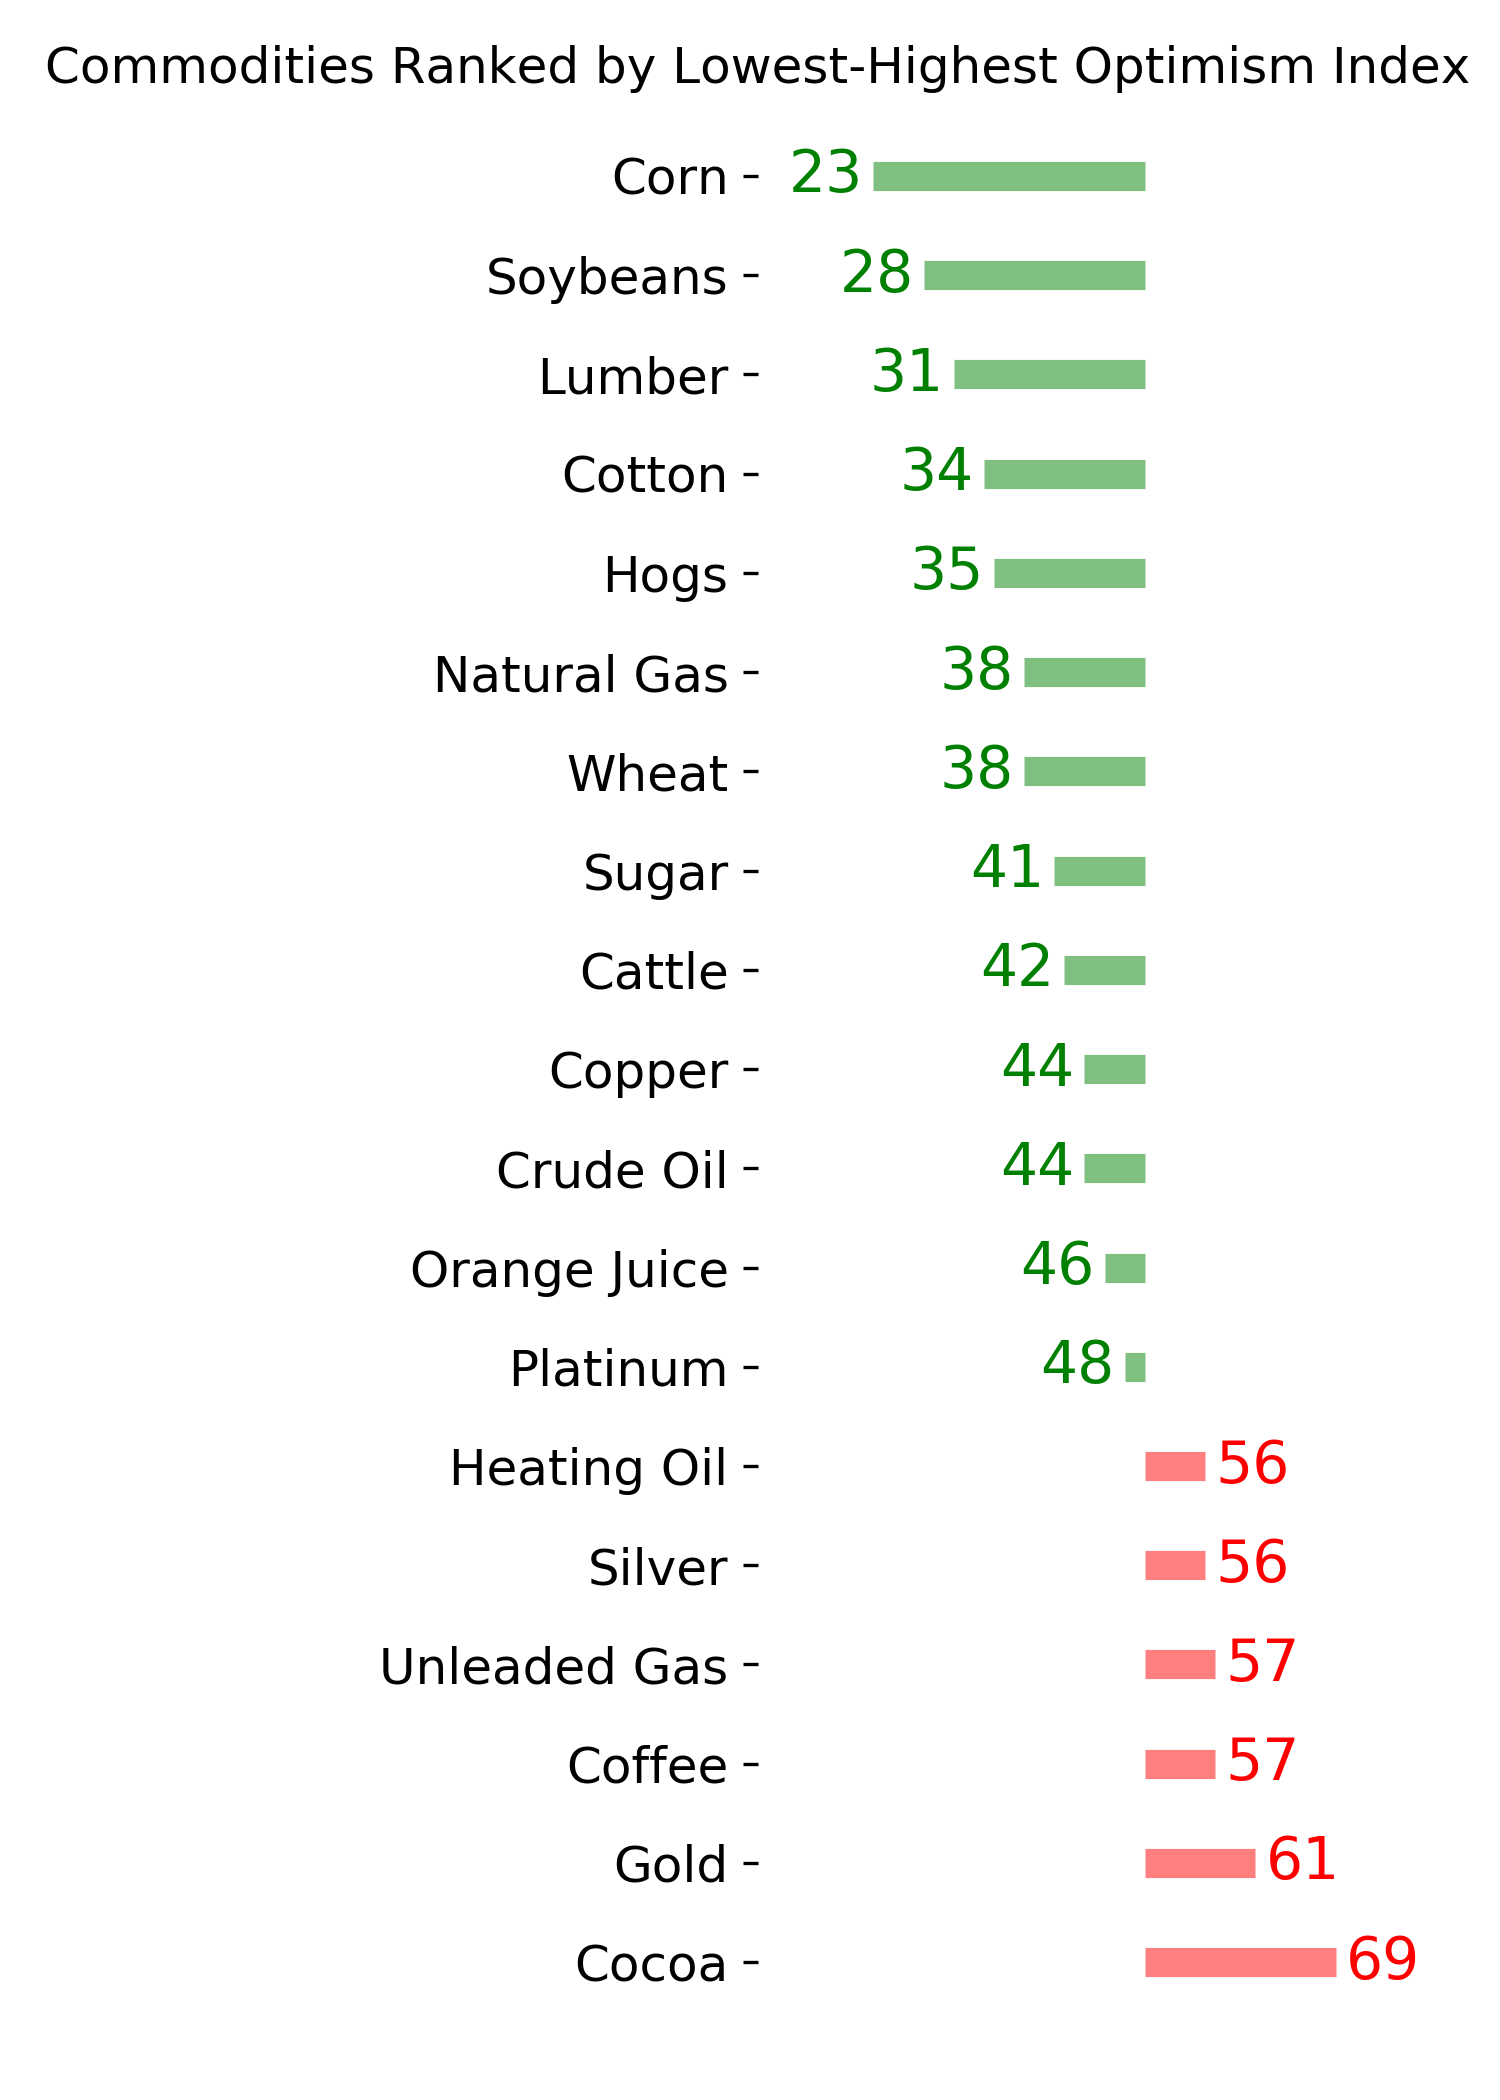
Ranks
|
|
|
|
|
|
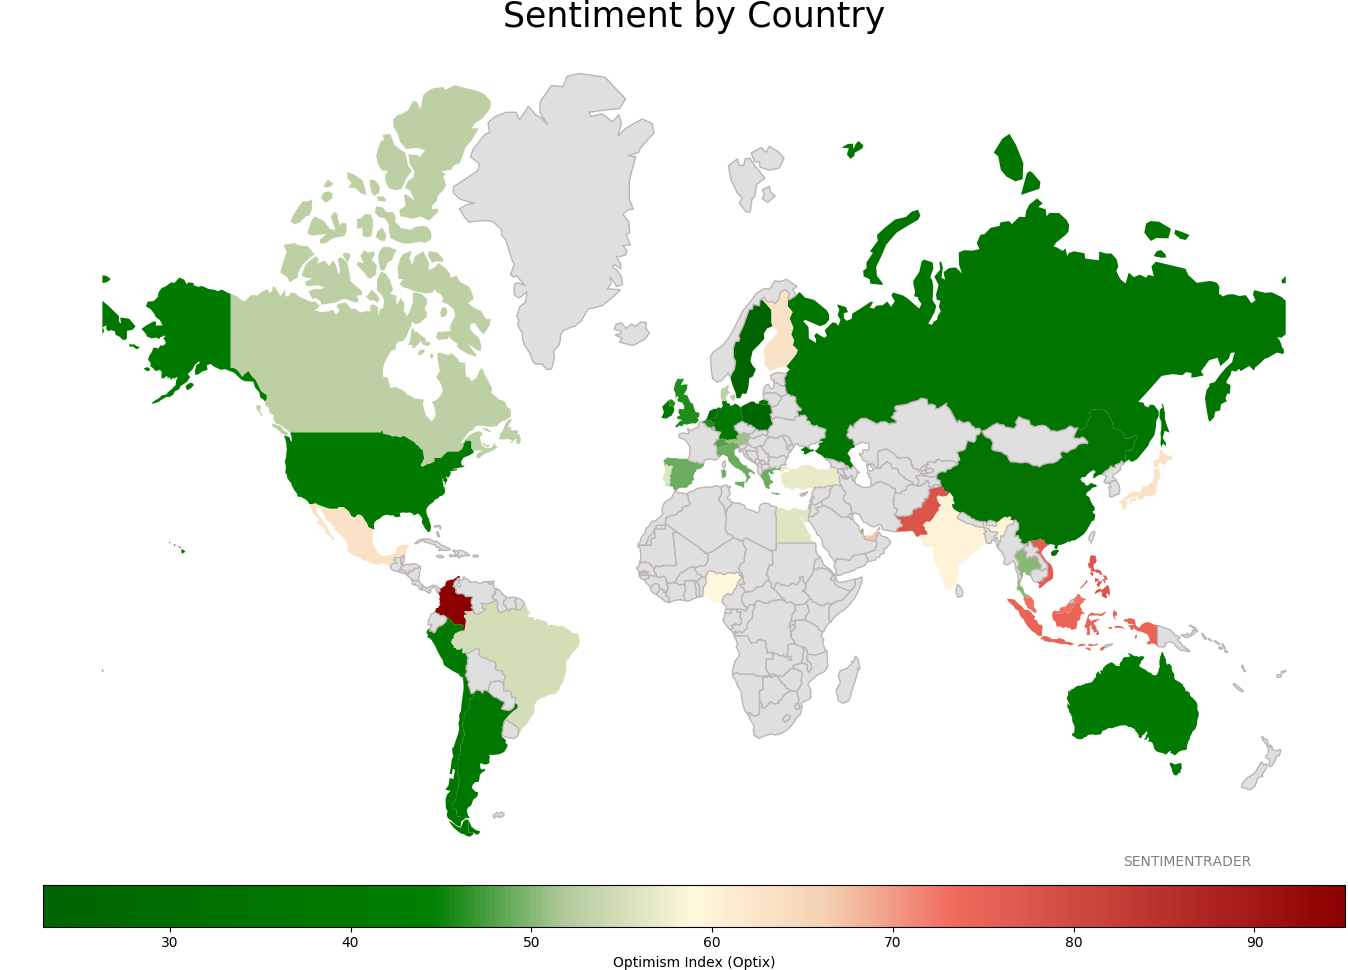
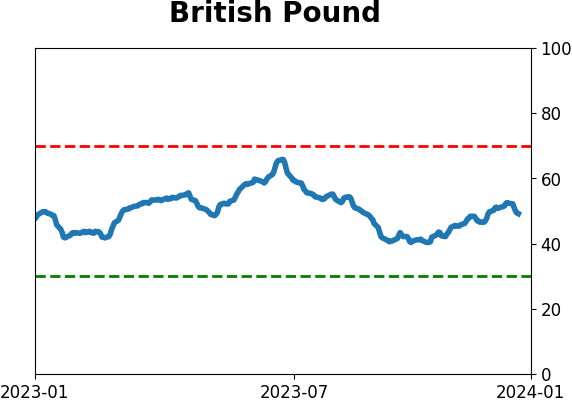
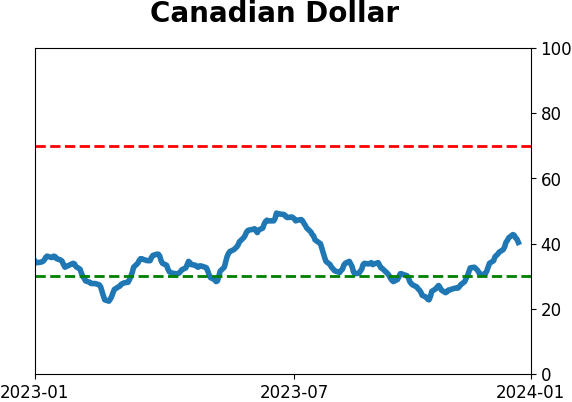
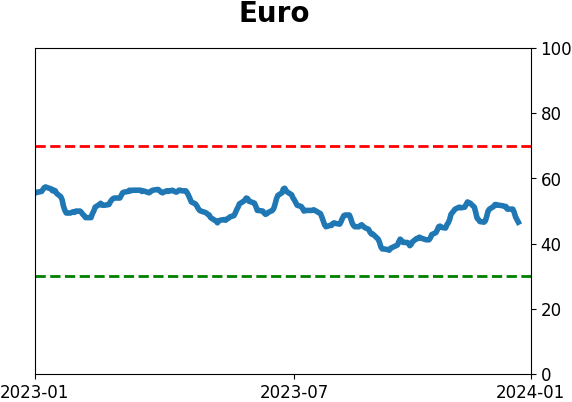
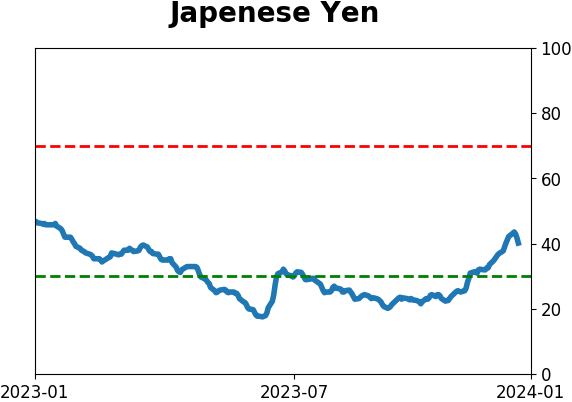
Sentiment Around The World
|
|
|
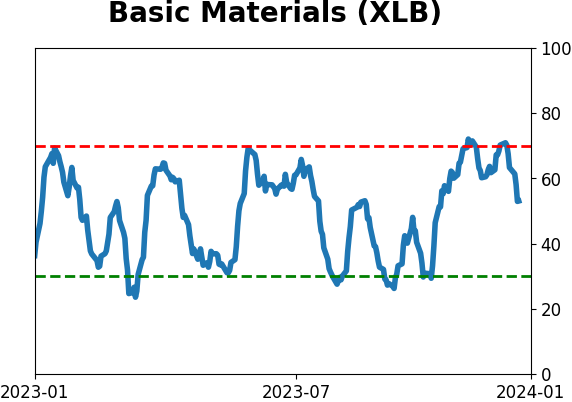
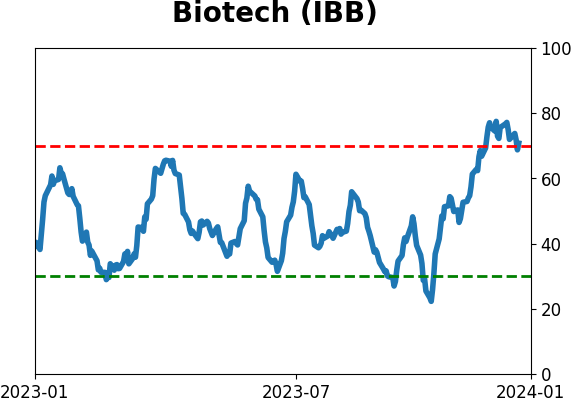
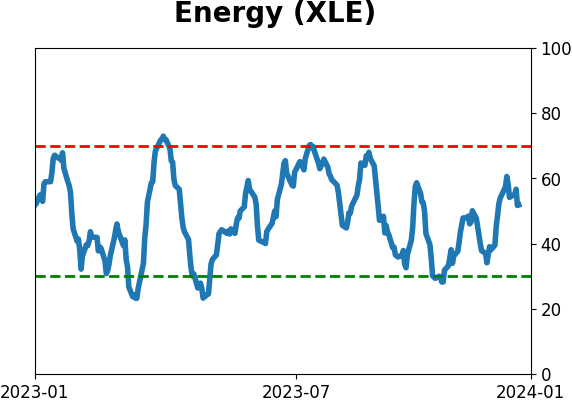
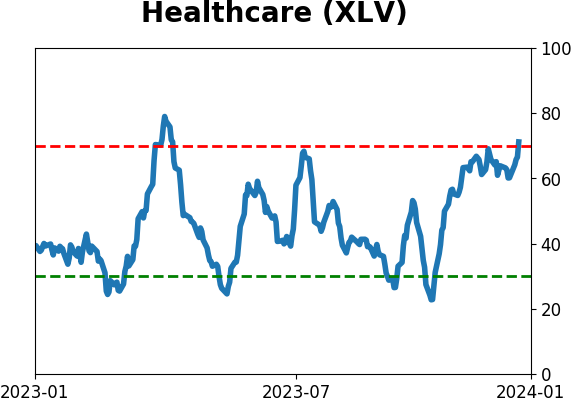
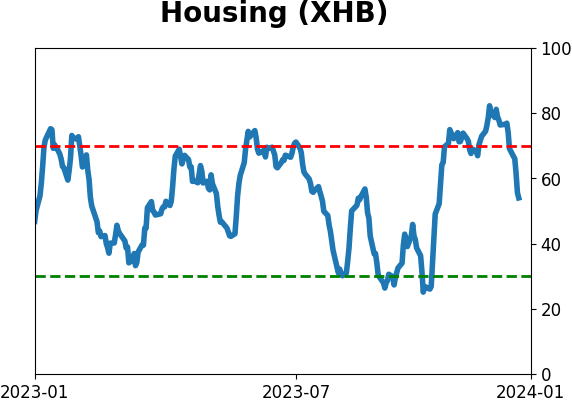
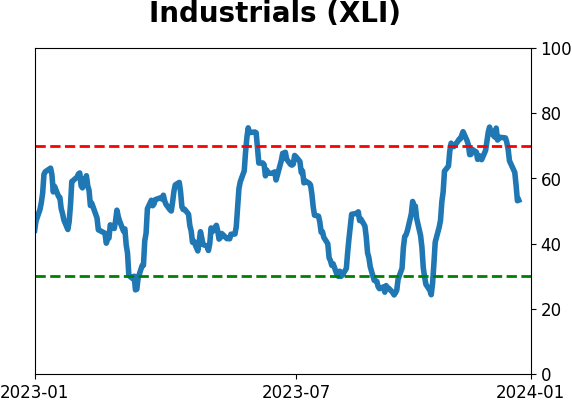
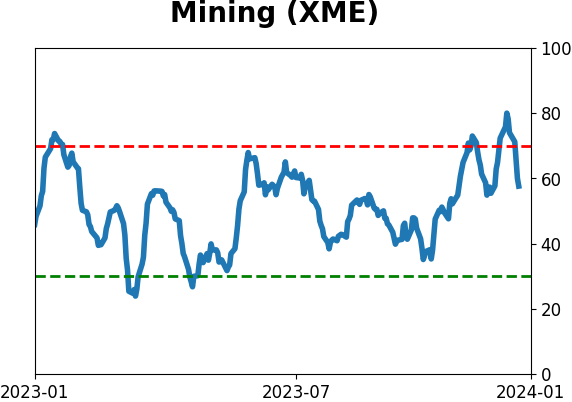
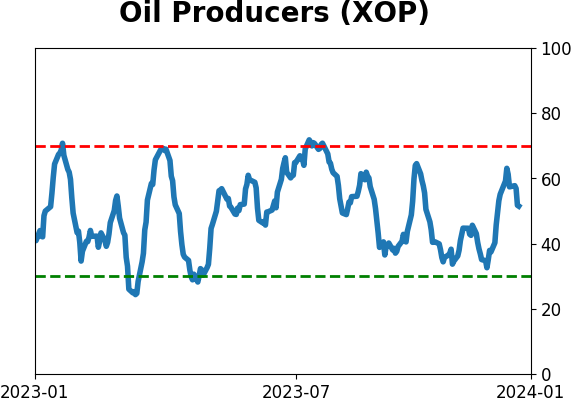
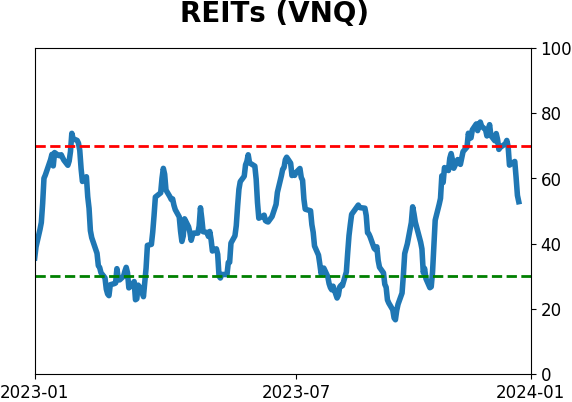
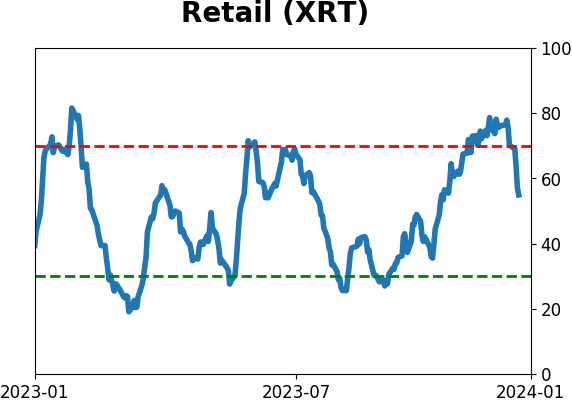
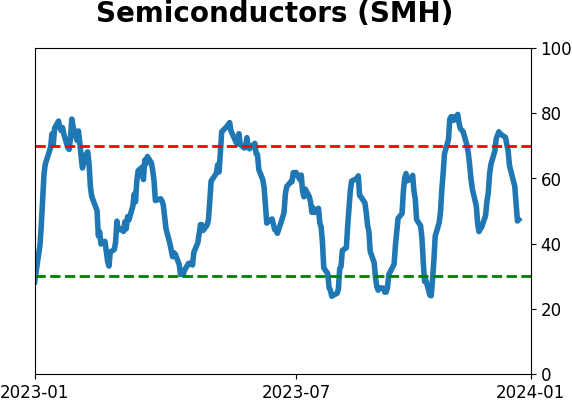
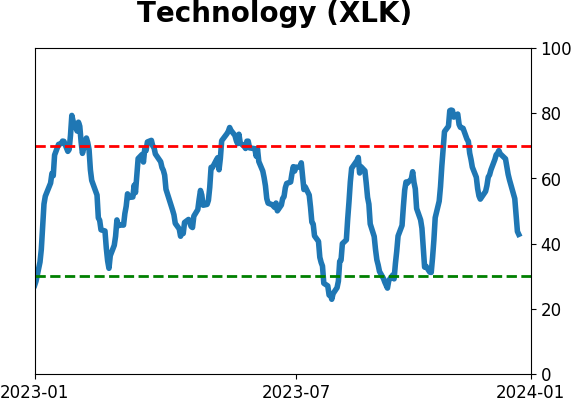
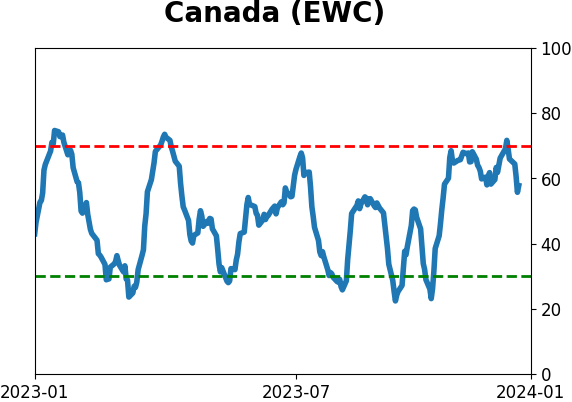
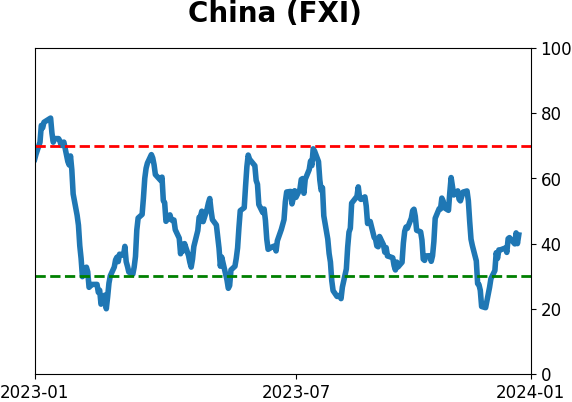
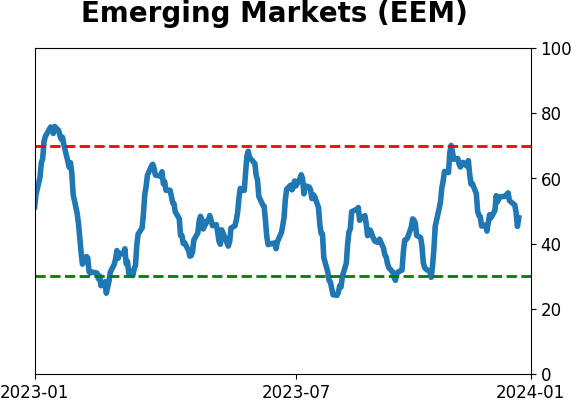
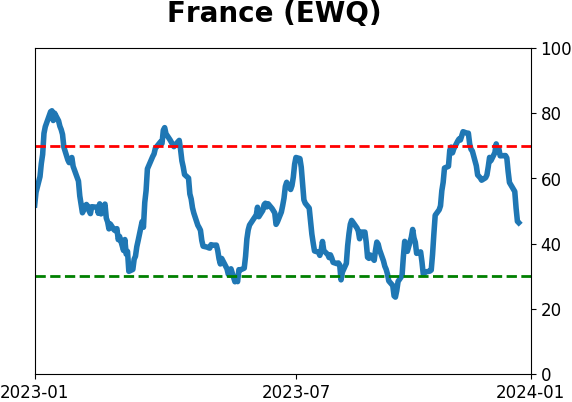
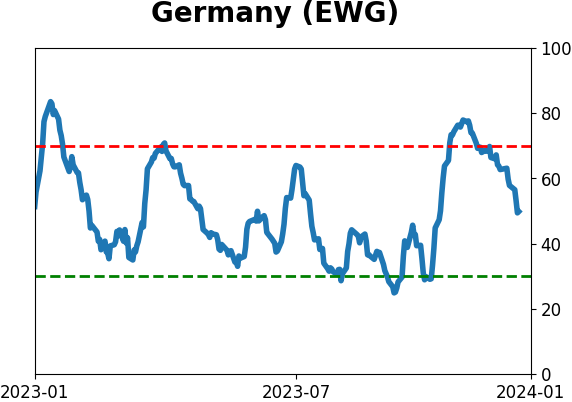
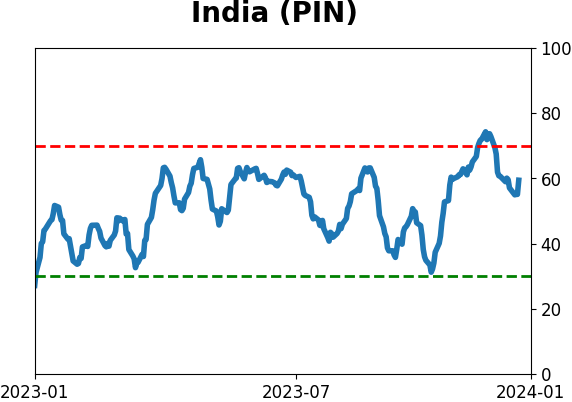
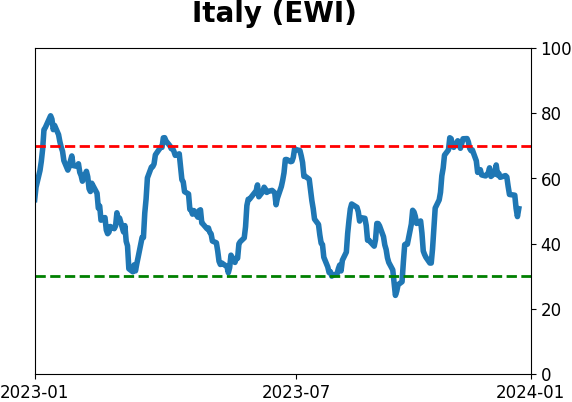
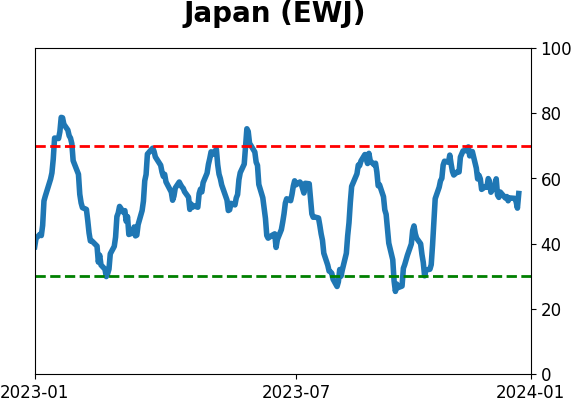
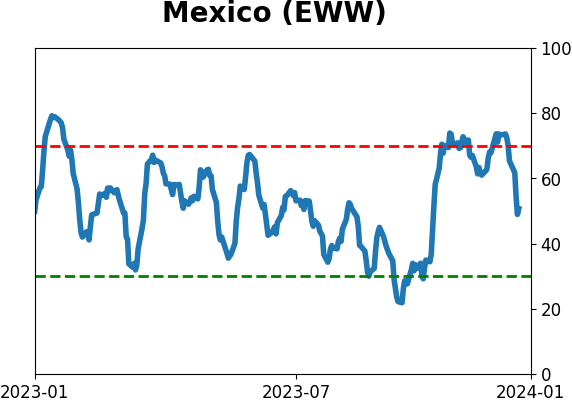
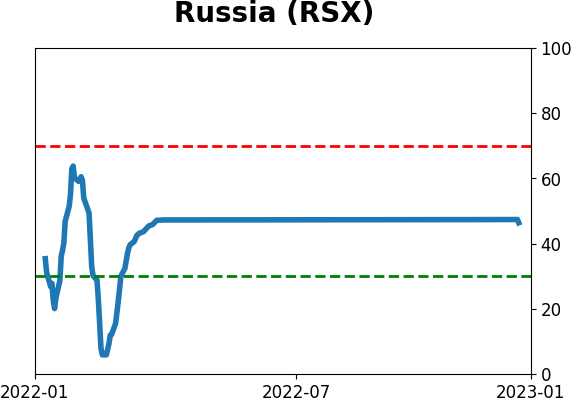
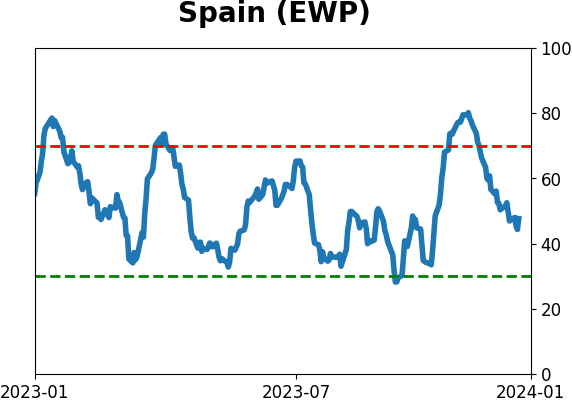
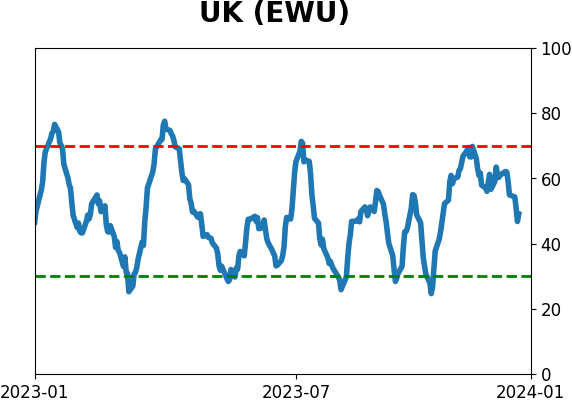
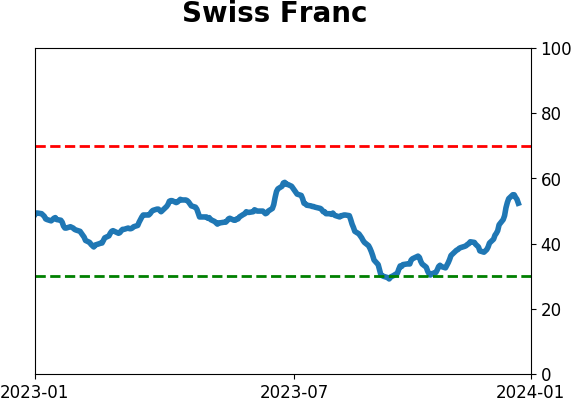
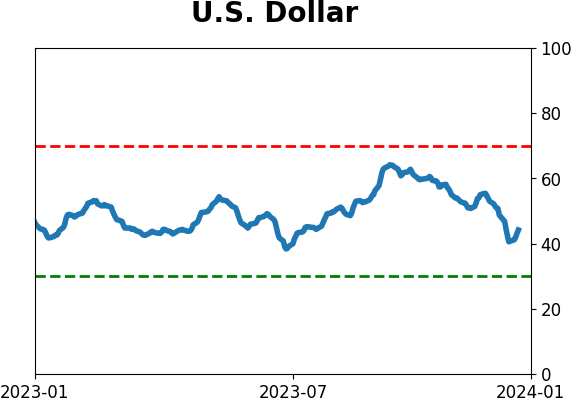
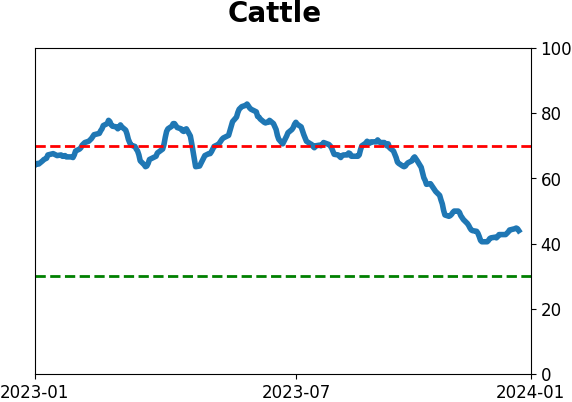
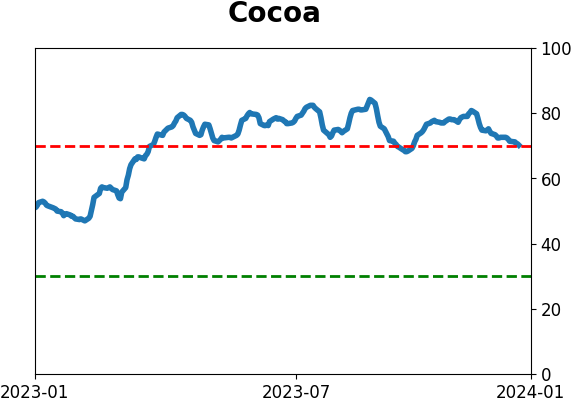
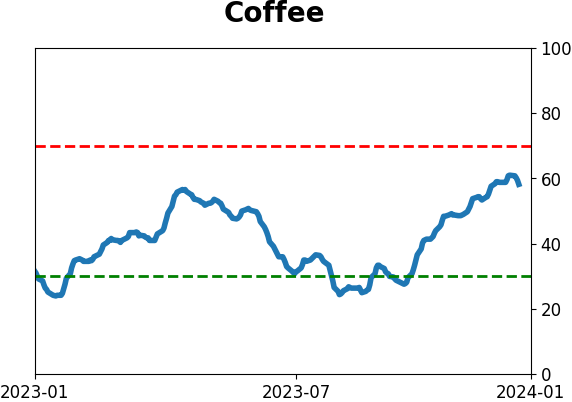
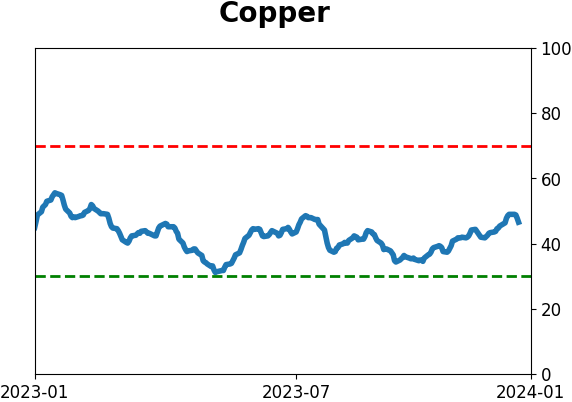
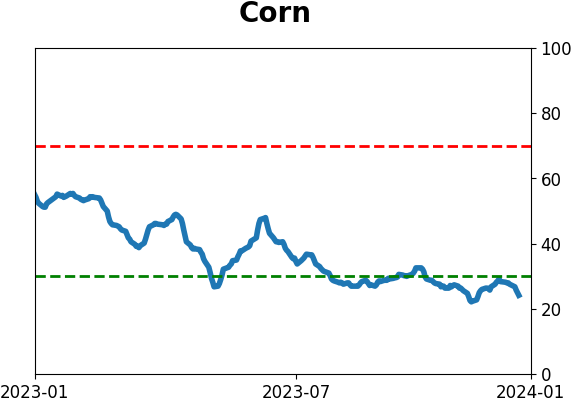
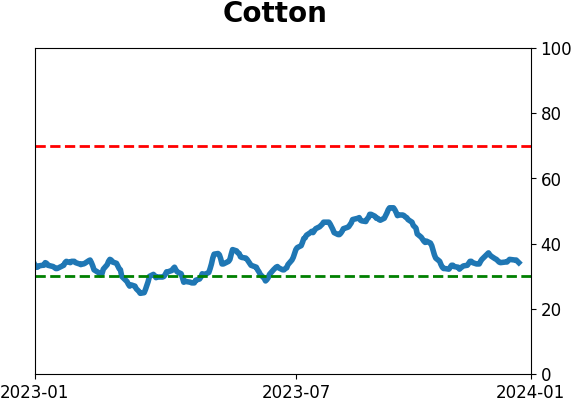
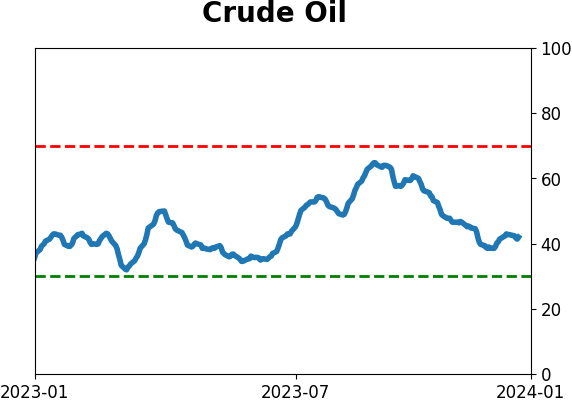
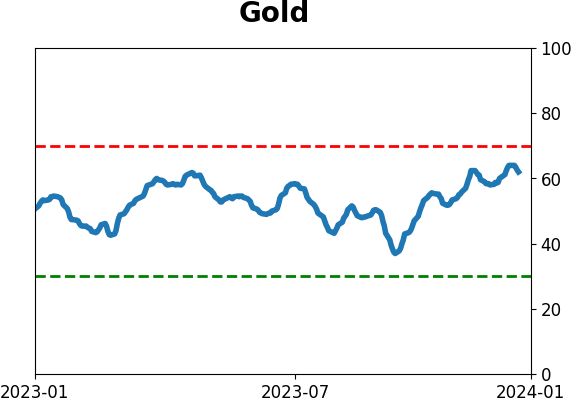
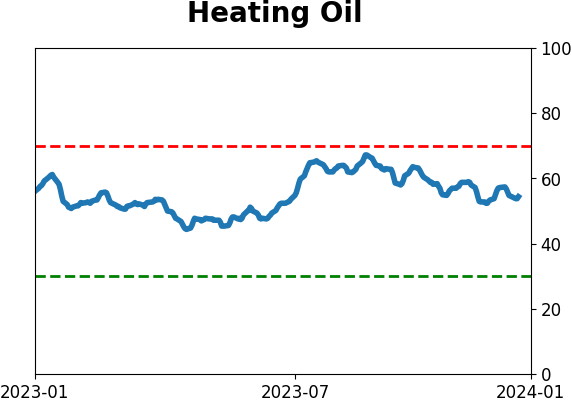
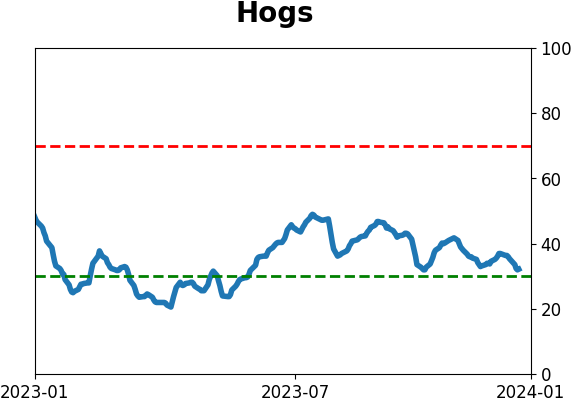
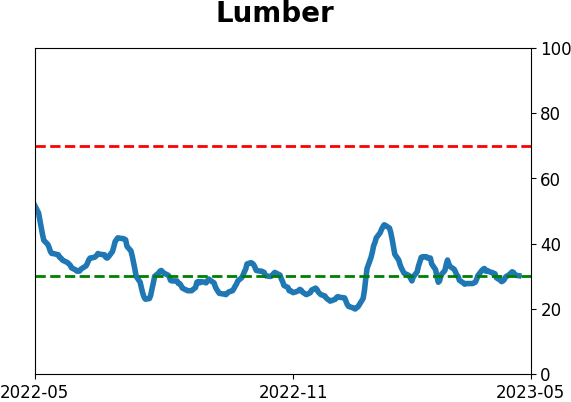
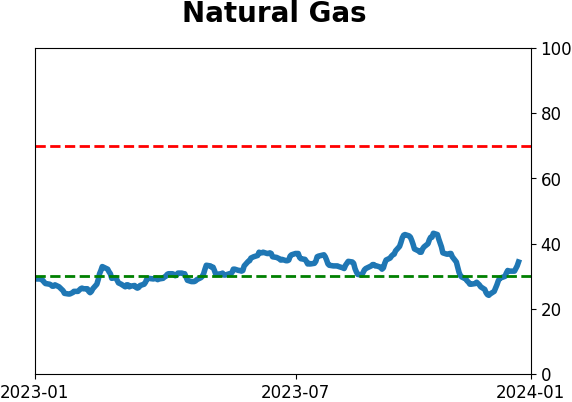
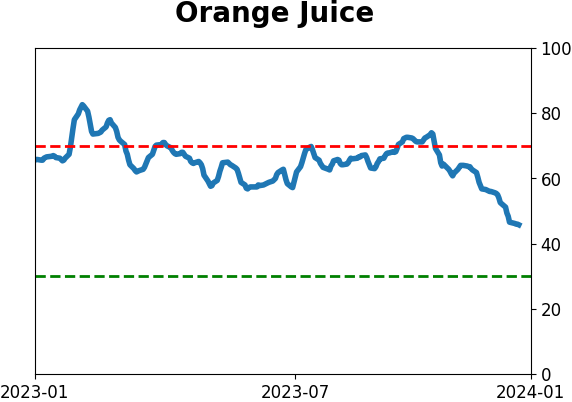
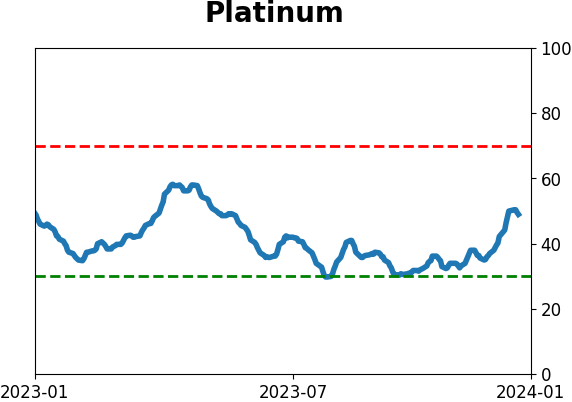
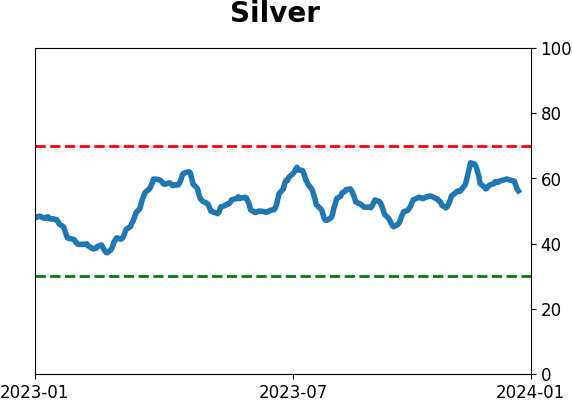
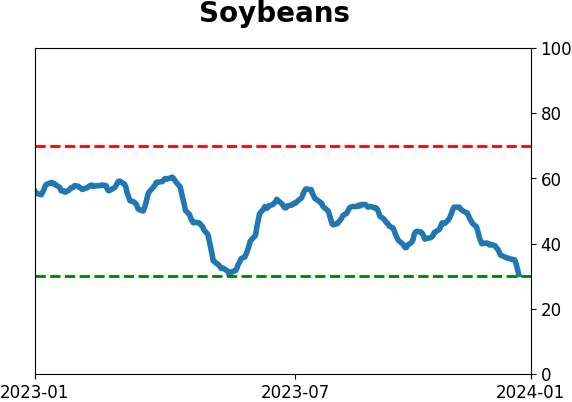
Optimism Index Thumbnails
|
|
|
|
|
|
|
|
|
|
|
|
|
|
|
|
|
|
|
|
|