Headlines
|
|
A rockier path after a year with almost no negative closes:
In 2023, the S&P 500 suffered only two sessions with a negative year-to-date return. That marked one of the "easiest" years ever for investors. Following similar years, there was less chance of another big positive year for the S&P, with a more even risk/reward ratio.
|
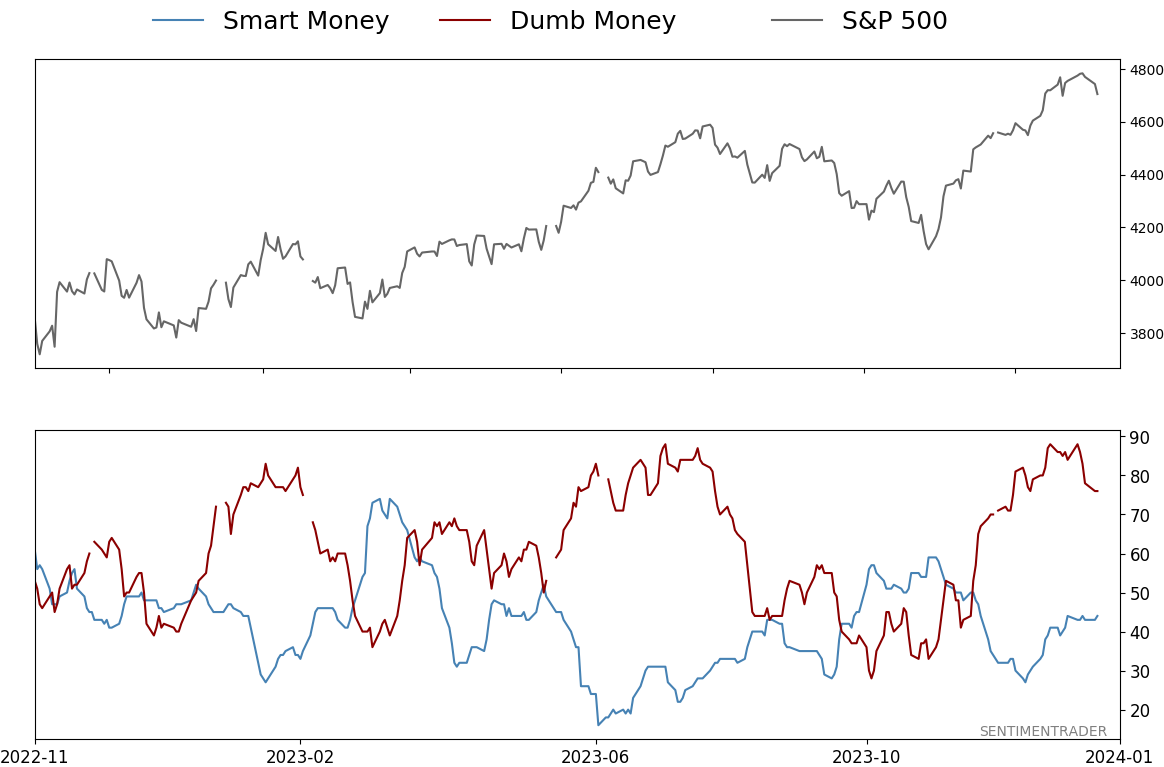
Smart / Dumb Money Confidence
|
Smart Money Confidence: 44%
Dumb Money Confidence: 76%
|
|
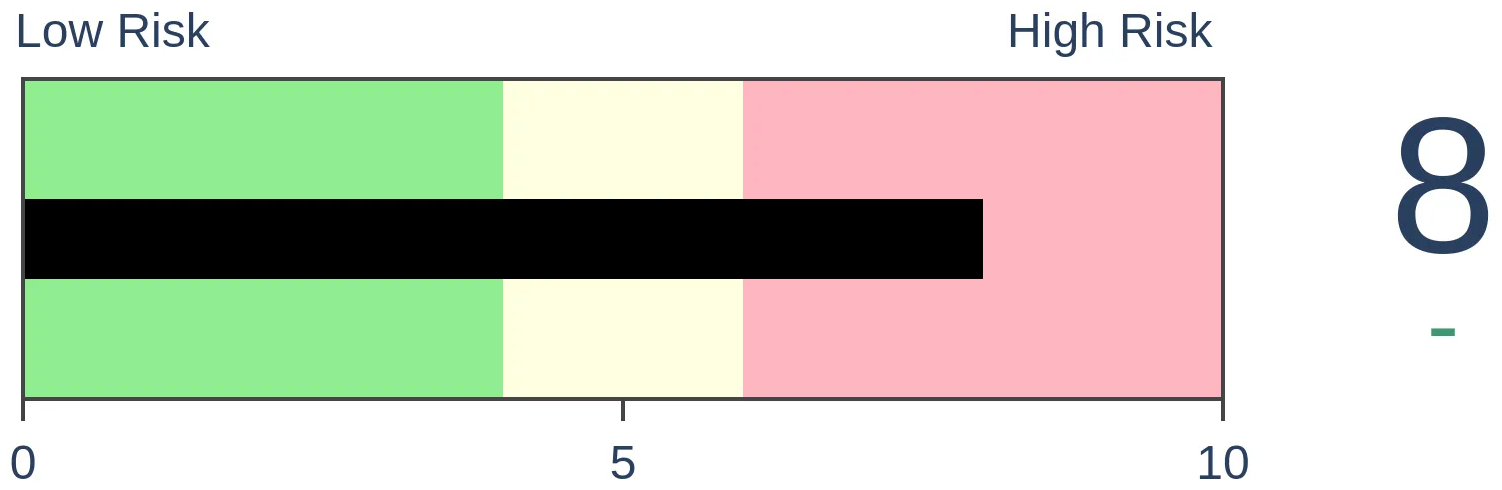
Risk Levels
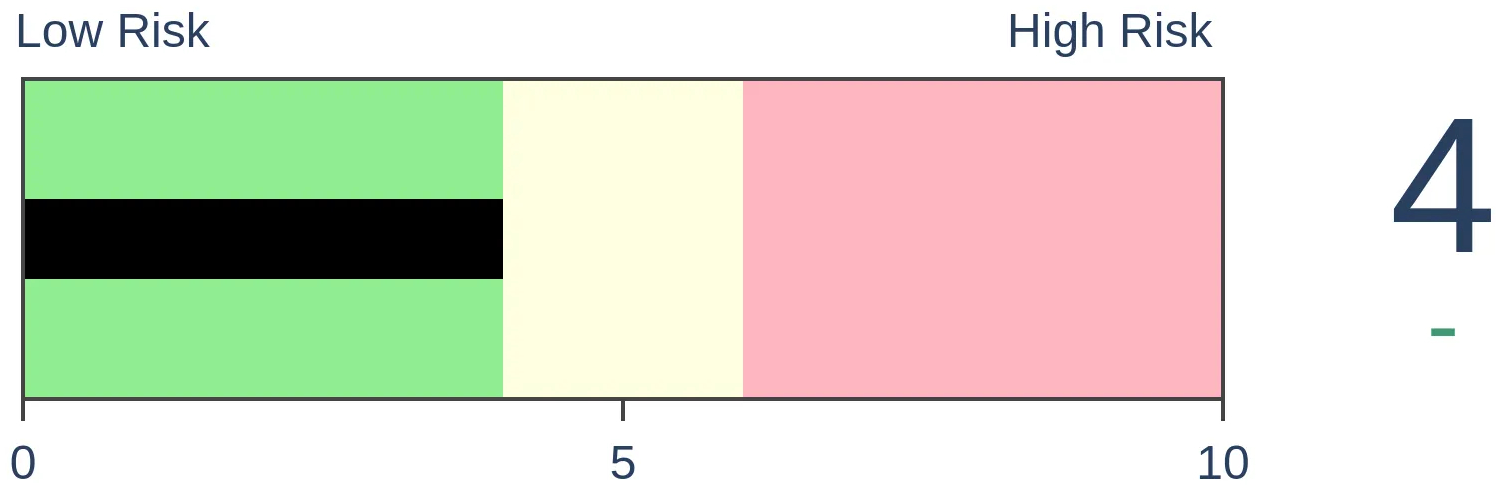
Stocks Short-Term

|
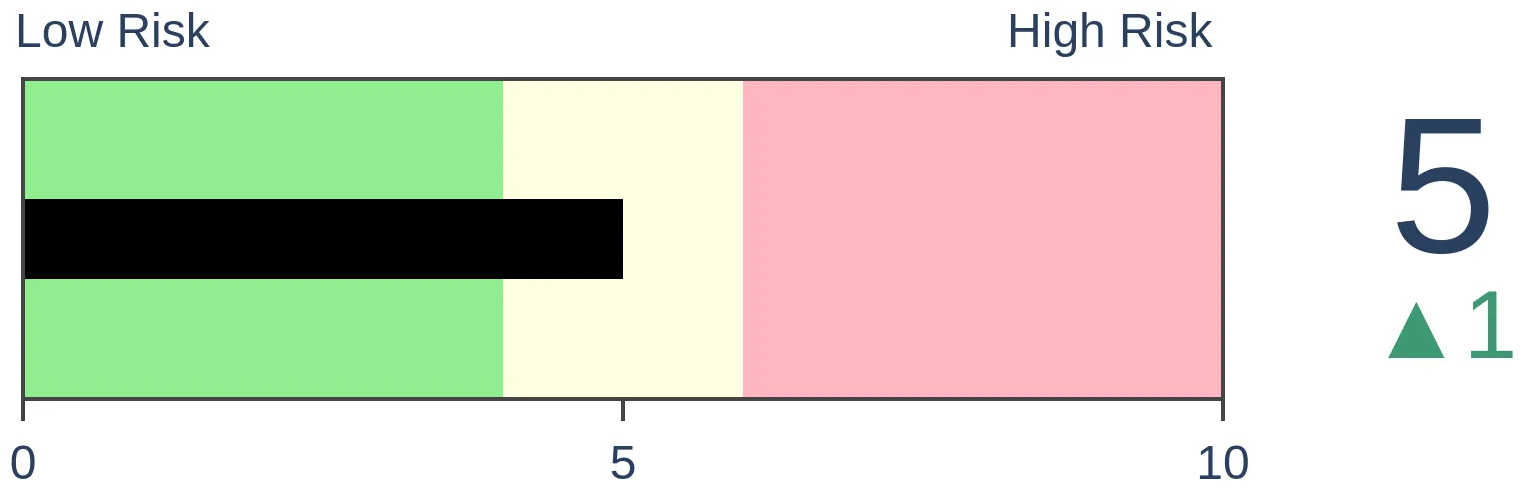
Stocks Medium-Term
|
|
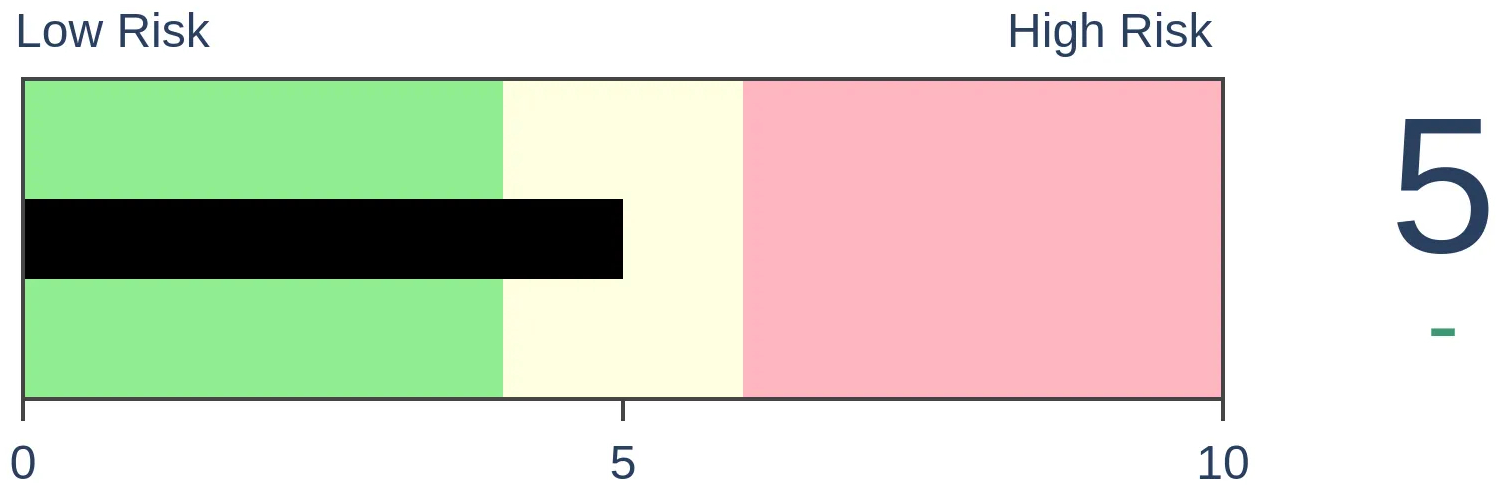
Bonds
|
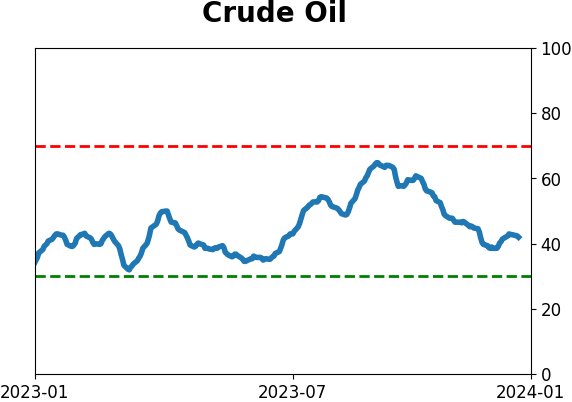
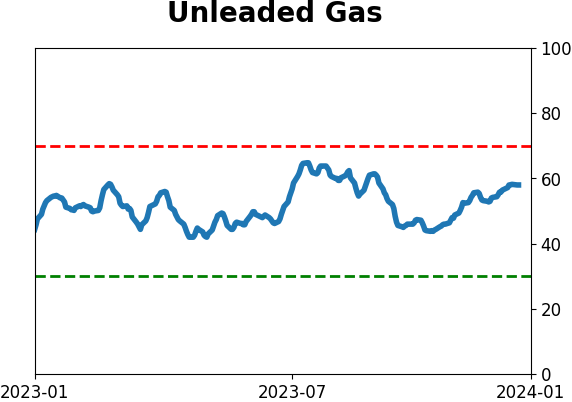
Crude Oil
|
|
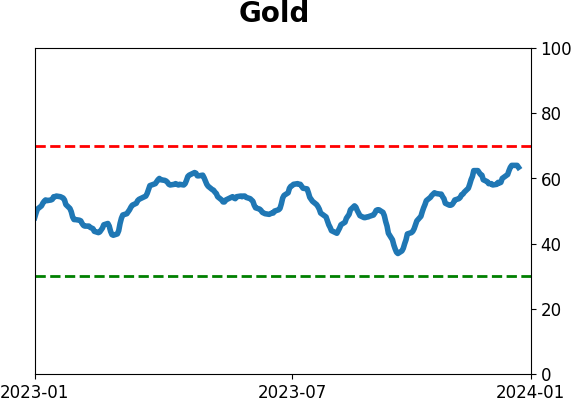
Gold

|
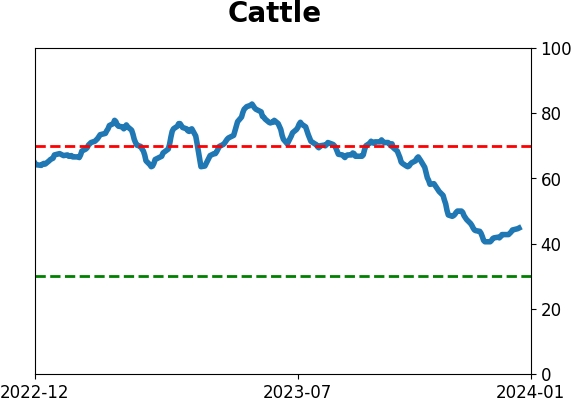
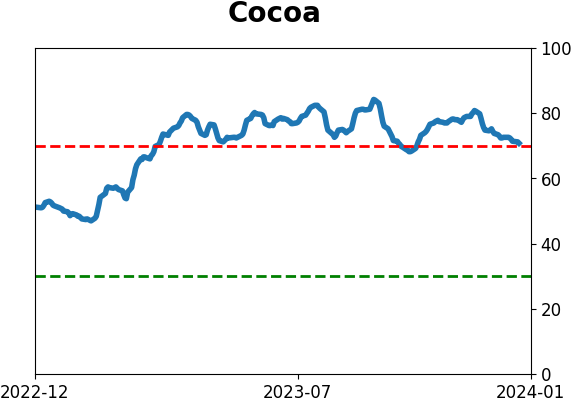
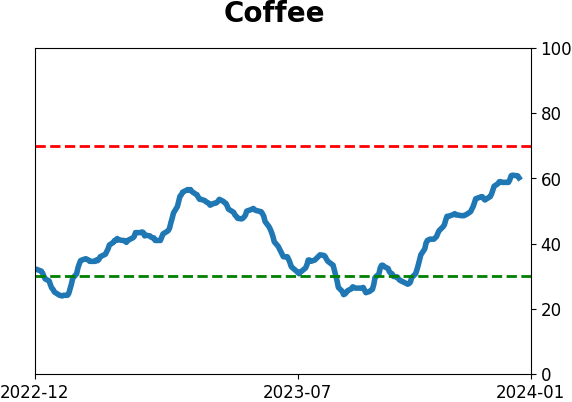
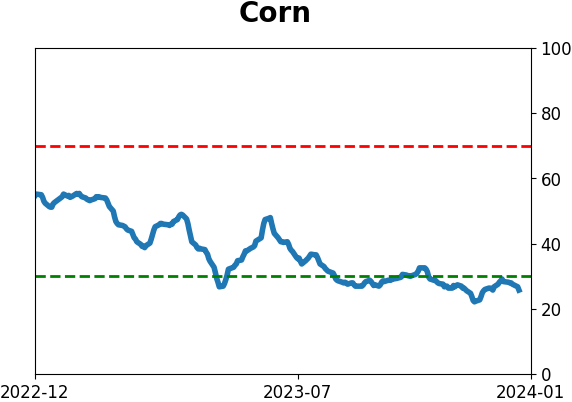
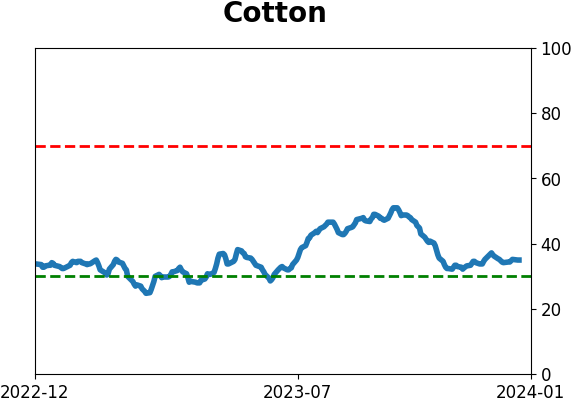
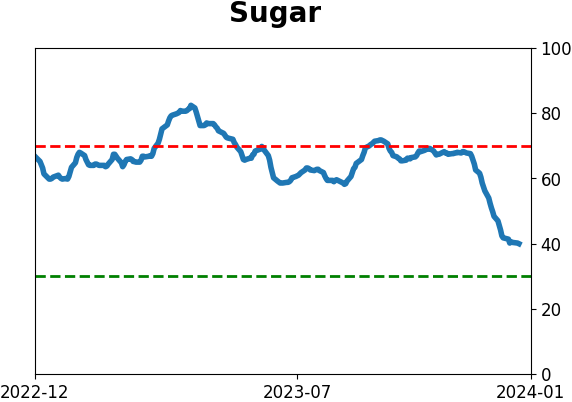
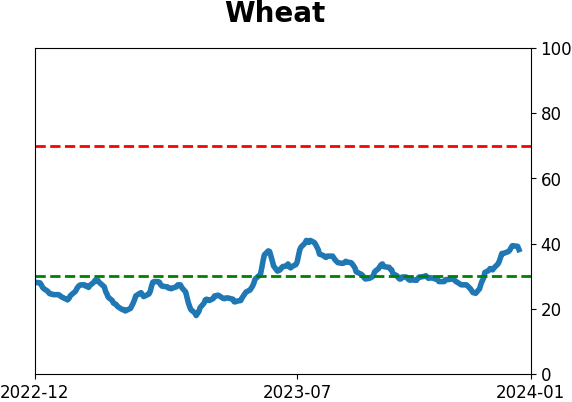
Agriculture
|
|
Research
By Jason Goepfert
BOTTOM LINE
In 2023, the S&P 500 suffered only two sessions with a negative year-to-date return. That marked one of the "easiest" years ever for investors. Following similar years, there was less chance of another big positive year for the S&P, with a more even risk/reward ratio.
FORECAST / TIMEFRAME
None
|
Key points:
- During 2023, the S&P 500 suffered only two days with a negative year-to-date return
- That marked one of the "easiest" years ever for investors in the most benchmarked index in the world
- Following such years, the price path became rockier, with less chance of another standout year
One of the "easiest" years ever for equity investors
It was a wonderfully angst-free year for investors. Well...in hindsight.
The most benchmarked index in the world, the S&P 500, spent only two sessions in negative year-to-date (YTD) territory during the entire year. It got close in March, but there were only two sessions in January when the index closed below its 2022 closing price.
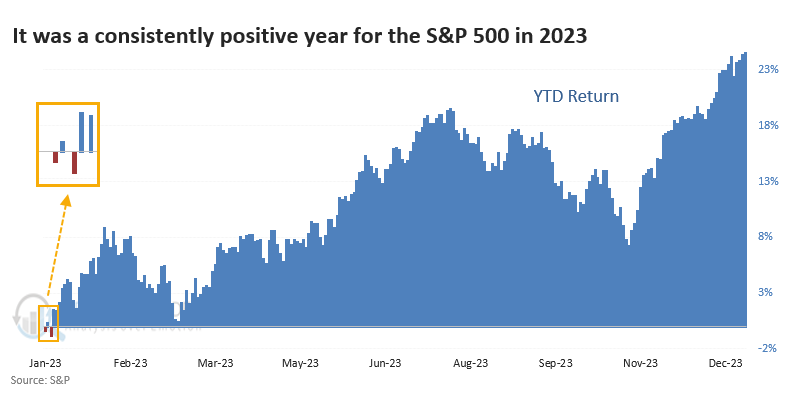
As much as investors ever deserve anything, they deserved this respite. It followed 2022, one of the worst years in history for financial assets. Last year, by contrast, suffered 248 sessions in negative YTD territory, one of the worst on record.
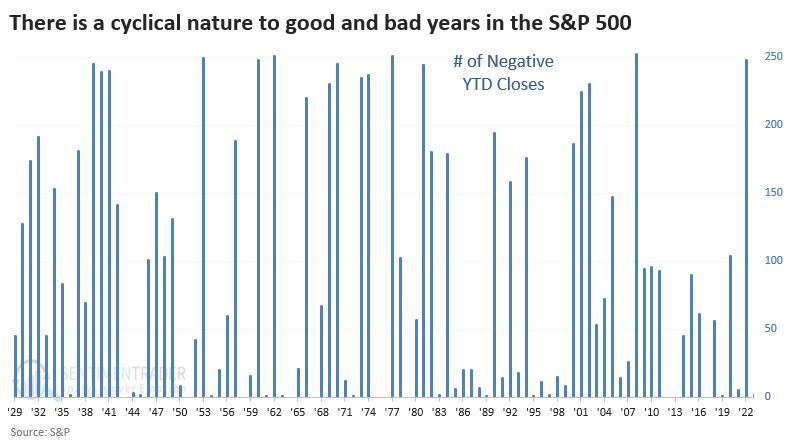
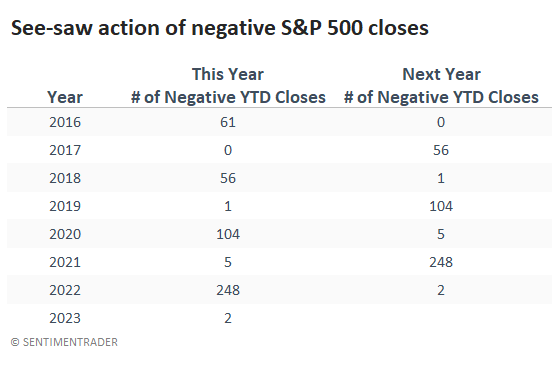
Particularly in recent years, there has been a see-saw pattern. If one year suffered few closes in negative territory, the following year suffered quite a few more, and vice-versa. It's not exactly what 2024 bulls might want to see, but it is what it is.
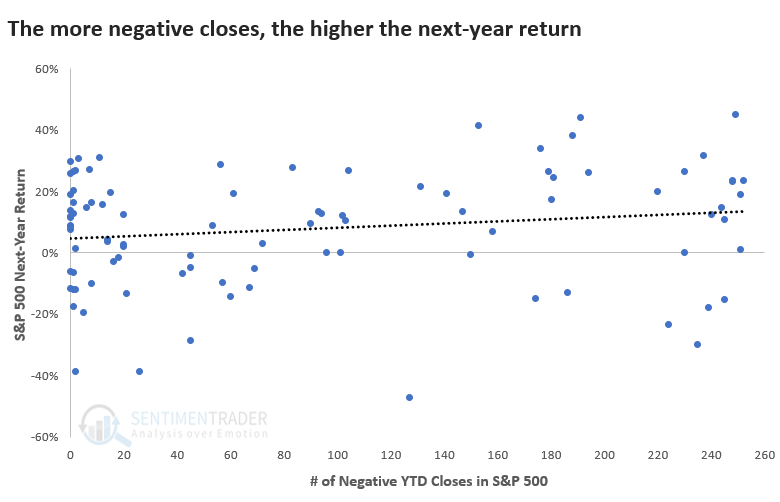
Historically, there has been a slight positive correlation between the number of negative YTD closes one year and the percentage return in the S&P 500 the following year. Most of the S&P's best returns occurred after years with the most closes in negative territory.
After years with two or fewer negative YTD closes, the S&P gained more than +20% the following year only 23% of the time. After years with 100 or more negative closes, 43% of years enjoyed a +20% or greater return. The S&P was also more likely to suffer a negative return following years with the fewest negative YTD closes.
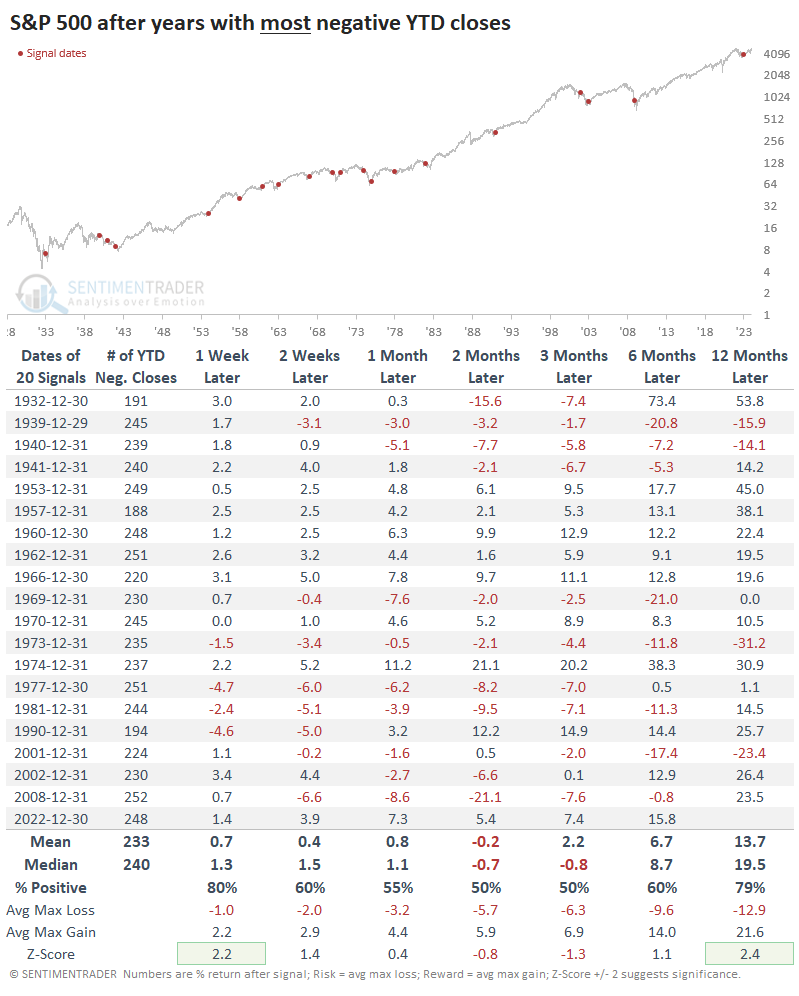
After a year with few negative closes, the path becomes harder
The table below shows S&P 500 returns after years with the fewest closes in negative YTD territory. While it enjoyed a positive return on average across all time frames, those returns were modest, and the risk/reward was uninspiring. Over the next year, the average risk was -10.6% versus reward of only +13.6%, not a significant edge in any sense.
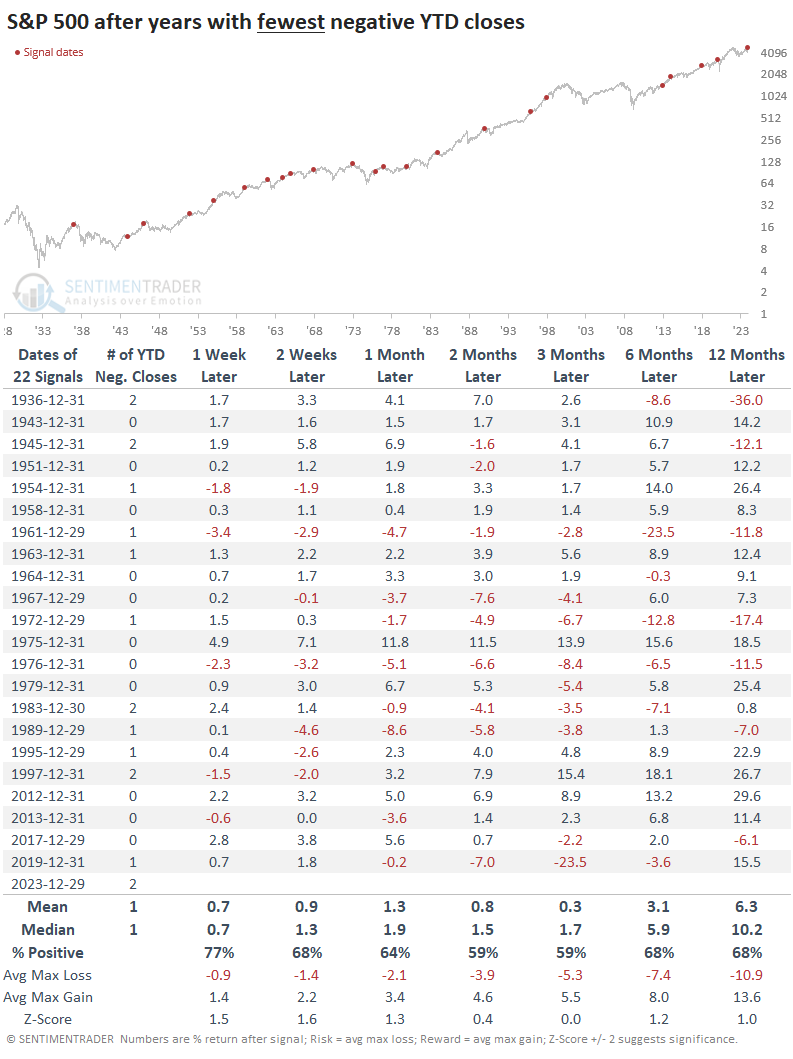
Contrast that with returns following years with the most days when the index was negative YTD. There was a greater tendency to rebound in the short- and long-term, with higher average returns and reward, but also more variability, especially during February-March.
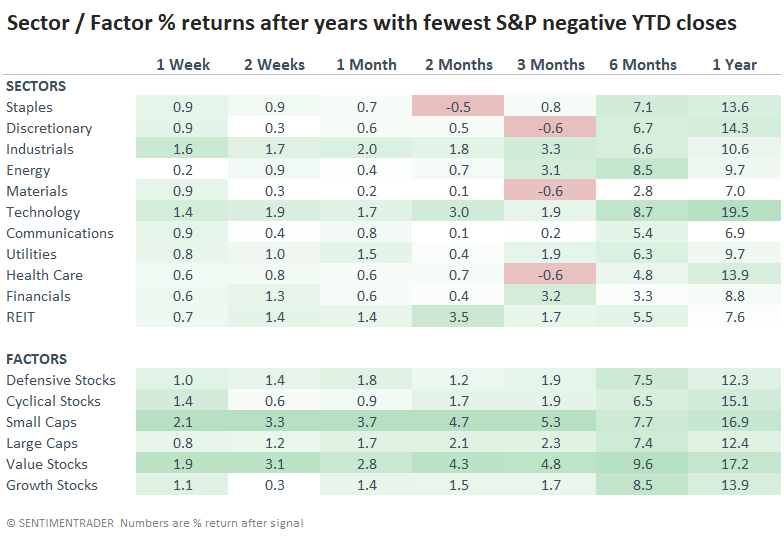
Returning to tendencies following years with few negative YTD days, Small Caps and Value stocks tended to put in the best, most consistent performance. It's a bit surprising that Defensive sectors didn't perform significantly better than Cyclical ones.
What the research tells us...
Investor sentiment and price action are joined at the hip. They are not one and the same, but they do have a strong positive correlation. It's no wonder that sentiment is extremely buoyant as we wrapped up a year with only two days in negative territory.
After similar years, investors tended to suffer a more challenging path during the following year. There were a handful of years when stocks kept chugging, so it's not like a year like 2023 necessarily means it's time to sell and go to cash. More than anything, it simply suggests against complacency with the assumption that the "easy" path of 2023 will likely be repeated.
Indicators at Extremes
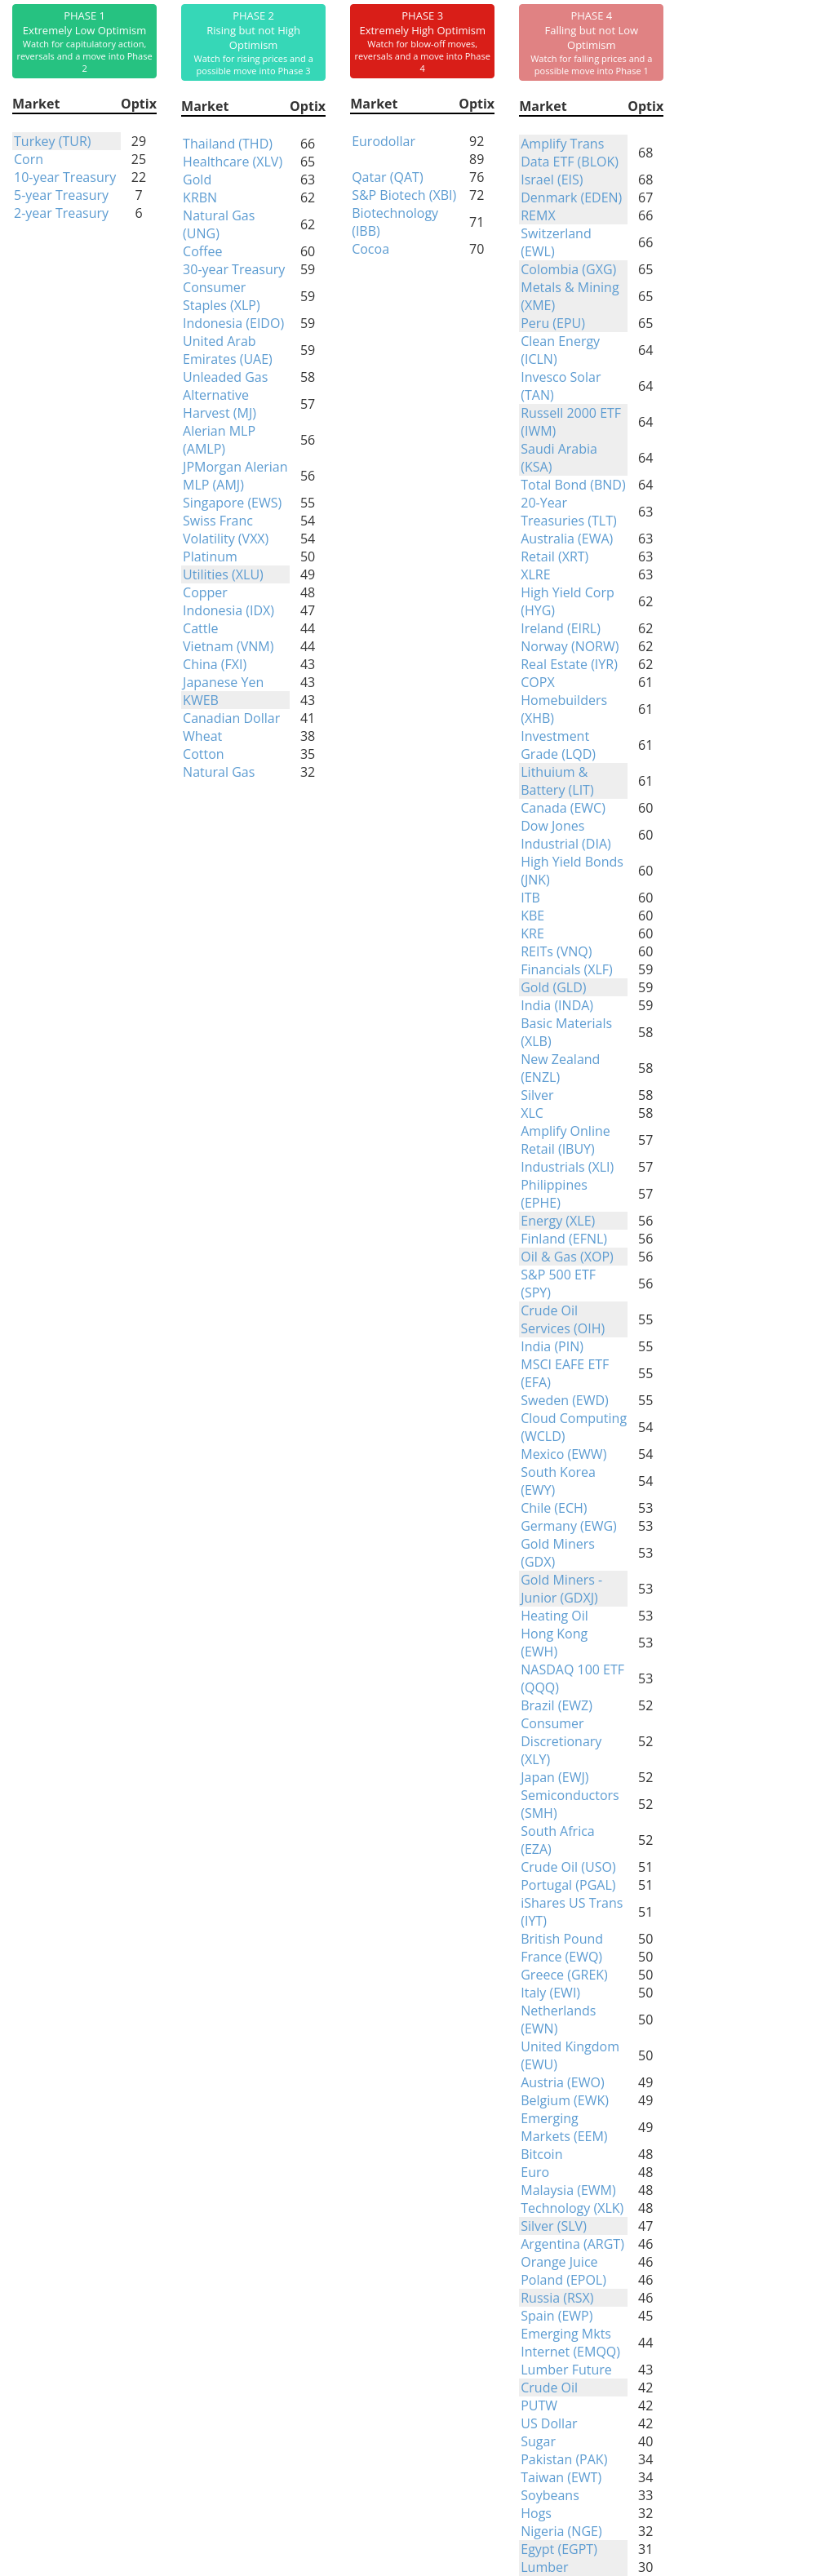
Phase Table
Ranks
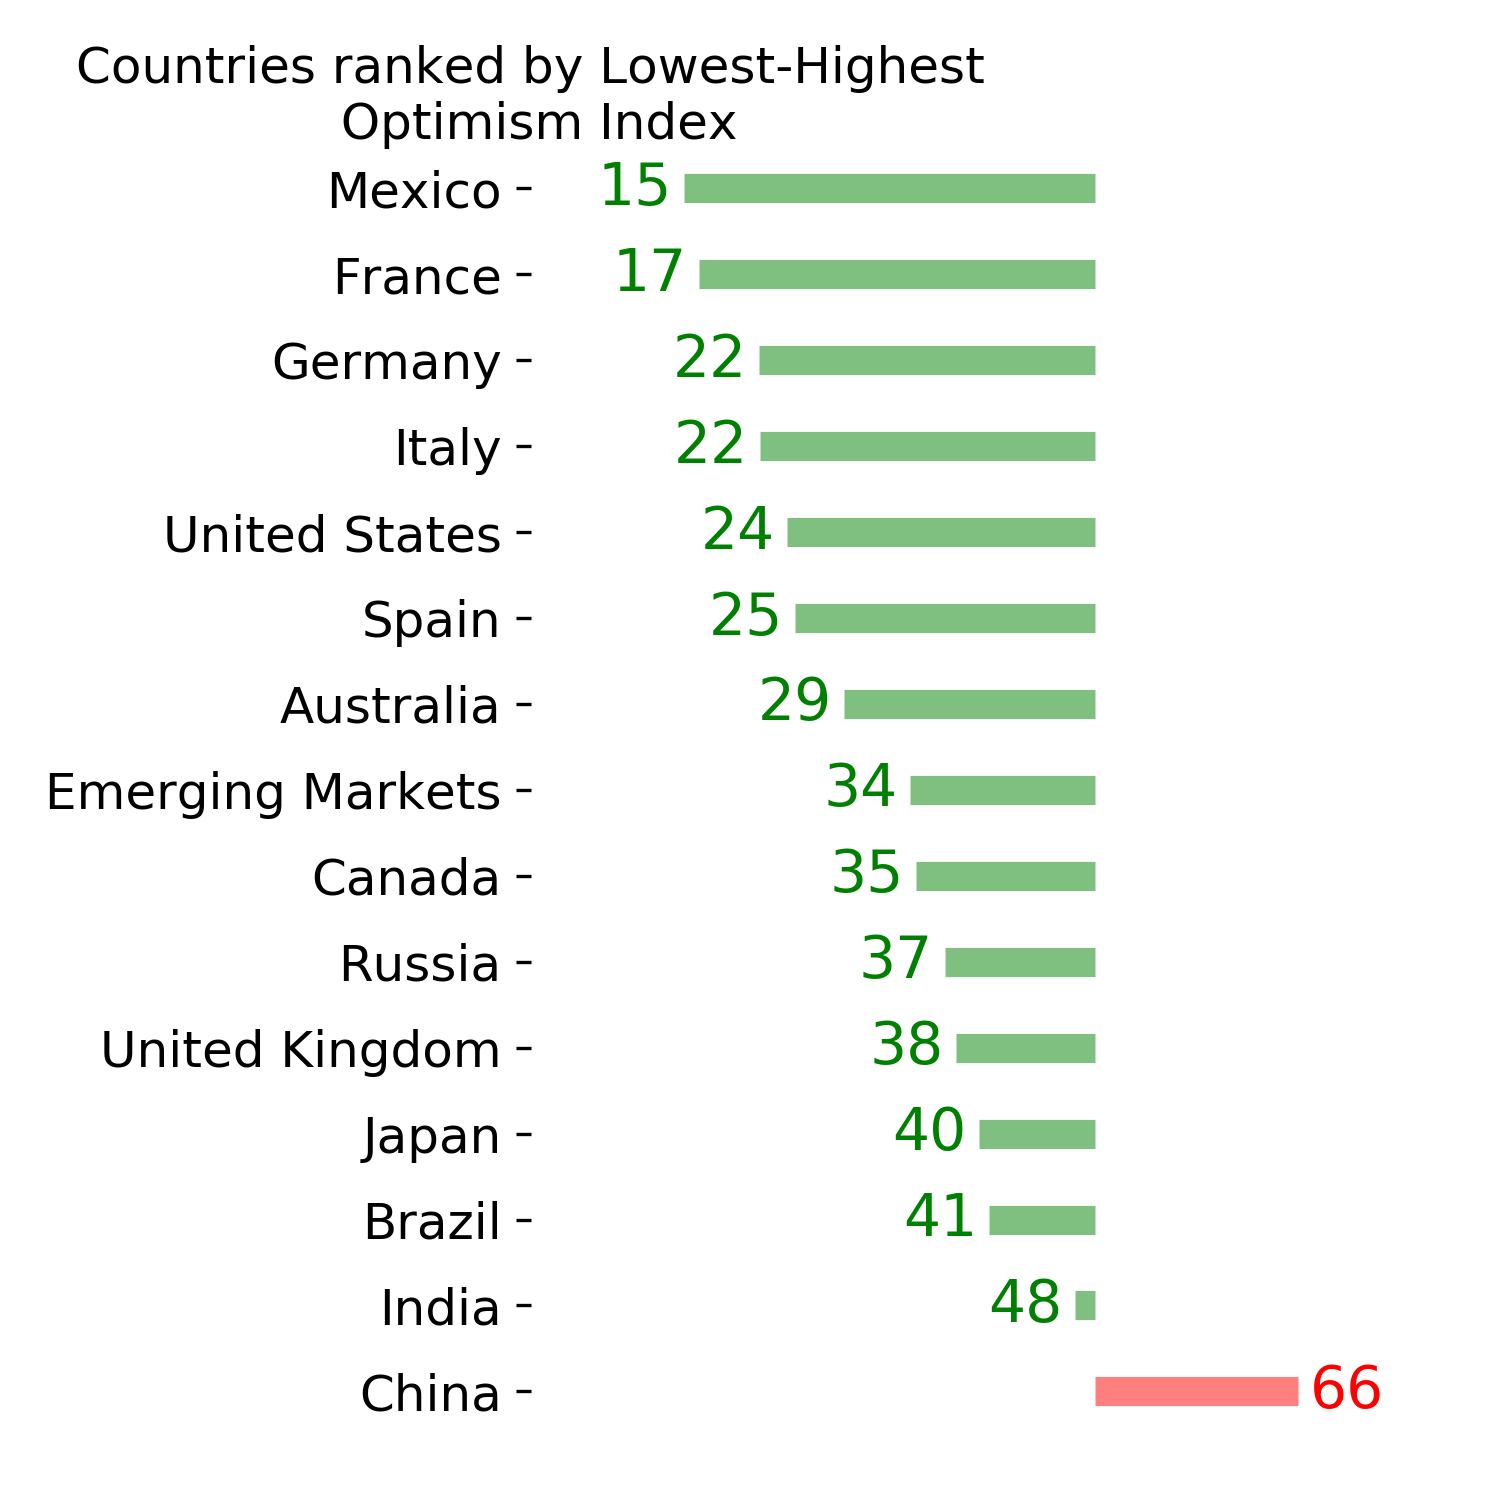
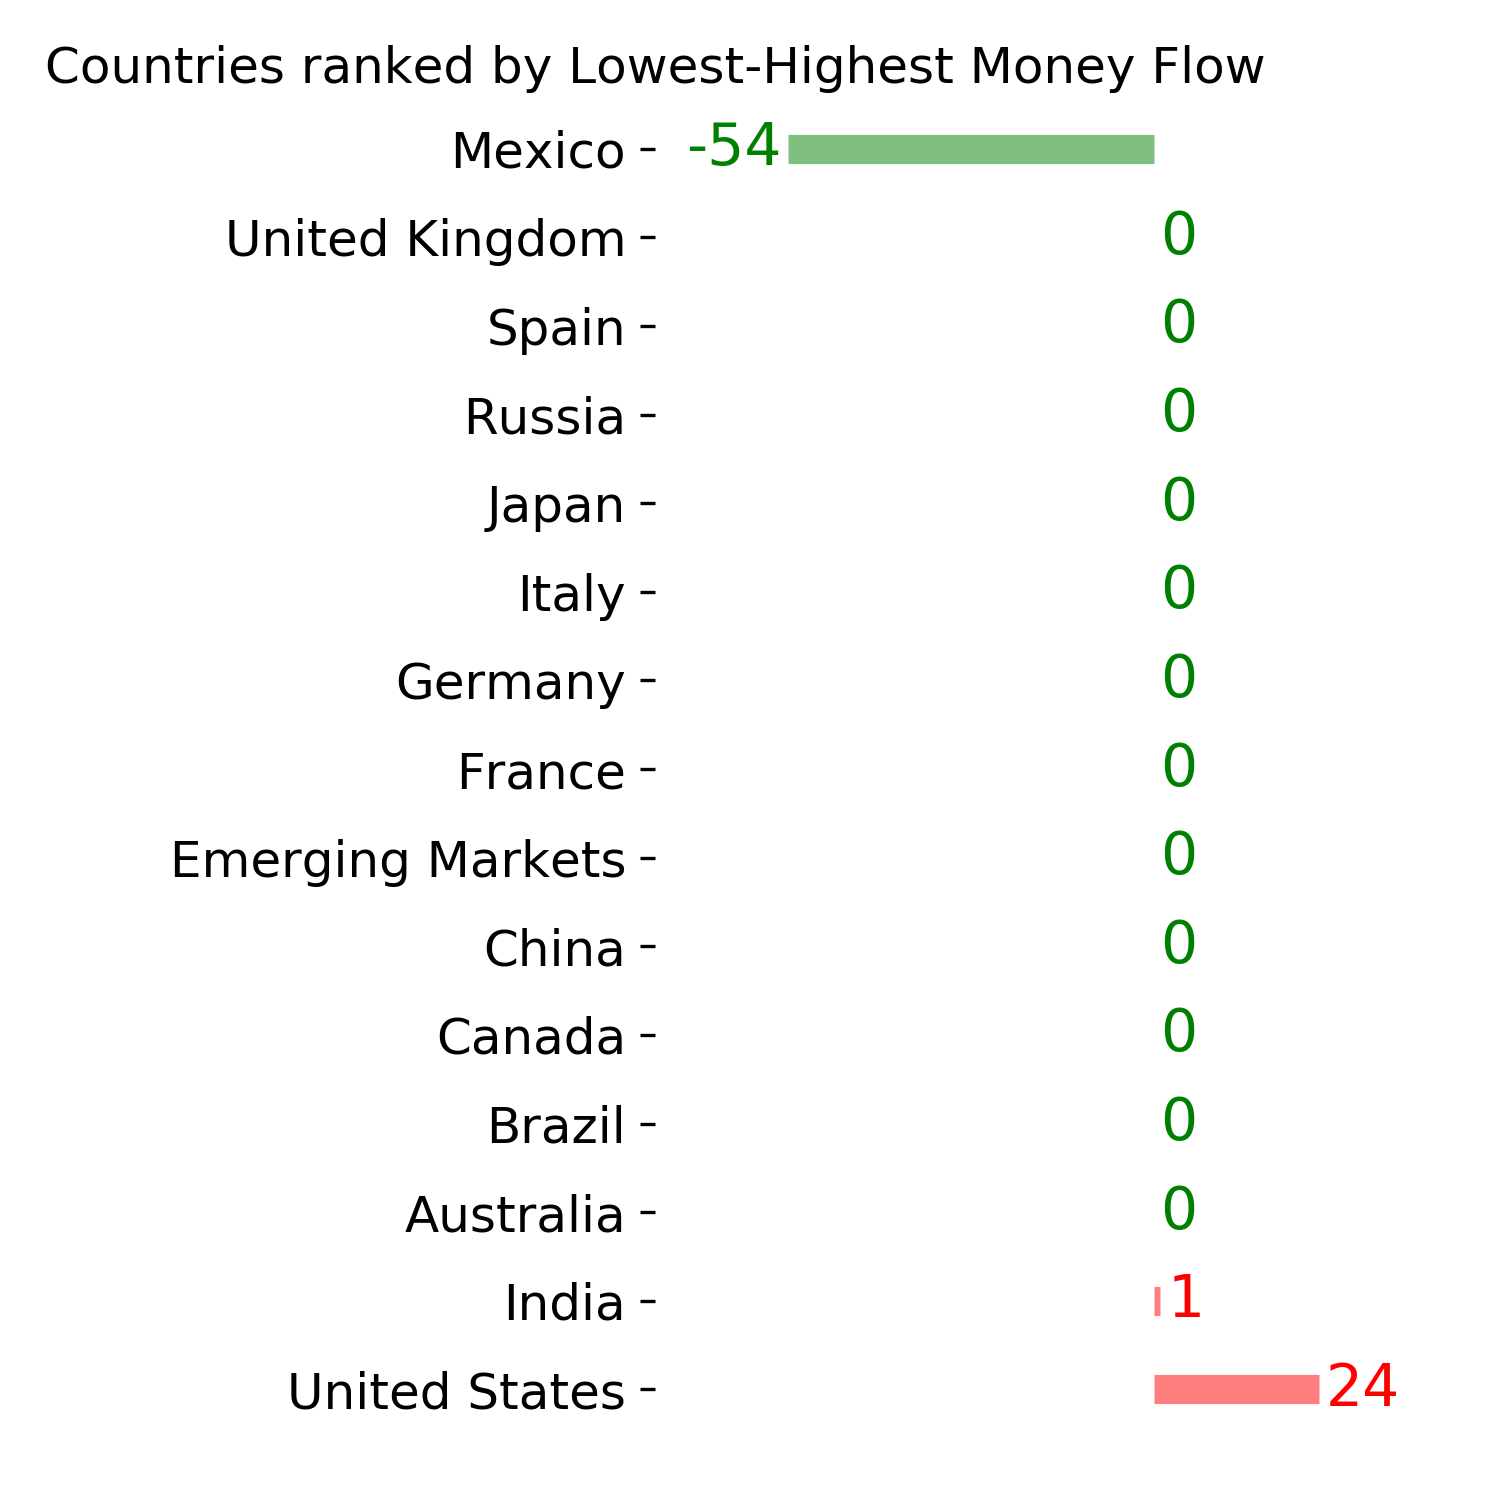
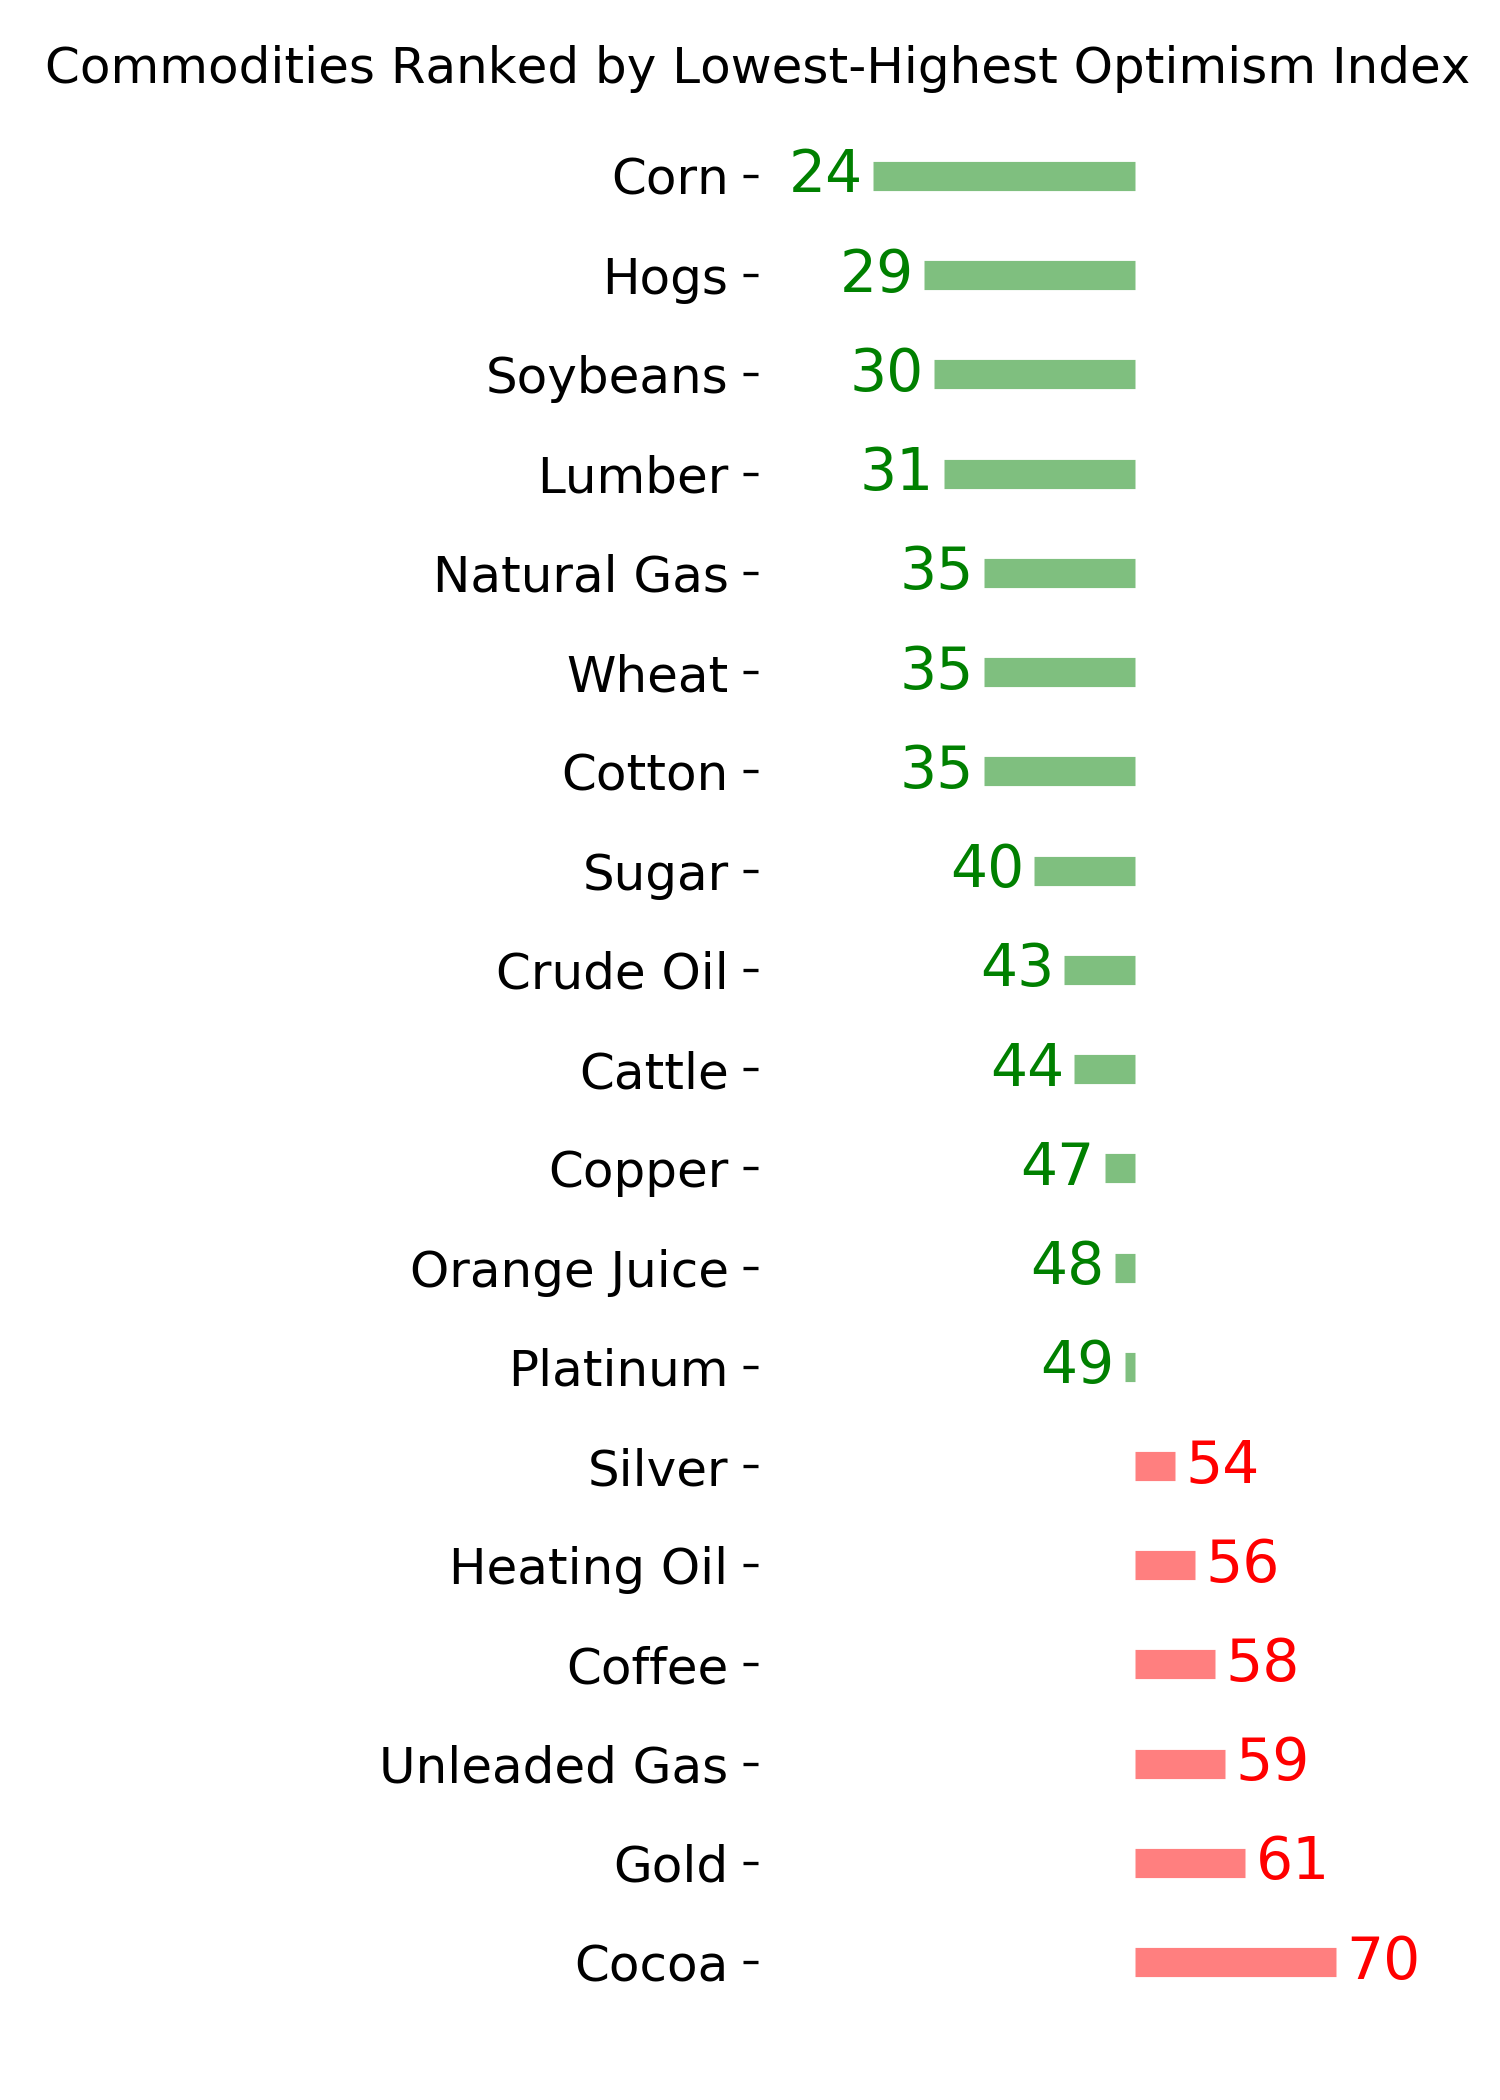
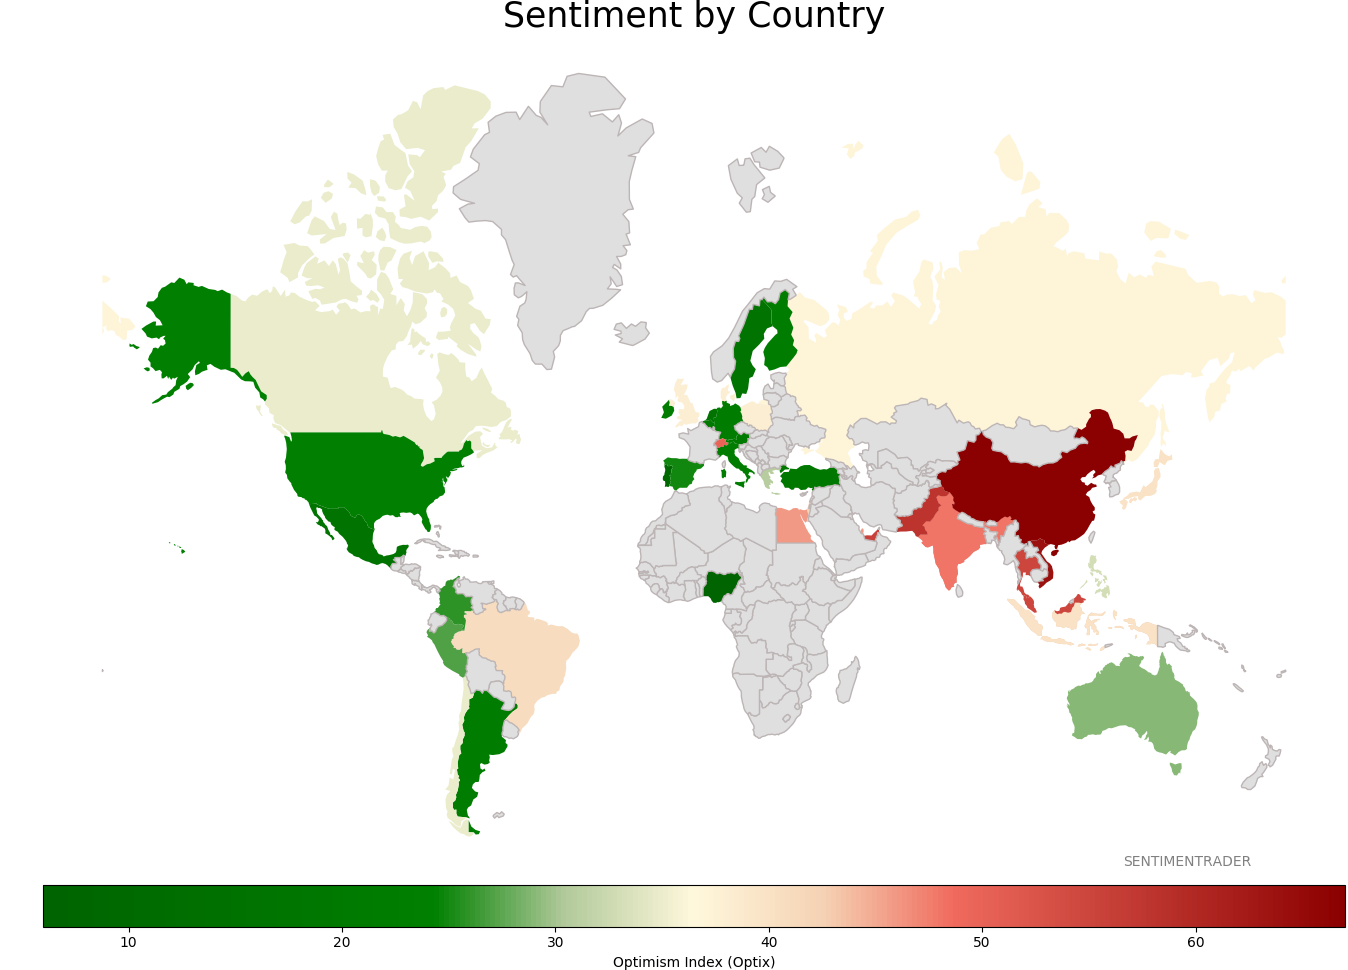
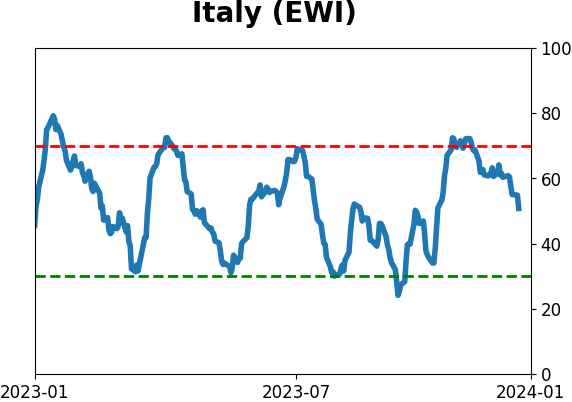
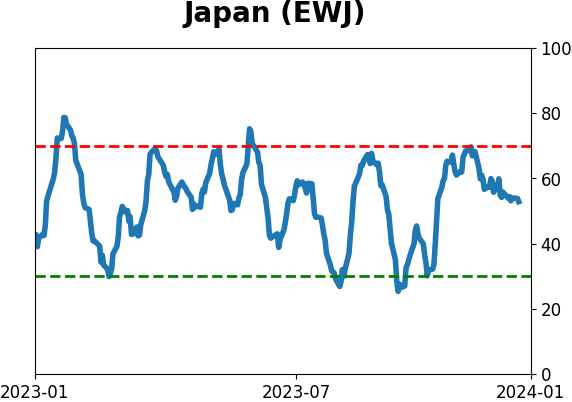
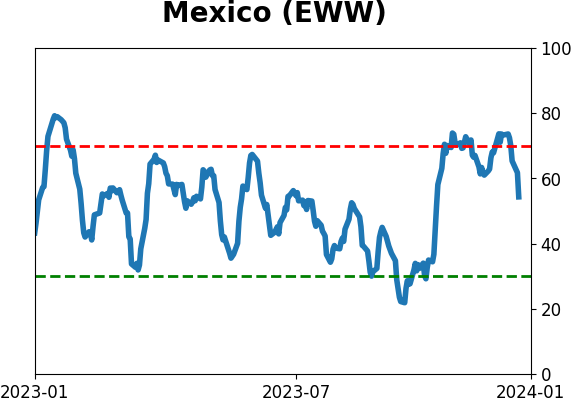
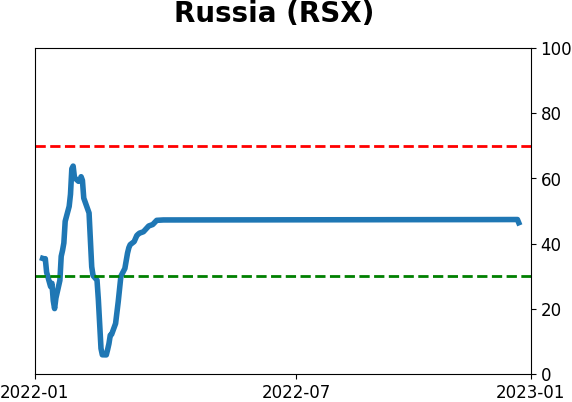
Sentiment Around The World
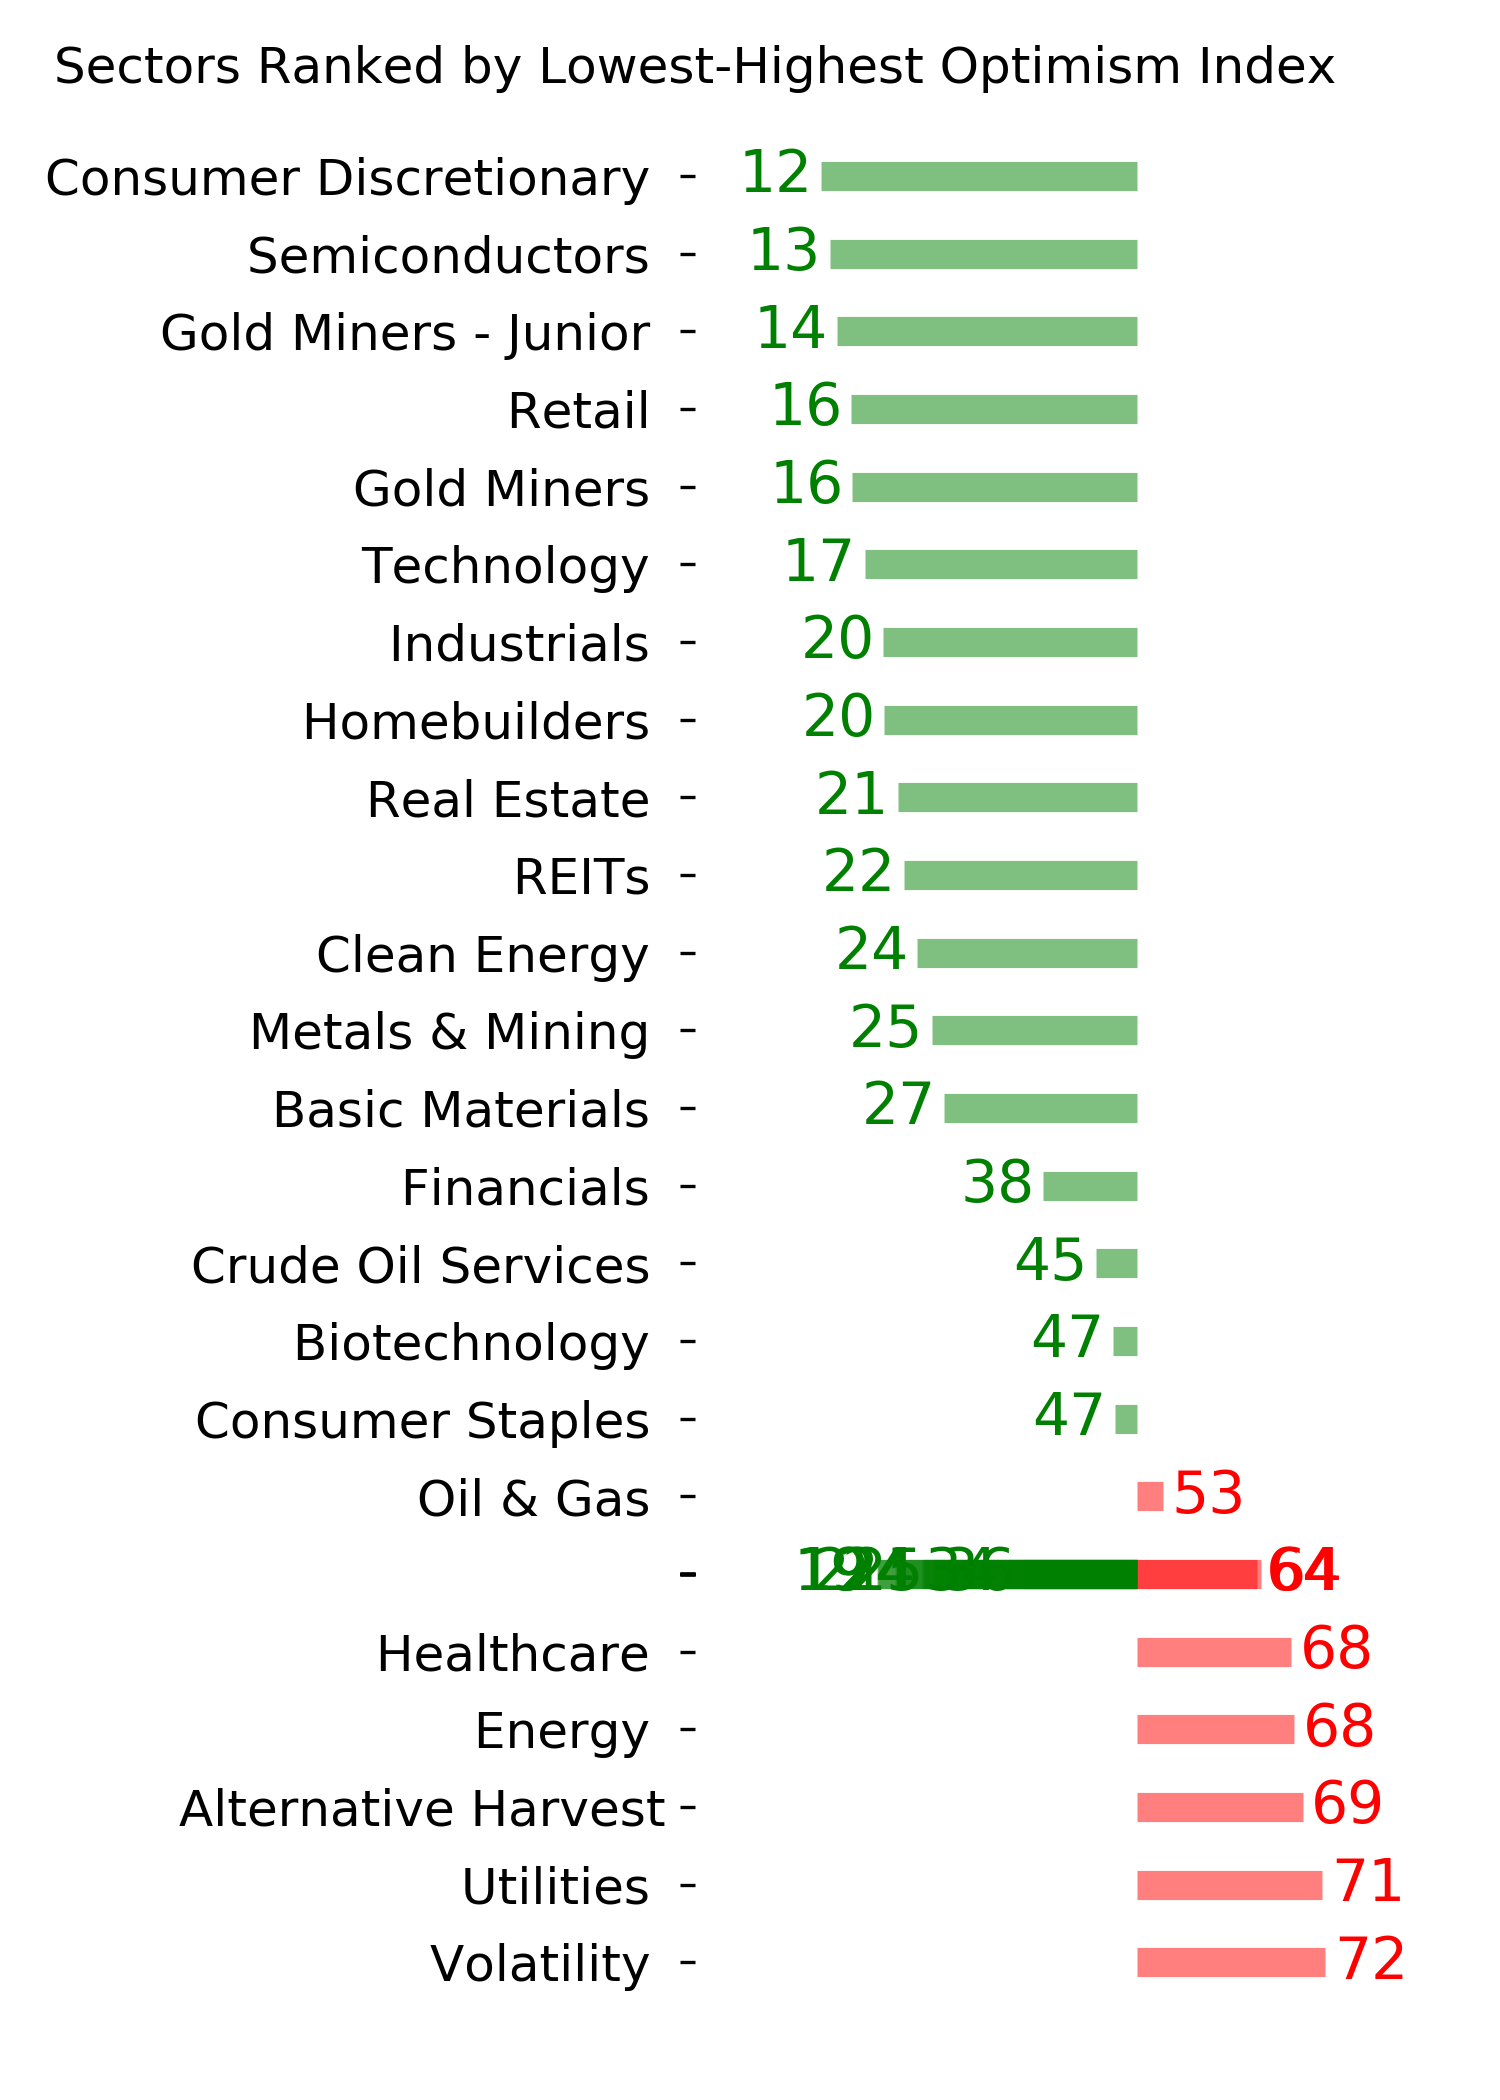
Optimism Index Thumbnails
|
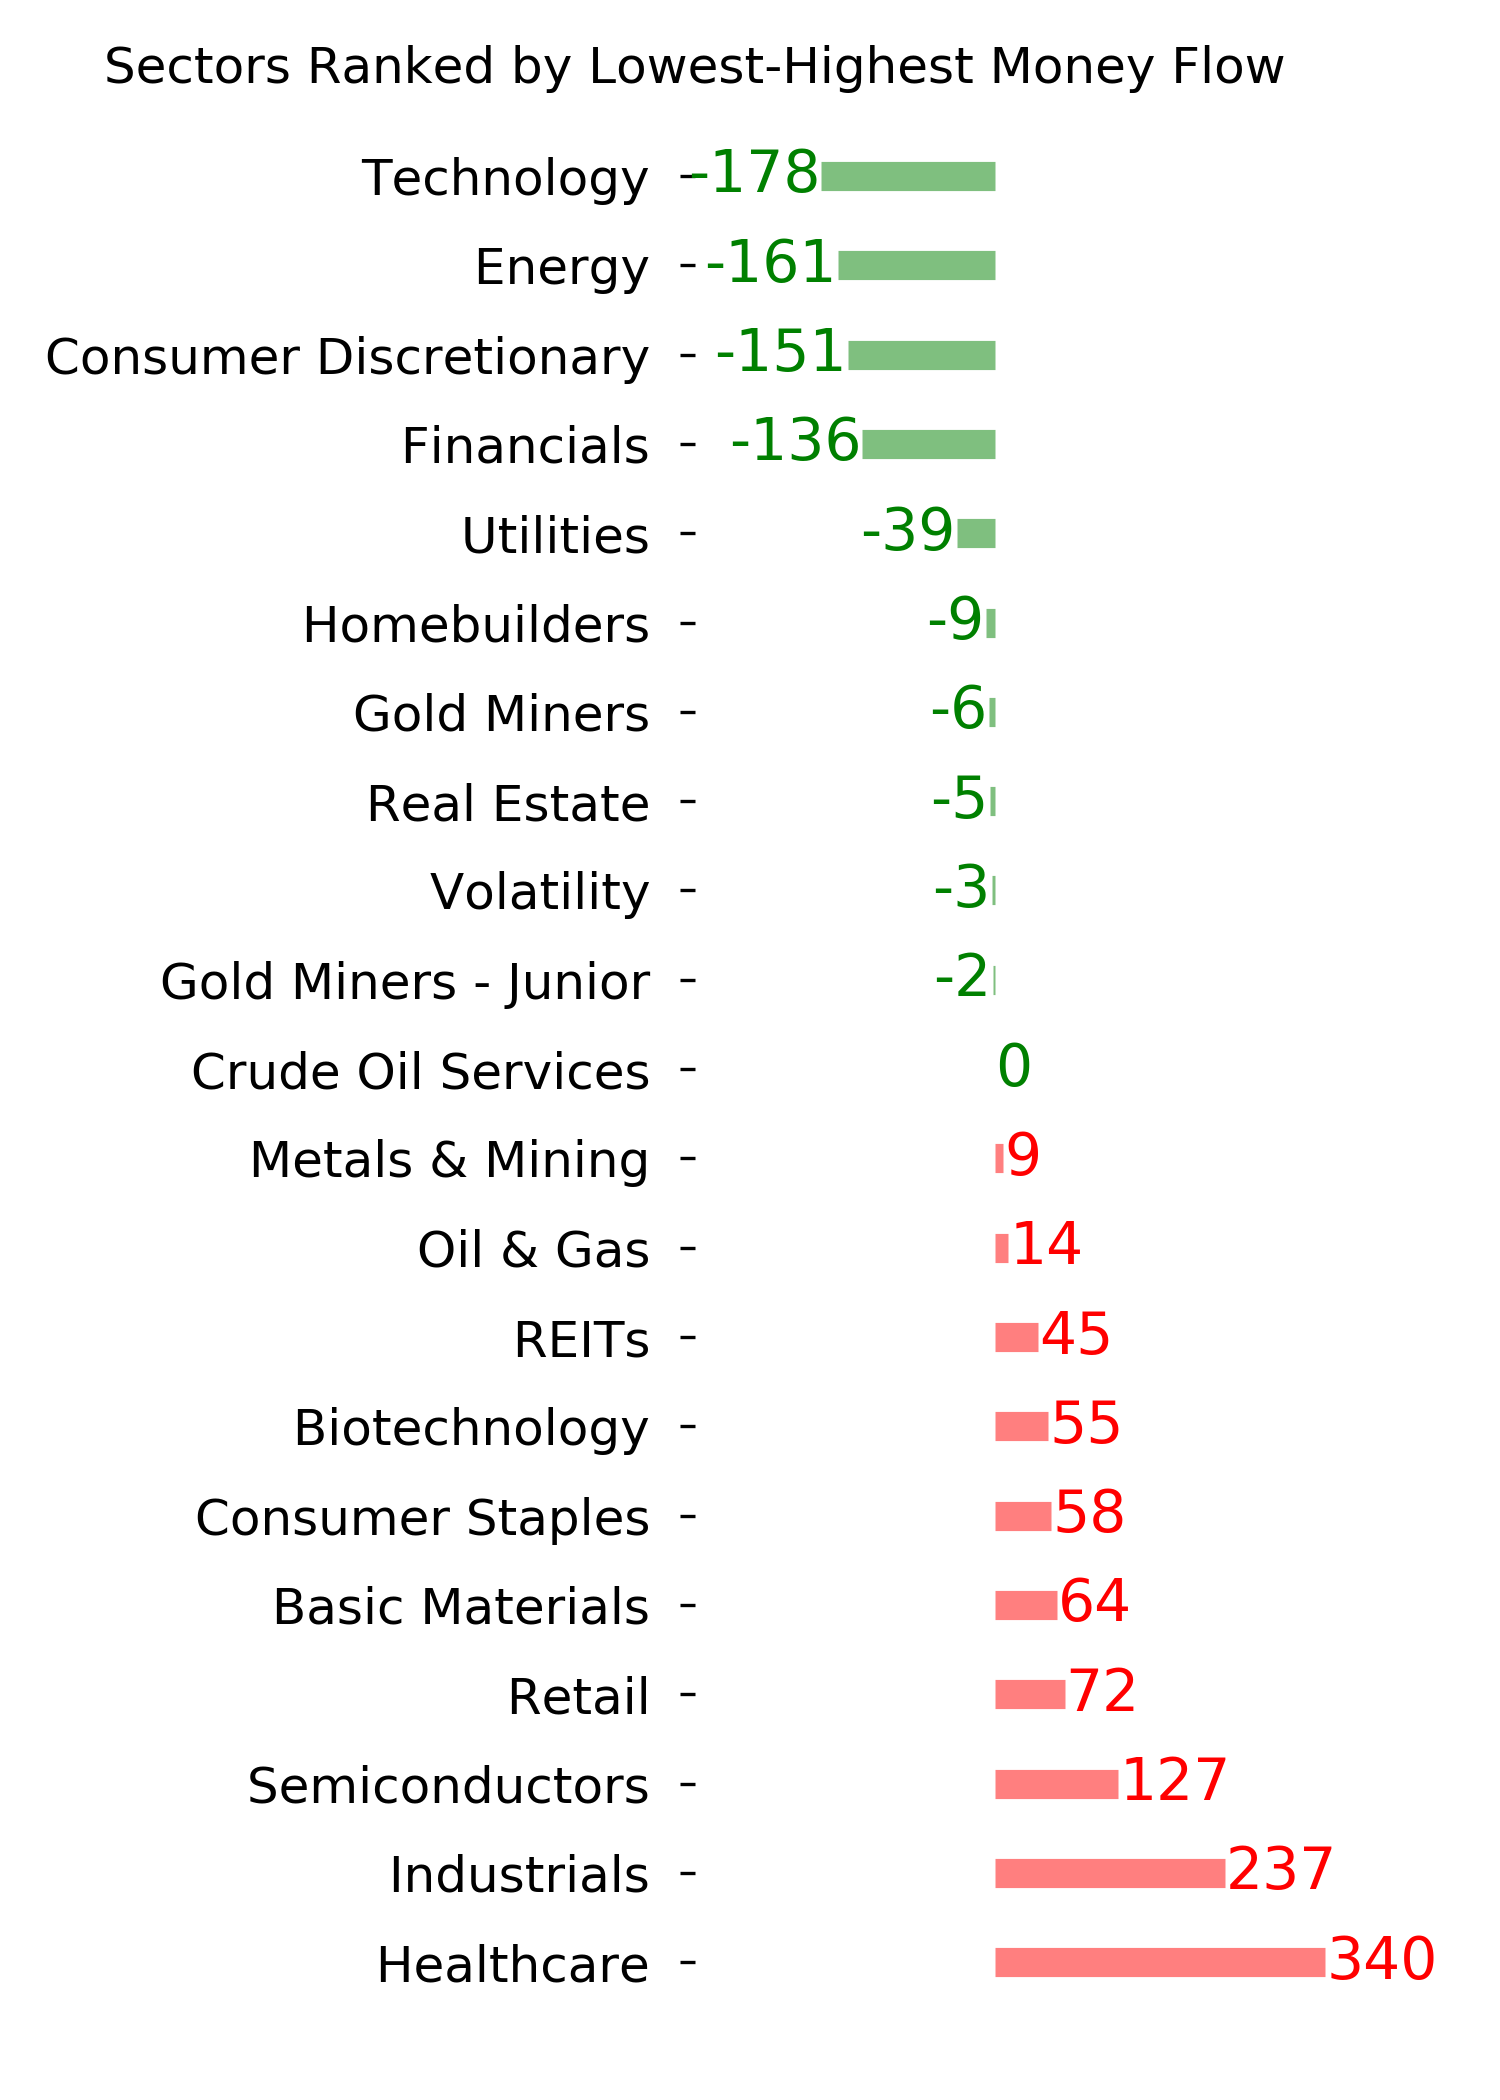
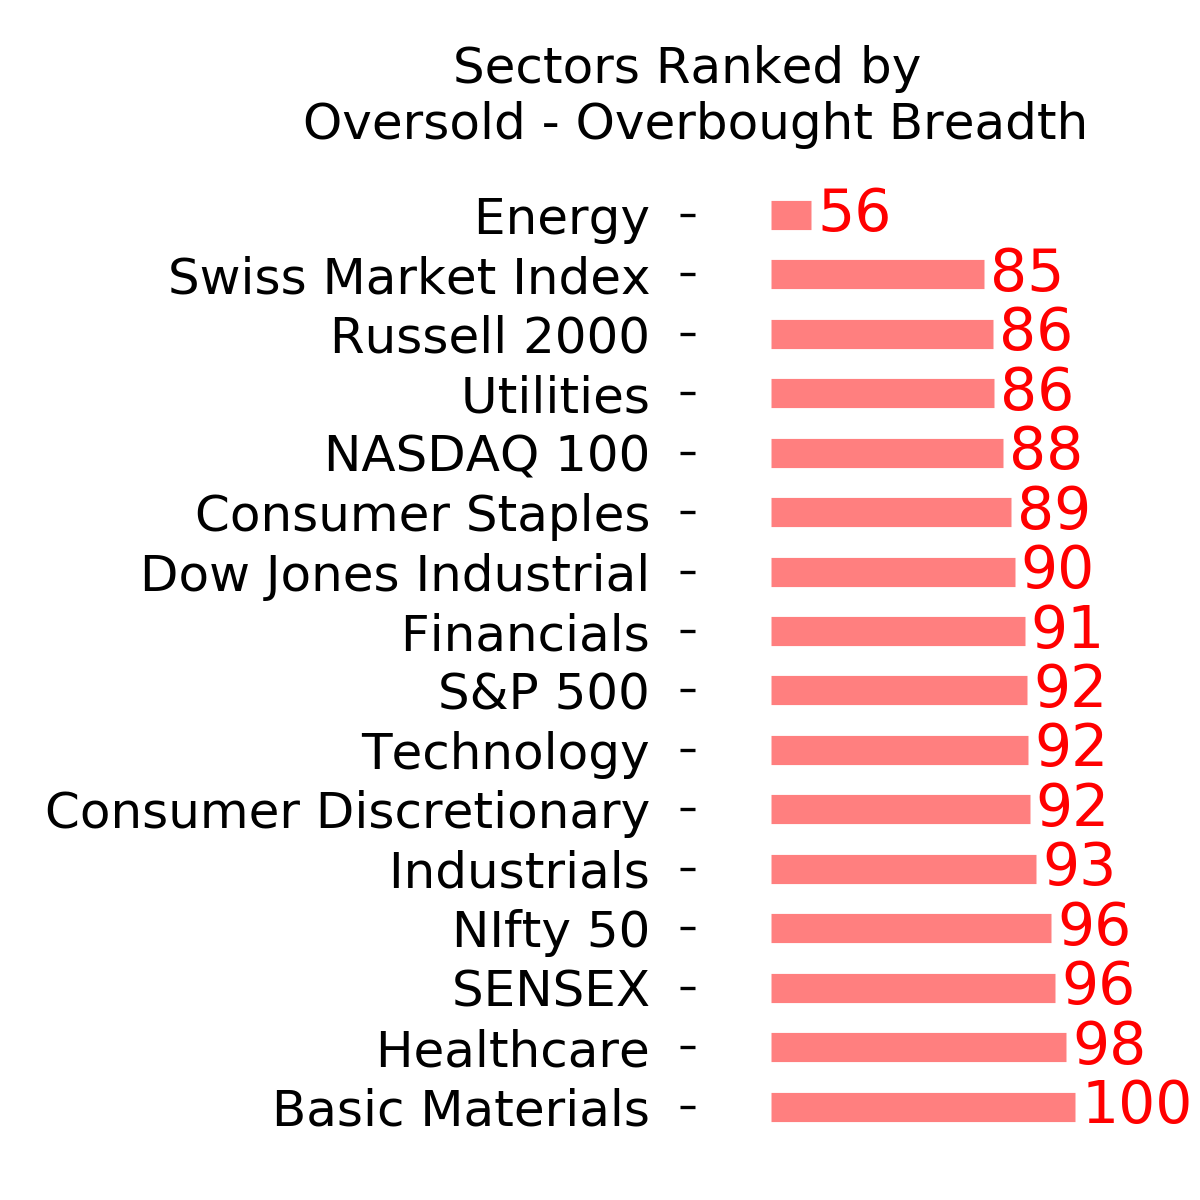
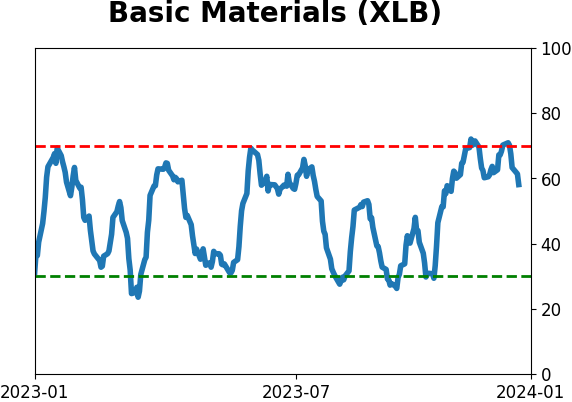
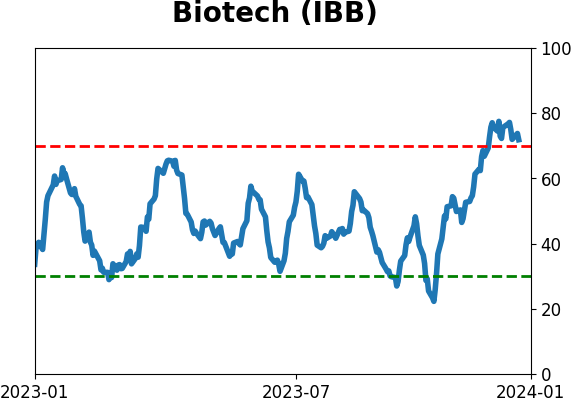
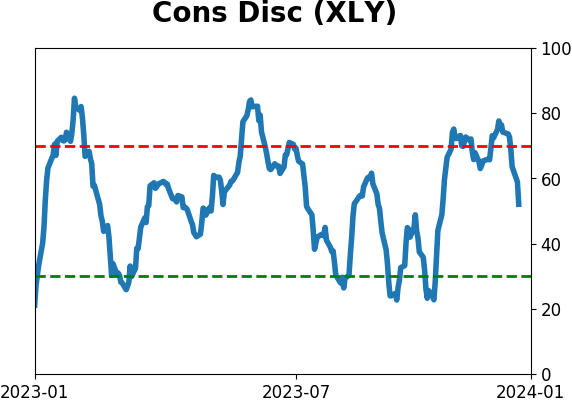
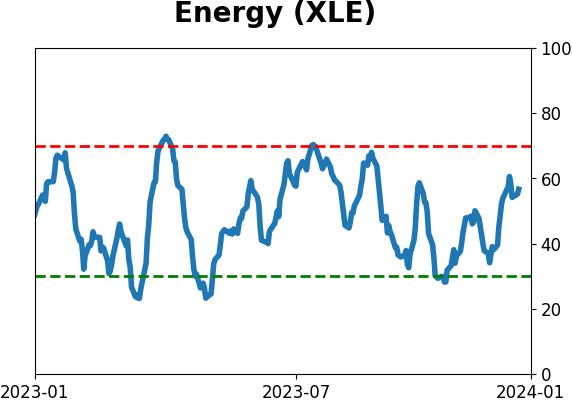
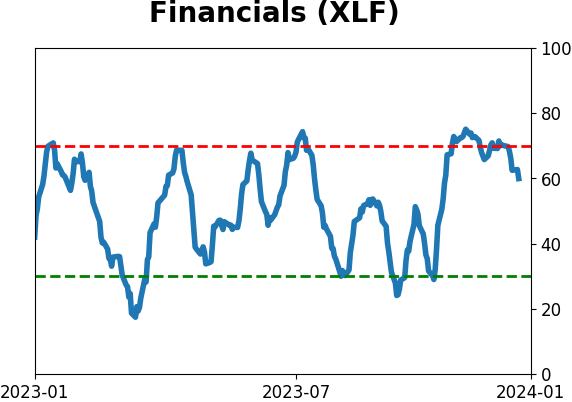
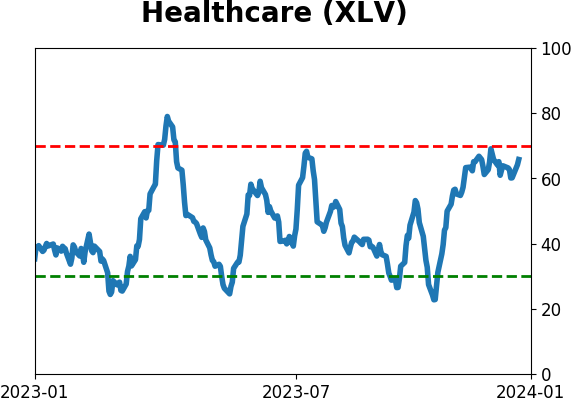
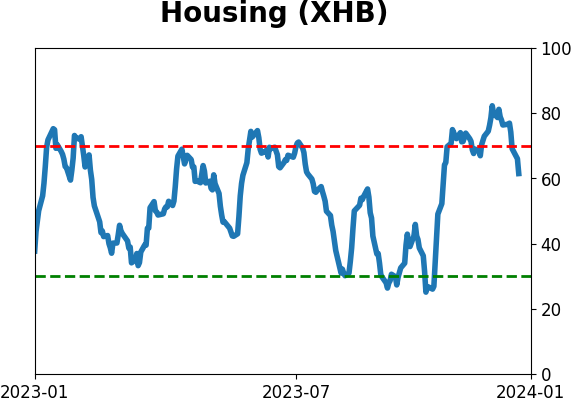
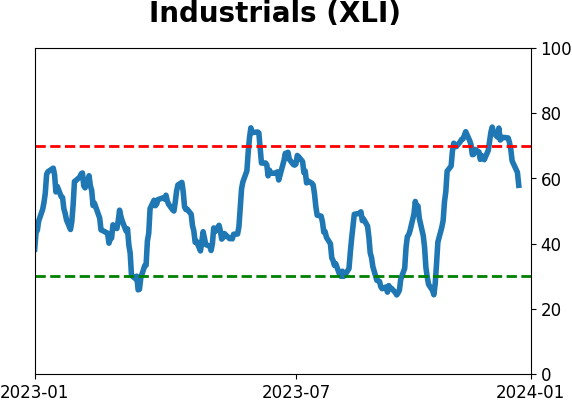
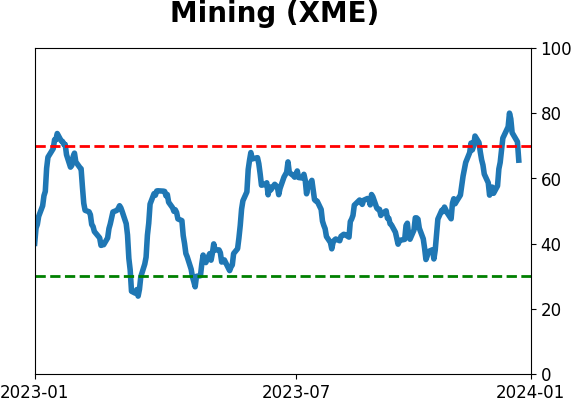
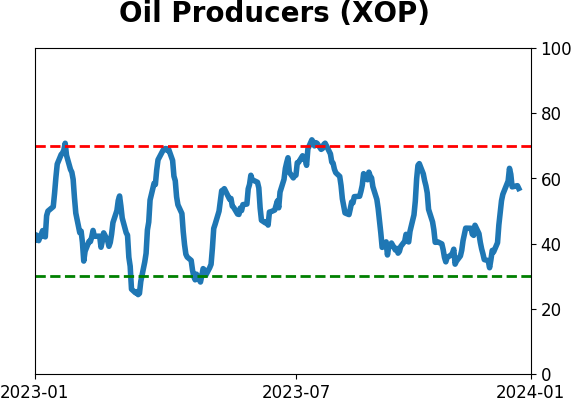
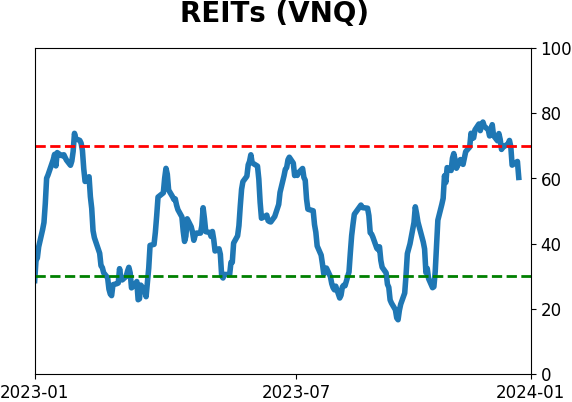
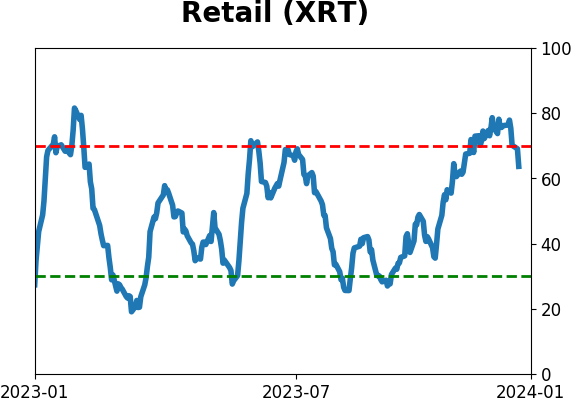
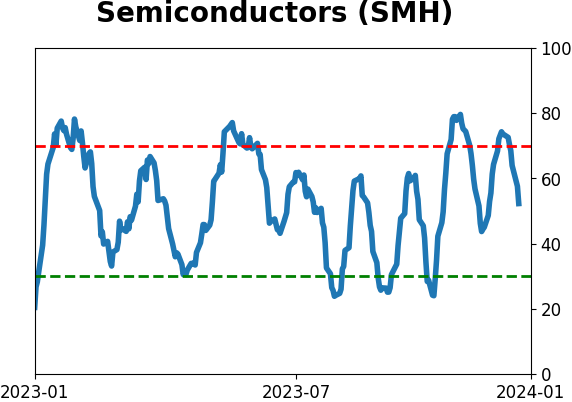
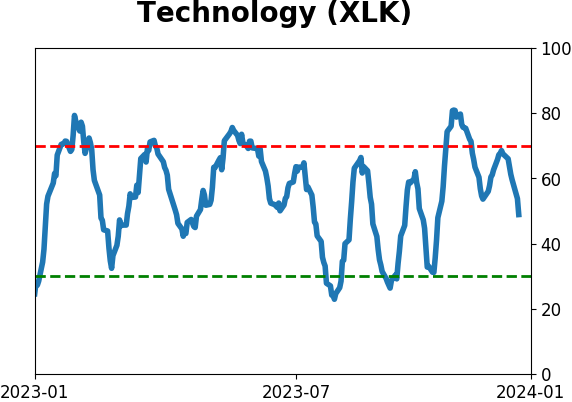
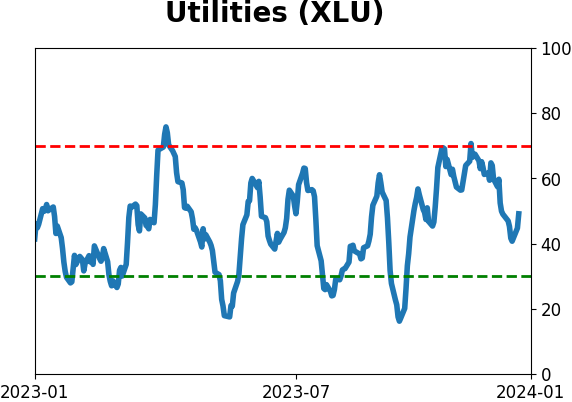
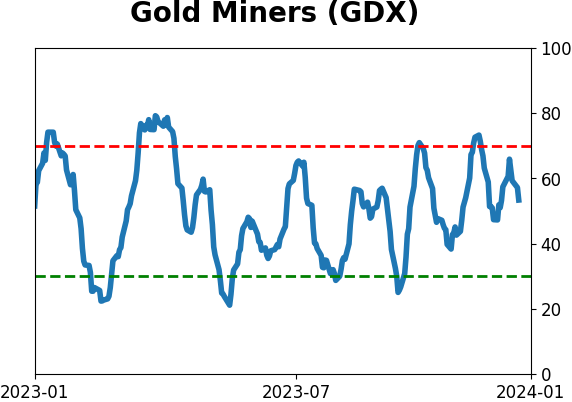
Sector ETF's - 10-Day Moving Average
|
|
|
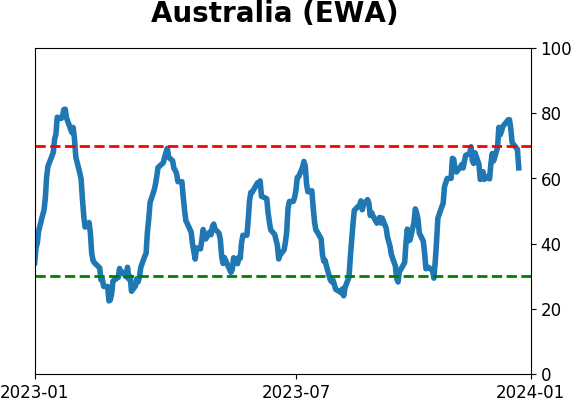
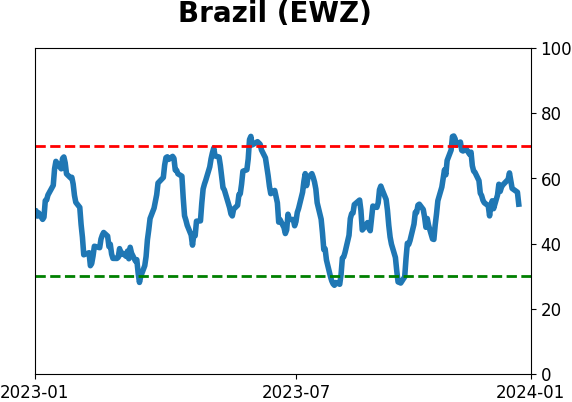
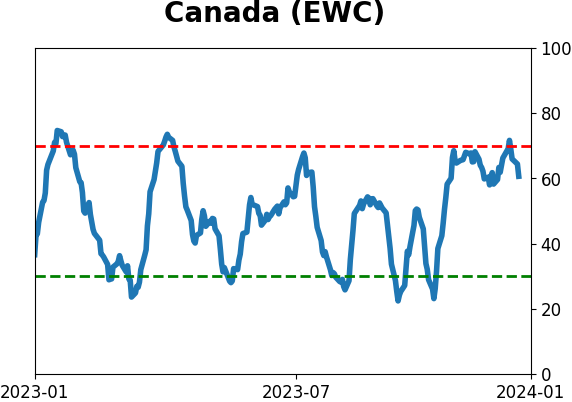
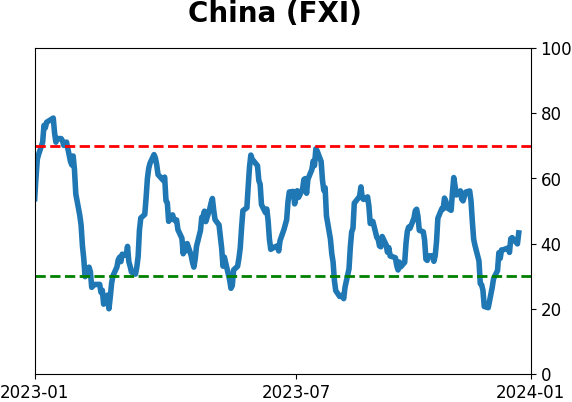
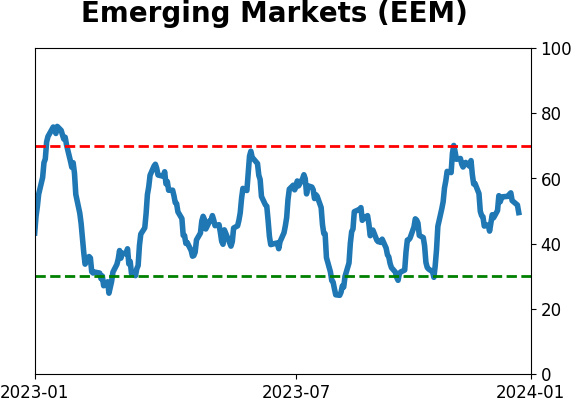
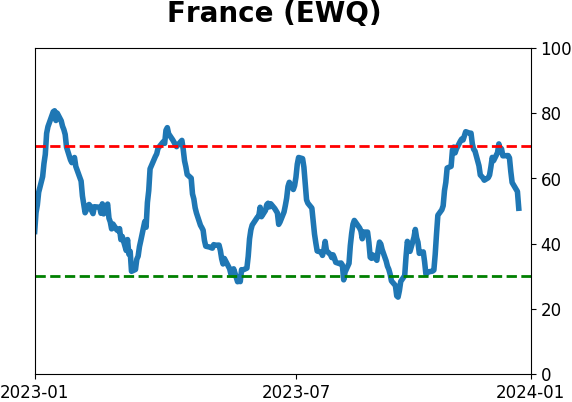
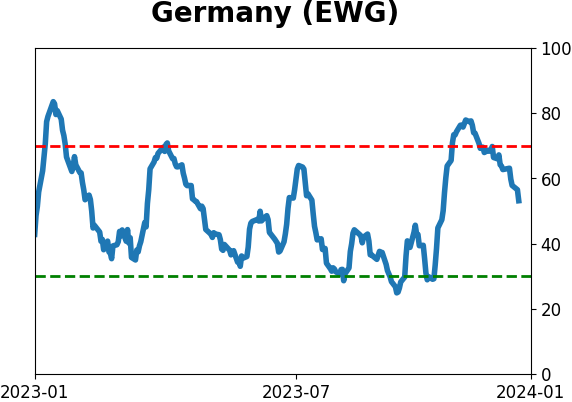
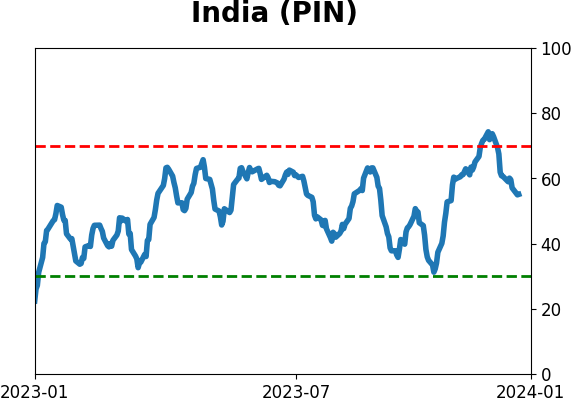
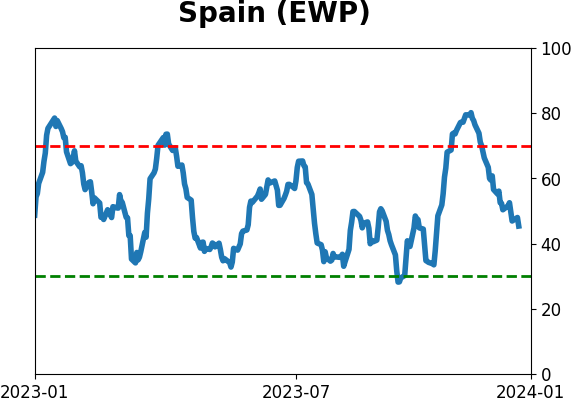
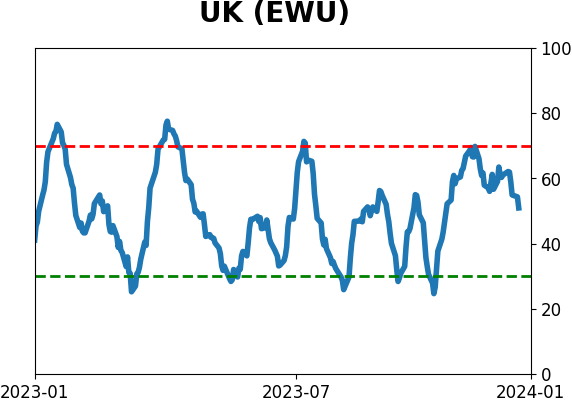
Country ETF's - 10-Day Moving Average
|
|
|
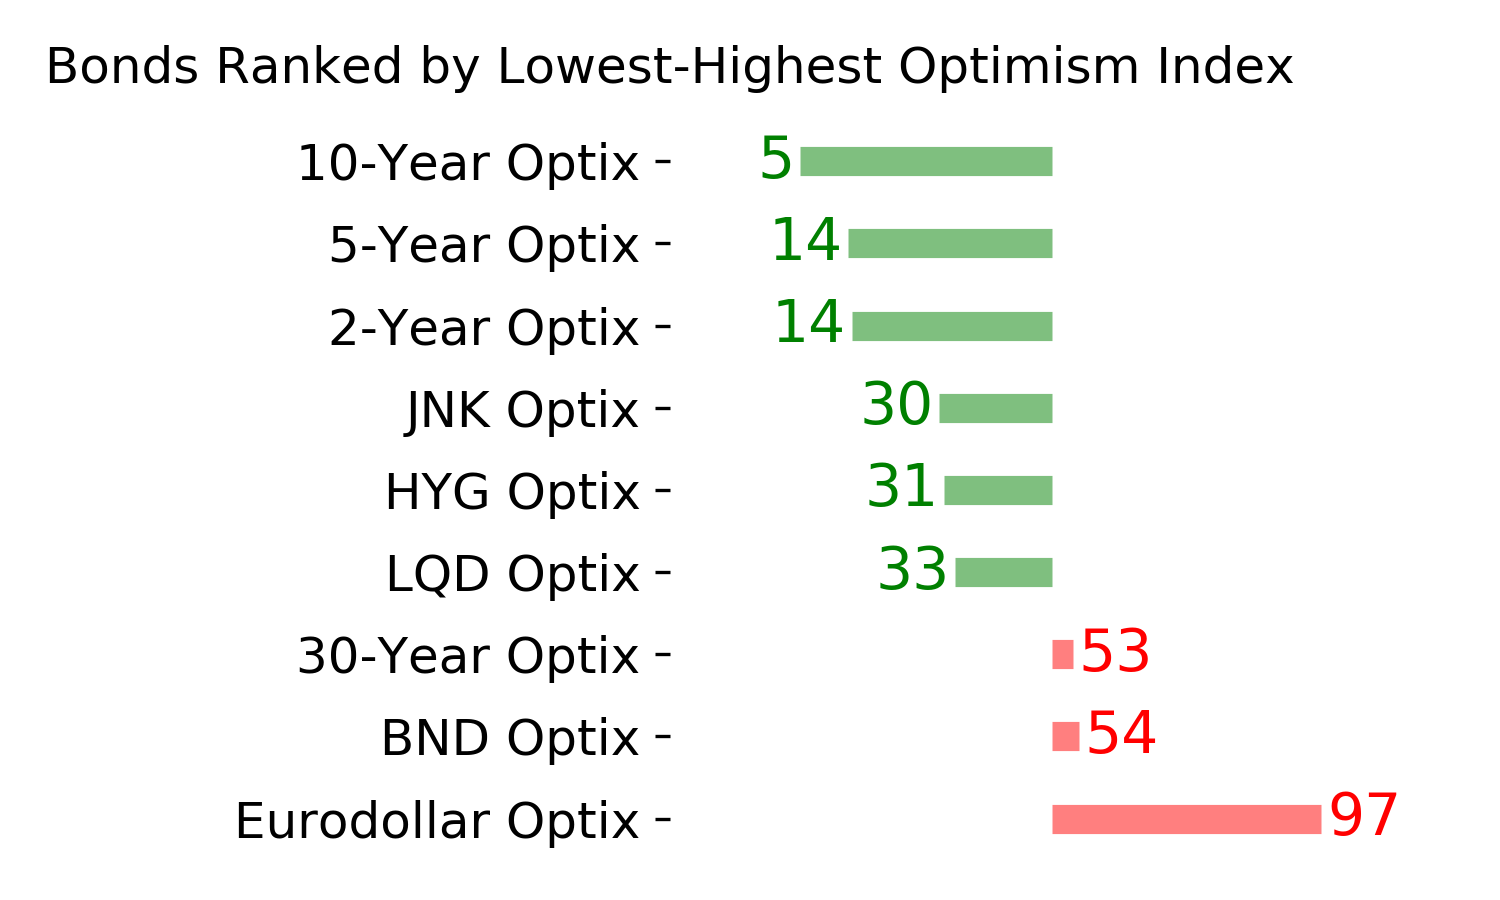
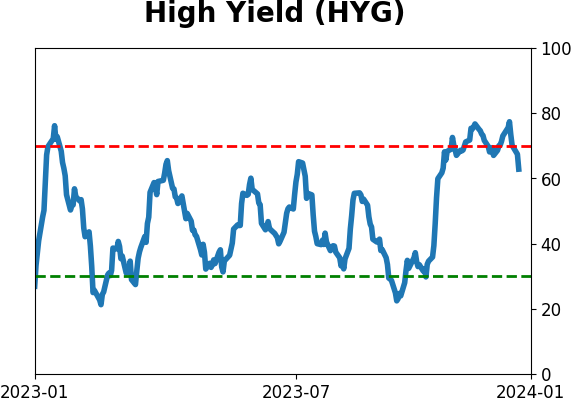
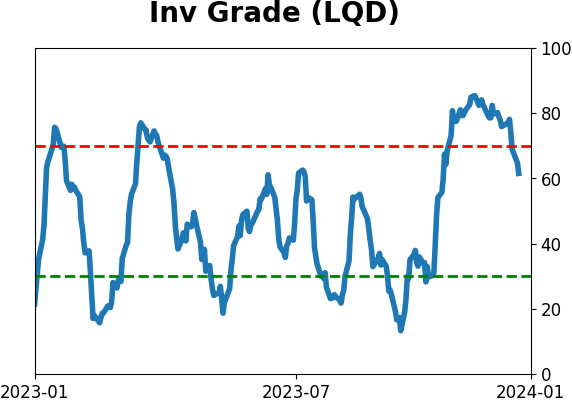
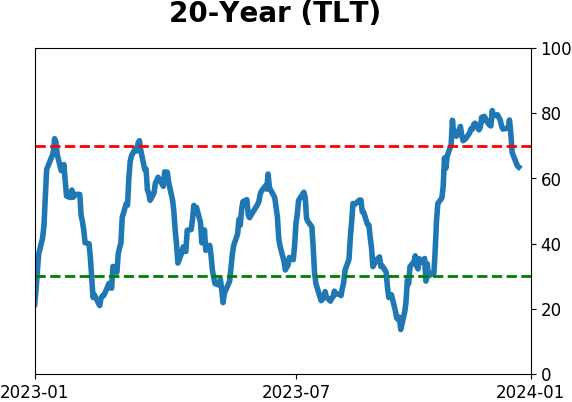
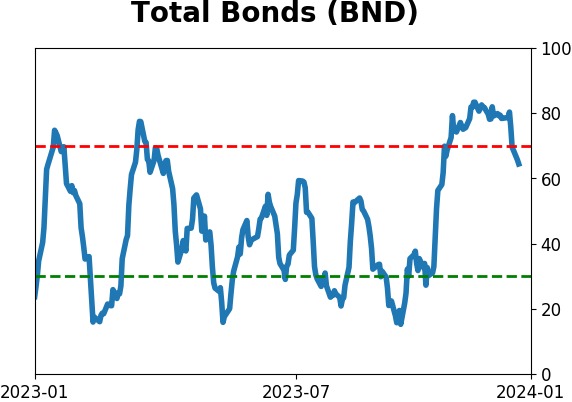
Bond ETF's - 10-Day Moving Average
|
|
|
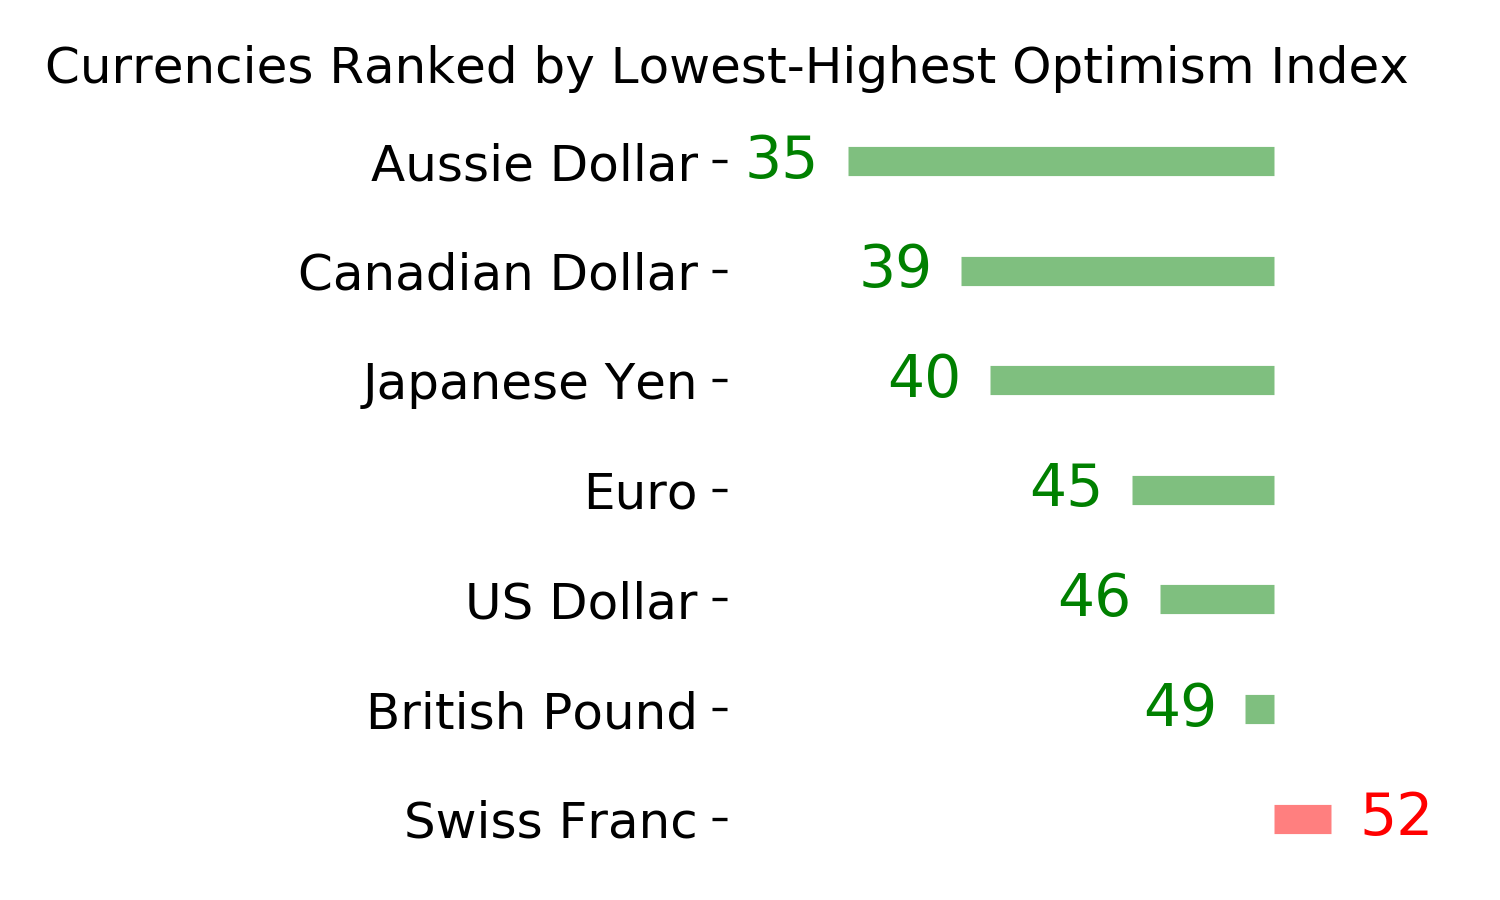
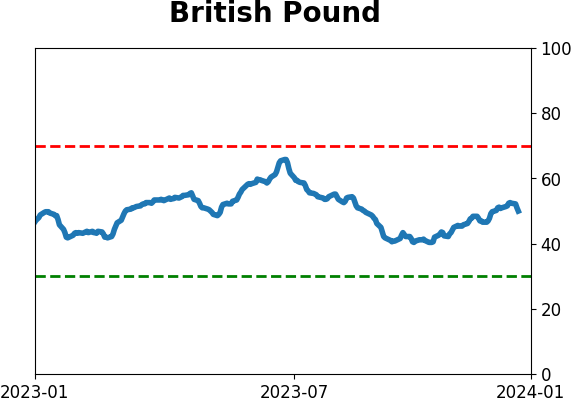
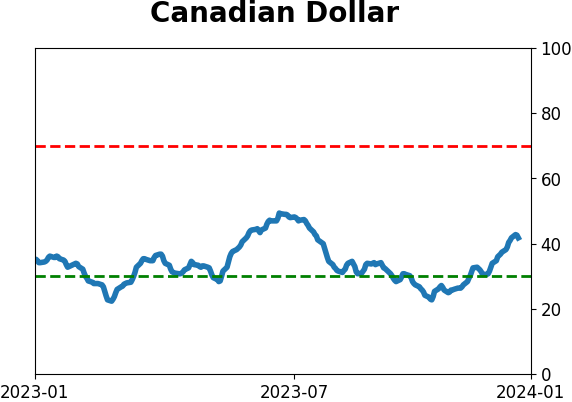
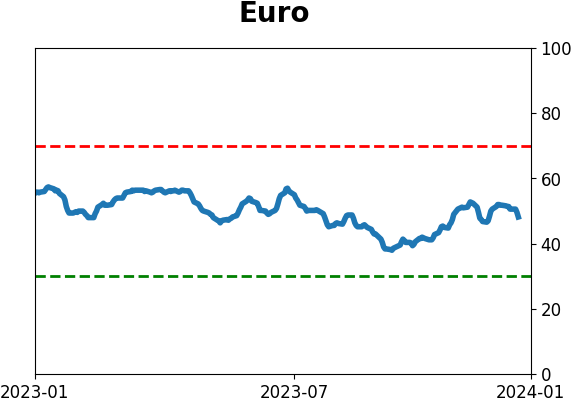
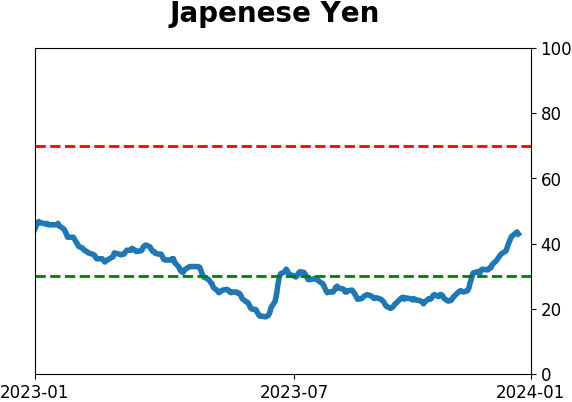
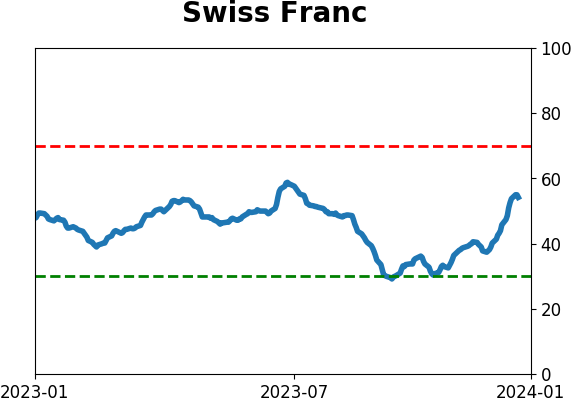
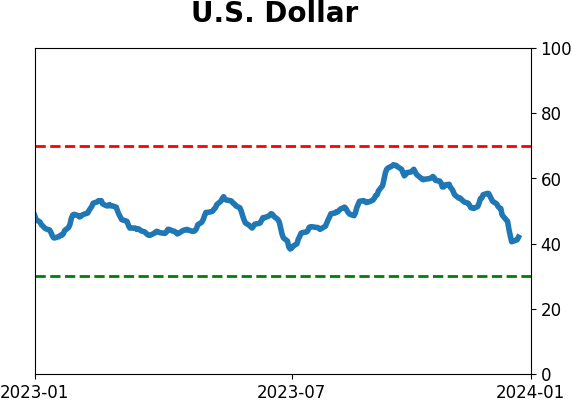
Currency ETF's - 5-Day Moving Average
|
|
|
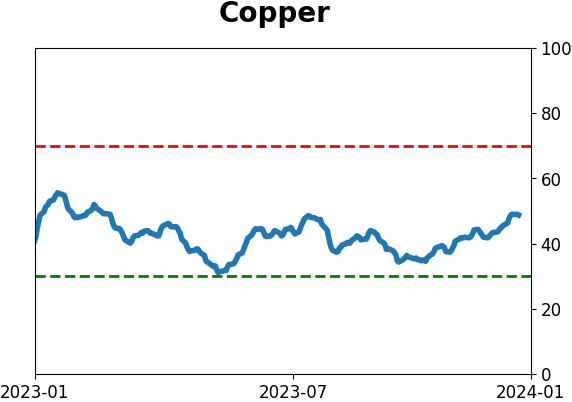
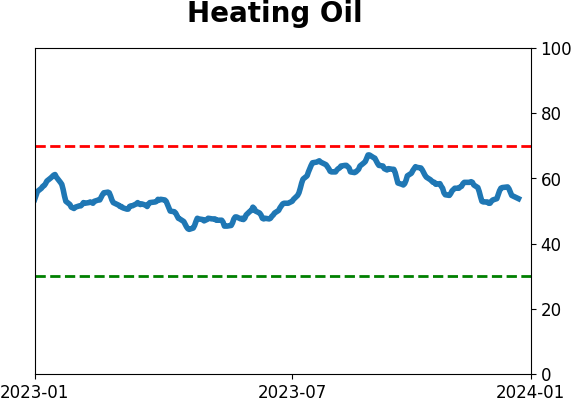
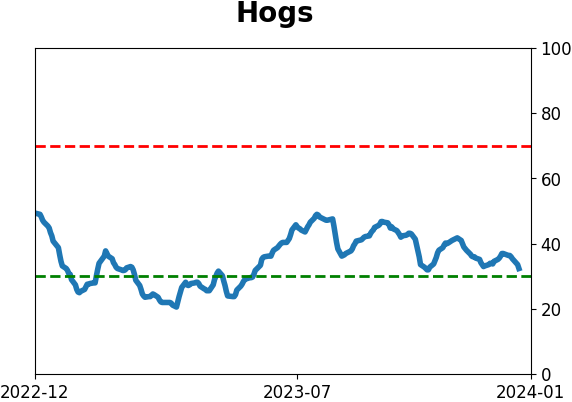
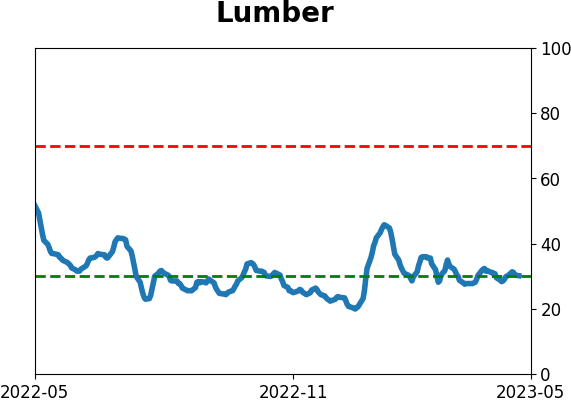
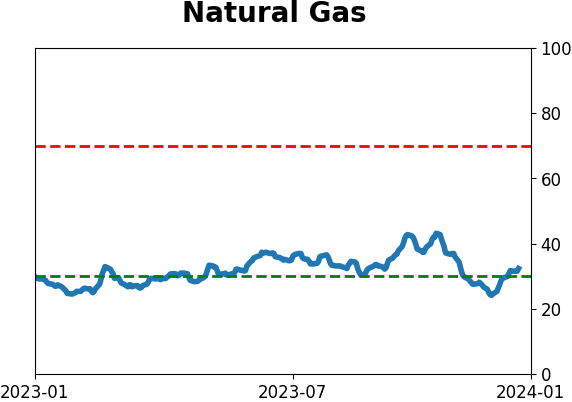
Commodity ETF's - 5-Day Moving Average
|
|