Headlines
|
|
A whole week with more than 90% of S&P members in short-term uptrends:
After a mild oversold reading in December, more than 90% of stocks in the S&P 500 traded above their 10-day moving averages. That thrust continued for all of the last week of December, one of the longest positive streaks in 70 years. Similar behavior preceded more gains for the index.
|
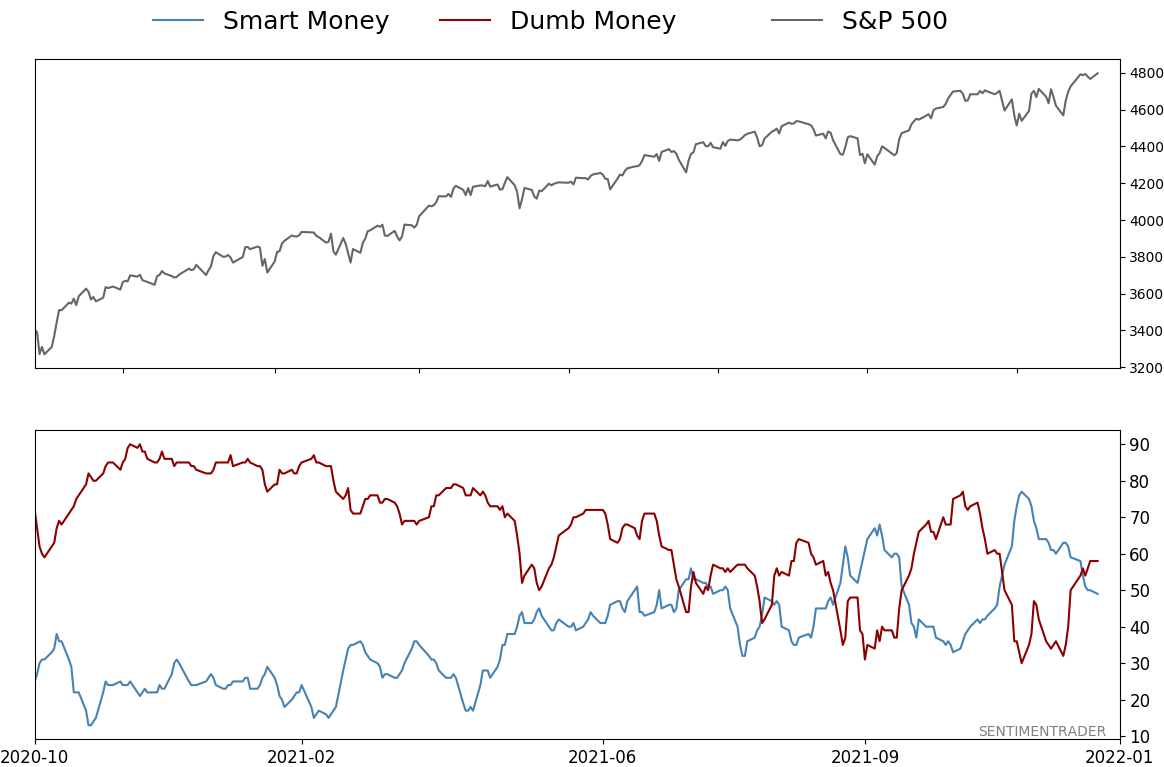
Smart / Dumb Money Confidence
|
Smart Money Confidence: 49%
Dumb Money Confidence: 58%
|
|
Risk Levels
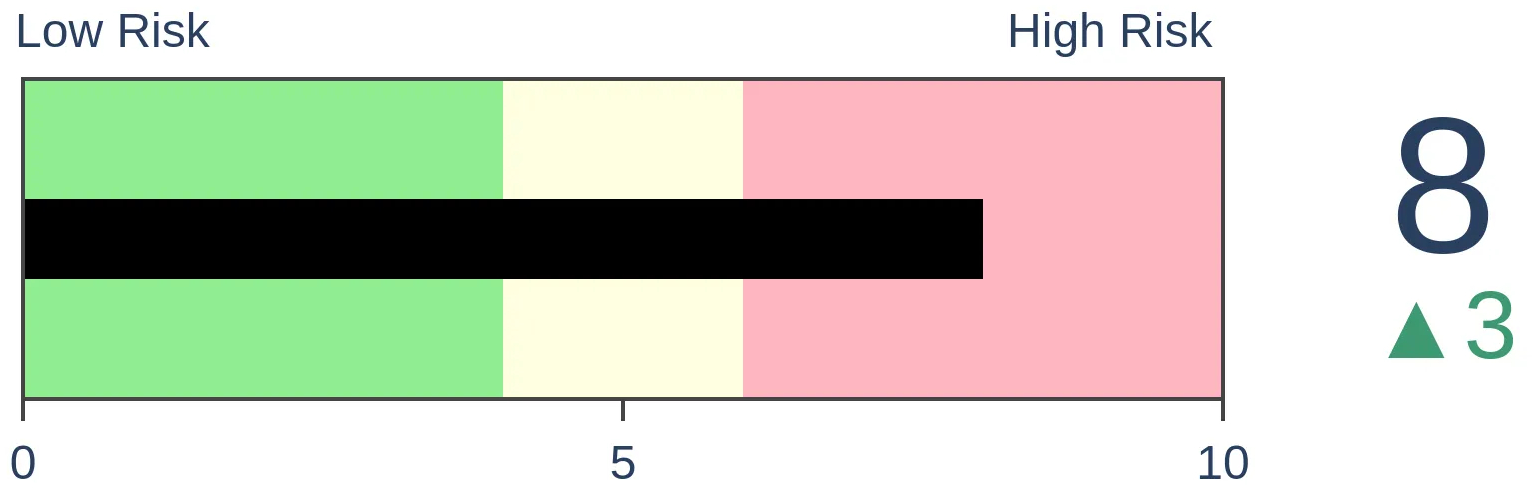
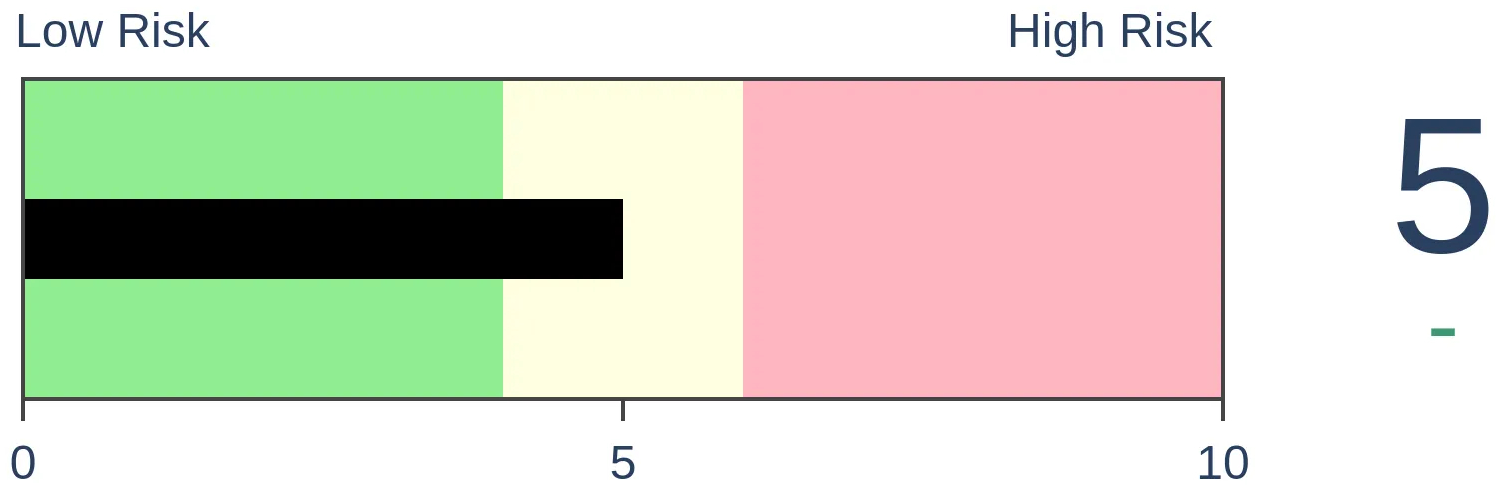
Stocks Short-Term
|
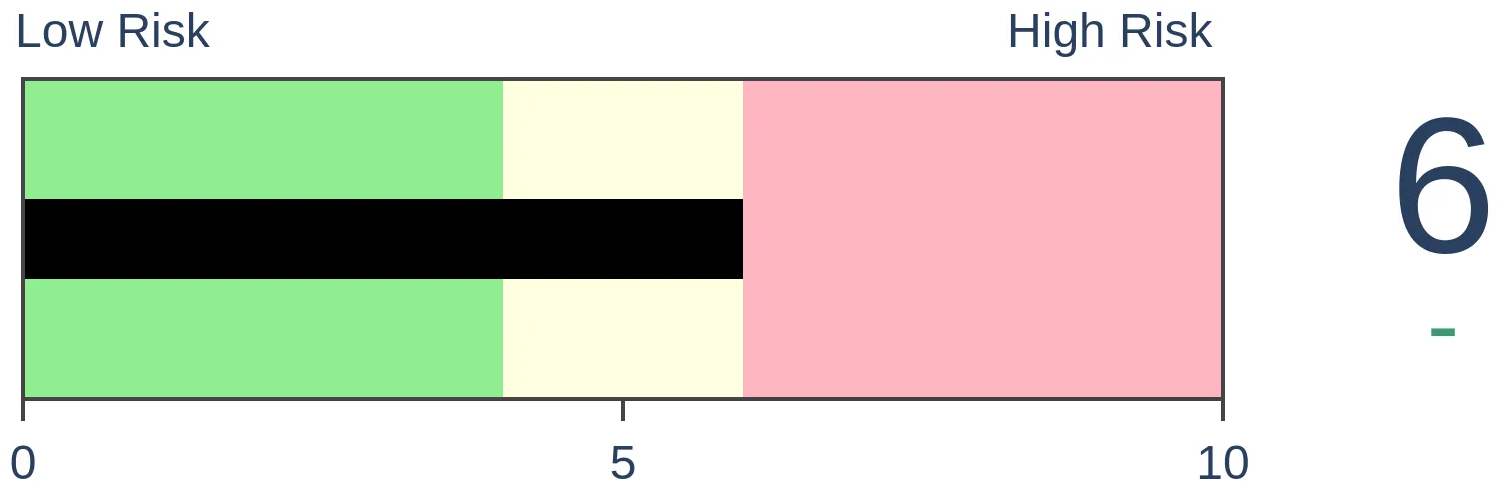
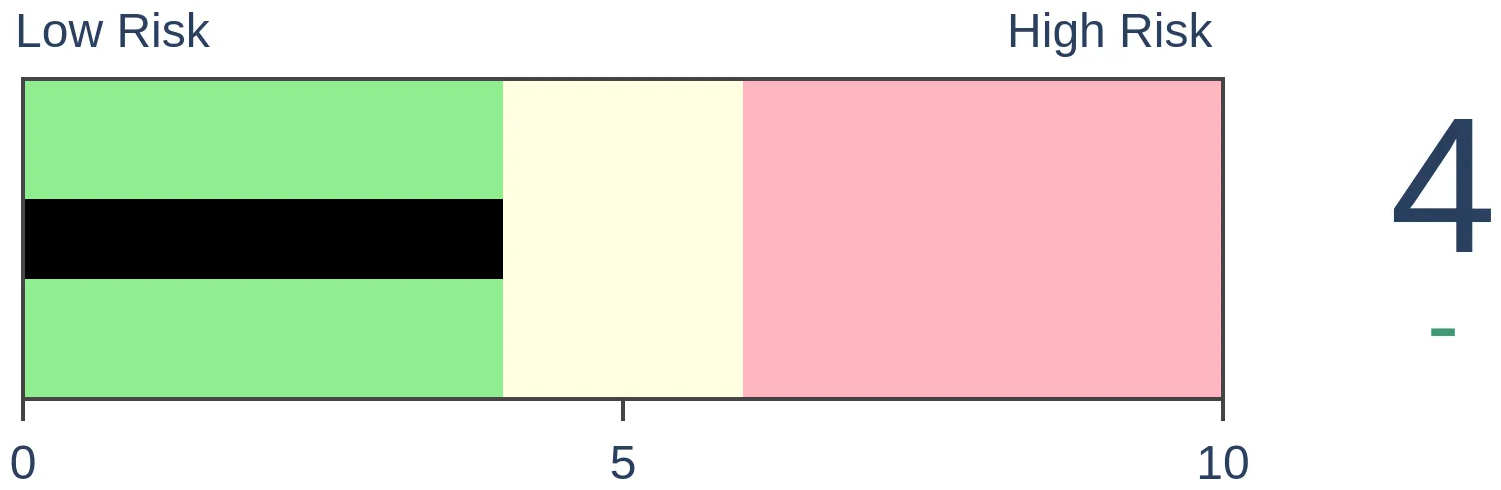
Stocks Medium-Term
|
|
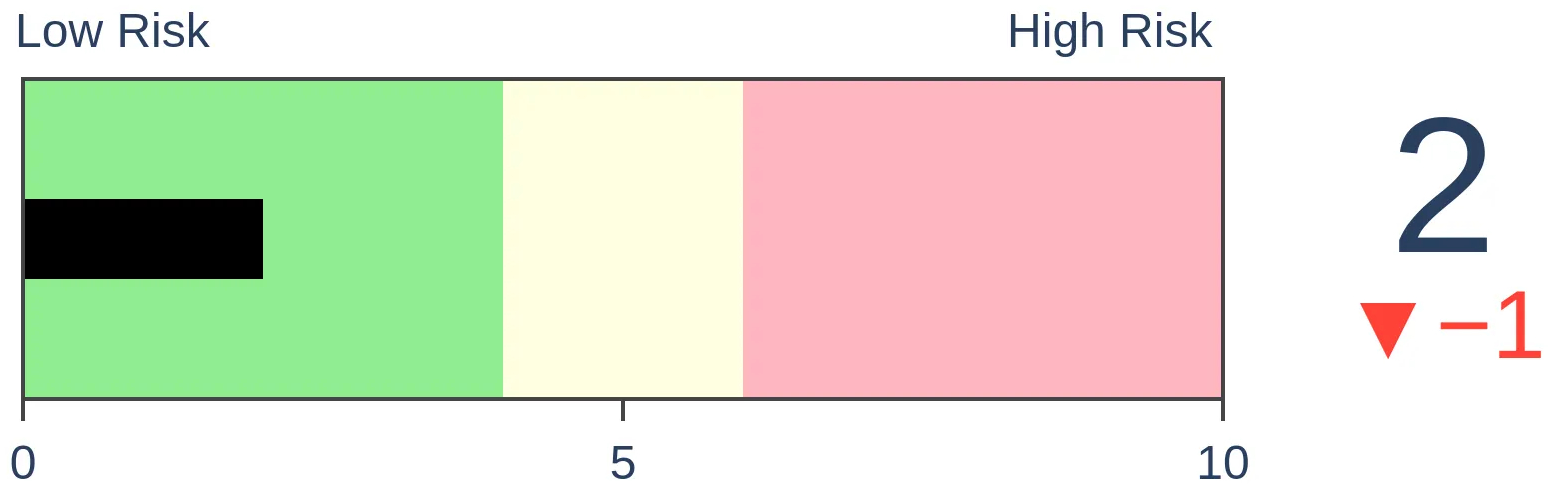
Bonds
|
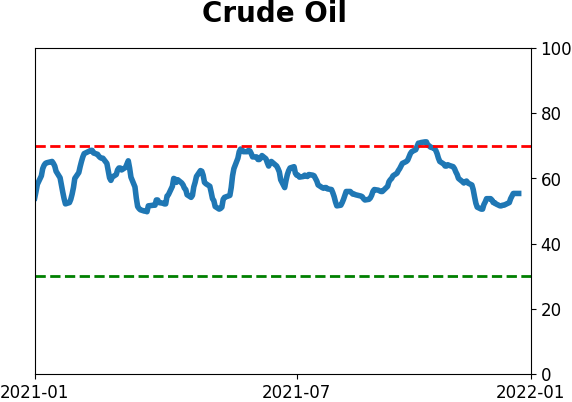
Crude Oil

|
|
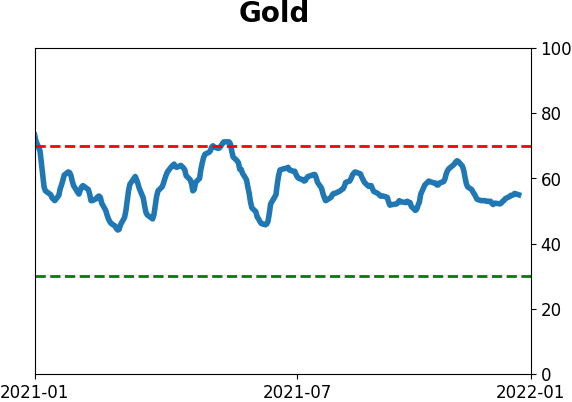
Gold
|
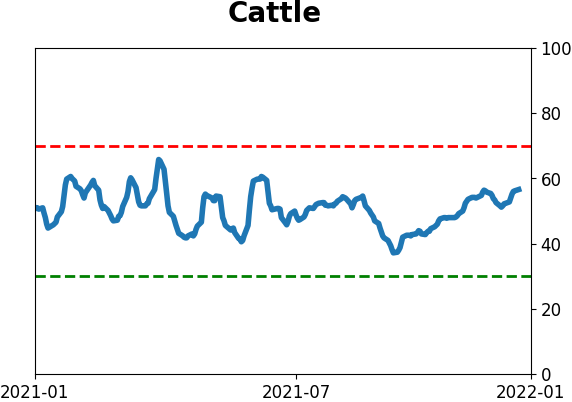
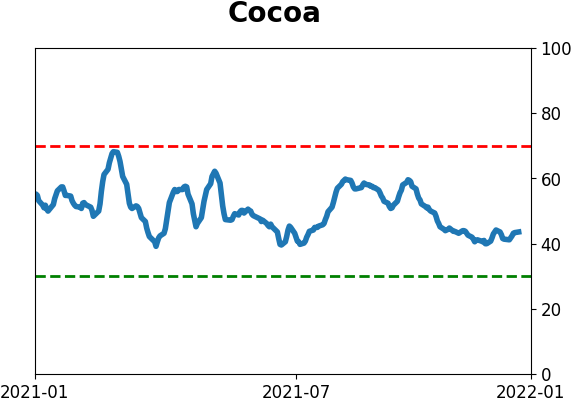
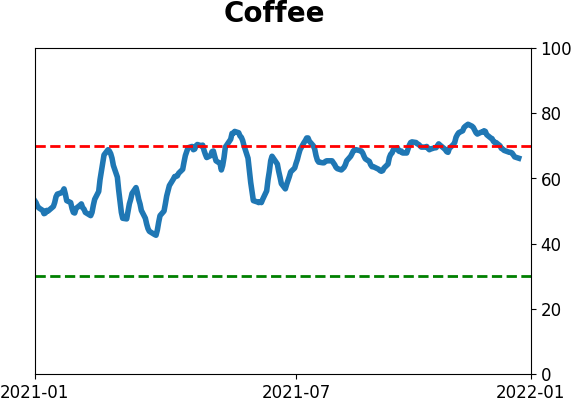
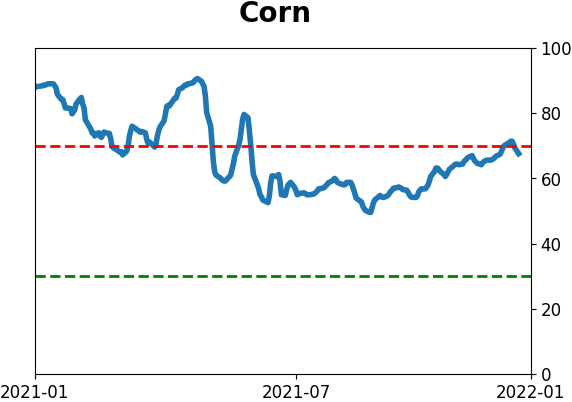
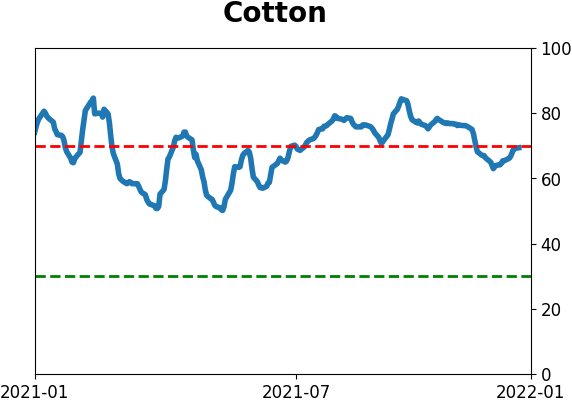
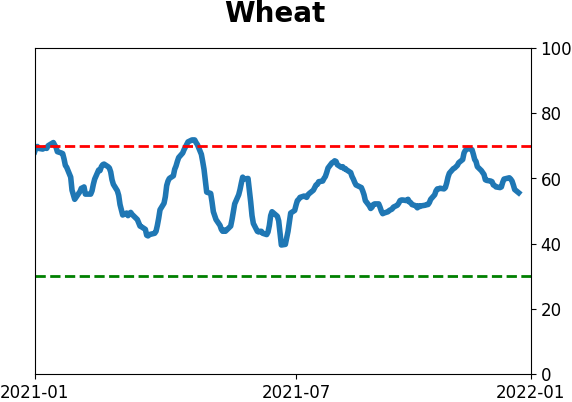
Agriculture
|
|
Research
By Jason Goepfert
BOTTOM LINE
After a mild oversold reading in December, more than 90% of stocks in the S&P 500 traded above their 10-day moving averages. That thrust continued for all of the last week of December, one of the longest positive streaks in 70 years. Similar behavior preceded more gains for the index.
FORECAST / TIMEFRAME
SPY -- Up, Long-Term
|
Key points:
- Almost all S&P 500 members are trading above their 10-day moving averages
- More than 90% of stocks have held above that average for a week straight
- Similar thrusts and streaks preceded gains for the S&P over the next 6 months almost without exception
Yet another positive breadth thrust
In early December, buying interest across stocks was broad and urgent. More than 80% of volume on the NYSE flowed into advancing securities, triggering a rare breadth thrust.
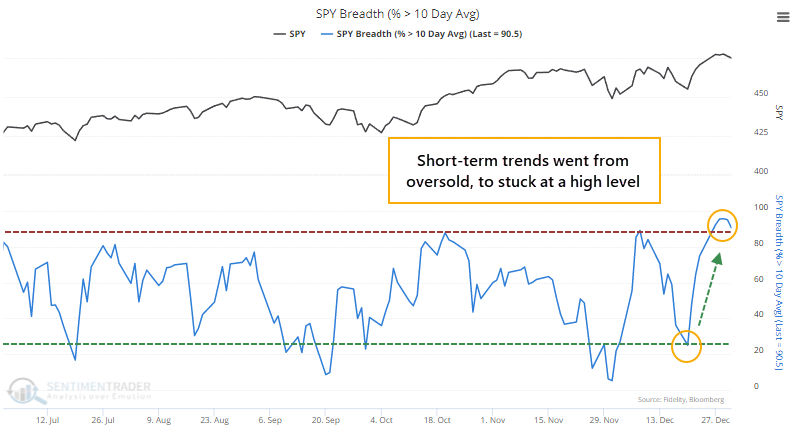
Within the most benchmarked index in the world, buying interest has been just as impressive. The percentage of S&P 500 member stocks trading above their 10-day moving averages cycled from only 25% on December 20 to more than 90% by last week.
The Backtest Engine shows that since 1998, the S&P 500 performed well after more than 90% of its stocks traded above their 10-day averages, preceding a positive one-year return after 187 out of 193 signals.
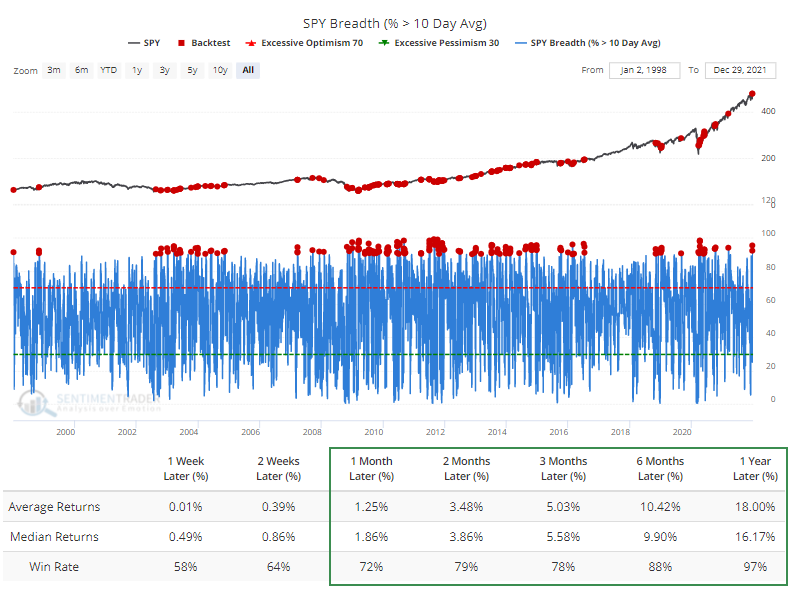
When these short-term trends cycled from below 25% (rounded) to above 90% on consecutive days, the S&P never lost ground over the next 6 months.
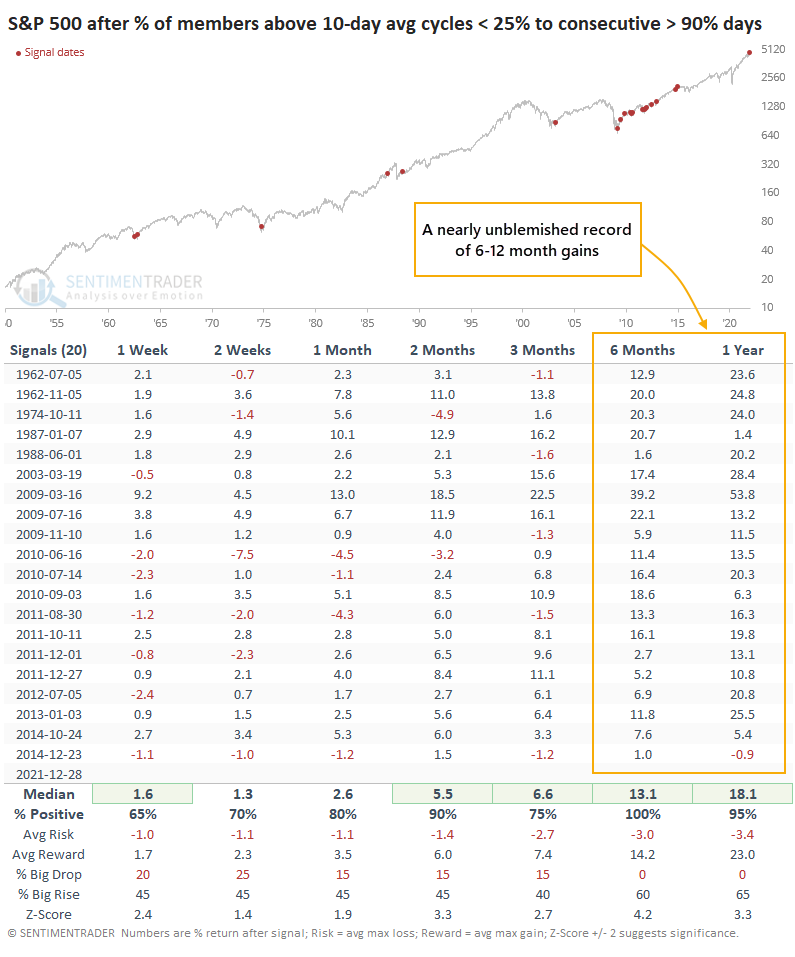
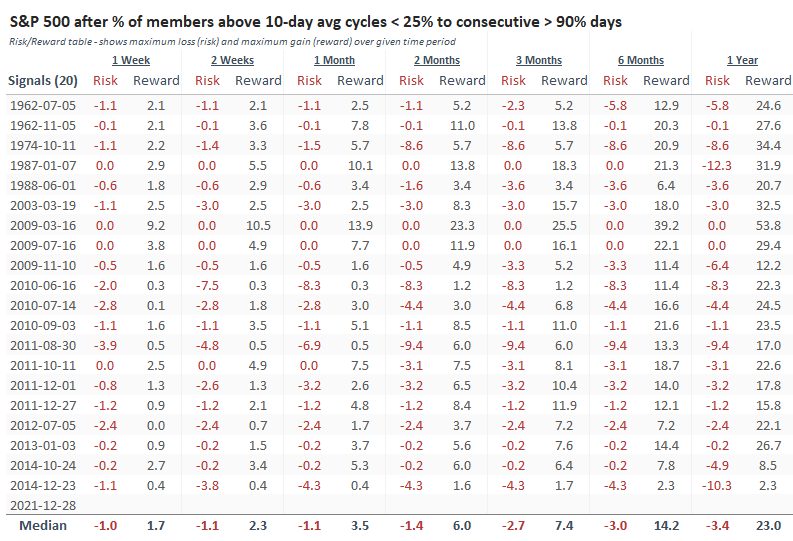
The Risk/Reward Table shows that over the next 6 months, there wasn't a single drawdown of more than -10% at any point after any of the signals. And 16 out of the 20 precedents showed a maximum gain of more than +10% during those 6 months.
A whole week of impressive trends
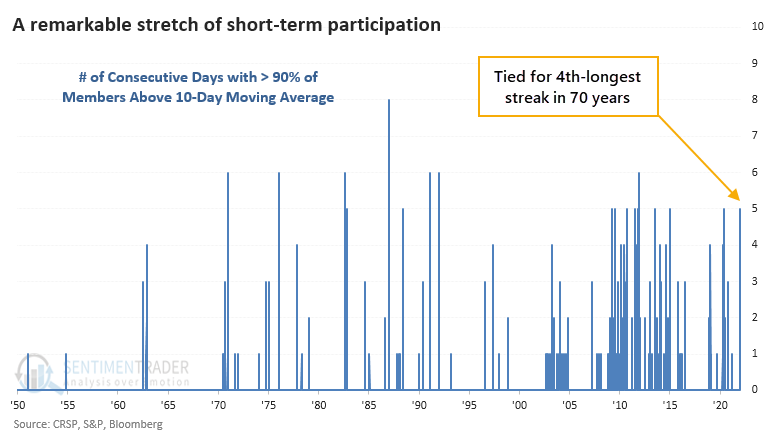
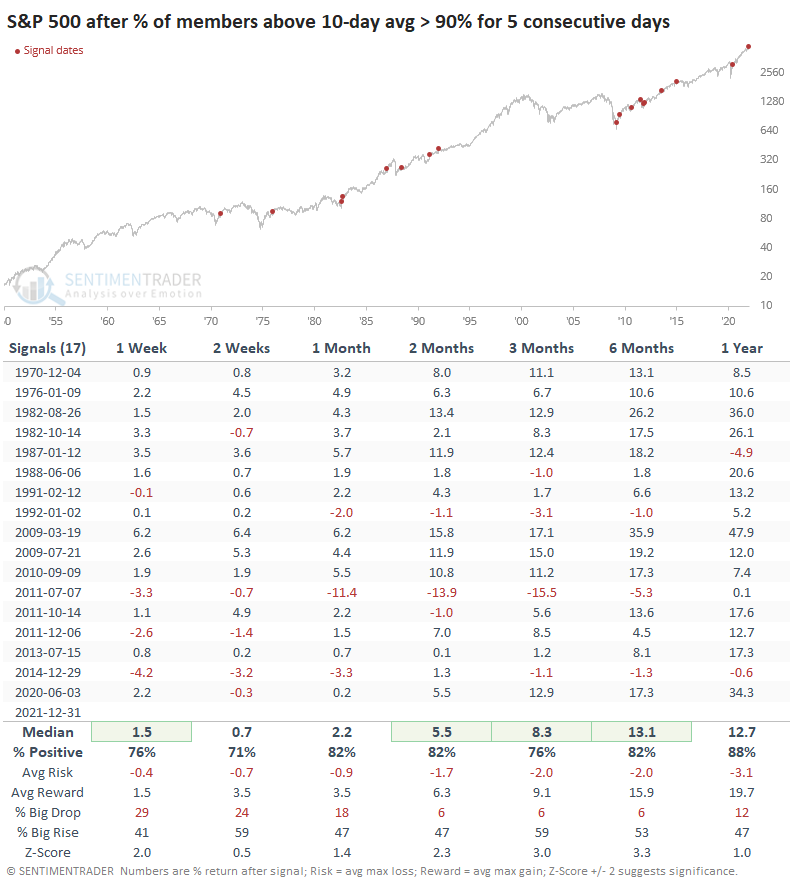
But it's even more impressive than that. By December 27, more than 90% of stocks were trading above their 10-day averages, and it hasn't dropped below 90% since then. This 5-day streak is tied for the 4th-longest since 1950.
After other times when the S&P went 5 straight days with more than 90% of its members above their 10-day averages, the index continued to gain in the months ahead with few (and temporary) exceptions.
Longer-term participation is "just right"
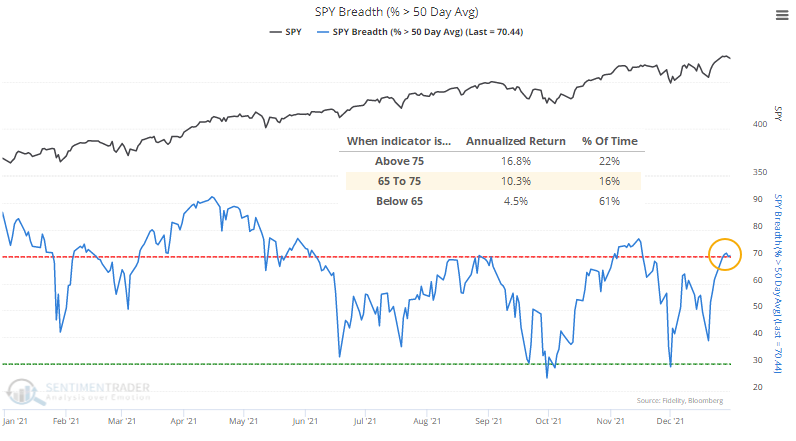
Looking at longer-term breadth metrics for the S&P 500, most of them are in the not-too-hot-not-too-cold zone. About 70% of stocks are trading above their 50-day averages, which since 1928 has given an annualized return of 10.3%.
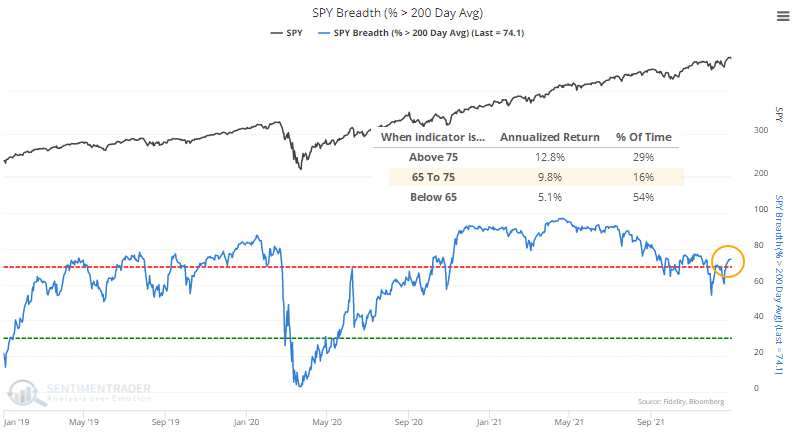
Just less than 75% of them are trading above their 200-day averages, which has also preceded annualized returns of about 10%.
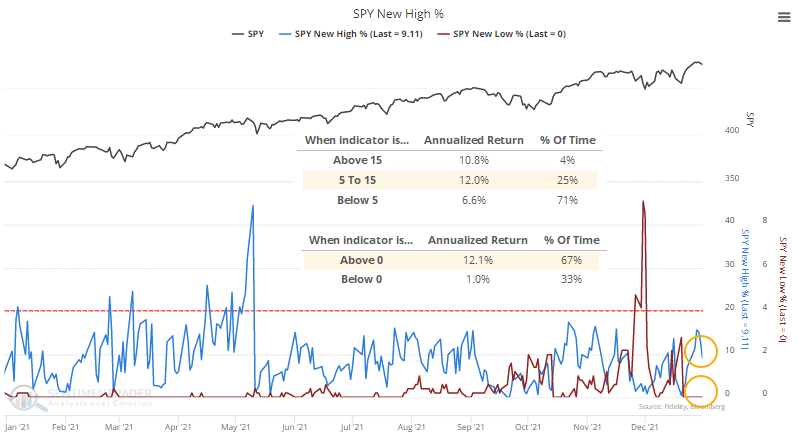
When the net percentage of stocks at 52-week highs minus 52-week lows is between 5% - 15%, as it is now, the index's annualized return bumped up to 12%. Actually, one of the most important aspects of this particular data set is simply whether there are more highs than lows. When lows dominate, the S&P's next-day return sinks dramatically, at least until there is a sudden surge that indicates capitulation.
What the research tells us...
There are definite concerns regarding valuations, bubble-like behavior in various assets, and a looming change in monetary policy. So far, equity investors don't seem to care, at least when it comes to blue-chip stocks. When we see sustained thrusts in short-term positive trends among members of the S&P 500, as we did at the end of December, it has preceded further gains almost without exception.
Active Studies
| Time Frame | Bullish | Bearish | | Short-Term | 2 | 0 | | Medium-Term | 11 | 2 | | Long-Term | 10 | 4 |
|
Indicators at Extremes
Portfolio
| Position | Description | Weight % | Added / Reduced | Date | | Stocks | RSP | 35.9 | Added 25.2% | 2022-01-03 | | Bonds | 32.7% BND, 7.1% SCHP | 39.8 | Added 8.3% | 2021-10-26 | | Commodities | GCC | 2.4 | Reduced 2.1%
| 2020-09-04 | | Precious Metals | GDX | 4.6 | Reduced 4.2% | 2021-05-19 | | Special Situations | 9.8% KWEB, 4.7% XLE, 2.9% PSCE | 17.3 | Added 9.78% | 2021-10-01 | | Cash | | 0.1 | | |
|
Updates (Changes made today are underlined)
Coinciding with the new year, there was a thrust in participation in the S&P 500 near the end of December. Thrusts have been among the most consistent signals over the decades, and this is hard to ignore. I have greater confidence in thrusts when coming off extreme pessimism, like the spring of 2020, as opposed to near all-time highs on low volume. Still, it's hard to justify not being at least neutral weight stocks given this behavior. Bond sentiment is trying to recover from a recent bout of pessimism, and gold stocks are doing their thing which is not much at all. They've been flat for six months. Chinese tech stocks were doing exactly what they're supposed to do, then did *not* by plunging to new lows. This is troubling on a shorter-term time frame, but this was never meant for a trade, rather a multi-year investment. Recent behavior is troubling and I will not be adding any exposure as long as that's the case. RETURN YTD: 0.0% 2020: 8.7%, 2020: 8.1%, 2019: 12.6%, 2018: 0.6%, 2017: 3.8%, 2016: 17.1%, 2015: 9.2%, 2014: 14.5%, 2013: 2.2%, 2012: 10.8%, 2011: 16.5%, 2010: 15.3%, 2009: 23.9%, 2008: 16.2%, 2007: 7.8%
|
|
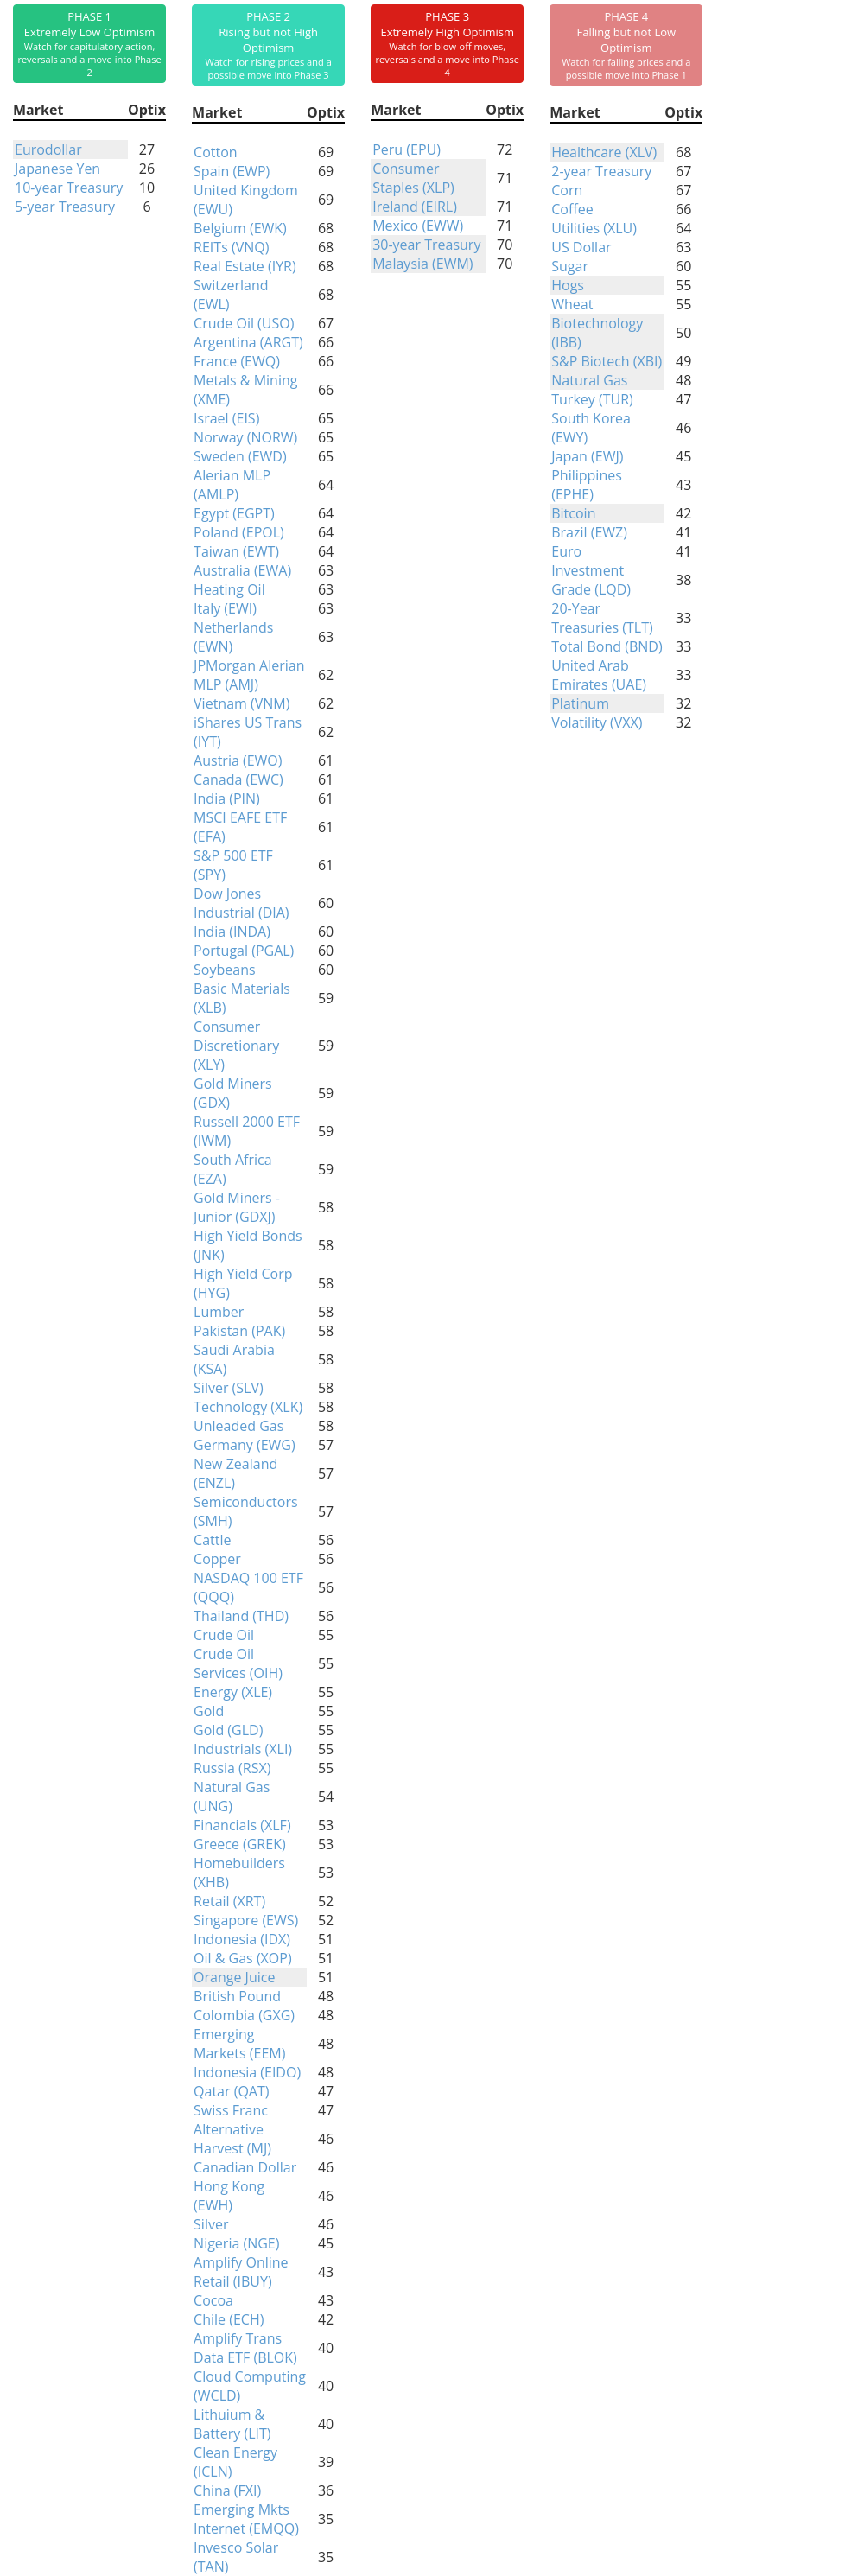
Phase Table
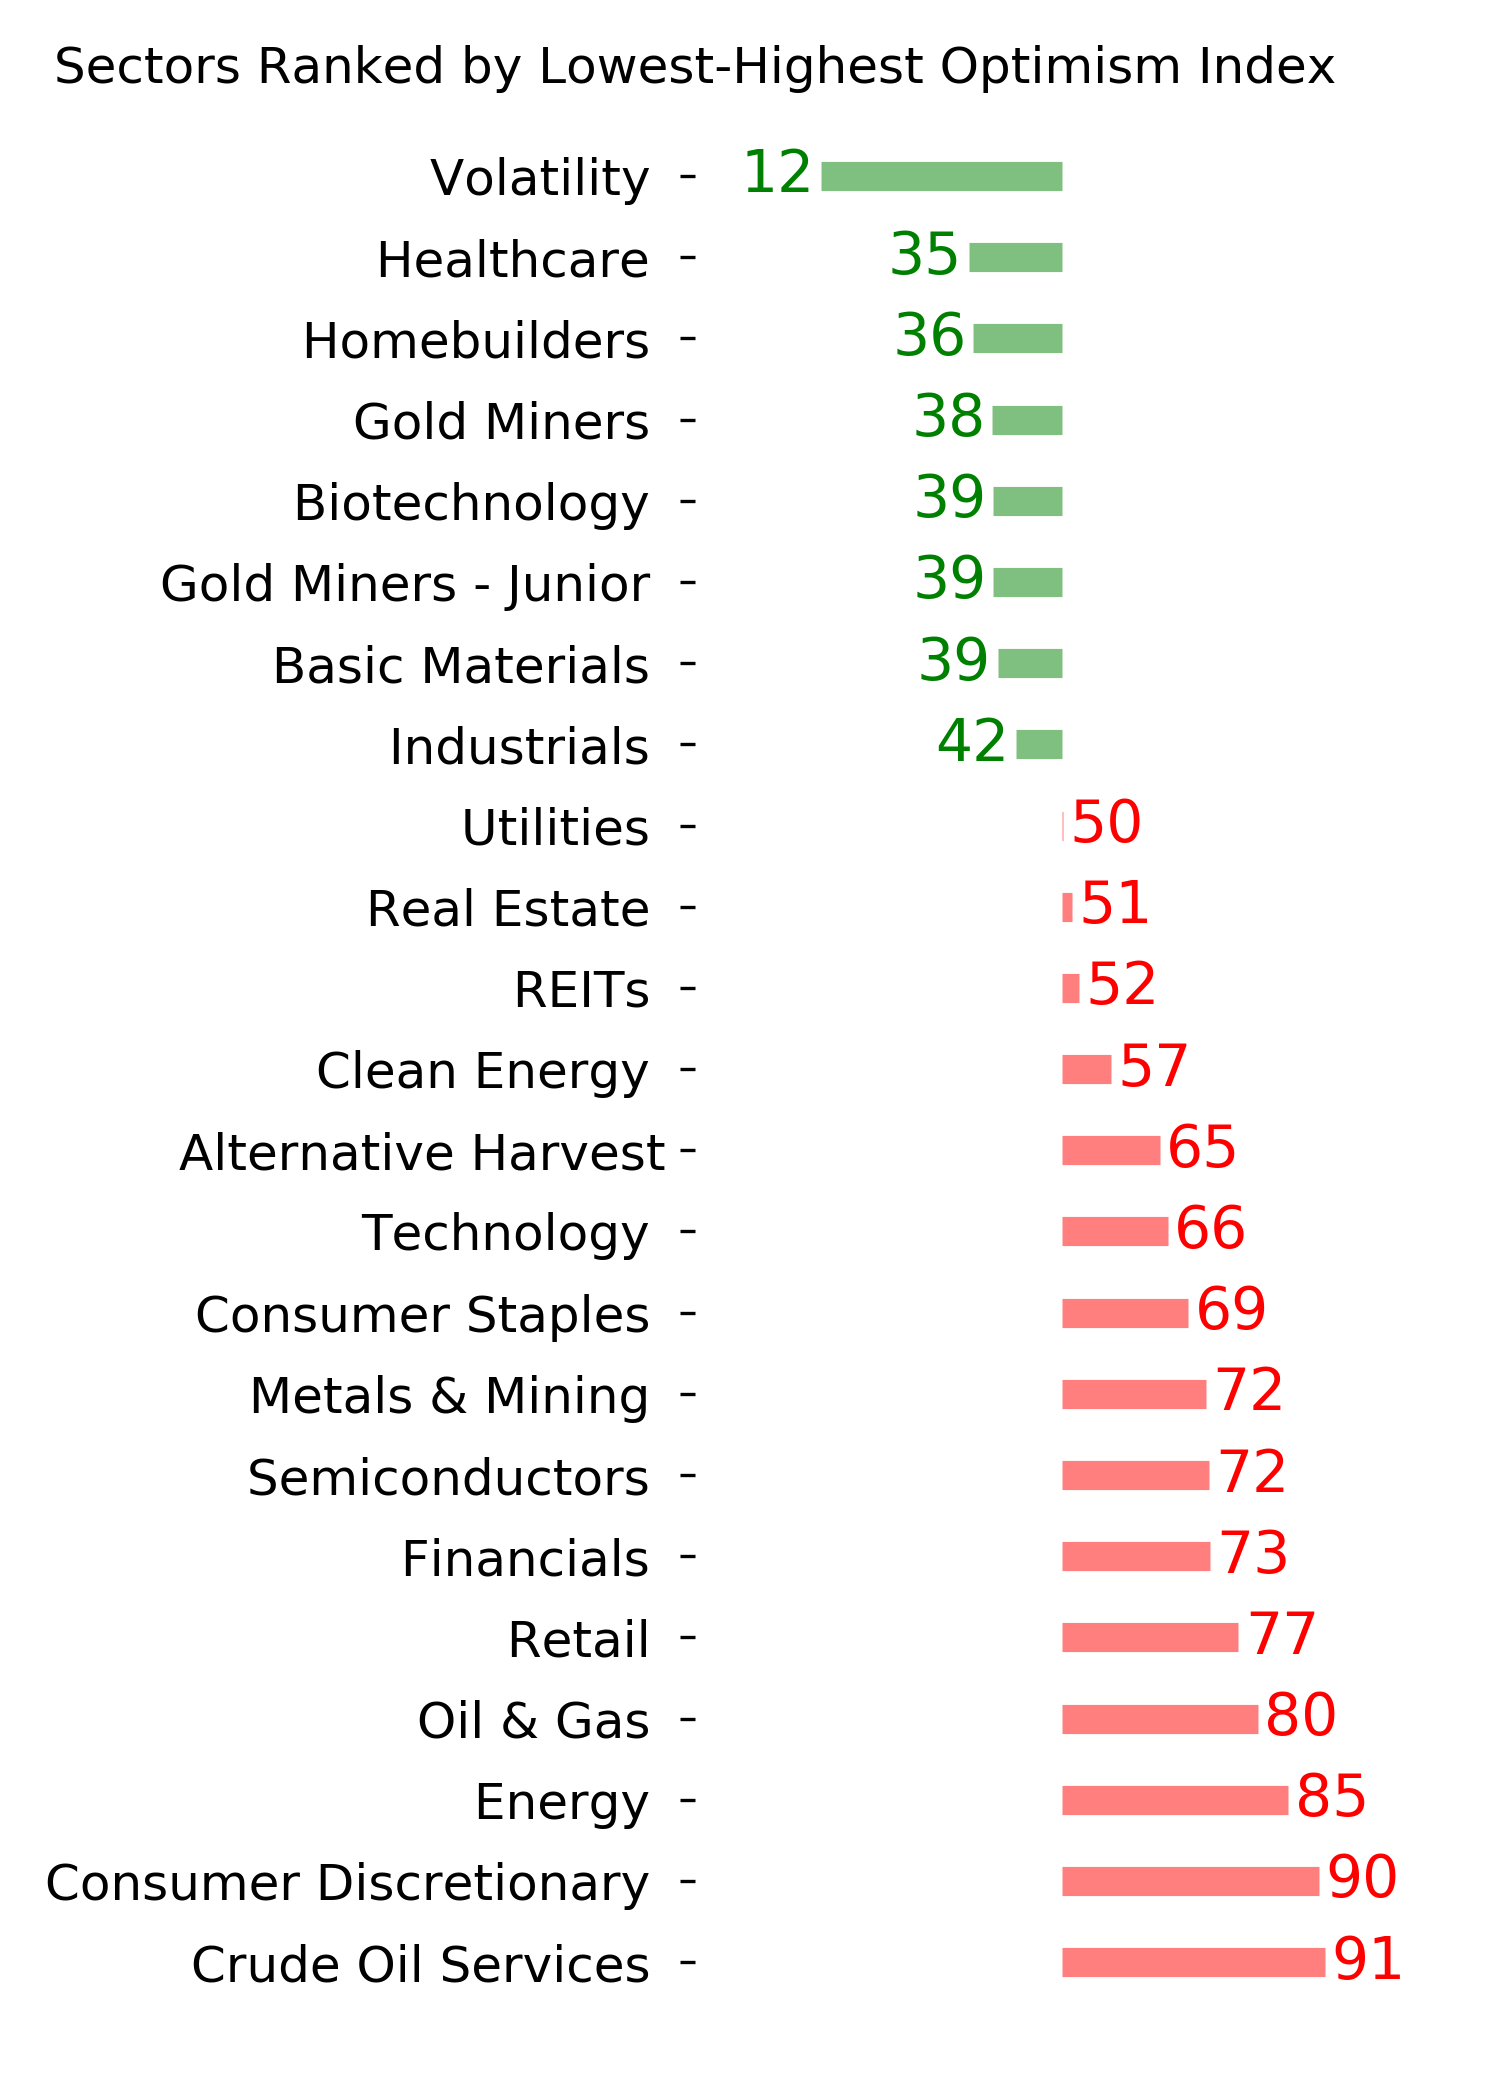
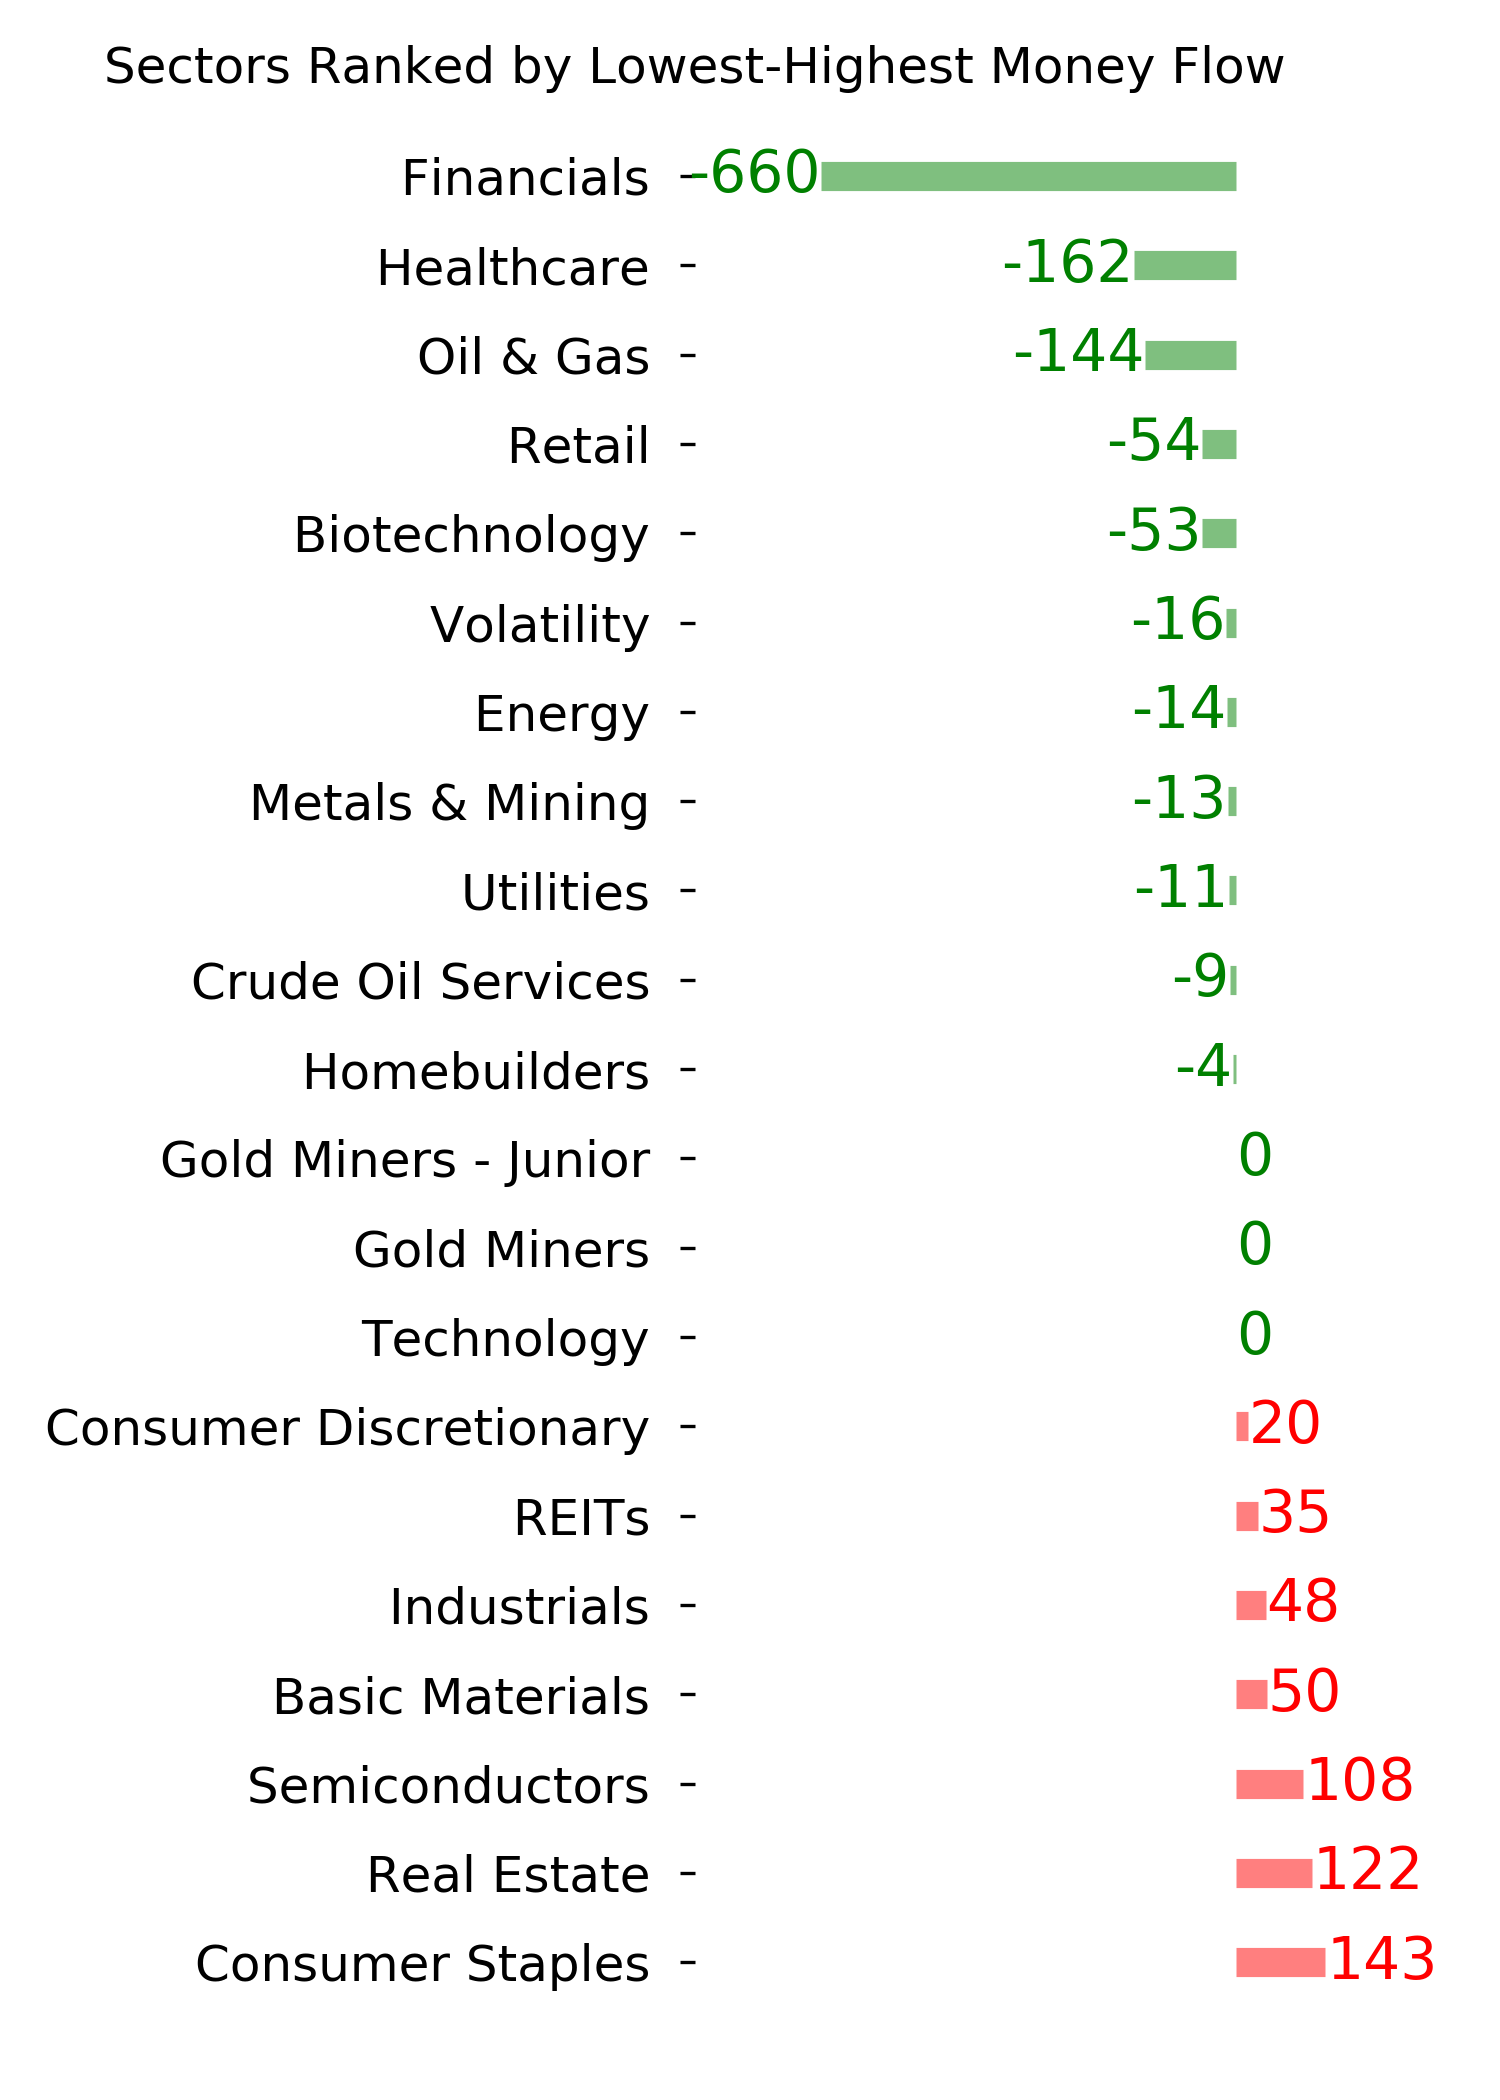
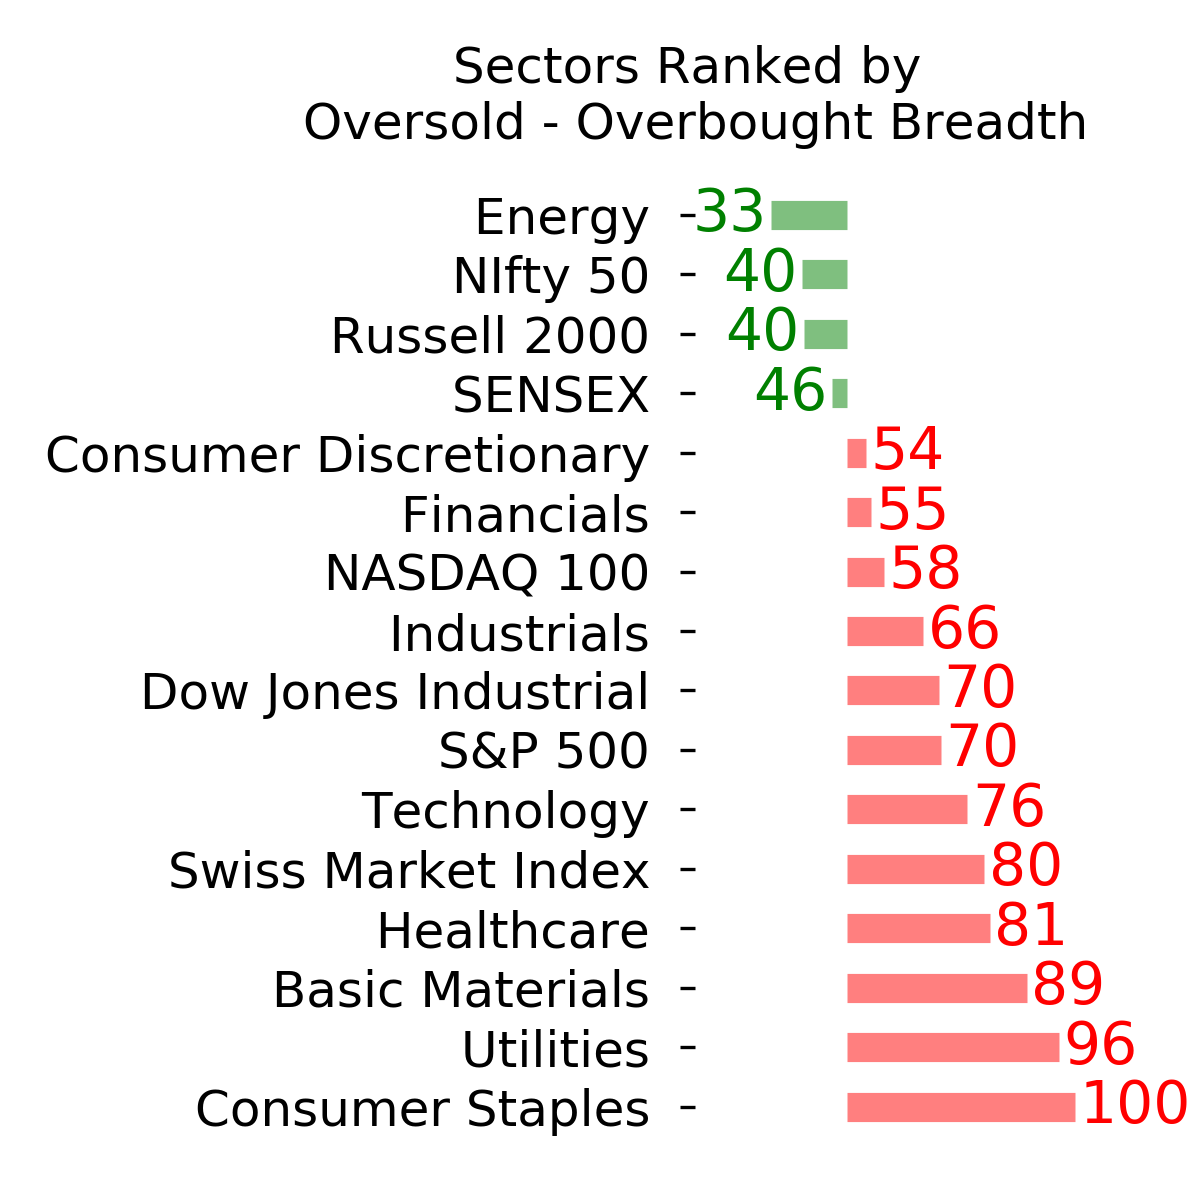
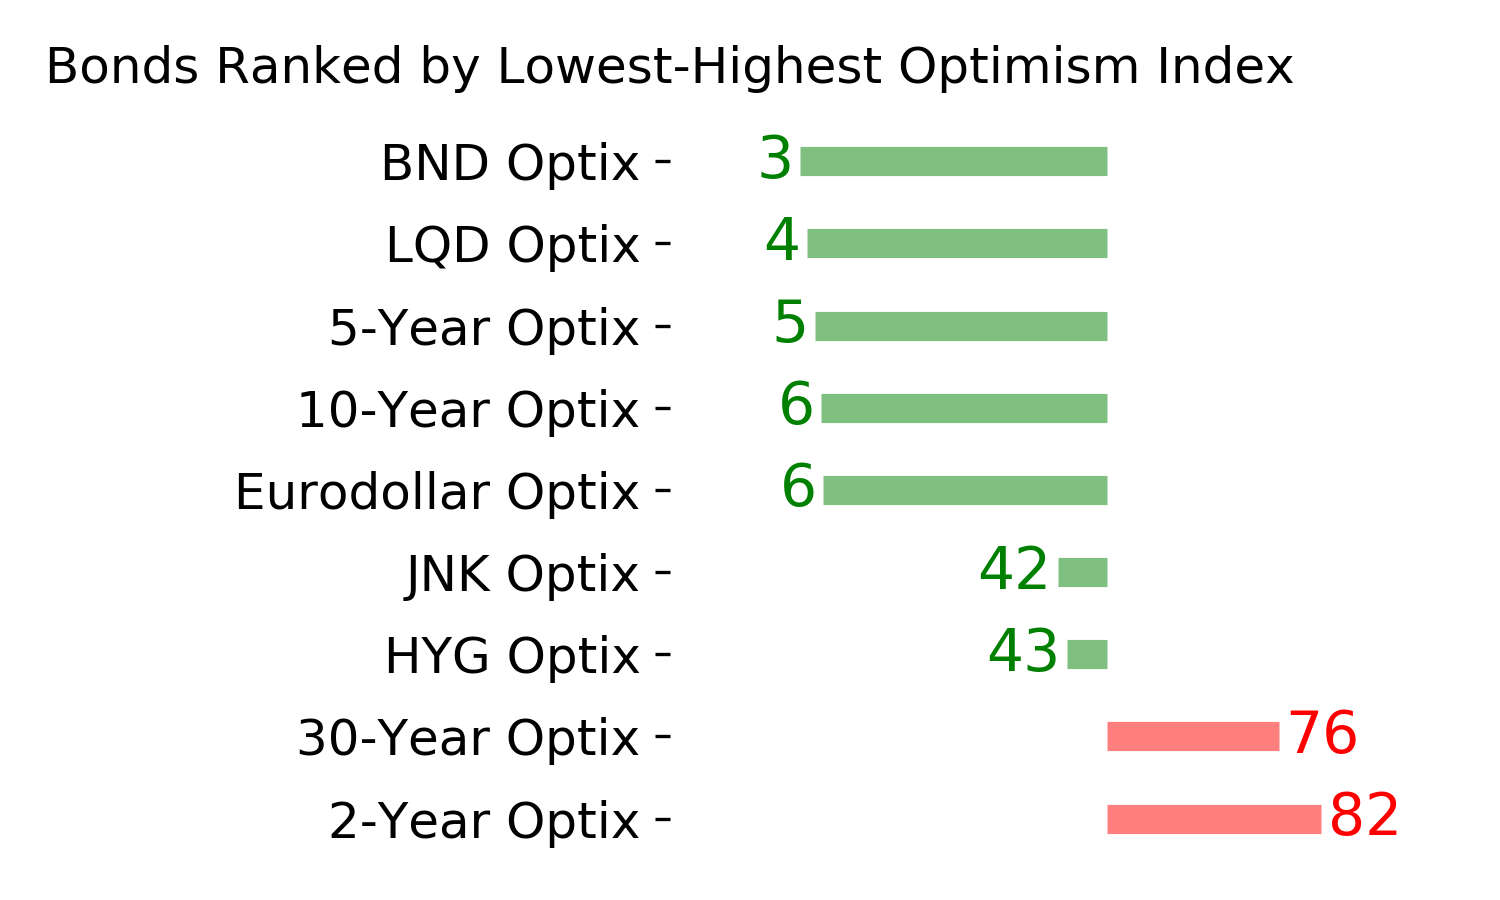
Ranks
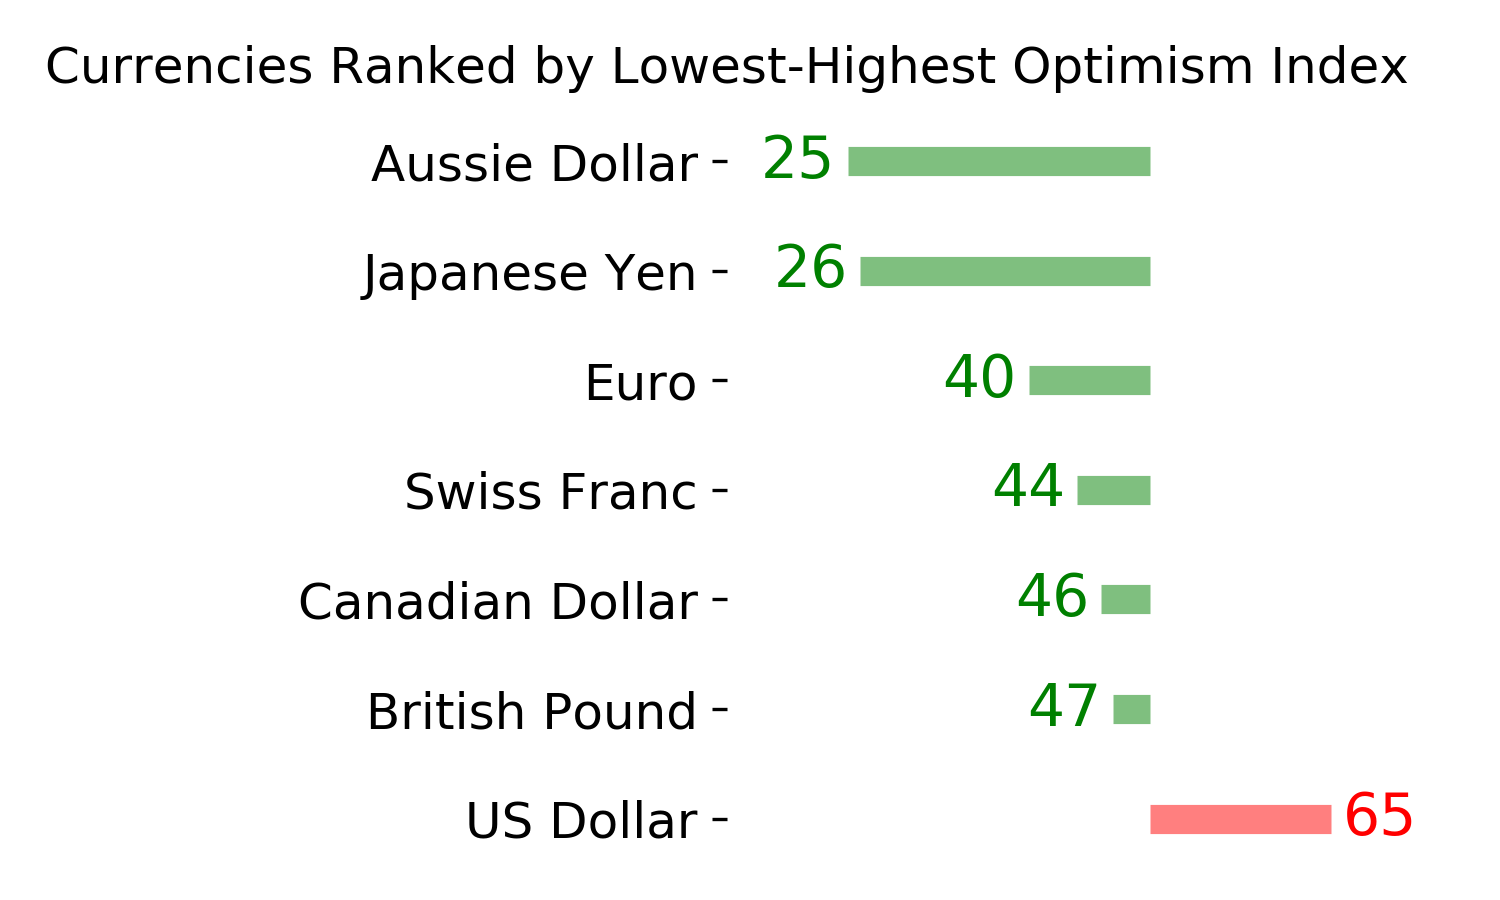
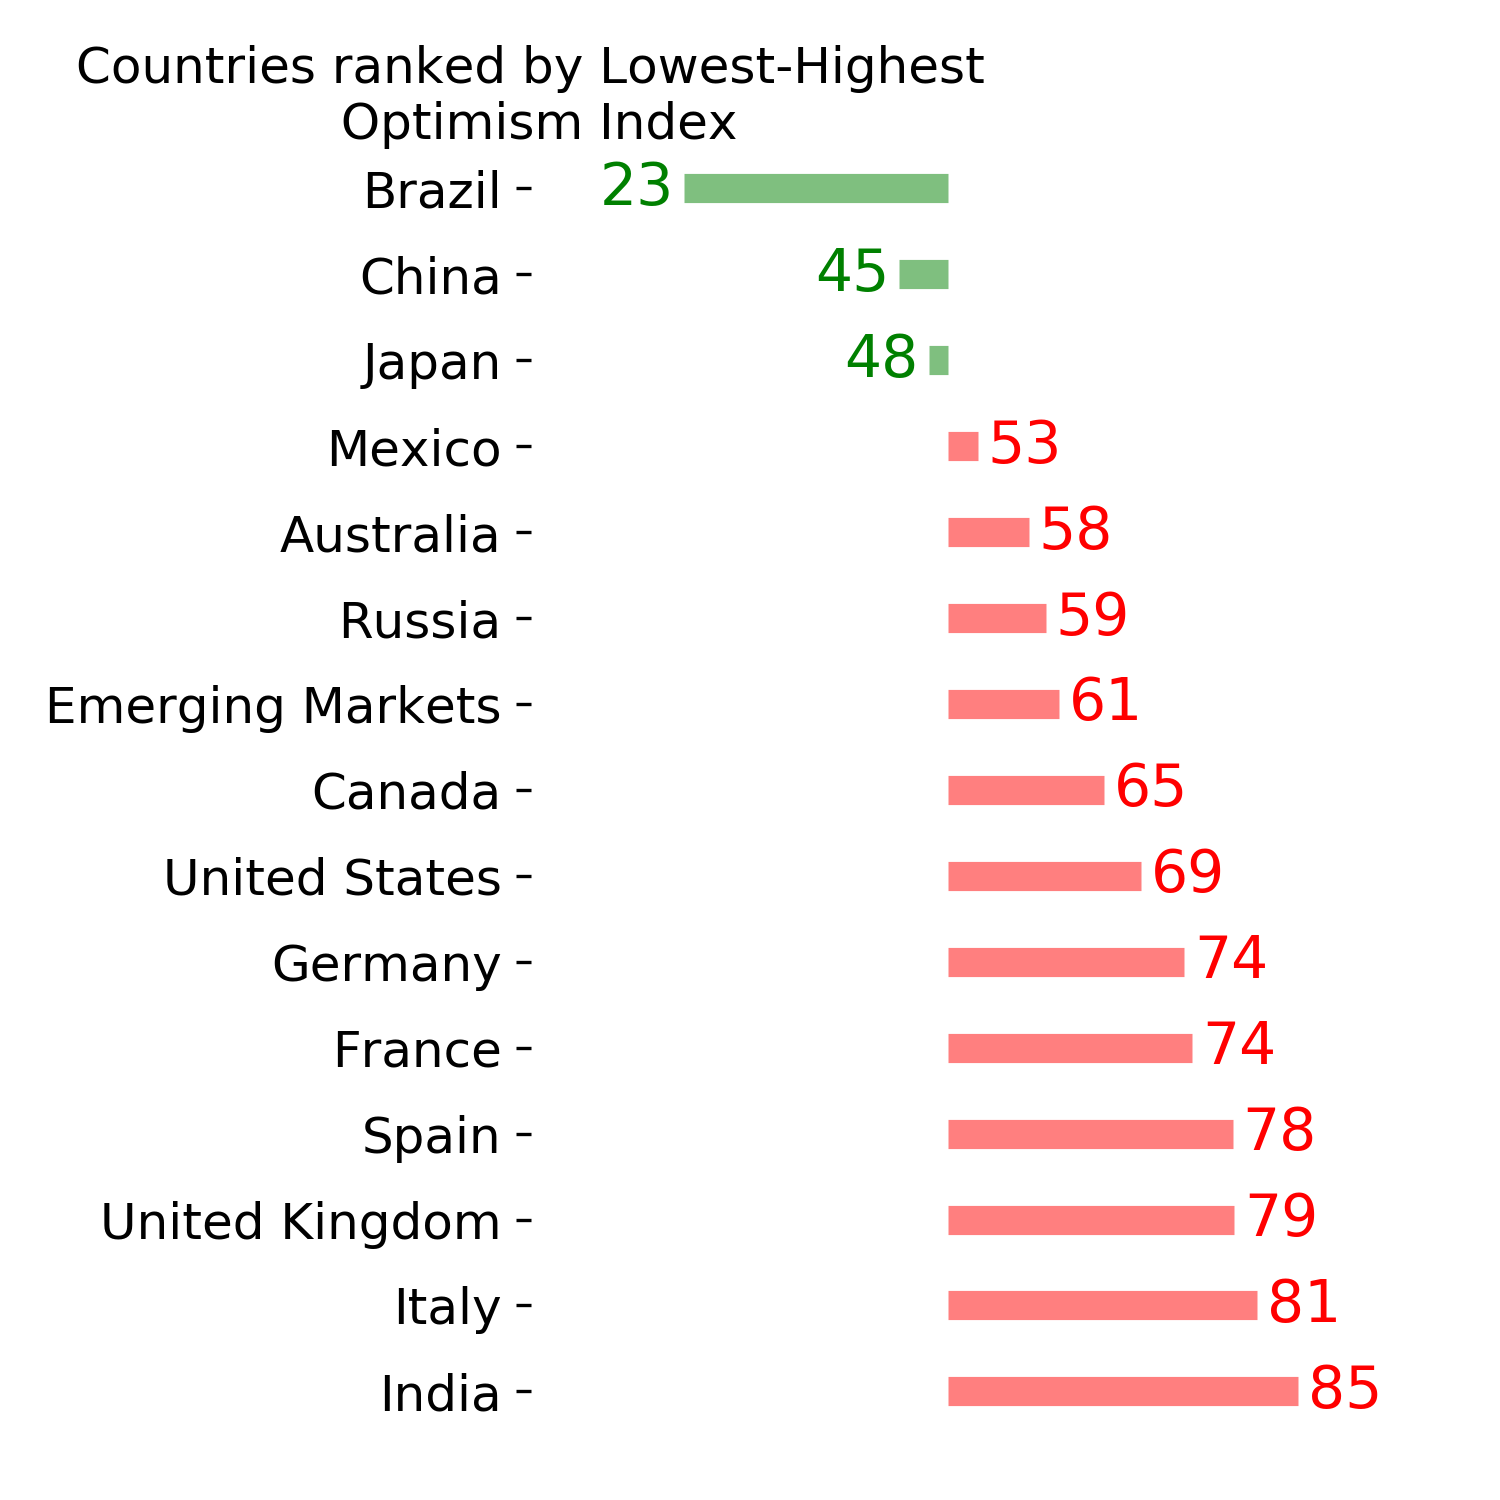
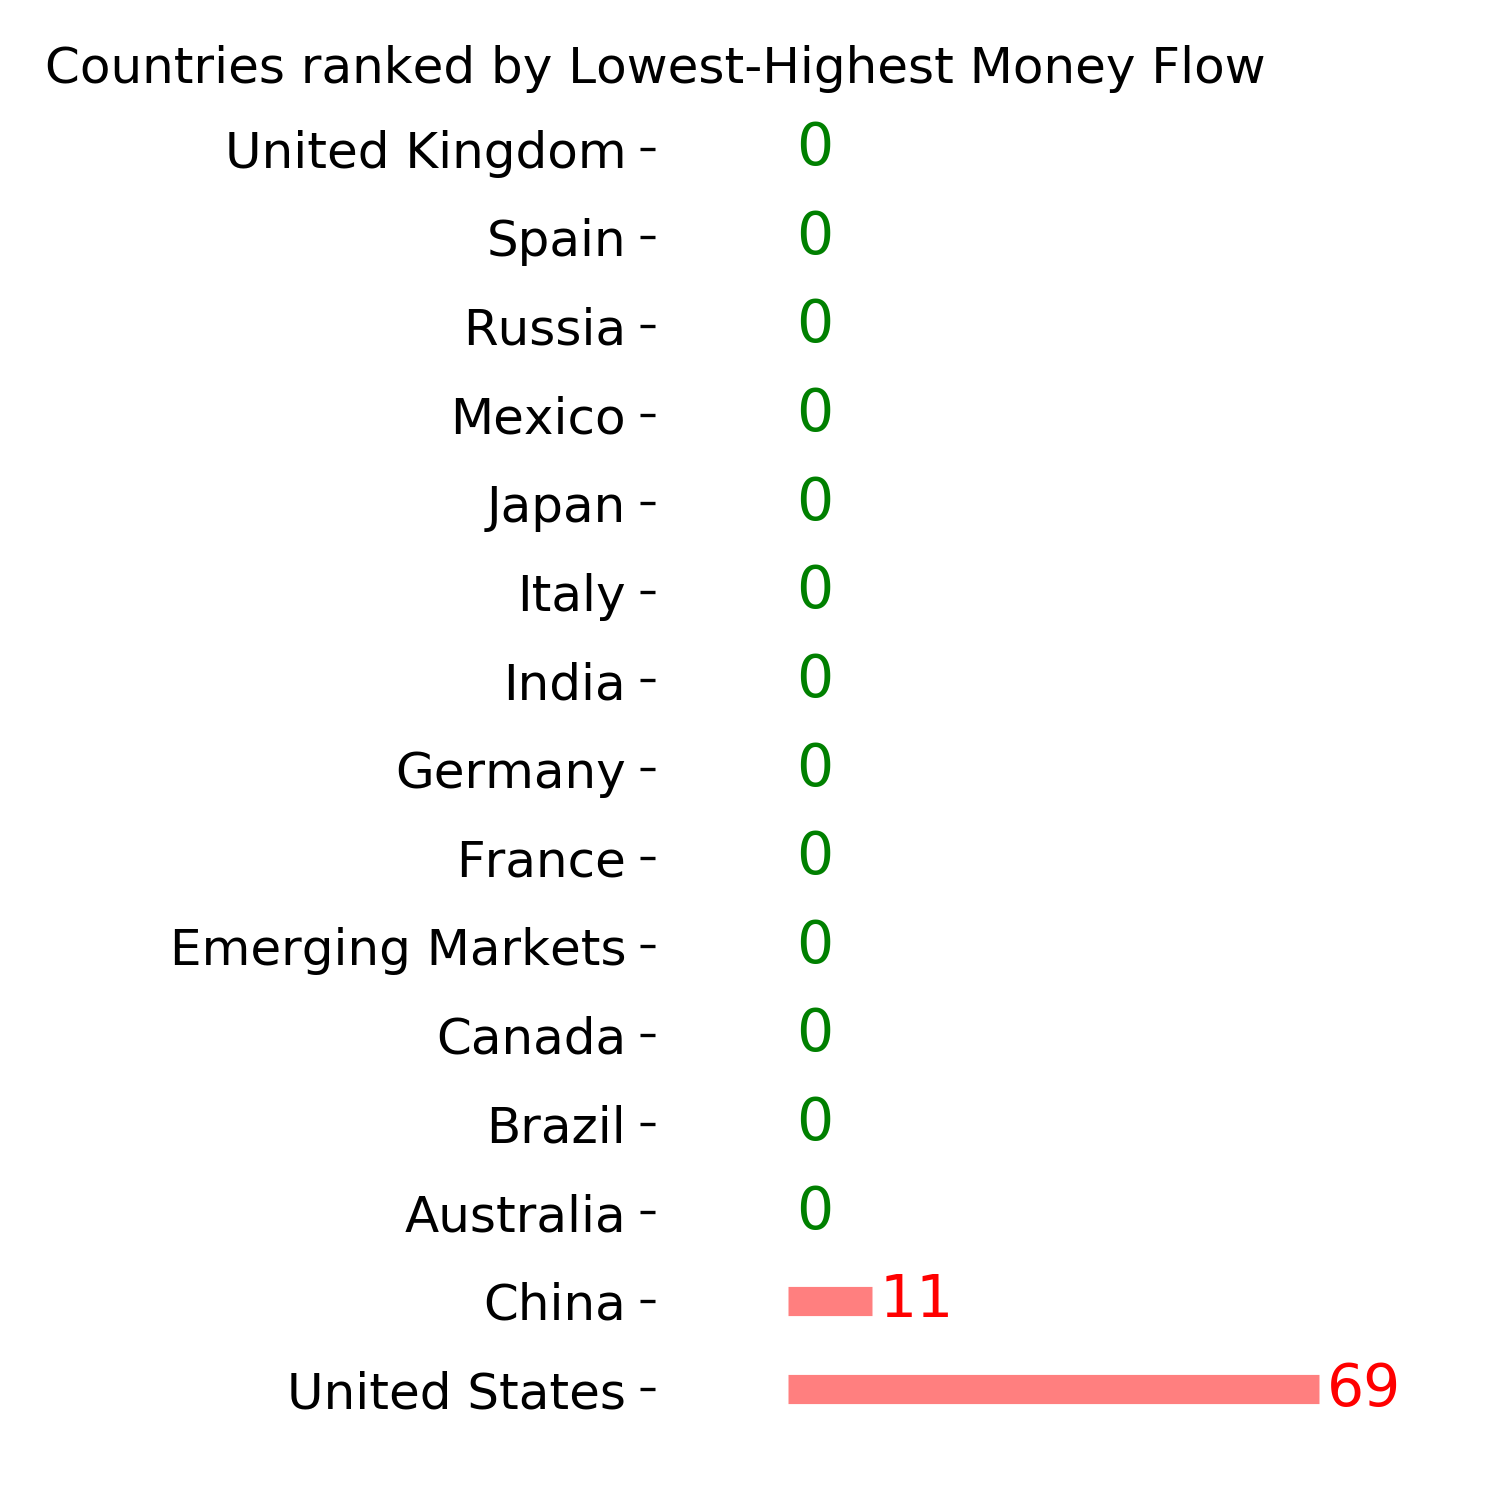
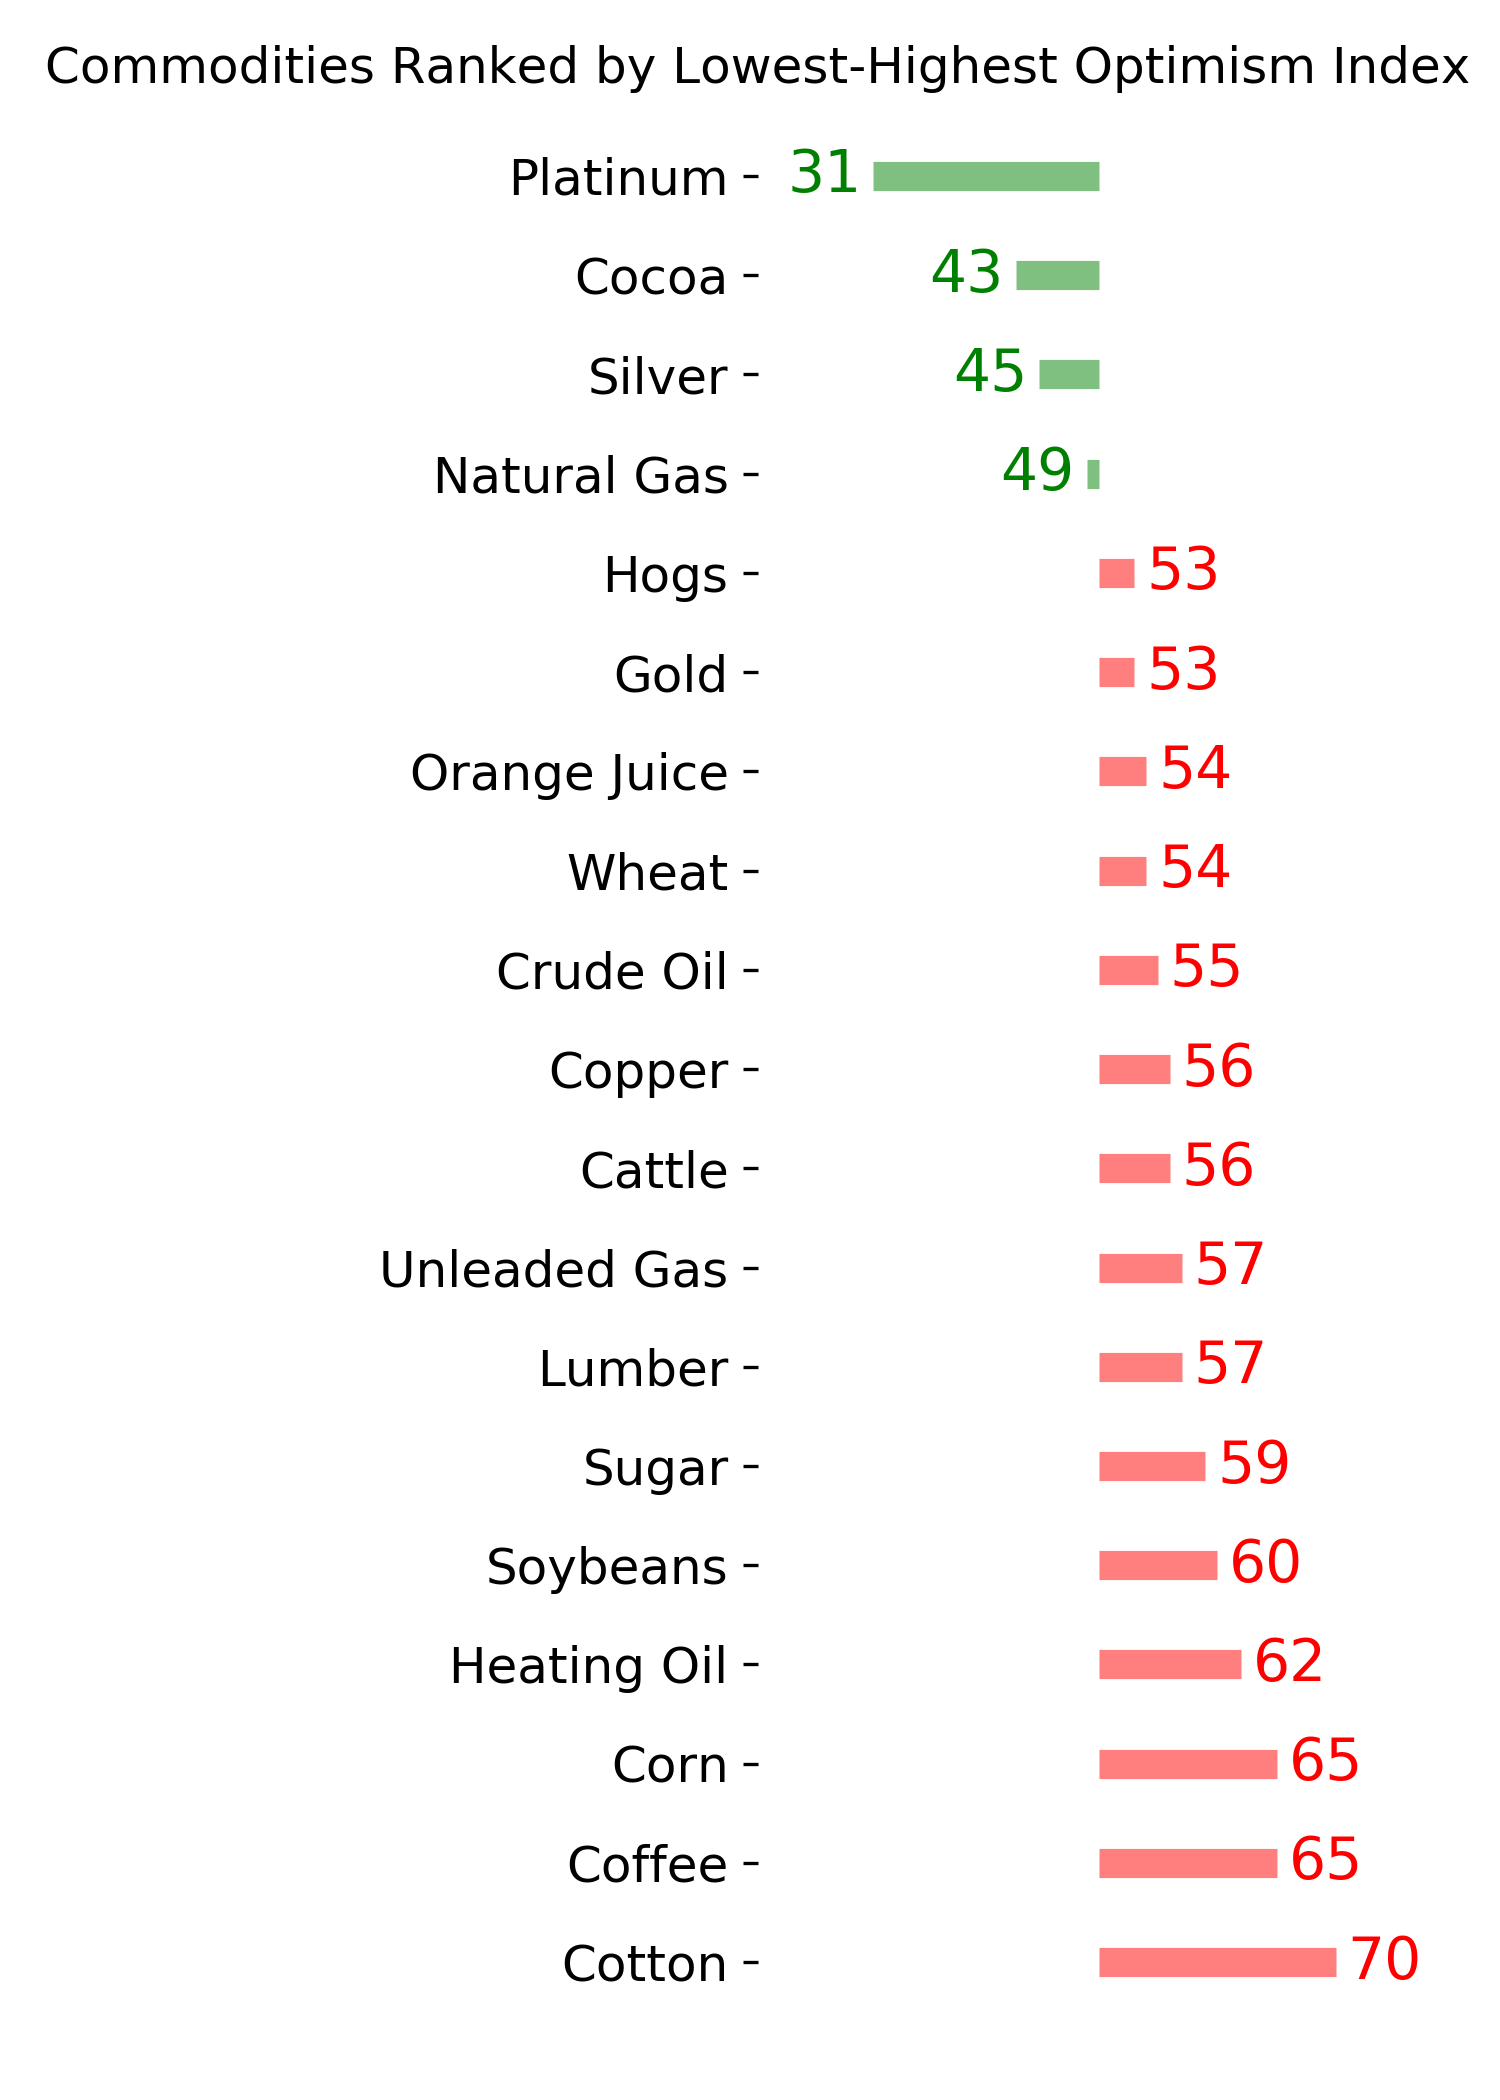
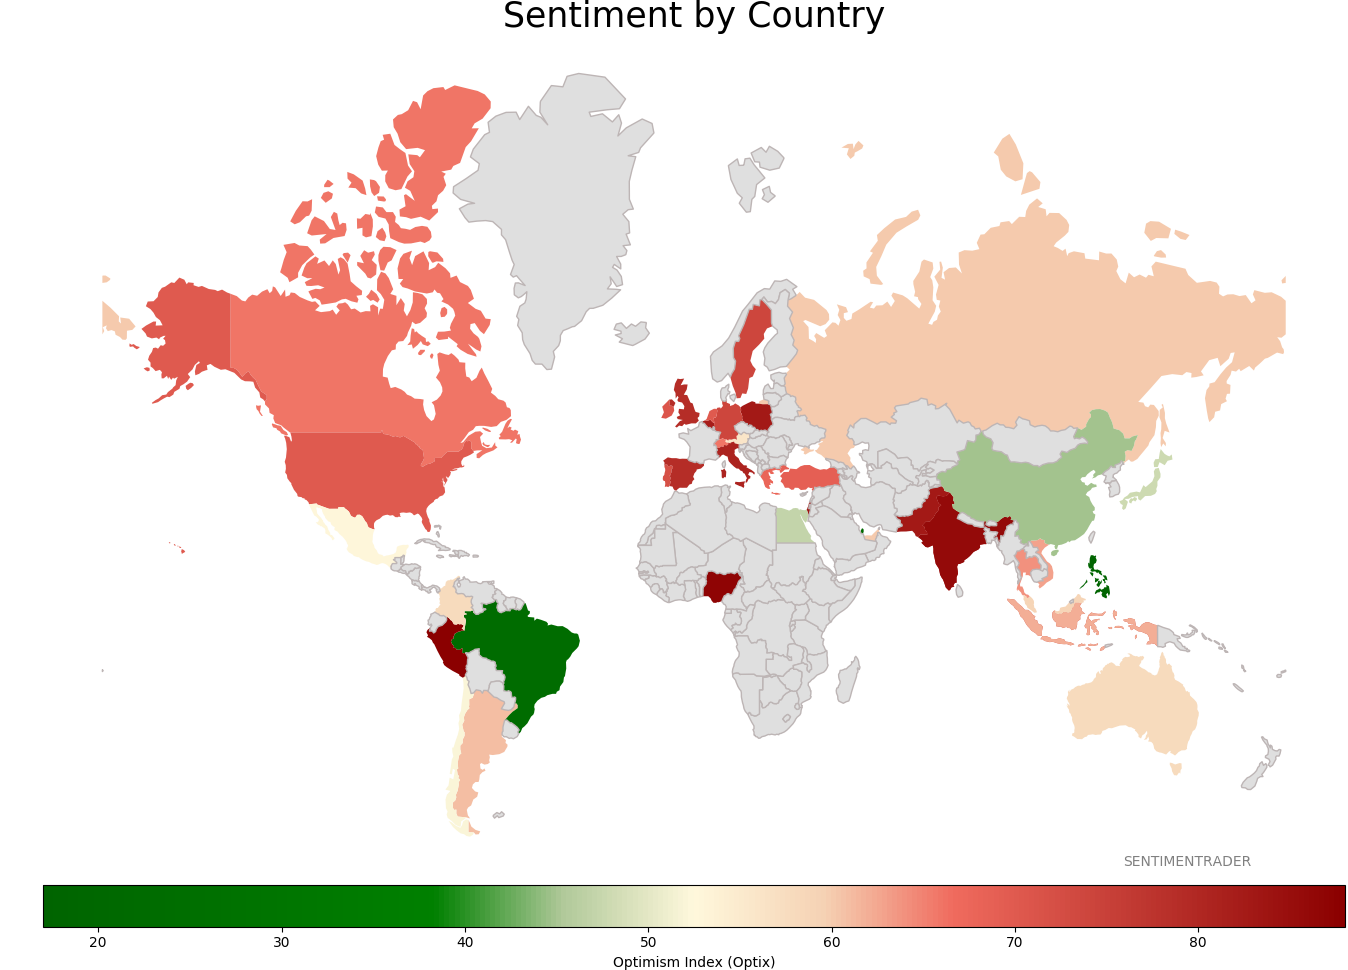
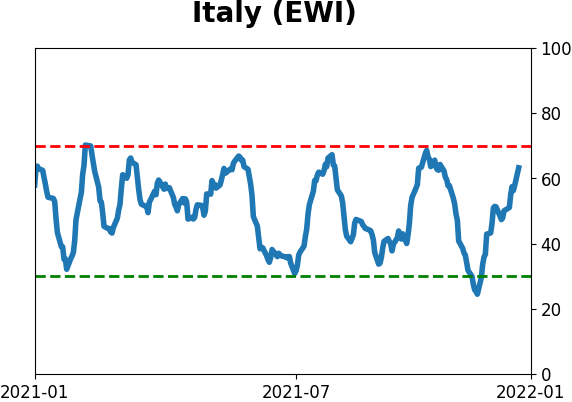
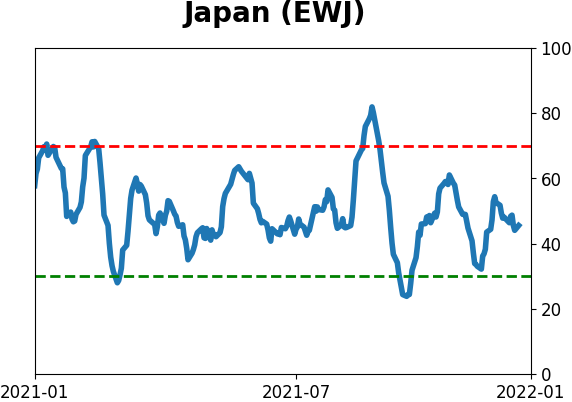
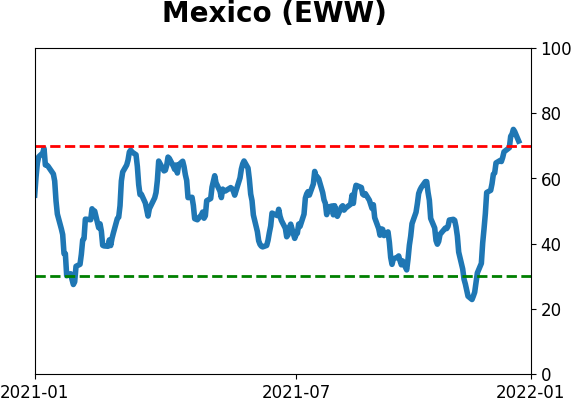
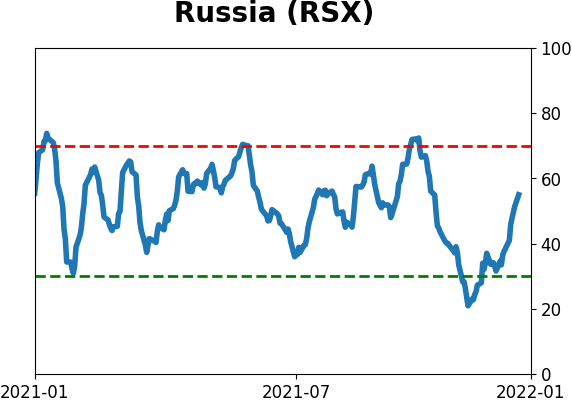
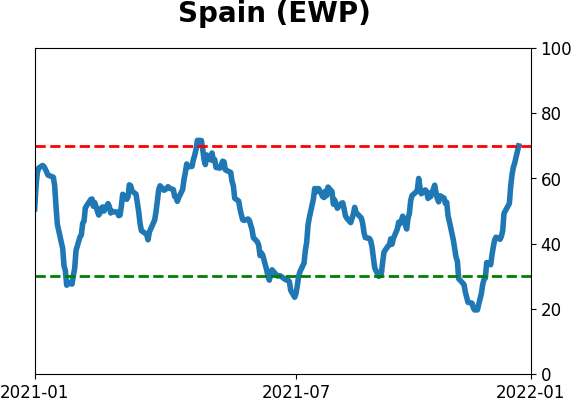
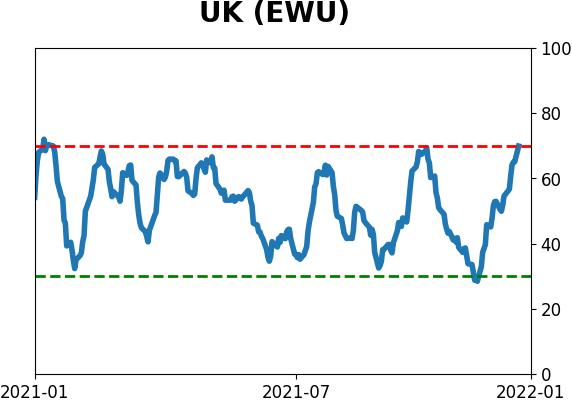
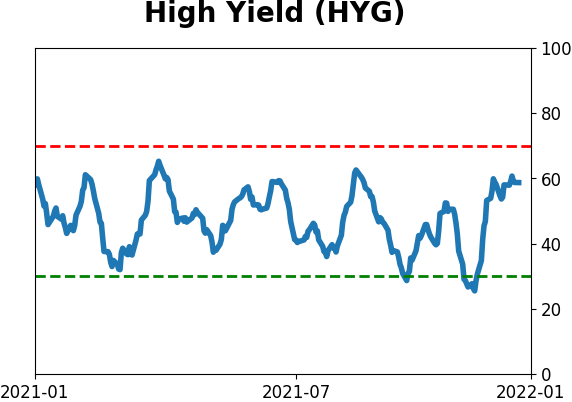
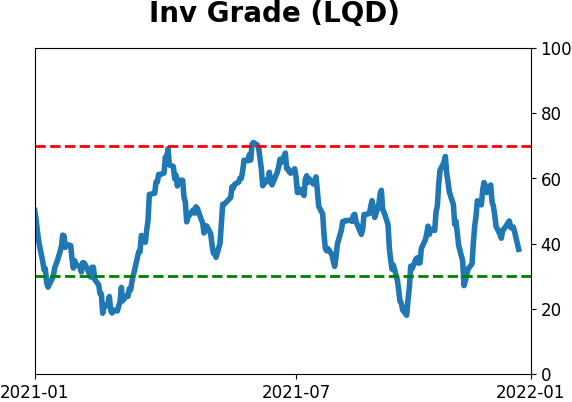
Sentiment Around The World
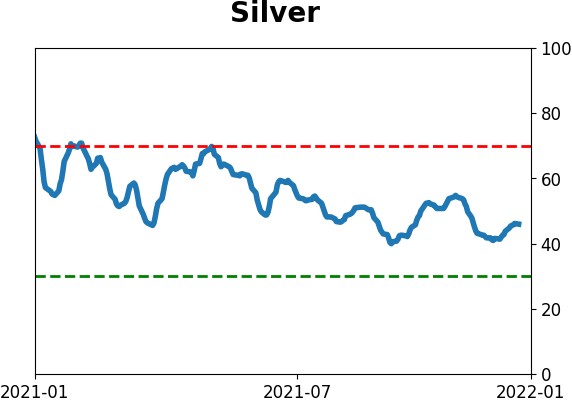
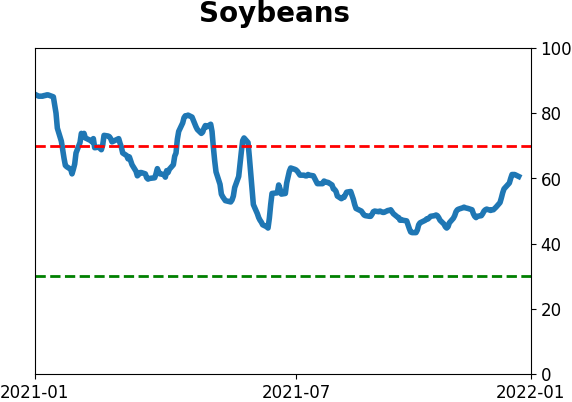
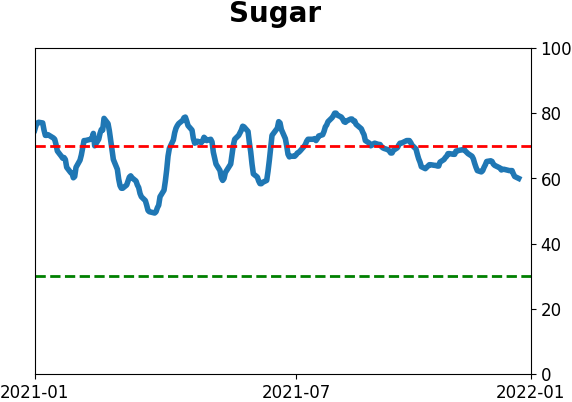
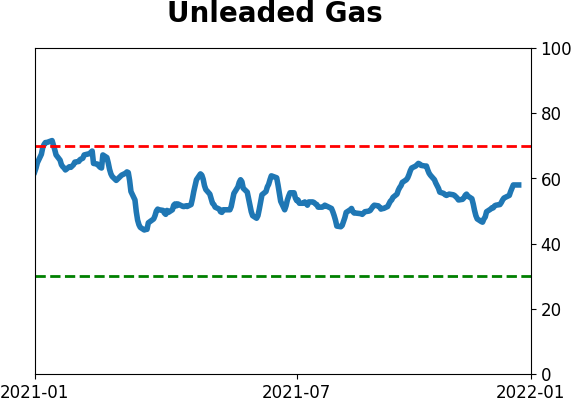
Optimism Index Thumbnails
|
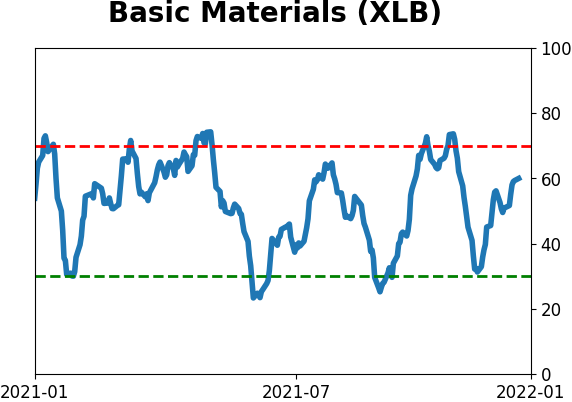
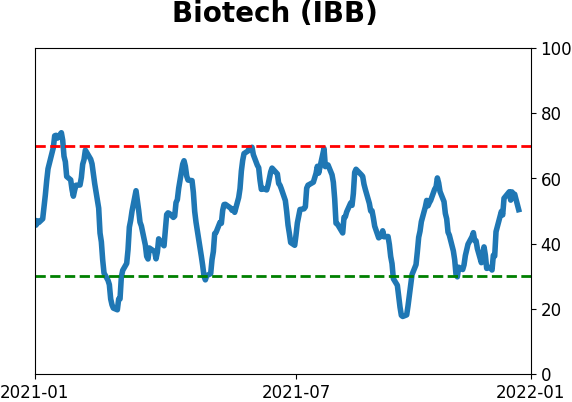
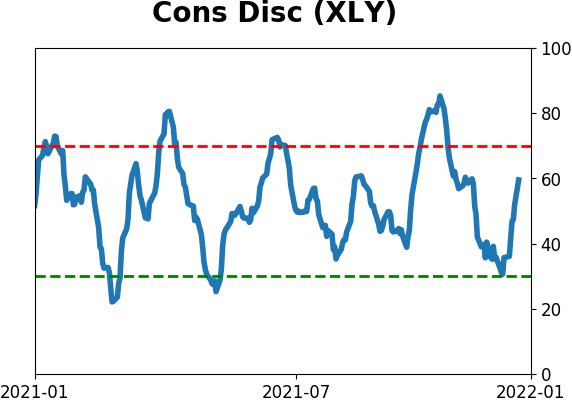
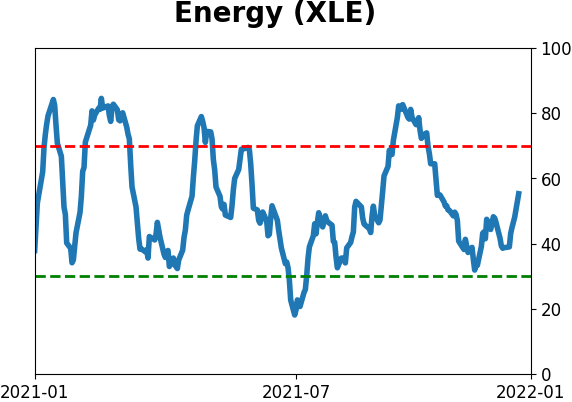
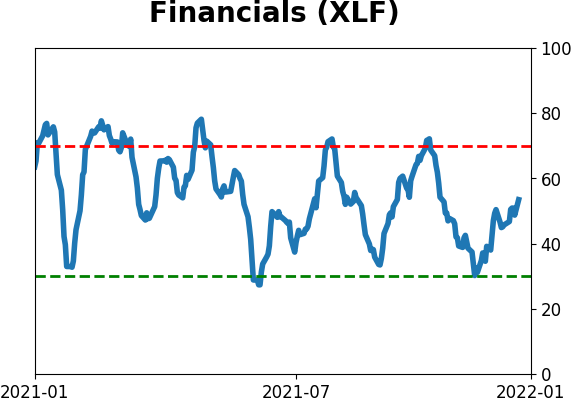
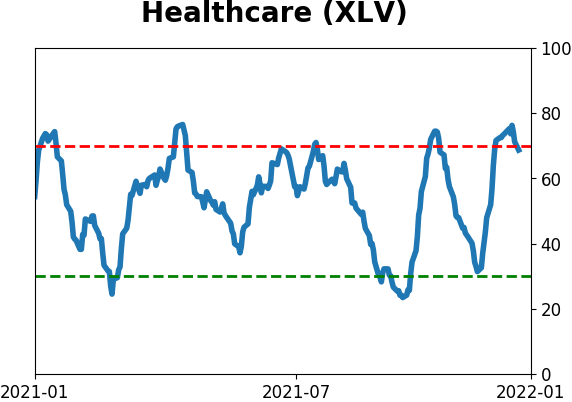
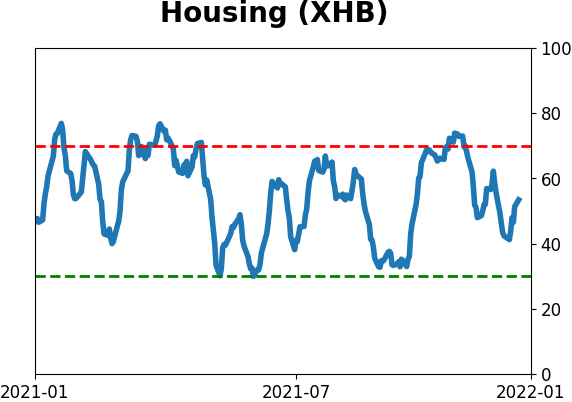
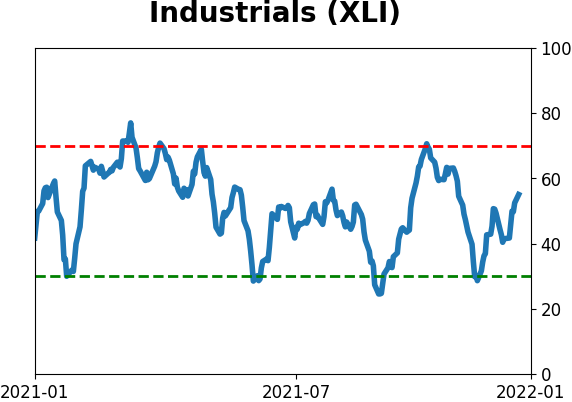
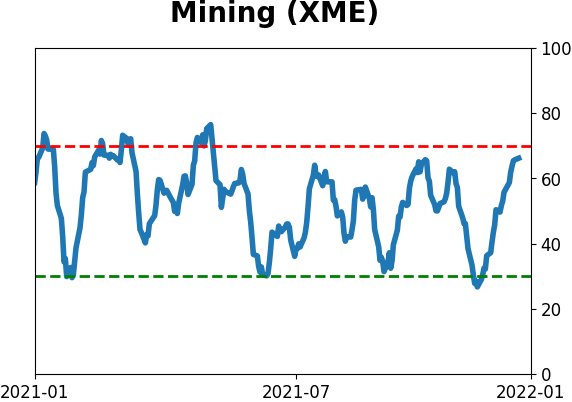
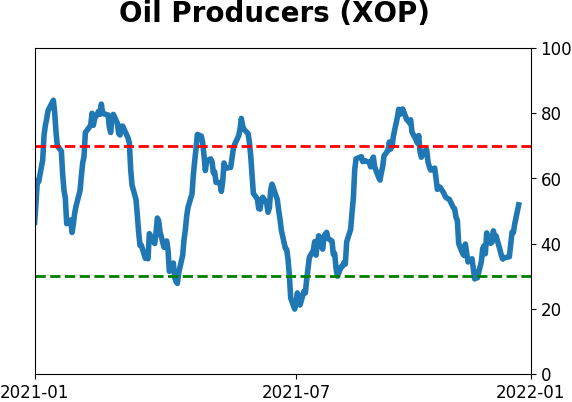
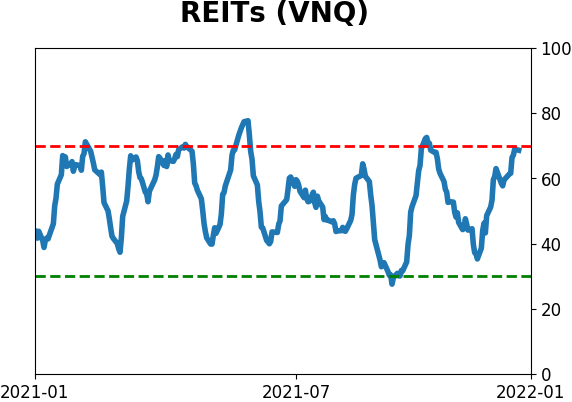
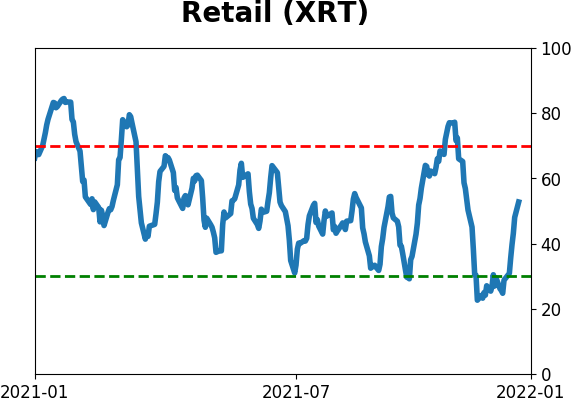
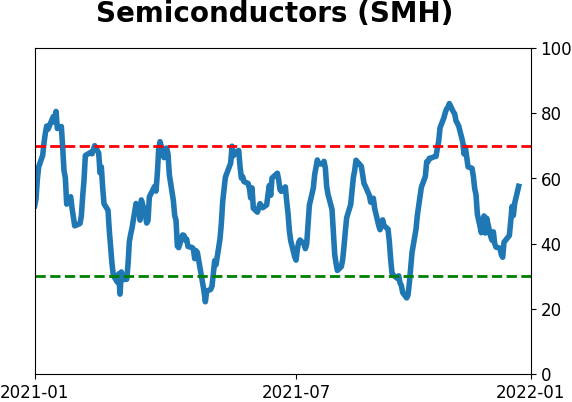
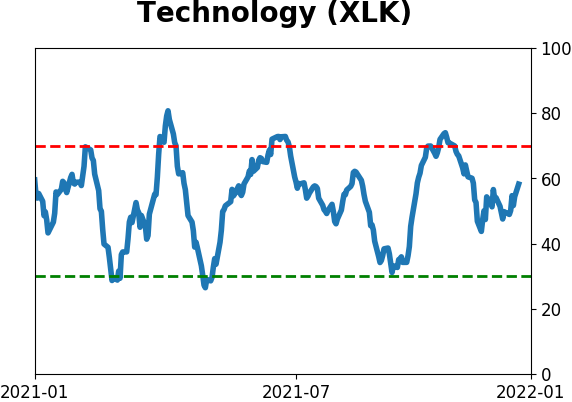
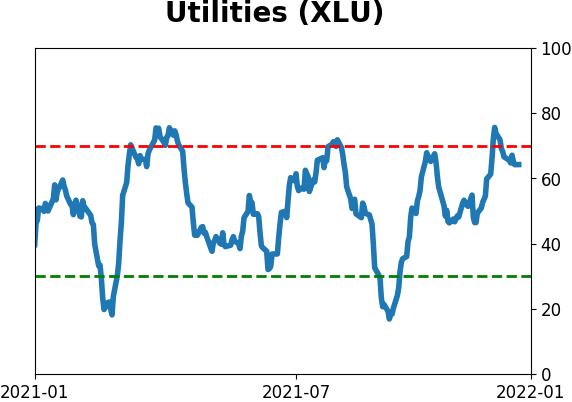
Sector ETF's - 10-Day Moving Average
|
|
|
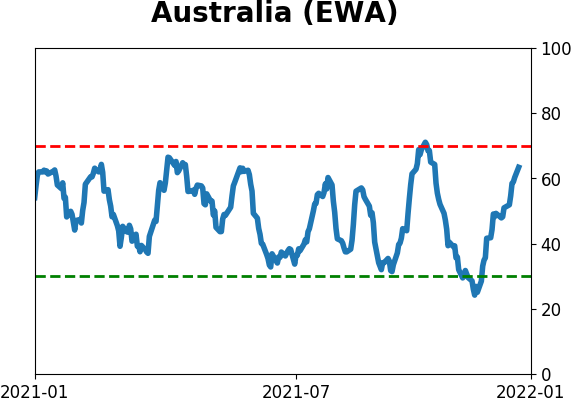
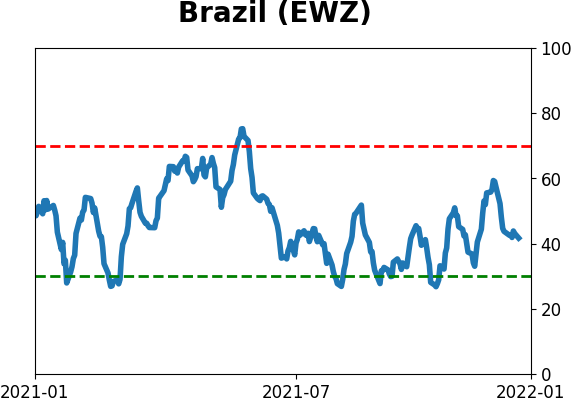
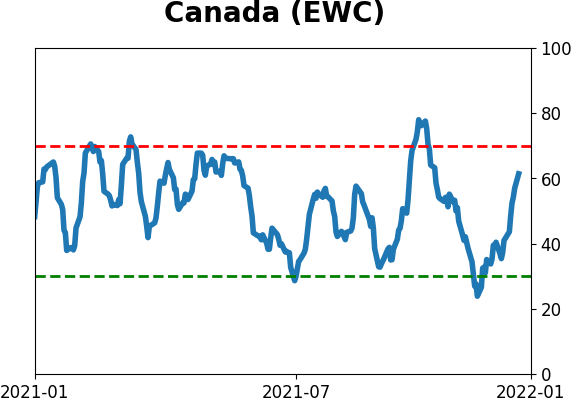
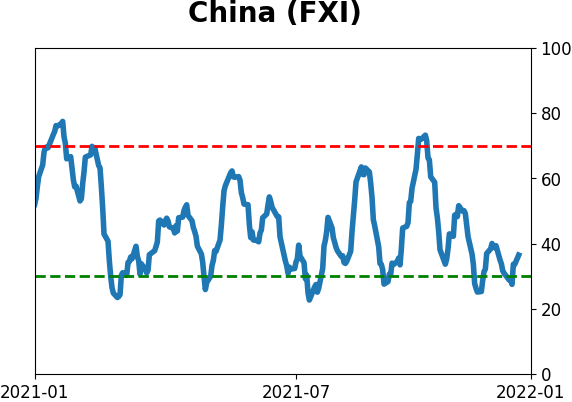
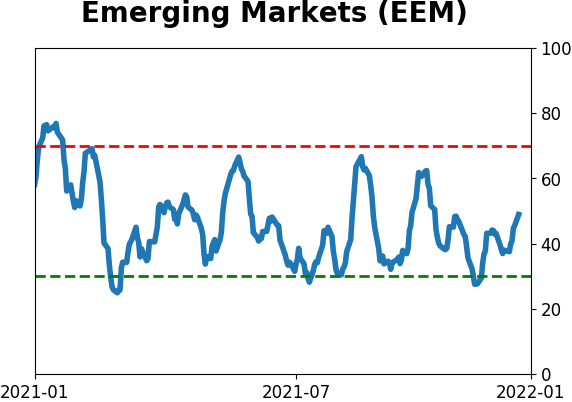
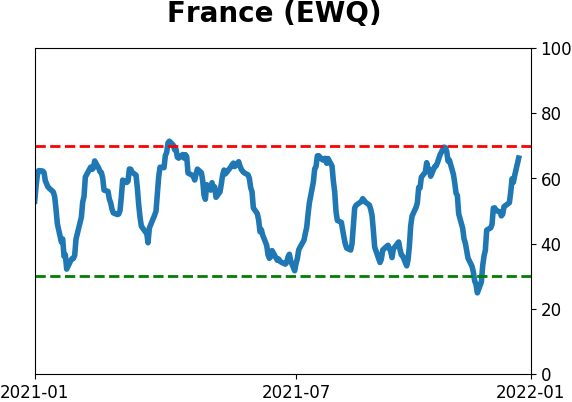
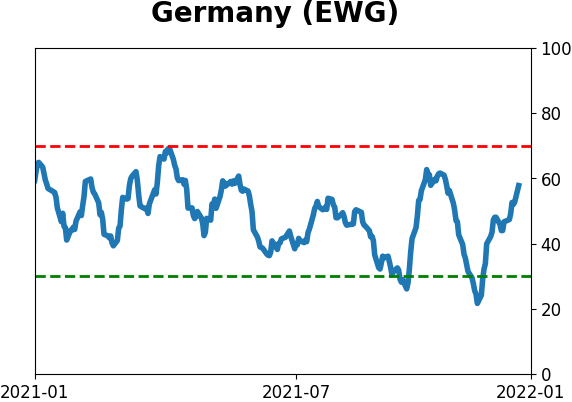
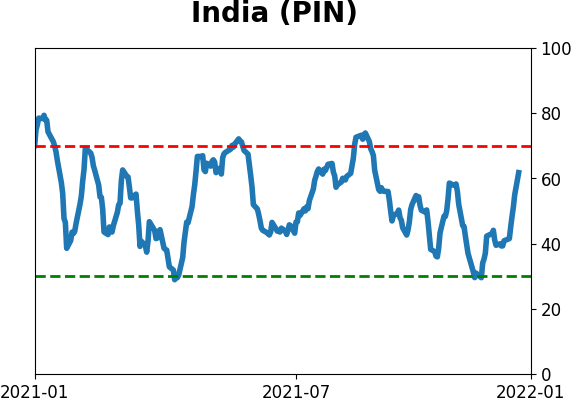
Country ETF's - 10-Day Moving Average
|
|
|
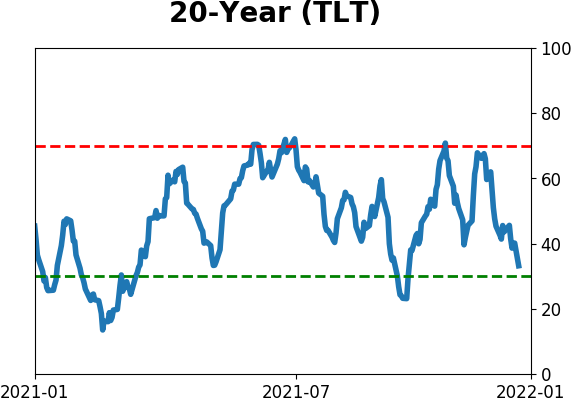
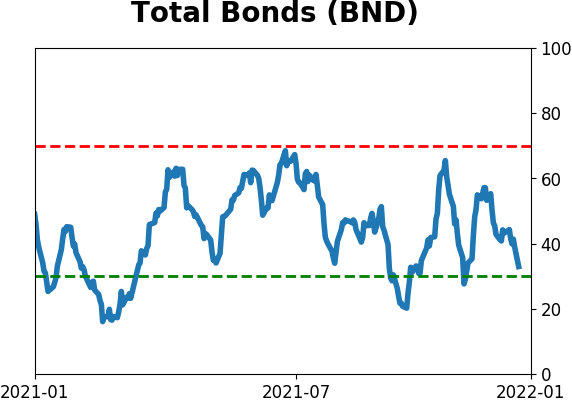
Bond ETF's - 10-Day Moving Average
|
|
|
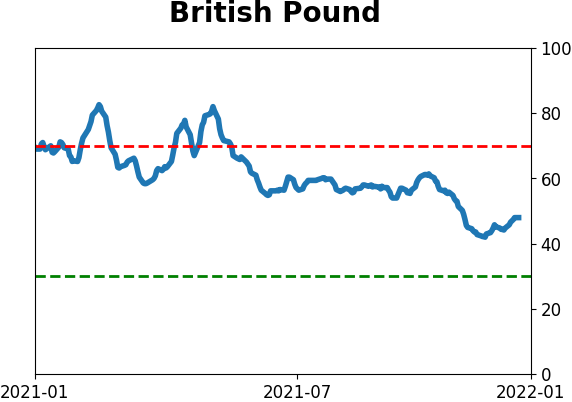
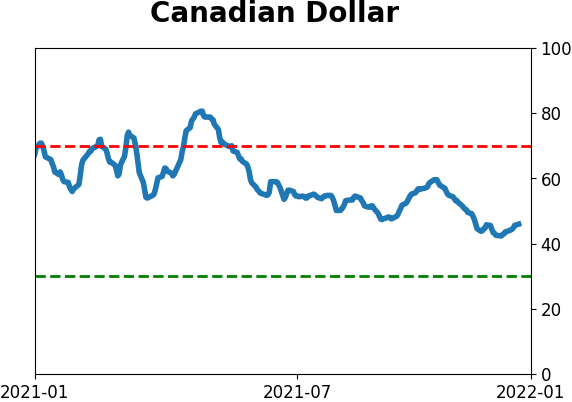
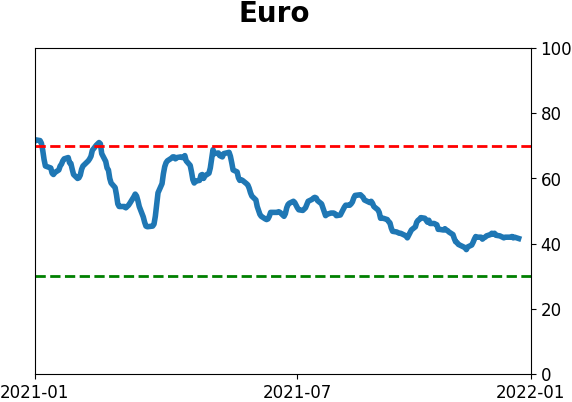
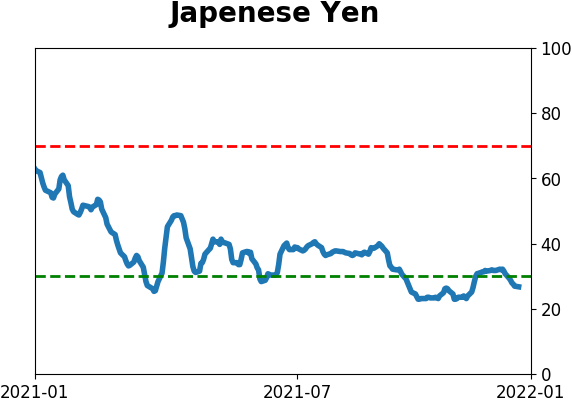
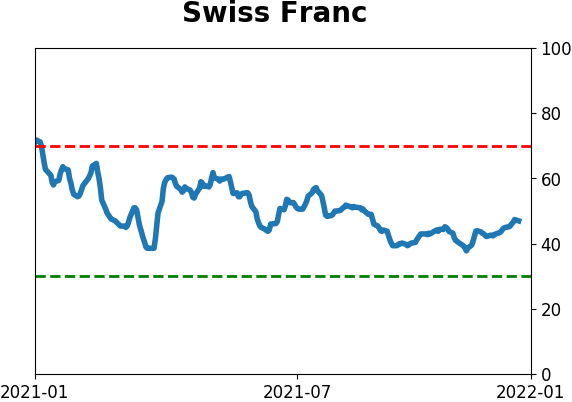
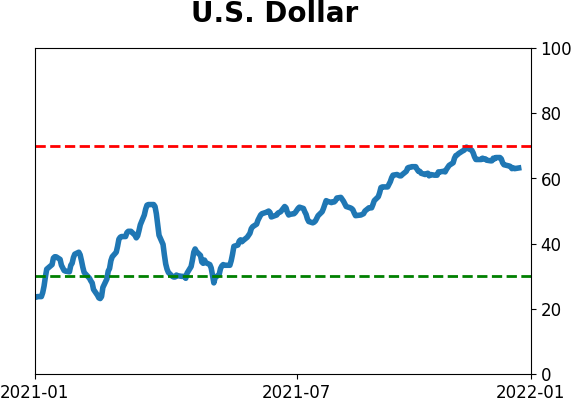
Currency ETF's - 5-Day Moving Average
|
|
|
Commodity ETF's - 5-Day Moving Average
|
|