Headlines
|
|
Internal momentum has reached escape velocity:
Internal momentum across stocks, indexes, sectors, and even exchanges is historic. The McClellan Summation Index for the NYSE, as well as for some indexes and sectors, has reached escape velocity that never really occurs during ongoing bear markets. Forward returns after similar behavior were exceptional.
|
Smart / Dumb Money Confidence
|
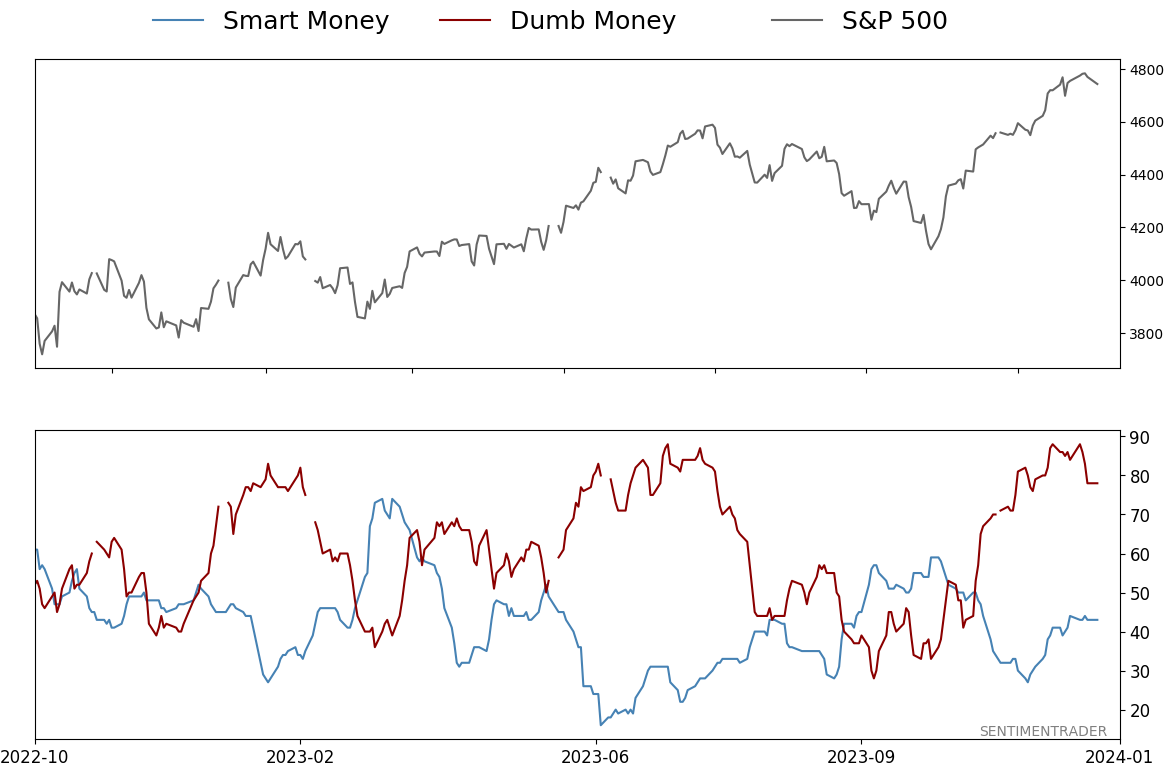
Smart Money Confidence: 43%
Dumb Money Confidence: 78%
|
|
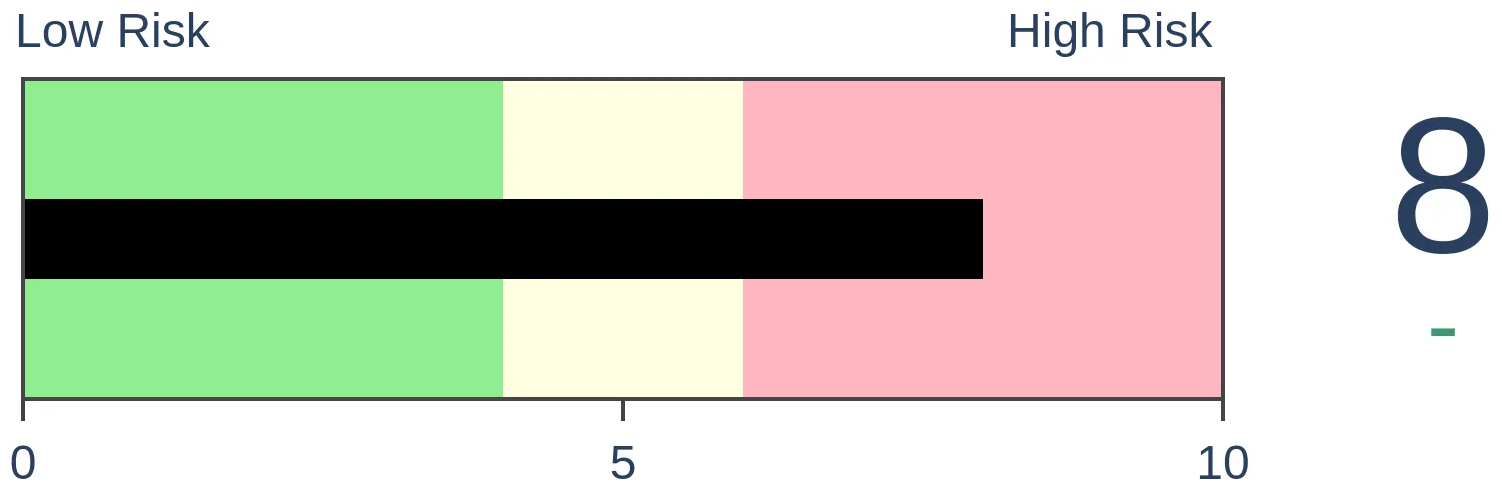
Risk Levels
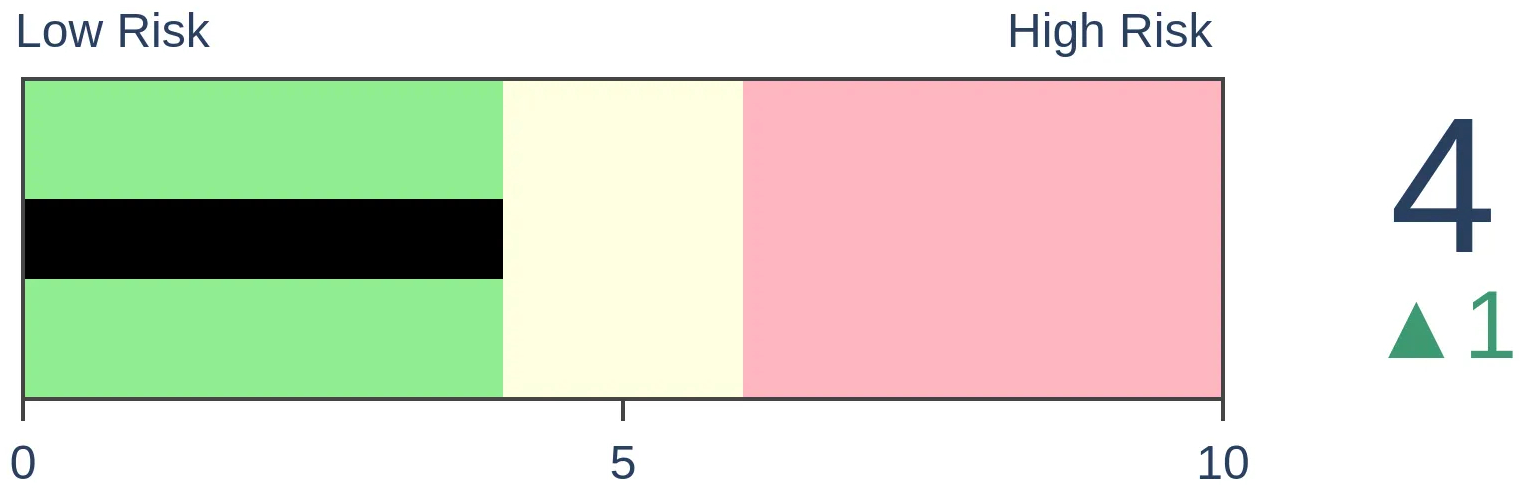
Stocks Short-Term

|
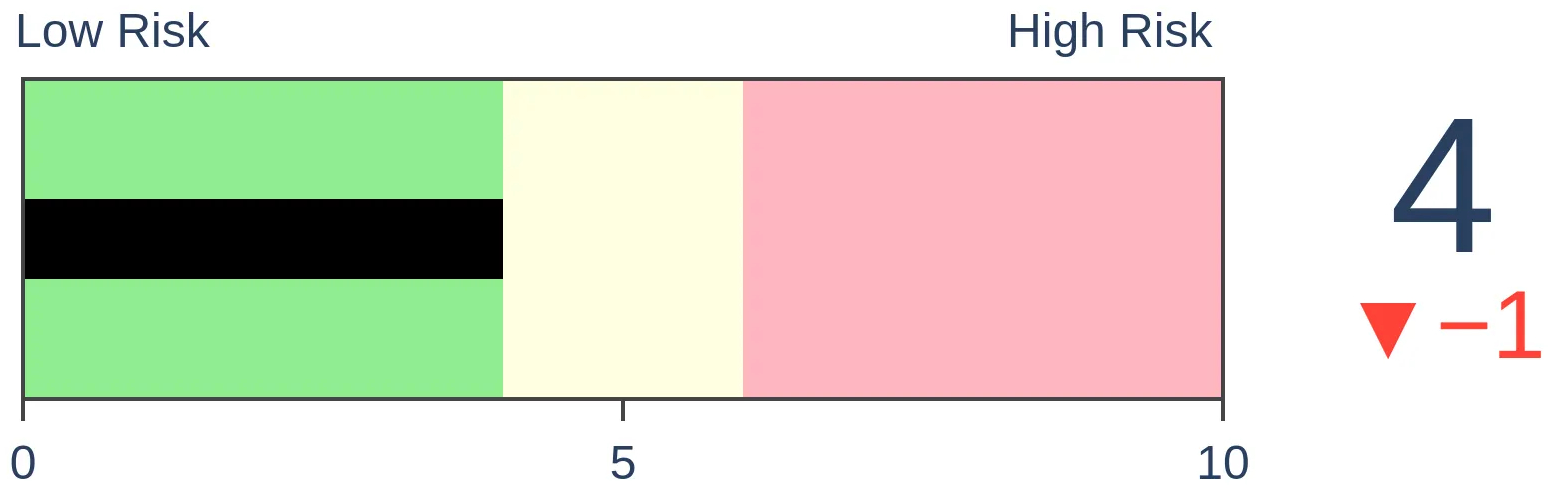
Stocks Medium-Term
|
|
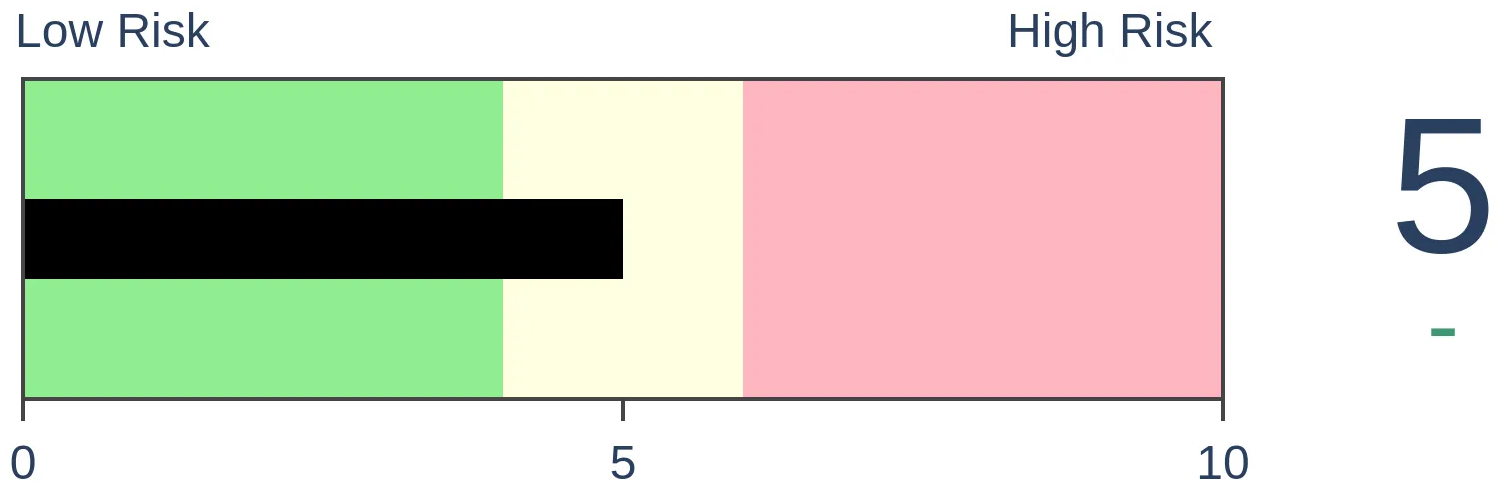
Bonds
|
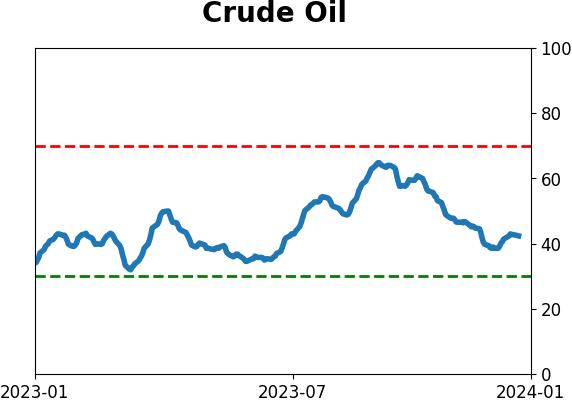
Crude Oil
|
|
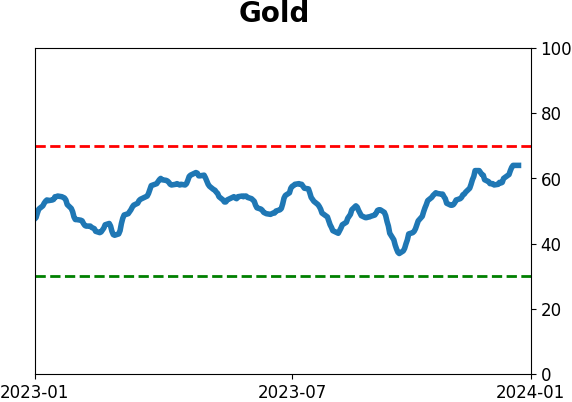
Gold
|
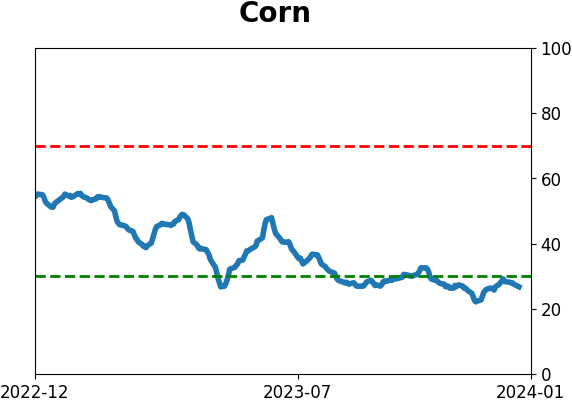
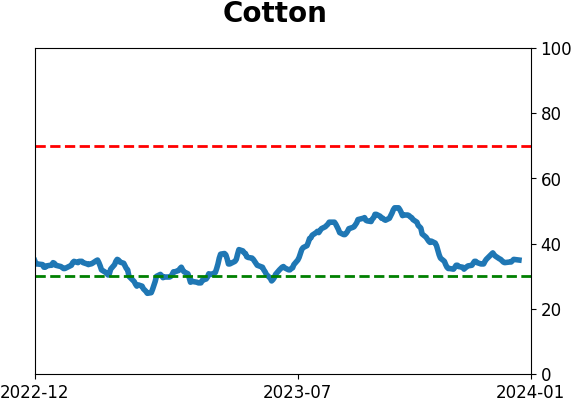
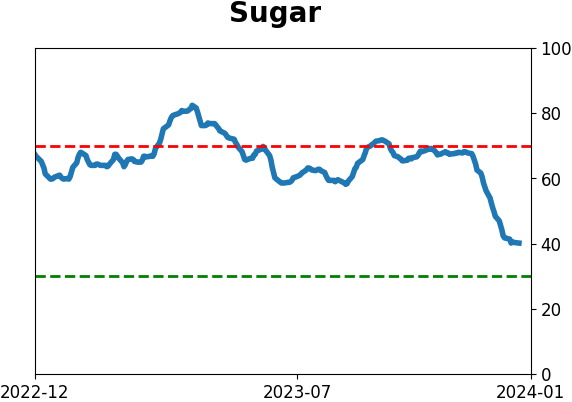
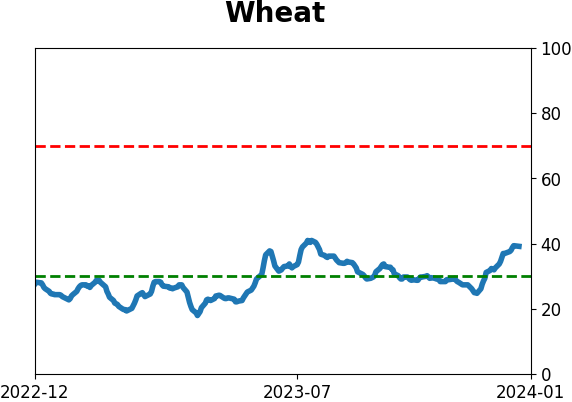
Agriculture

|
|
Research
By Jason Goepfert
BOTTOM LINE
Internal momentum across stocks, indexes, sectors, and even exchanges is historic. The McClellan Summation Index for the NYSE, as well as for some indexes and sectors, has reached escape velocity that never really occurs during ongoing bear markets. Forward returns after similar behavior were exceptional.
FORECAST / TIMEFRAME
None
|
Key points:
- The McClellan Summation Index for the NYSE has reached escape velocity, never seen during bear markets
- The Summation Indexes across indexes and sectors are at high or even record levels
- This type of internal momentum has rarely, if ever, preceded negative medium- to long-term returns
Buying is so broad and persistent that it's historic
We've spent much time since October 2022 discussing internal momentum across indexes and sectors. With the latest push higher, many of those metrics confirm the participation that typically precedes further gains.
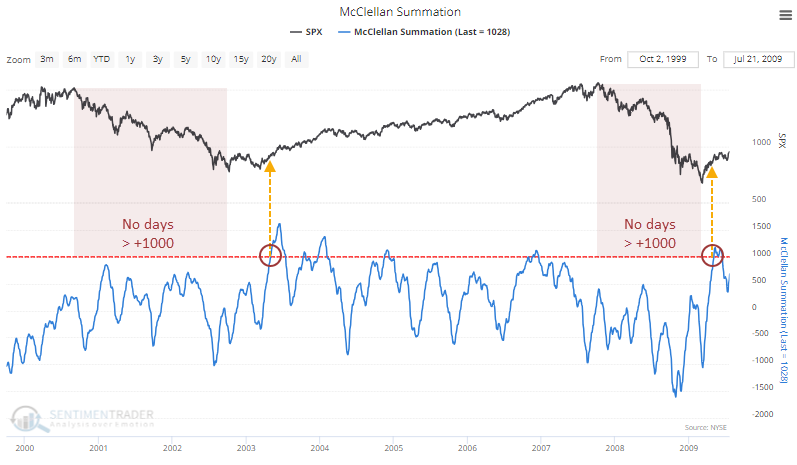
The McClellan Summation Index for the NYSE has pushed above +1000 after having been severely oversold. A very high reading is typically a good sign of lasting internal momentum, as Jay noted on Friday, and the fact that it has cycled from a deeply negative reading adds to its importance.
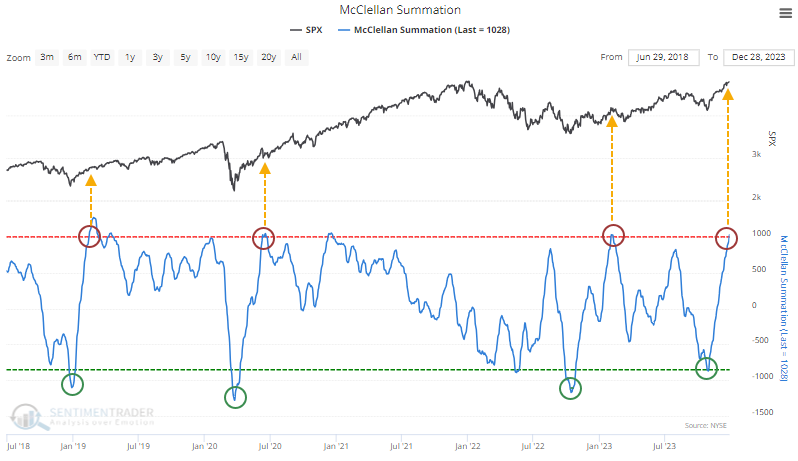
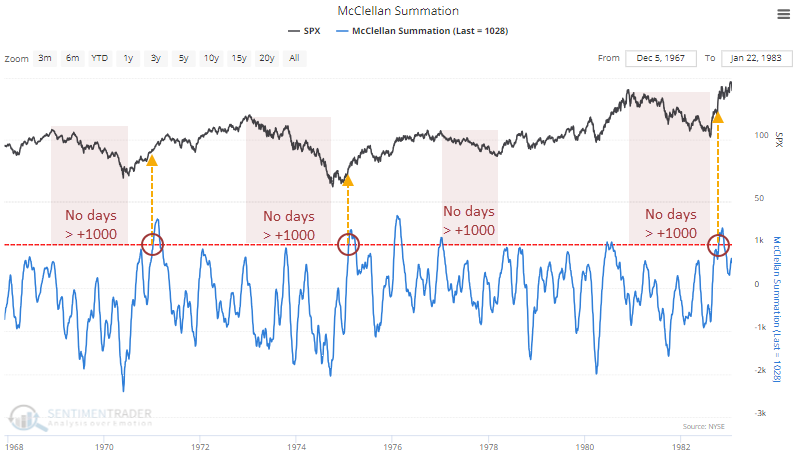
The +1000 level was not breached during prior ongoing bear markets, only when the bear markets had run their courses. It didn't happen at any point during the 2000-02 or 2008 bear markets....
...or at all during the 1970s and early 80s bears.
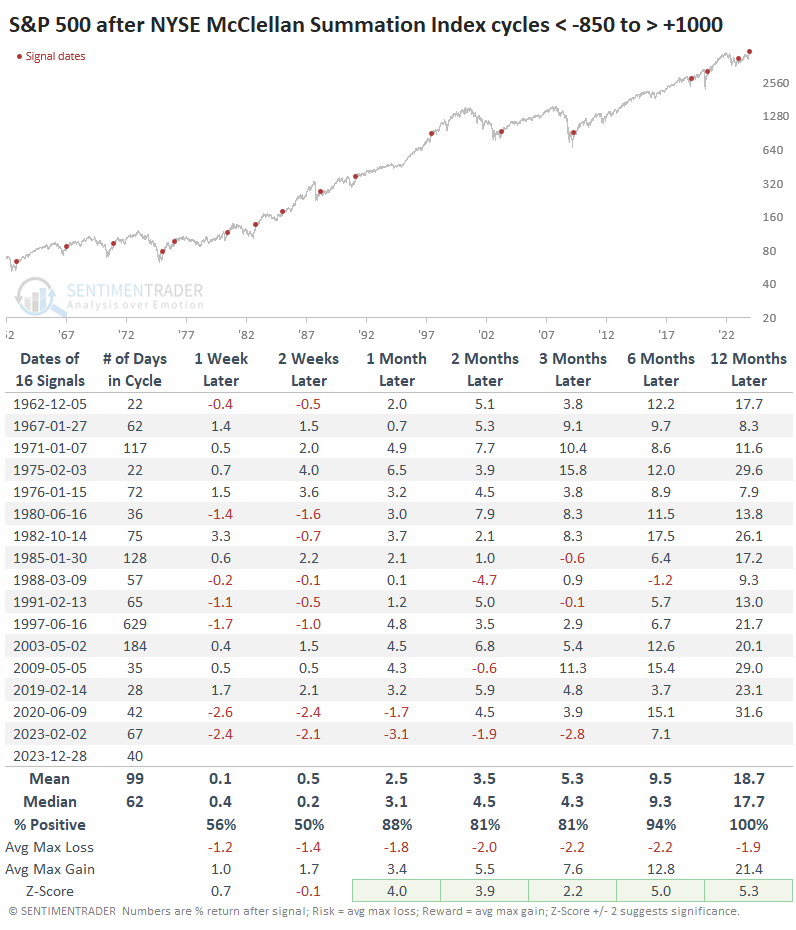
When the Summation cycle turns, it has been excellent for returns
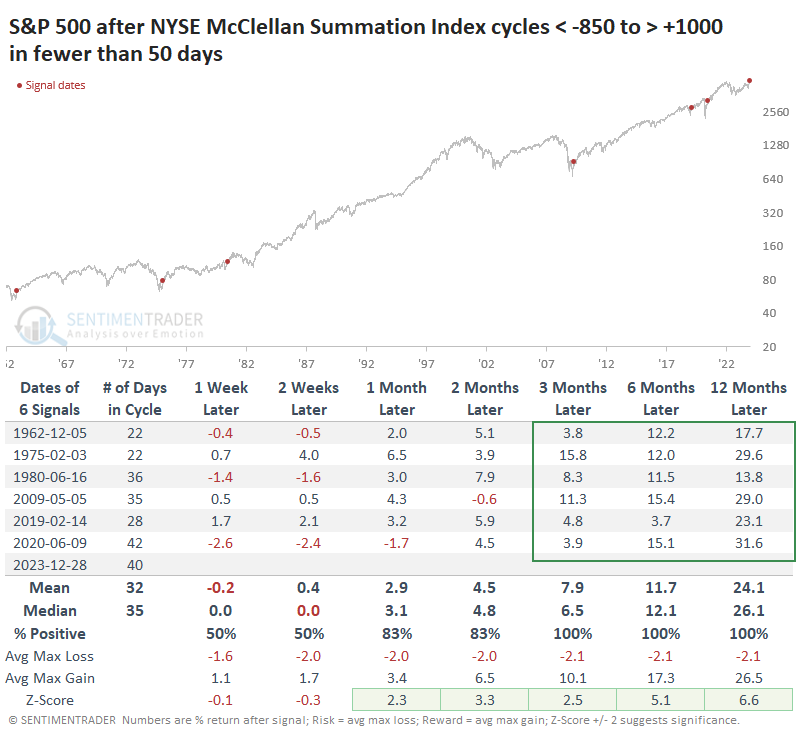
Let's go back and look at major negative-to-positive cycles in the Summation Index. The table below shows other times when the indicator cycled from below -850 to above +1000, regardless of how long it took.
After these signals, the next couple of weeks were hit-and-miss, but medium- to long-term returns were exceptional, and there were no losses over the next year.
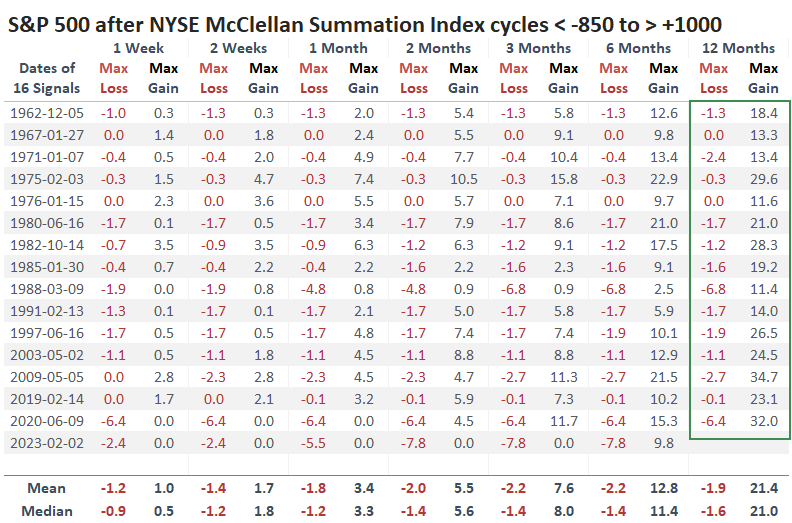
The risk/reward table shows some of the most skewed results we've ever seen. No signal suffered more than a -6.8% drawdown at any point within the following year, yet every signal enjoyed a double-digit gain at some point.
After the shortest cycles, when momentum shifted so notably in fewer than 50 sessions, the S&P's future returns were even more impressive. Granted, the sample size is tiny, but we can have a bit more confidence in the results due to their consistency. Every one of them was triggered after a bear market had ended.
Internal momentum is robust across indexes and sectors
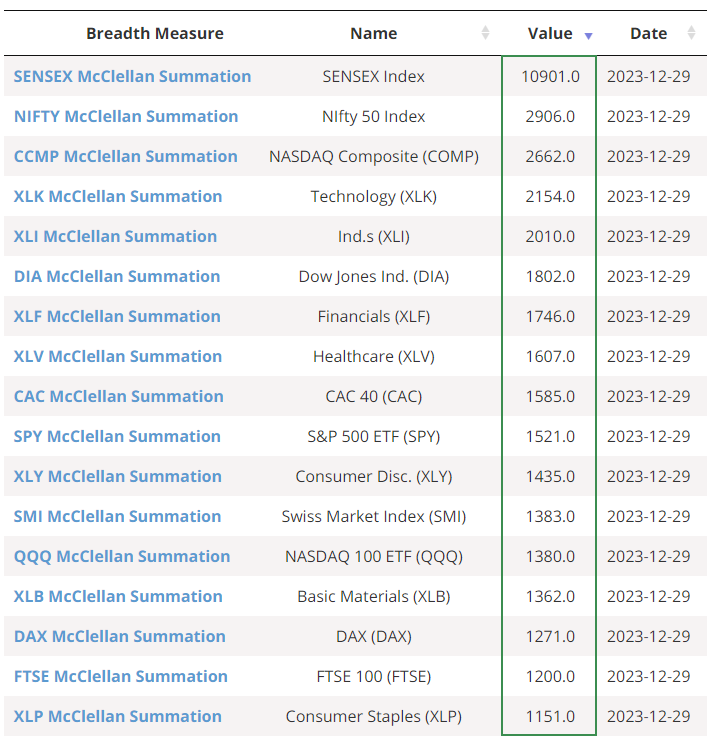
Scrolling through the McClellan Summation Indexes for other indexes and sectors, a remarkable number are over +1000. A handful of them are at all-time highs.
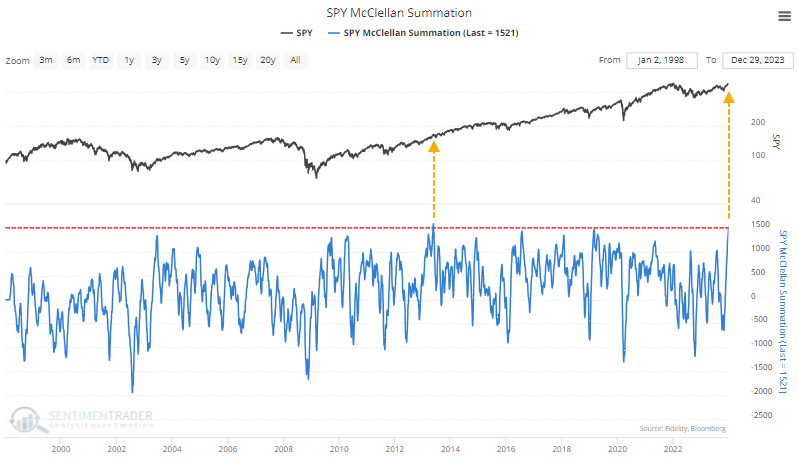
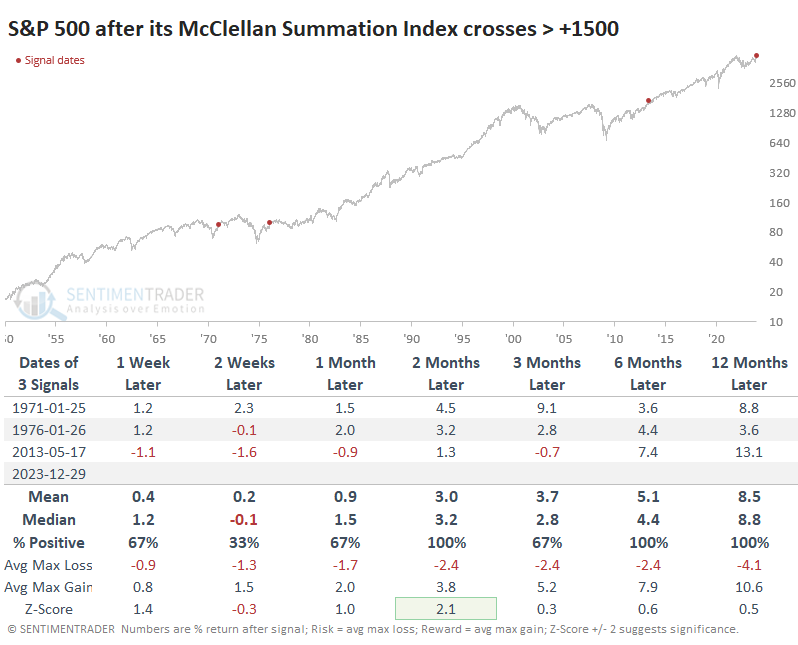
Perhaps none of these are as important as the one for the S&P 500, the most benchmarked equity index in the world. Its McClellan Summation Index has climbed above +1500 for only the 2nd time in 25 years. The other instance, in May 2013, preceded a one-month pullback and then a resumption of upside momentum.
If we go back to 1950, it's clear that what we're seeing is historic. Only two other dates reached this level, after bear markets in the 1970s.
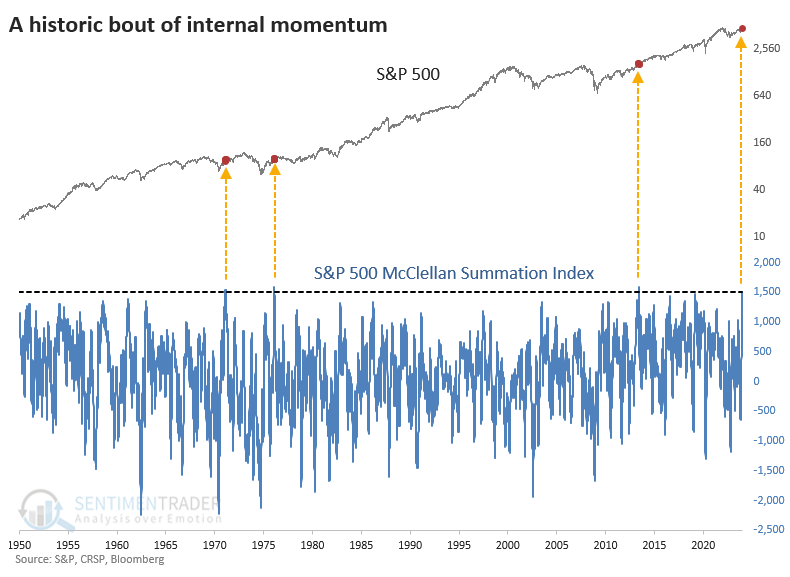
After each of these surges, the S&P had some difficulty adding to its gains over the short term, but overall risk was relatively low up to a year later.
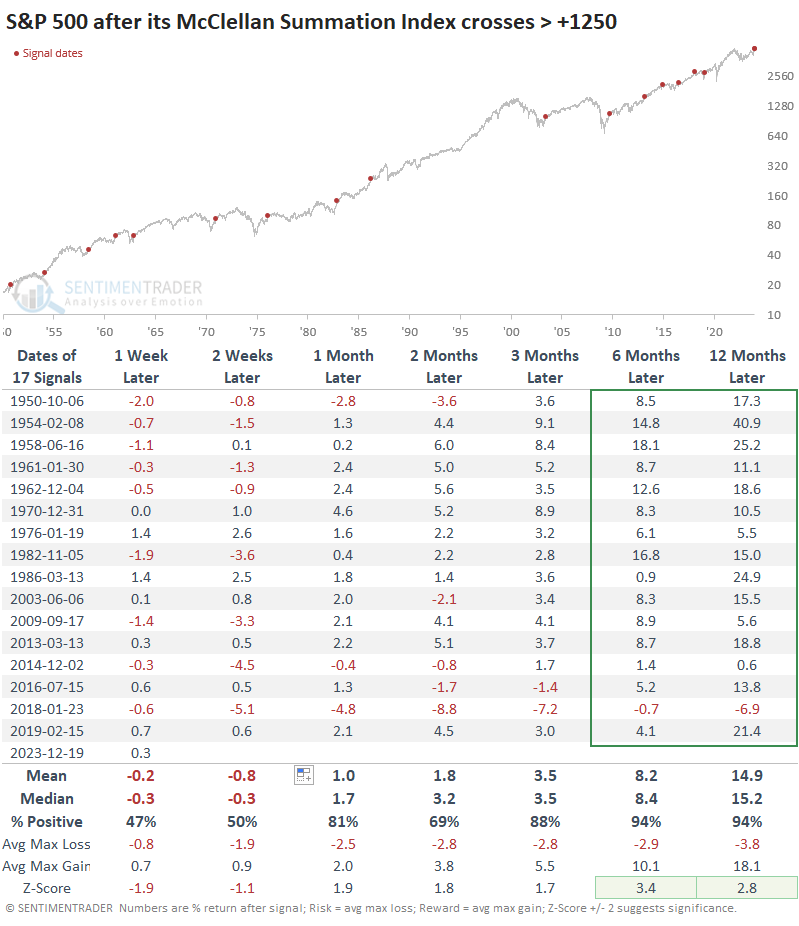
Obviously, it's a stretch to rely on a sample size of three. If we relax the Summation Index threshold to anything above +1250, we get more precedents and further confirmation that momentum like this is a notable signal for long-term returns. There was only one negative signal from 2018.
What the research tells us...
Since October 2022, we've detailed study after study that suggested the type of behavior we're witnessing is not something that has ever occurred during an ongoing bear market. Investors didn't want to believe it after the scars of 2022, one of the worst years for financial assets in history.
Sentiment has come a long way since then, and there are many indications that it has become overheated. Again, that does not have a chance to happen during protracted bear markets, but it does tend to indicate below-average annualized returns as buyers pull back a bit and take a breather. A multi-week pullback would be common after readings like we're seeing now. But the signs of internal momentum we've seen lately are remarkable and have rarely - if ever - preceded a significant market peak within the following year.
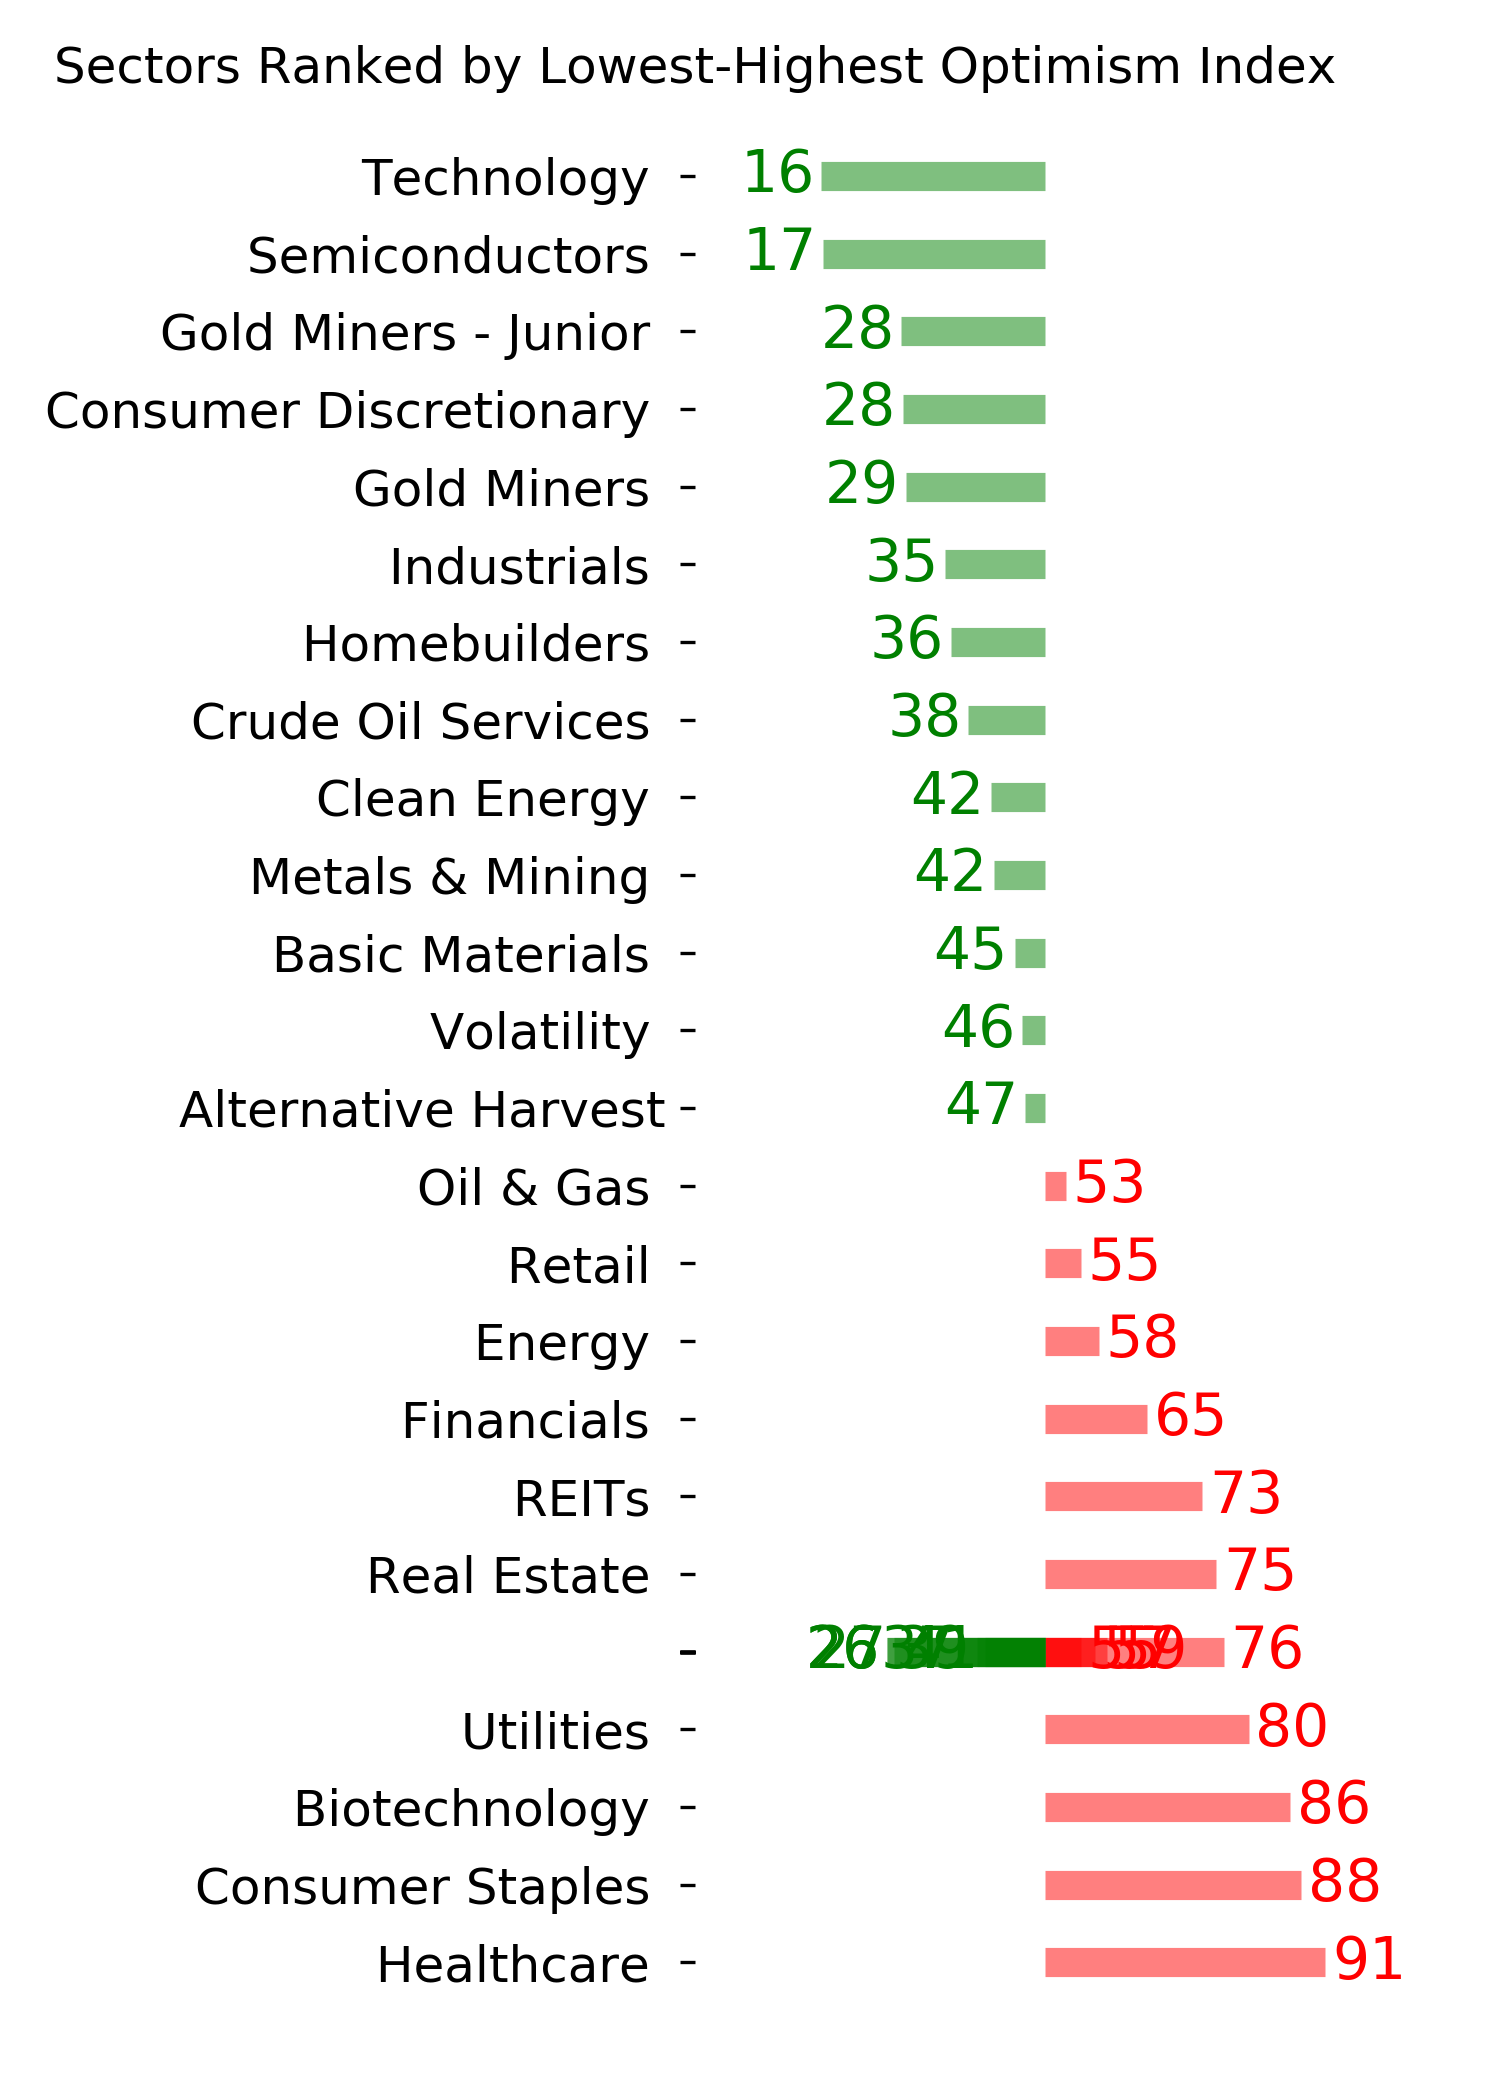
Indicators at Extremes
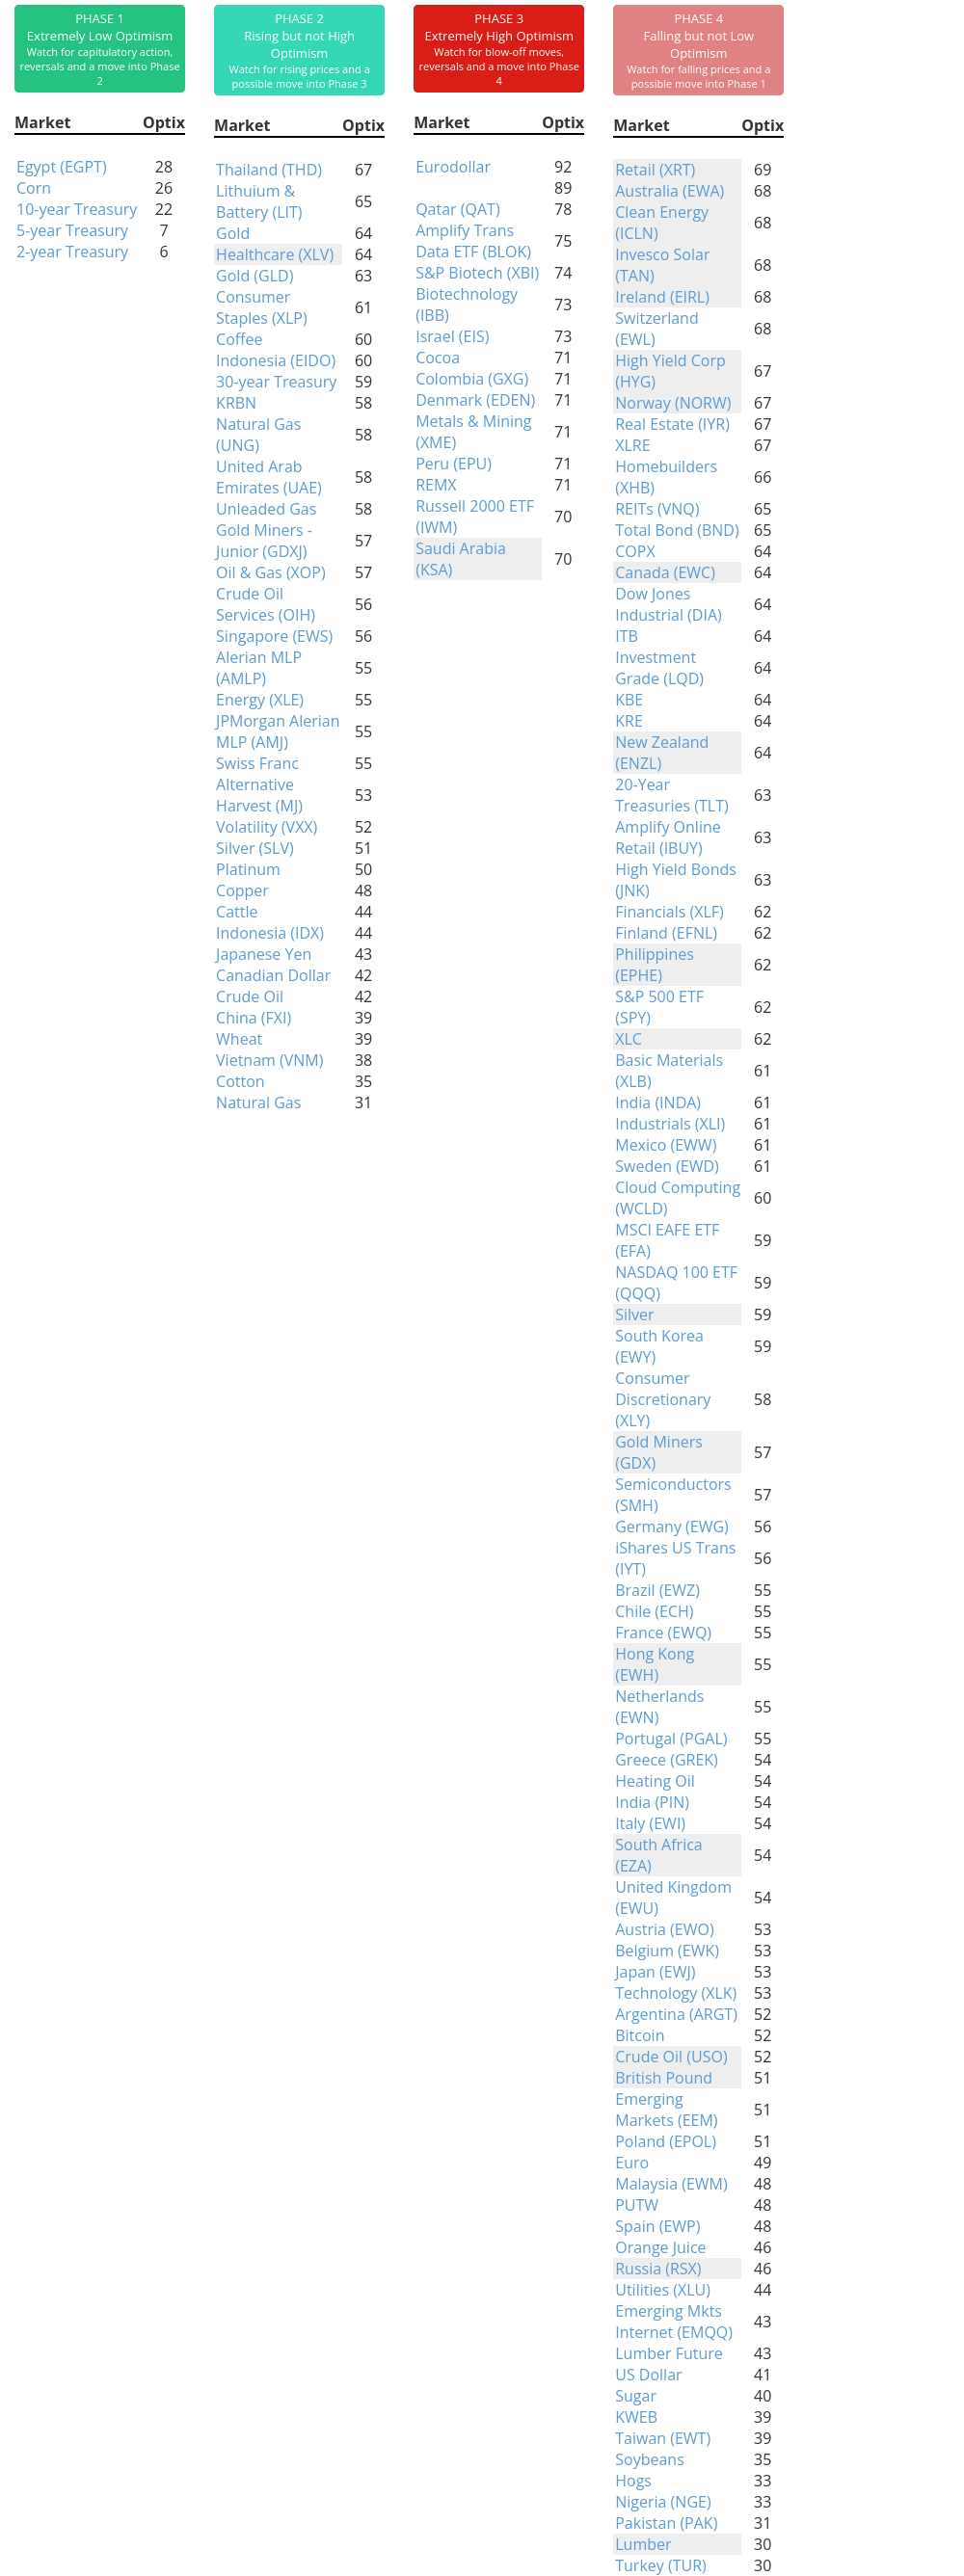
Phase Table
Ranks
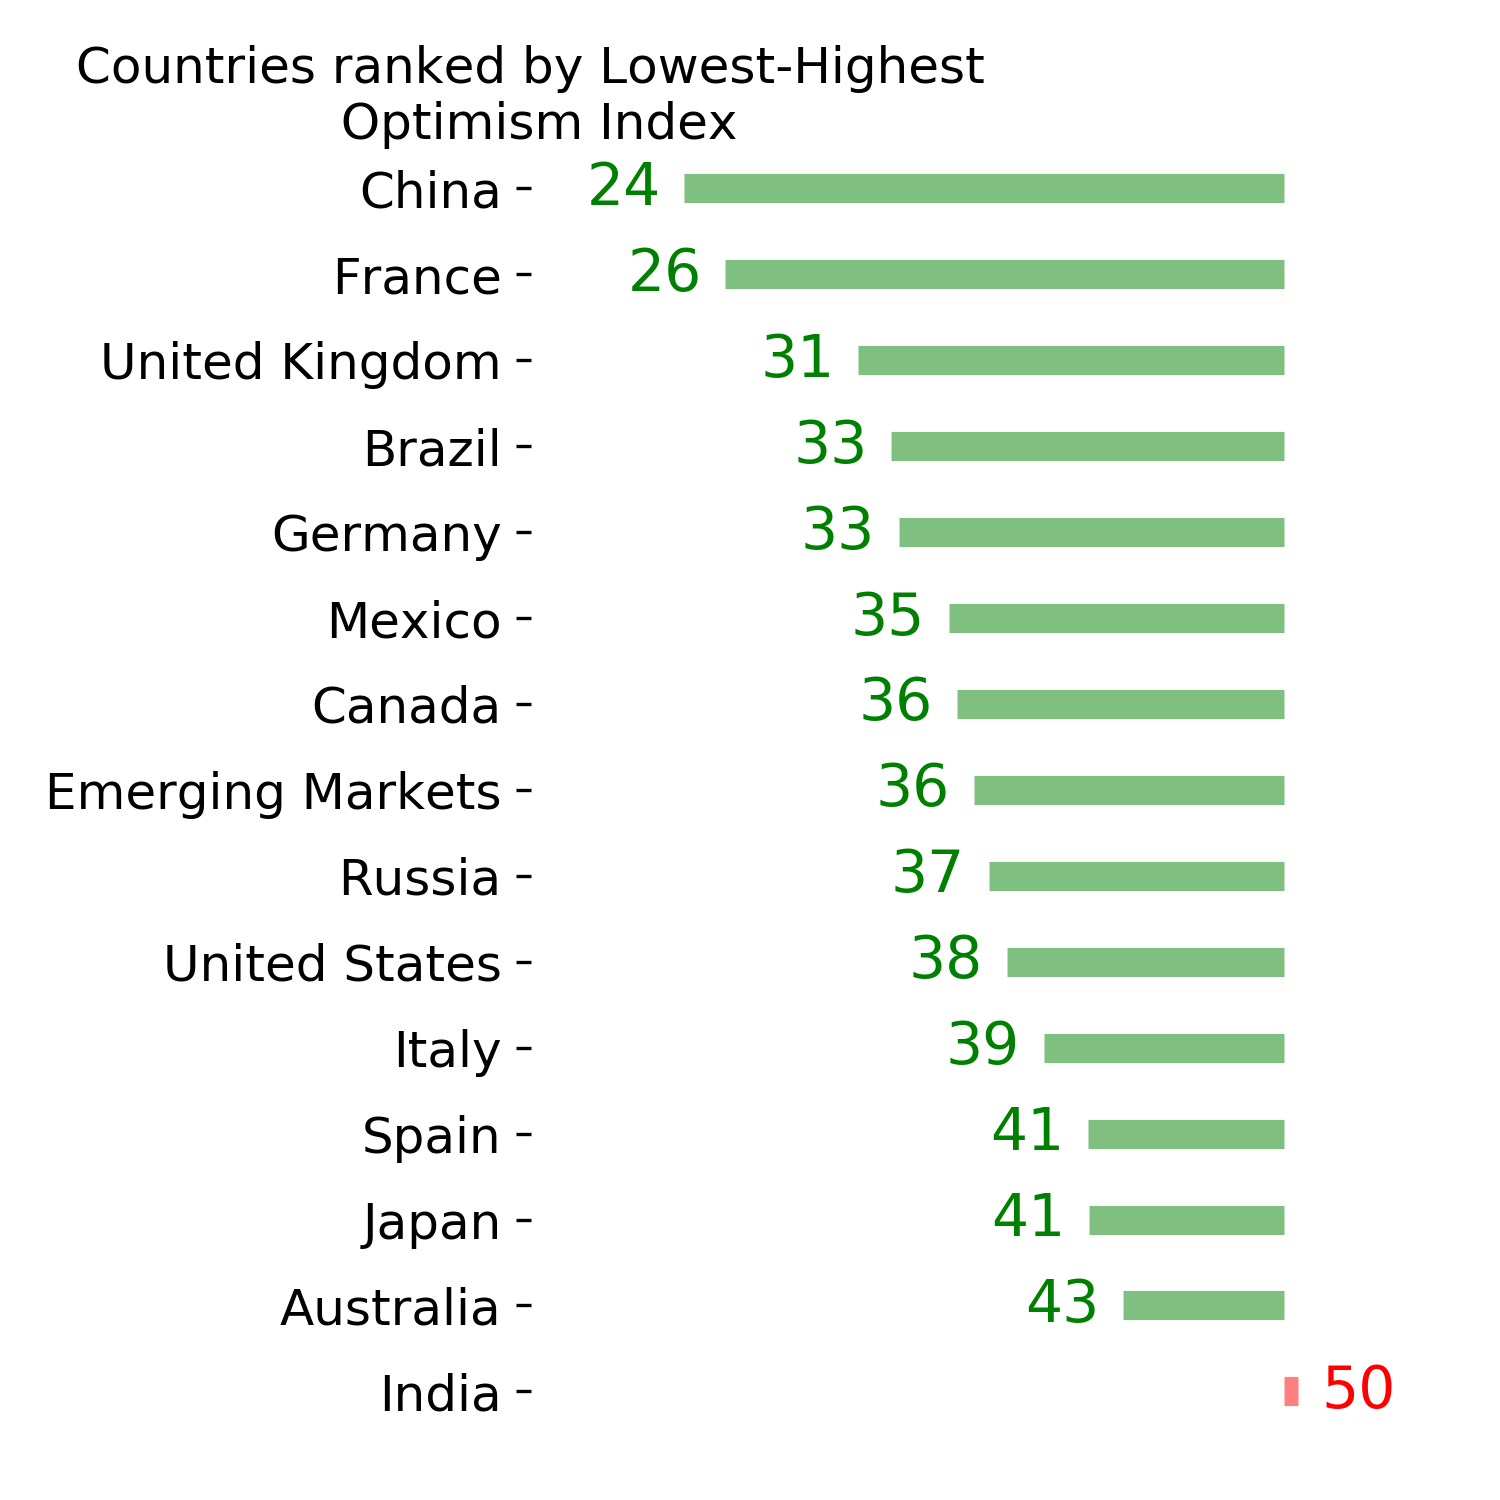
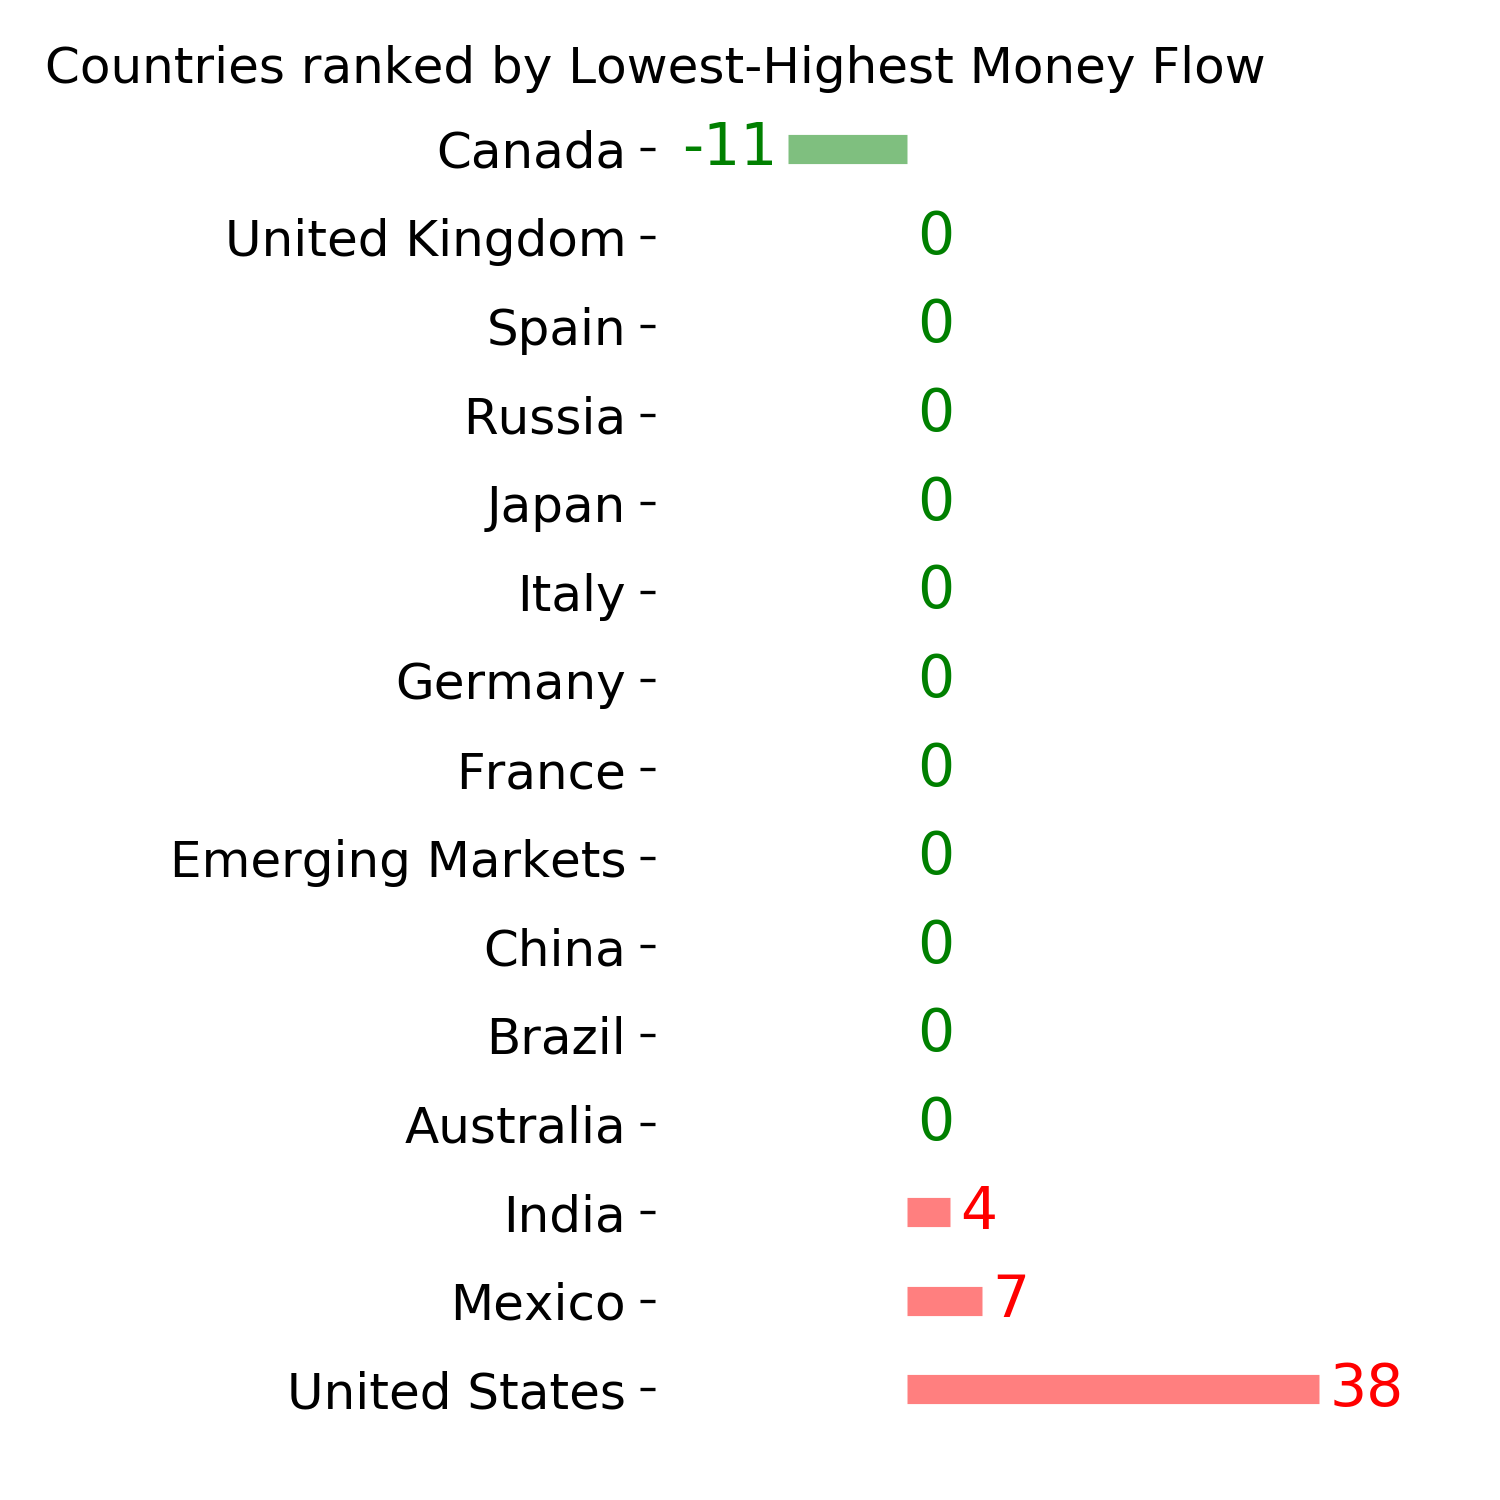
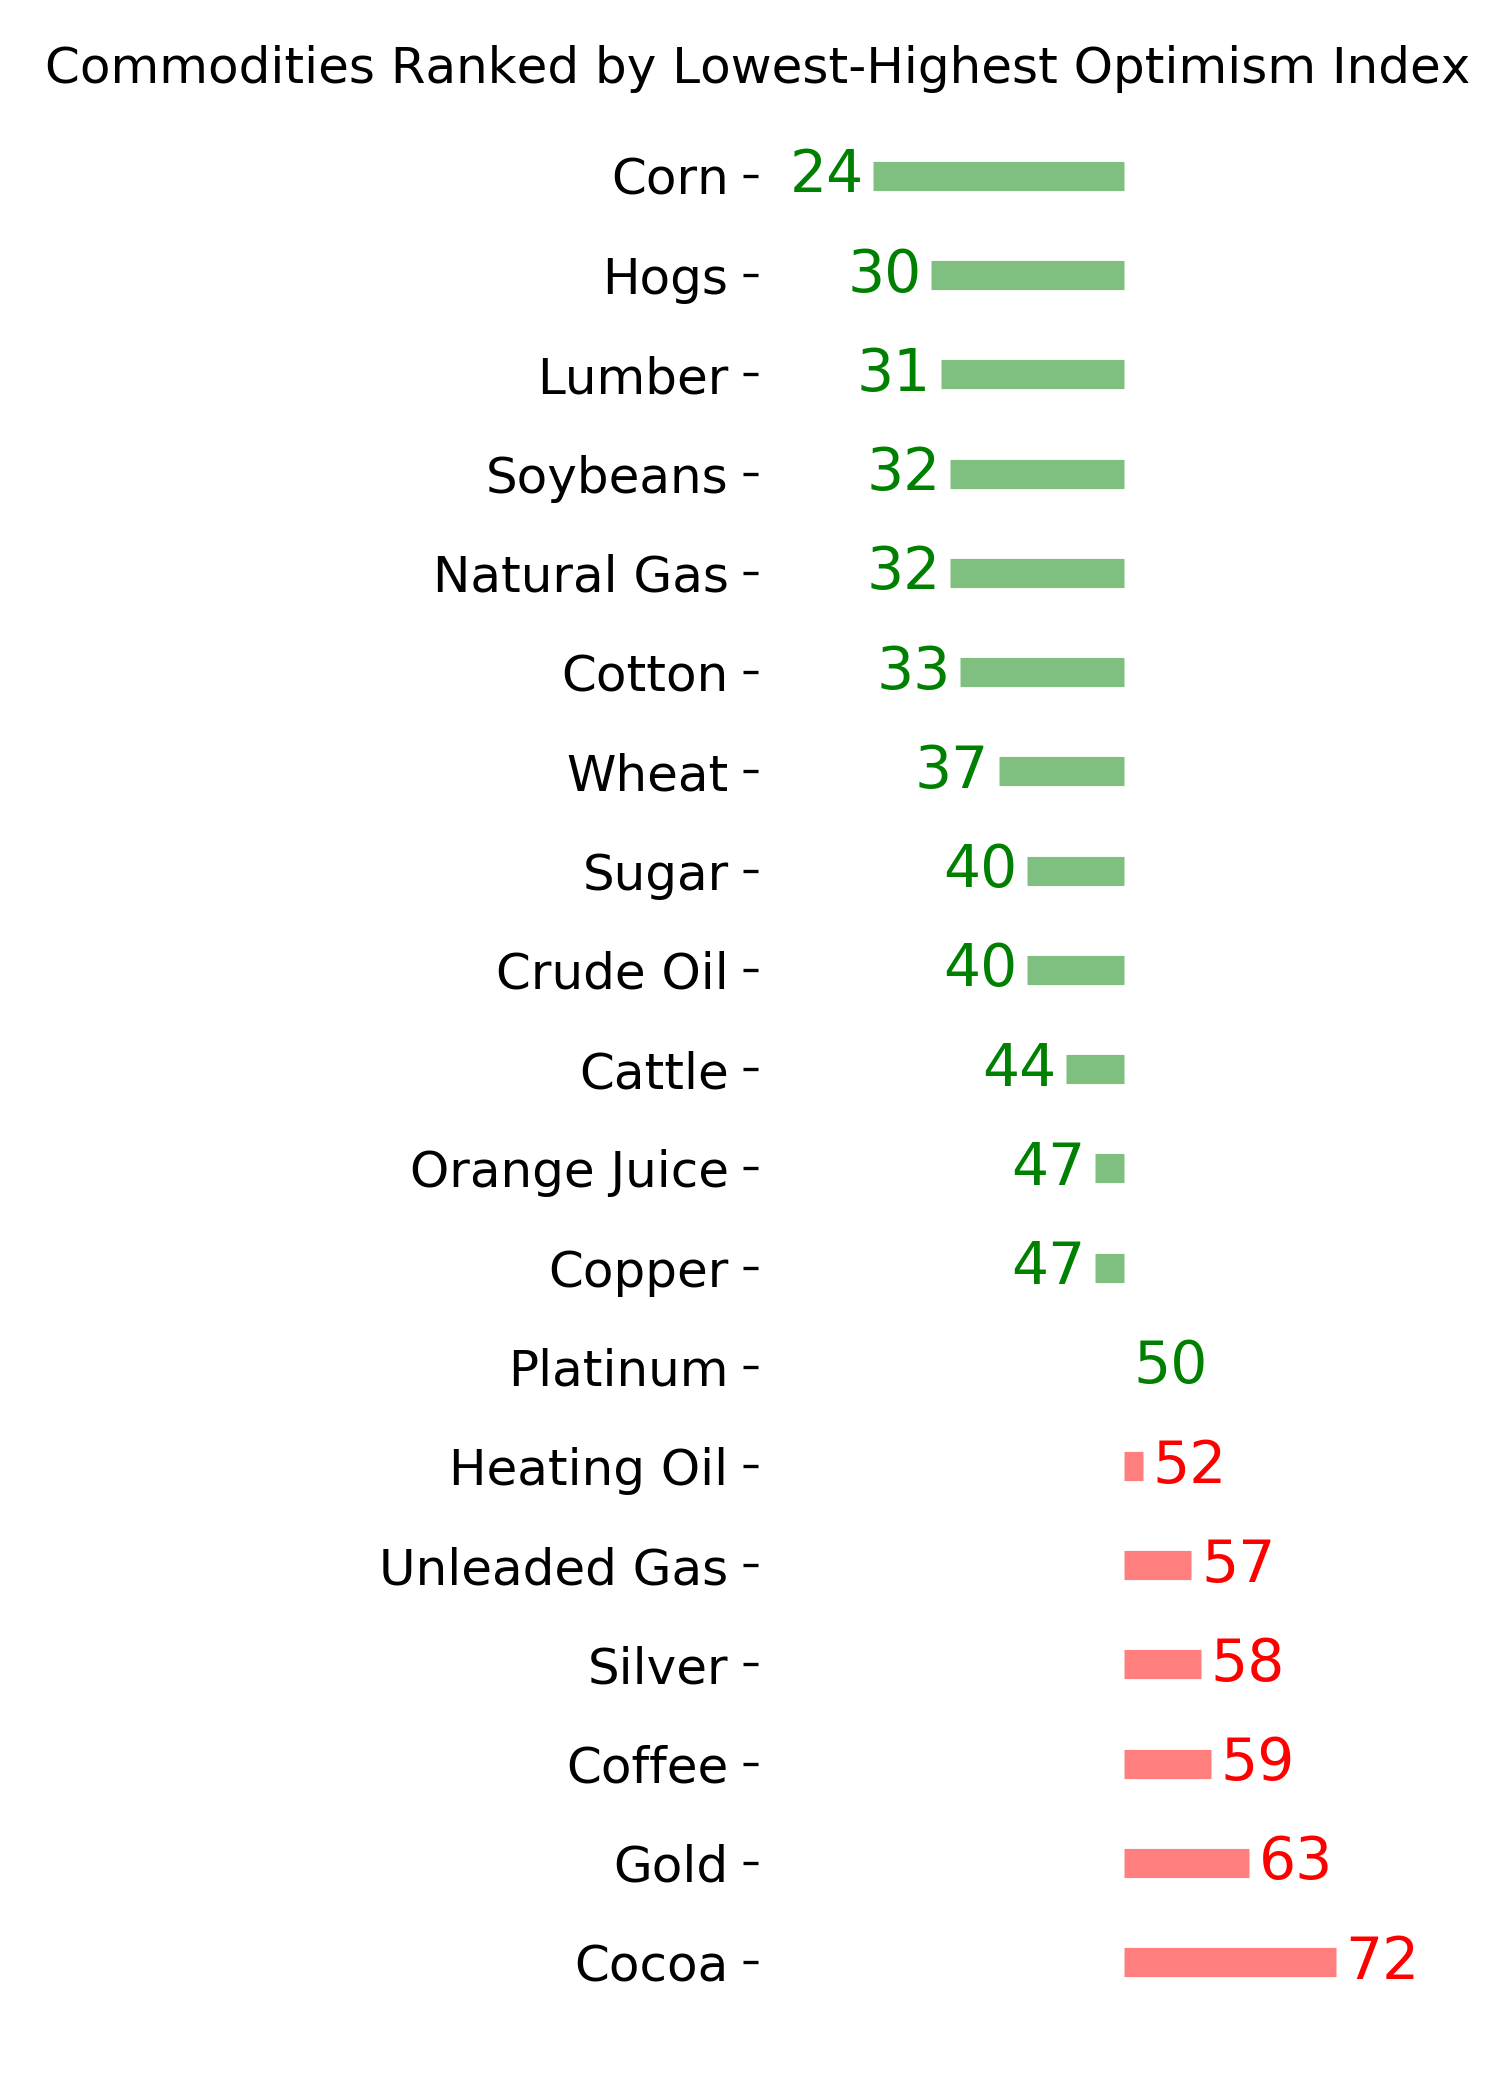
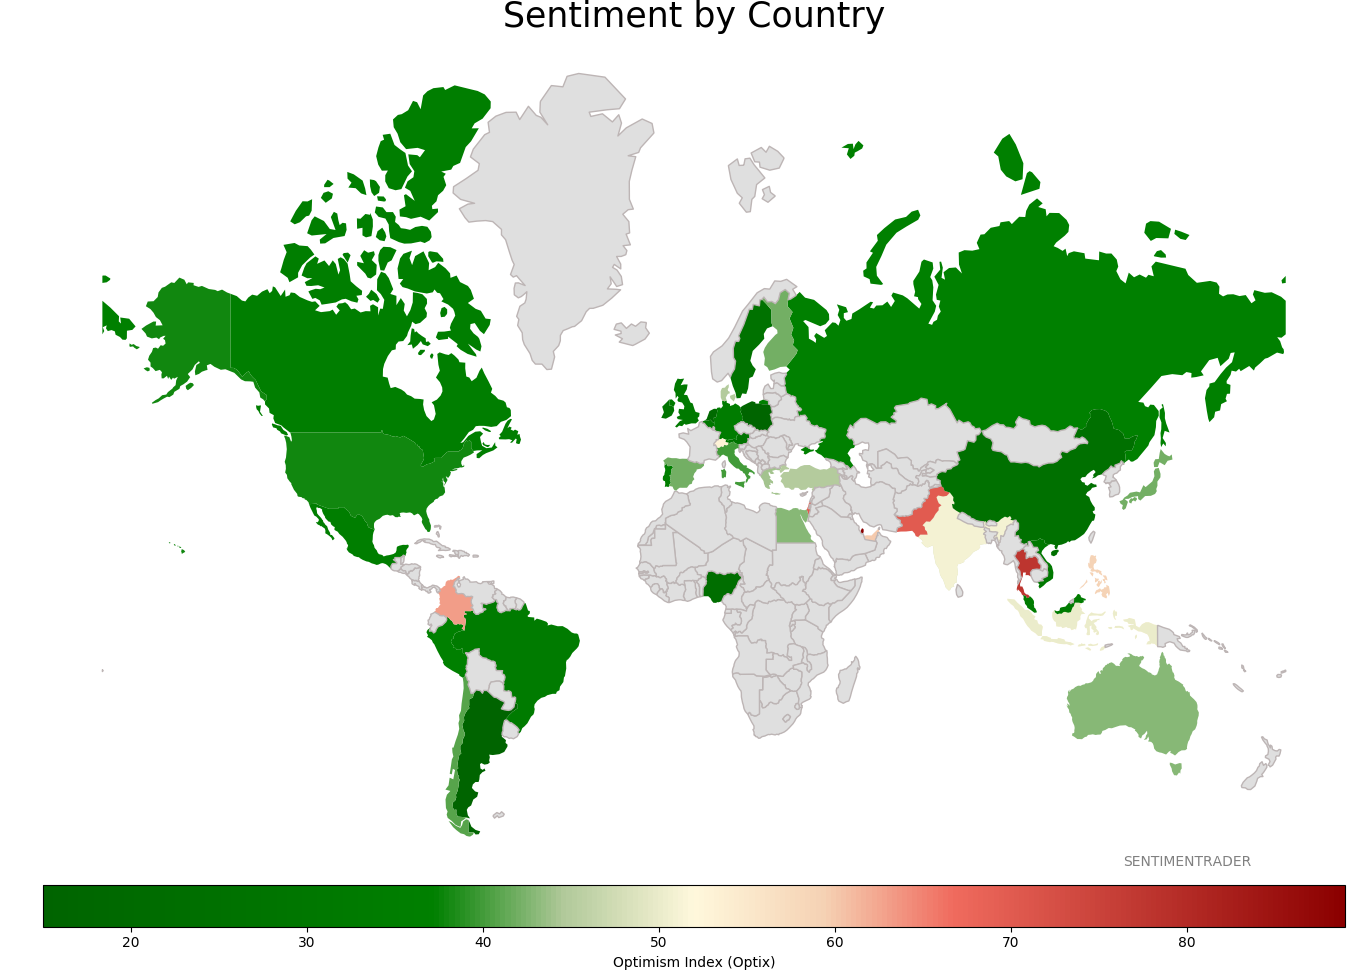
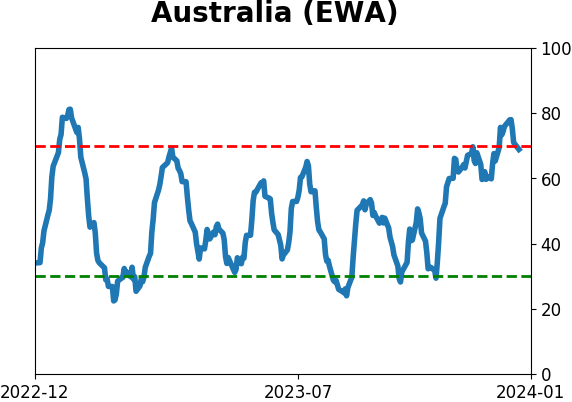
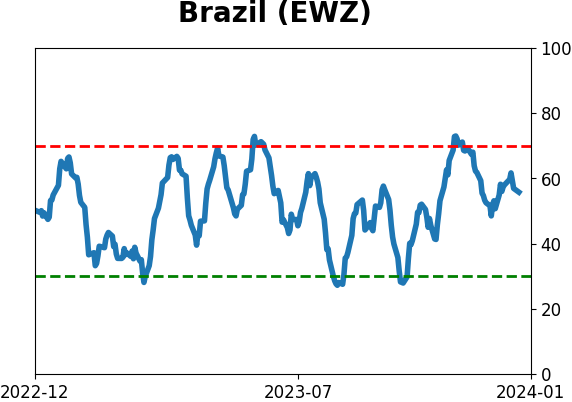
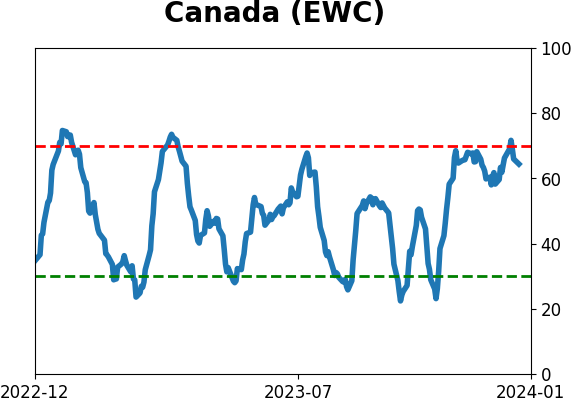
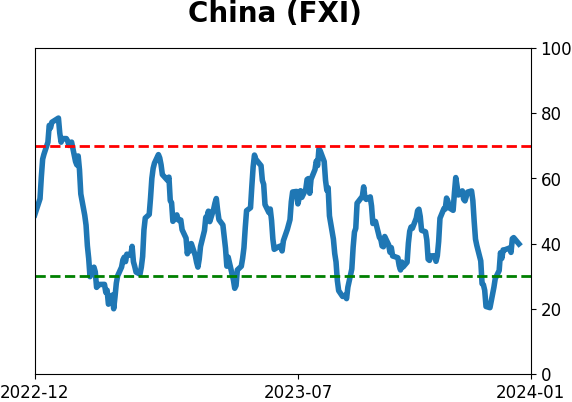
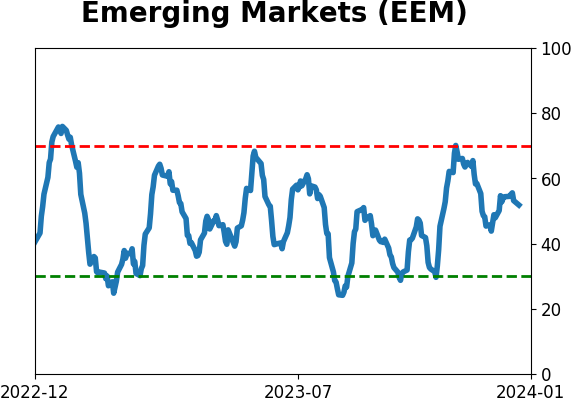
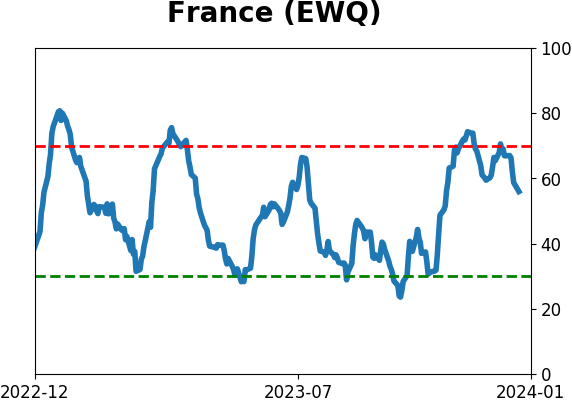
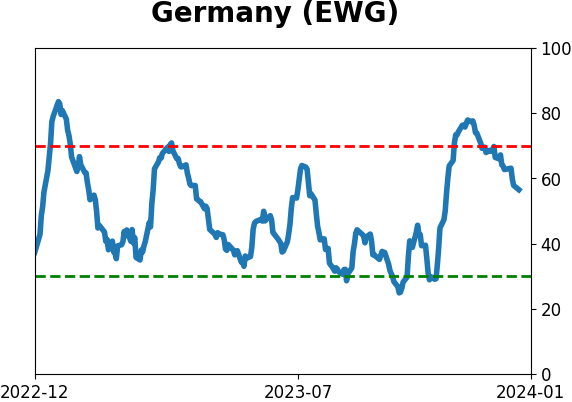
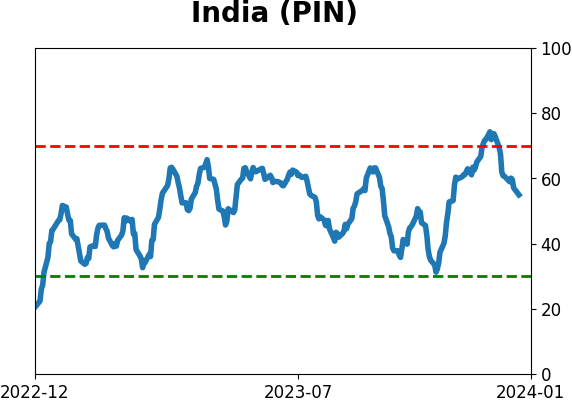
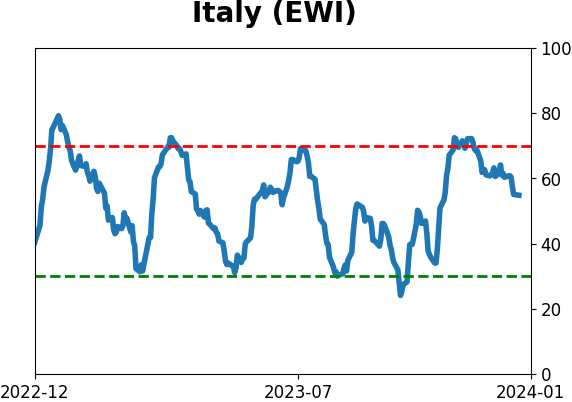
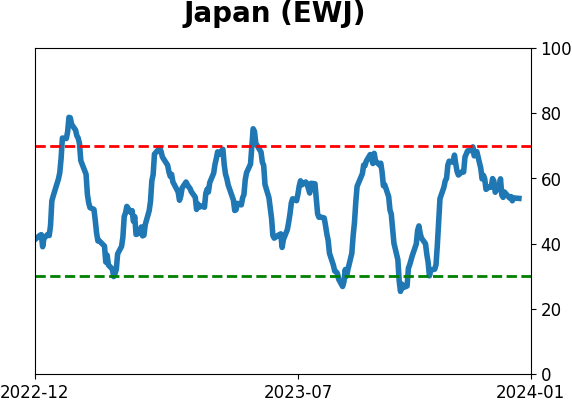
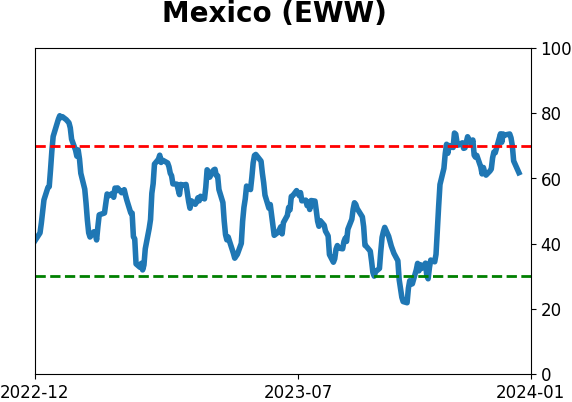
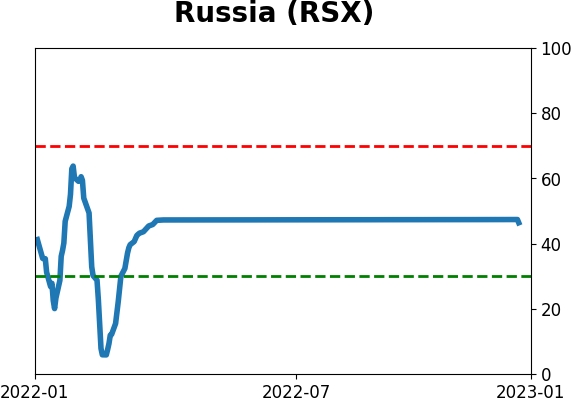
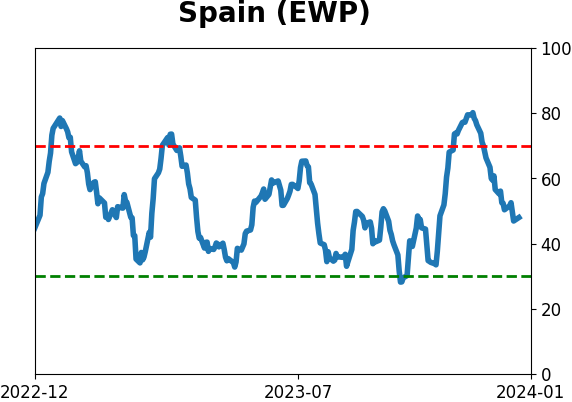
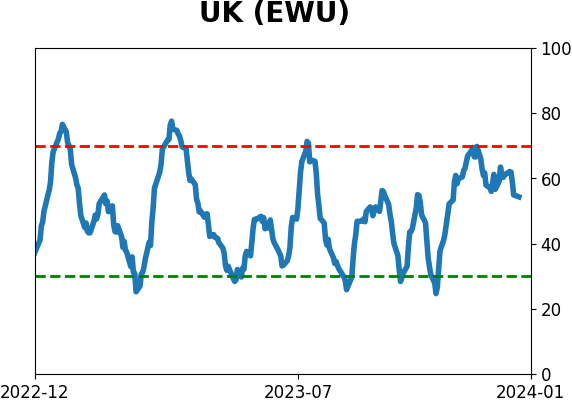
Sentiment Around The World
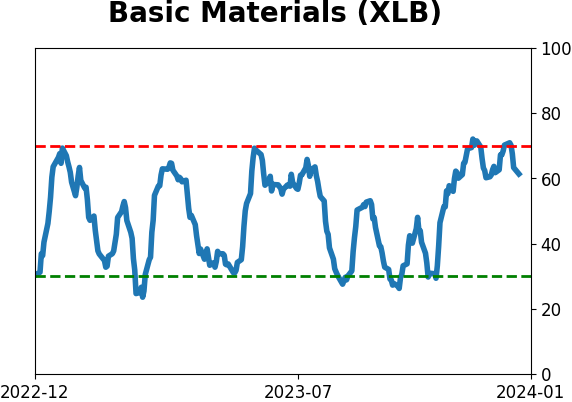
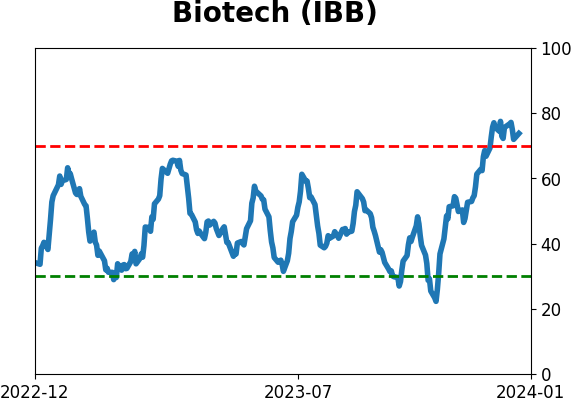
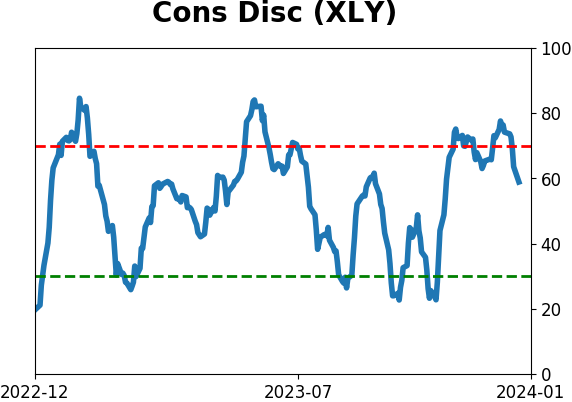
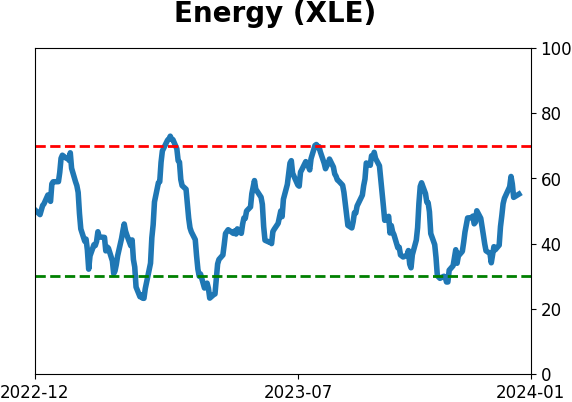
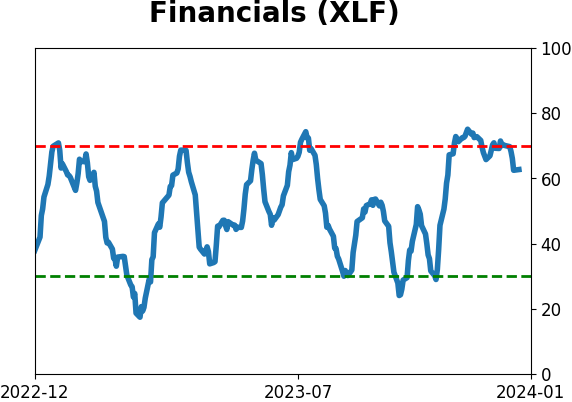
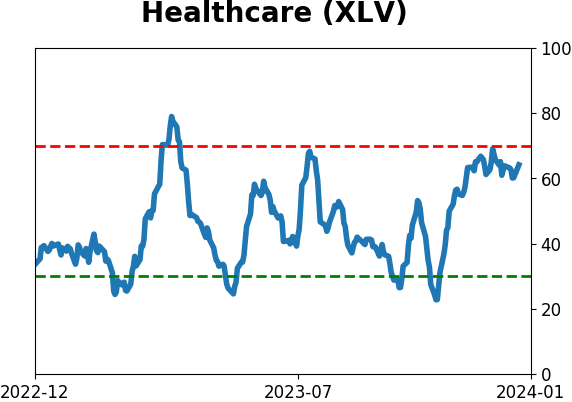
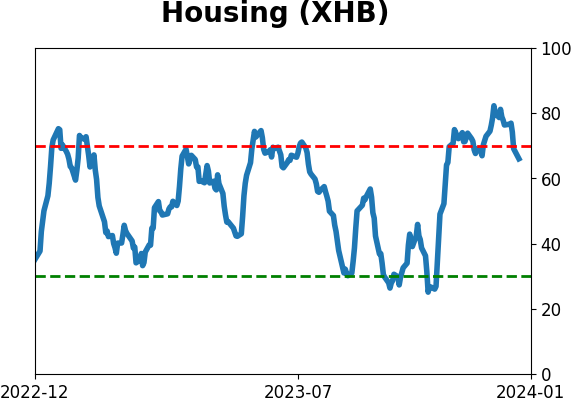
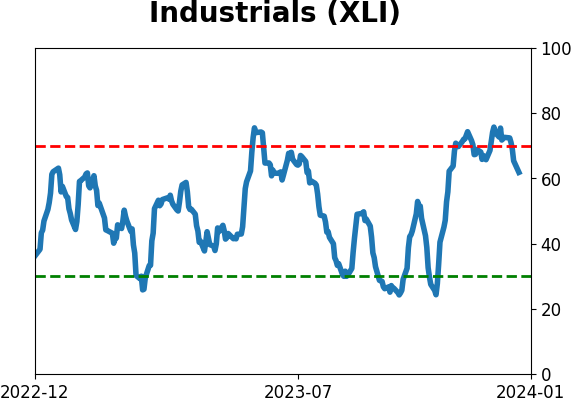
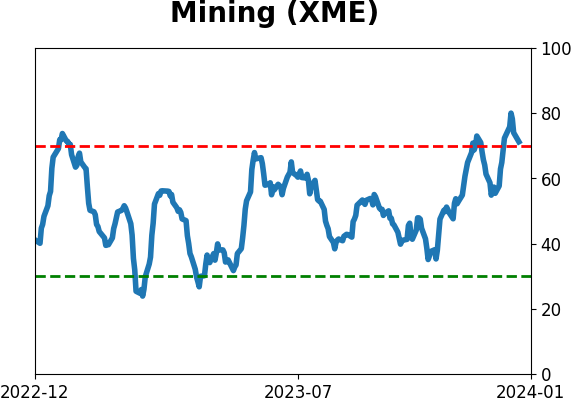
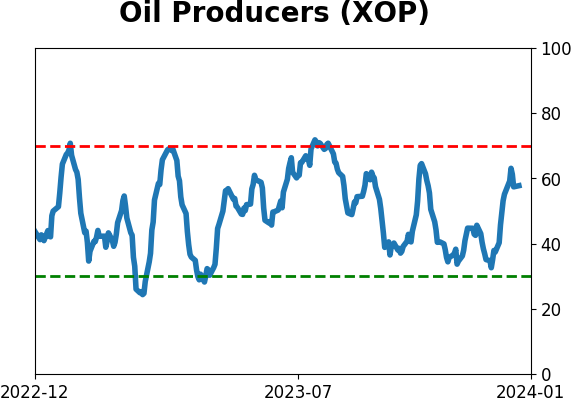
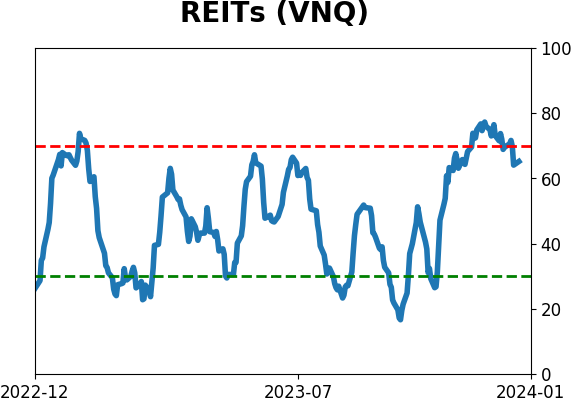
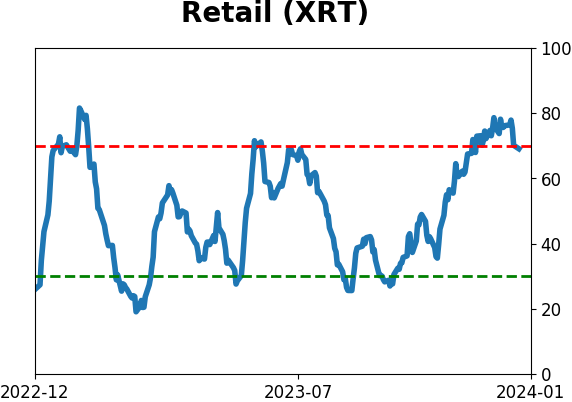
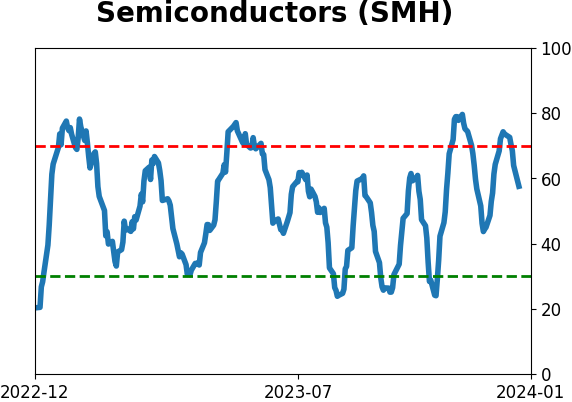
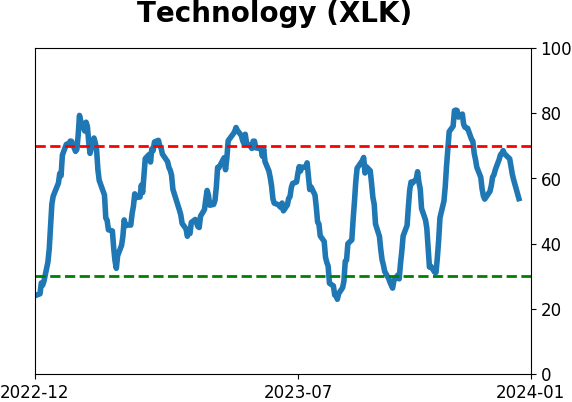
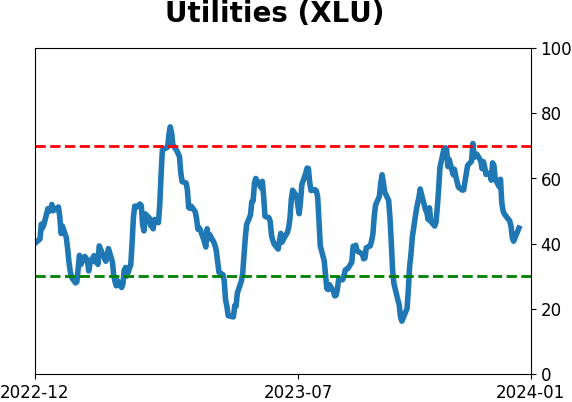
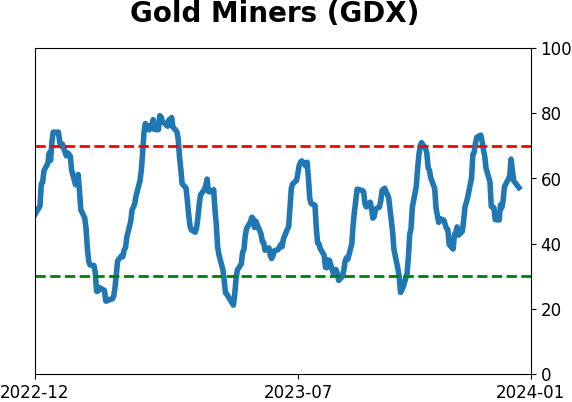
Optimism Index Thumbnails
|
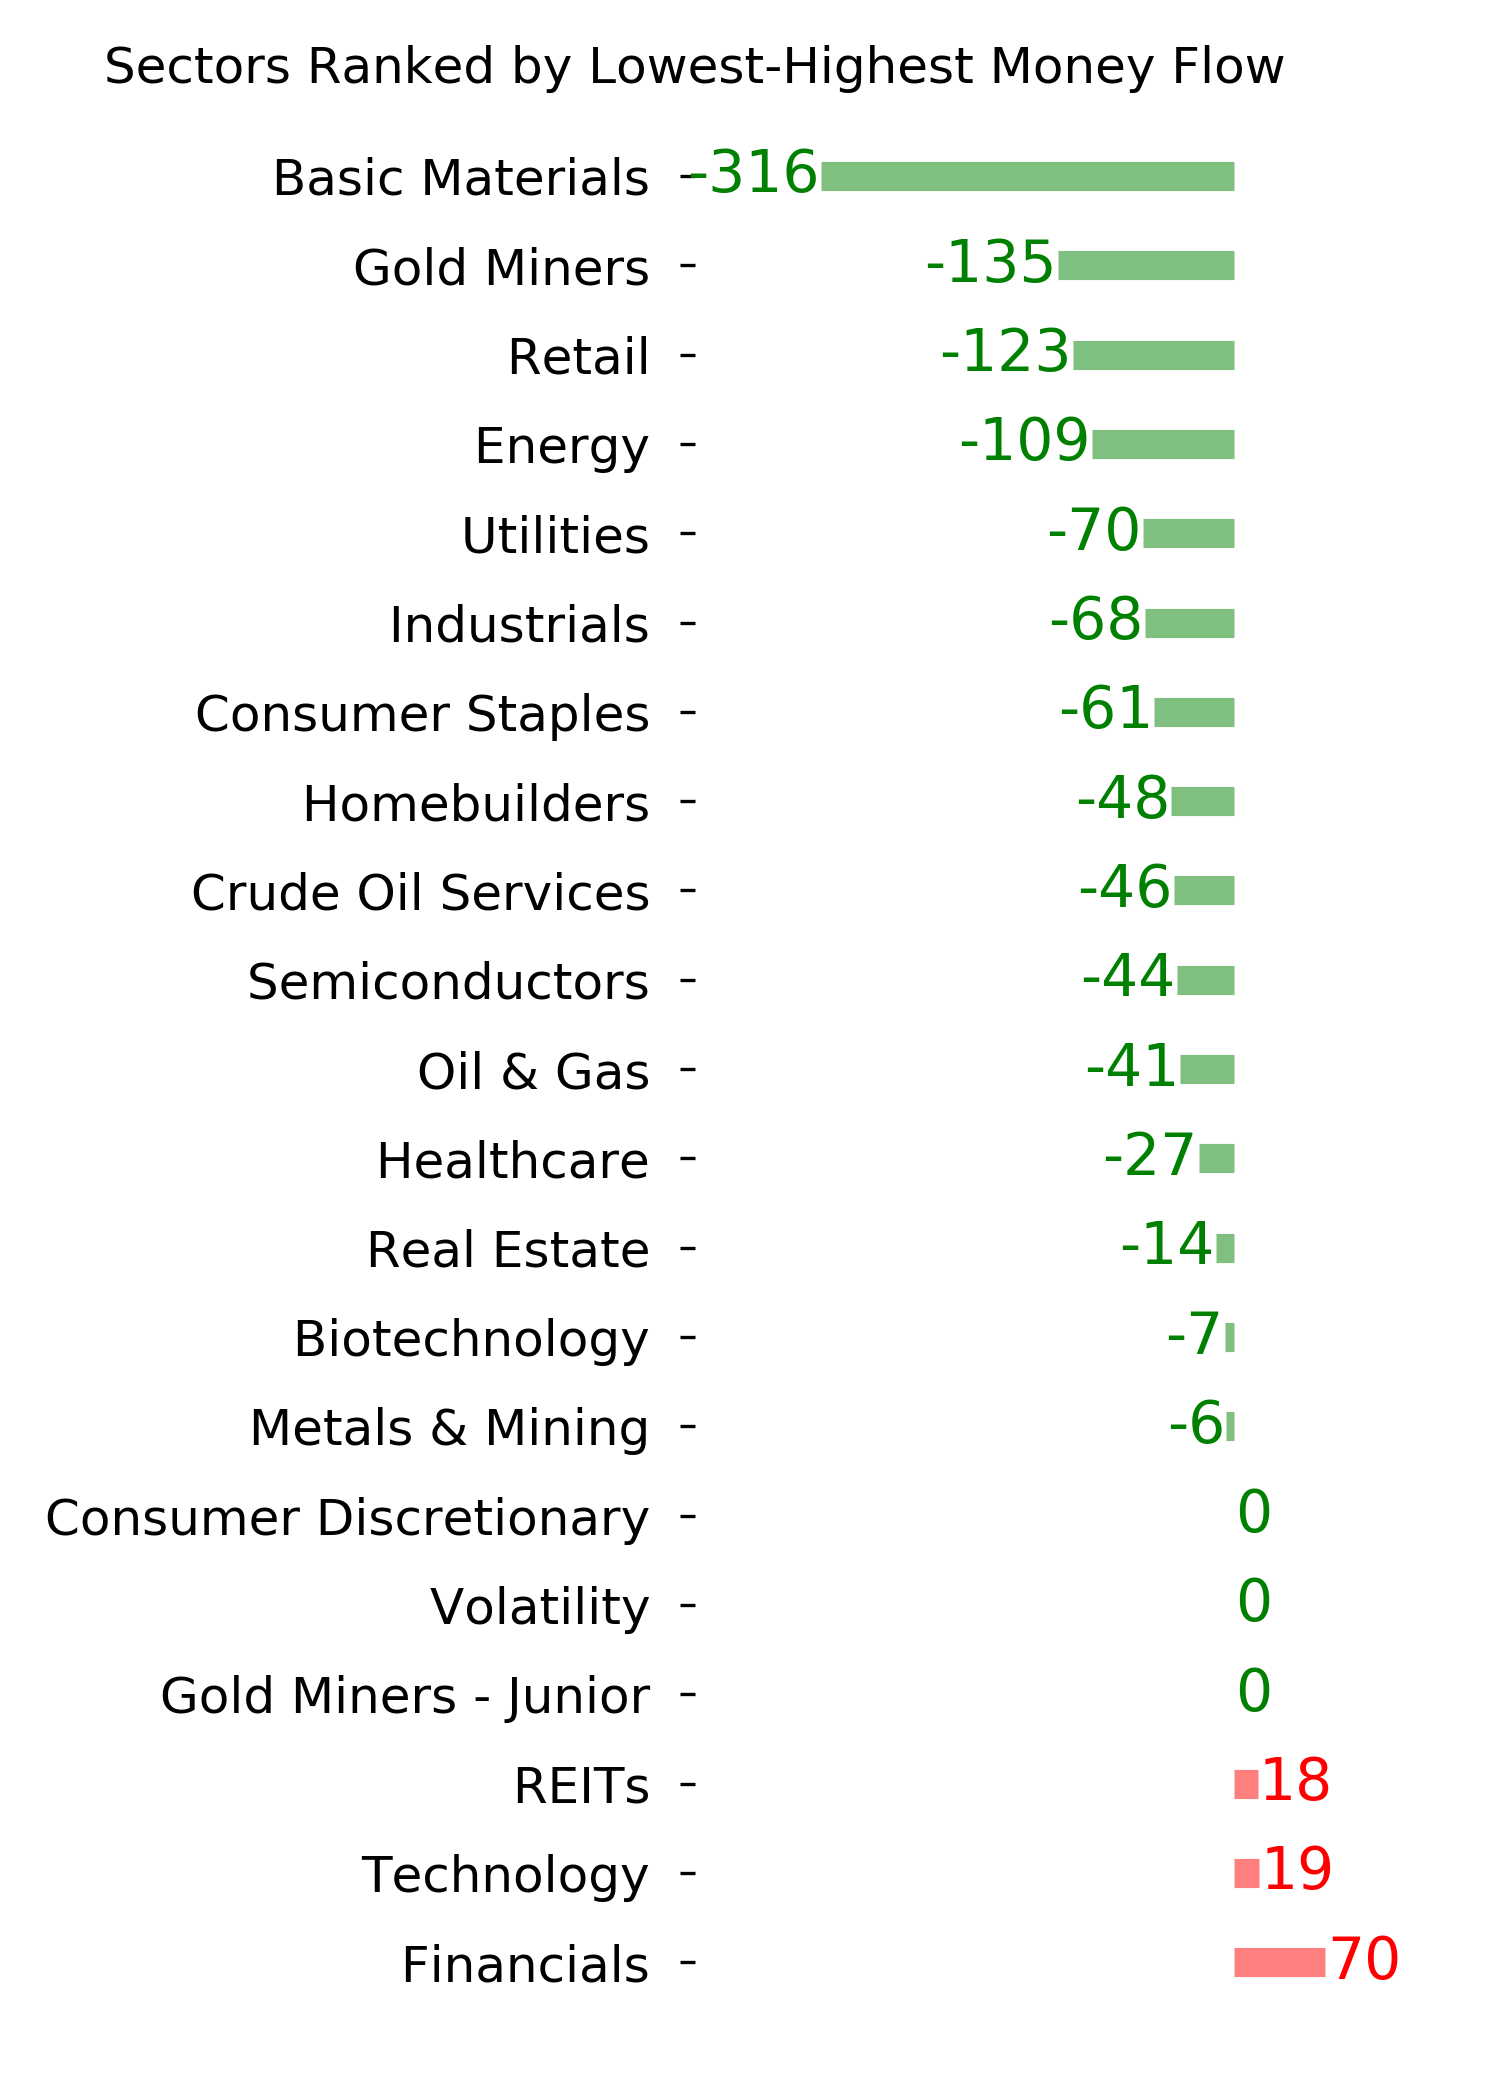
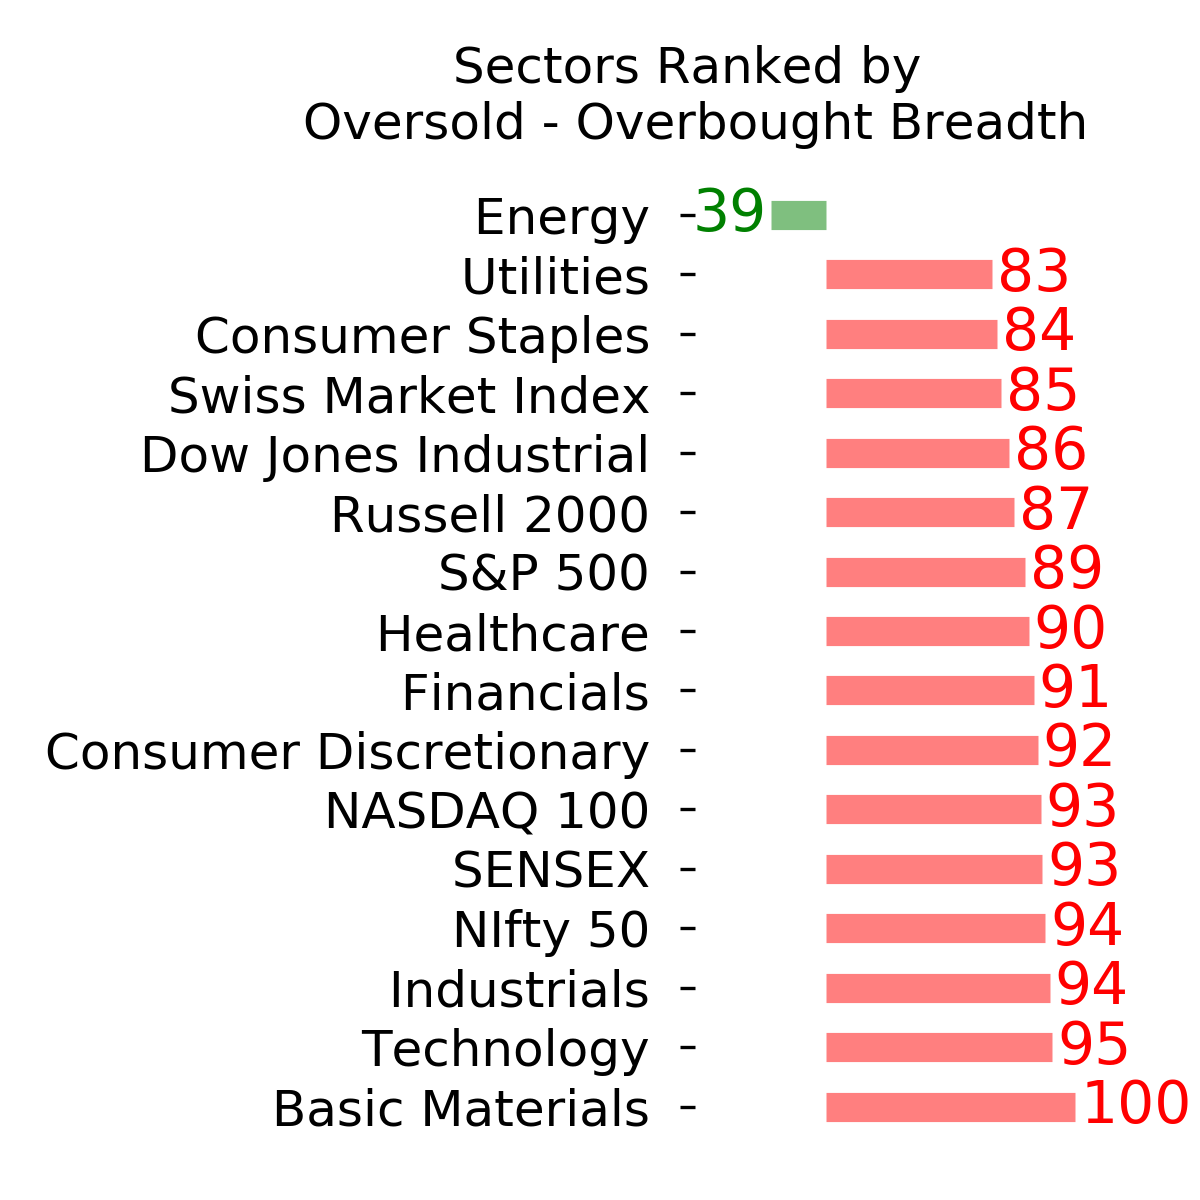
Sector ETF's - 10-Day Moving Average
|
|
|
Country ETF's - 10-Day Moving Average
|
|
|
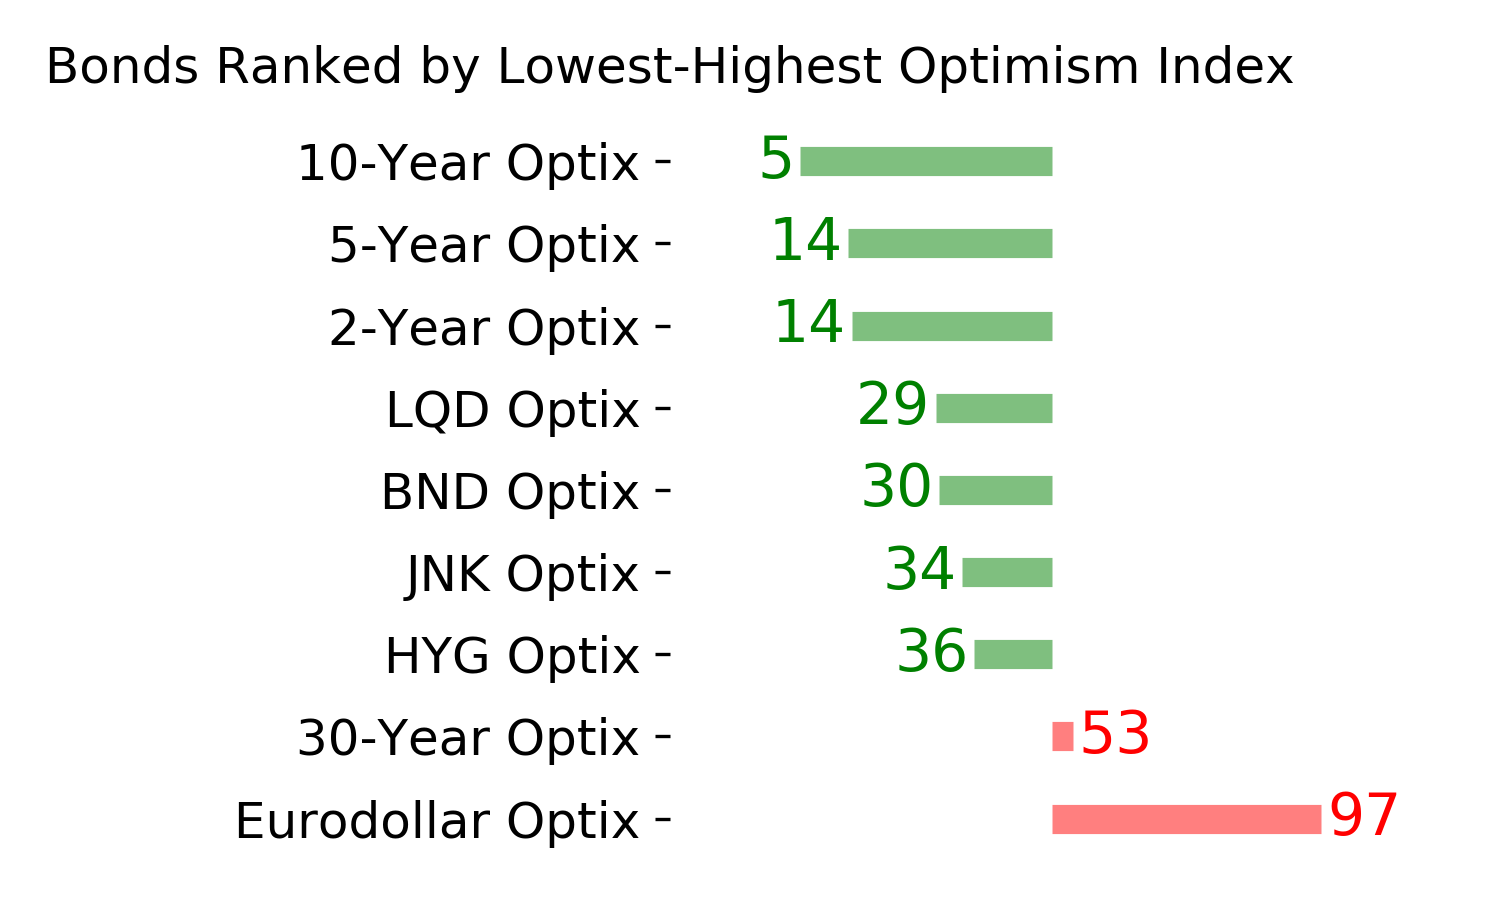
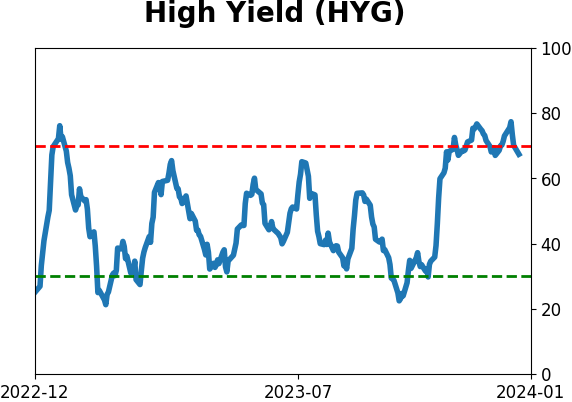
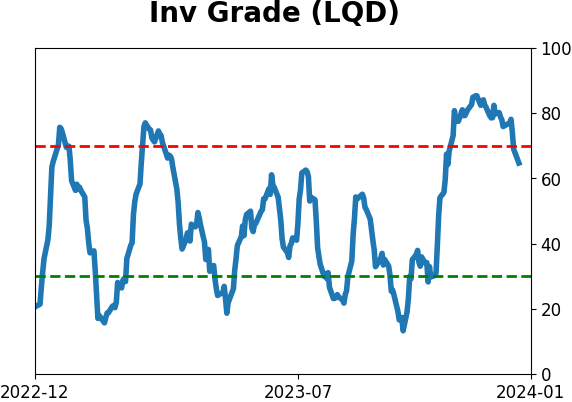
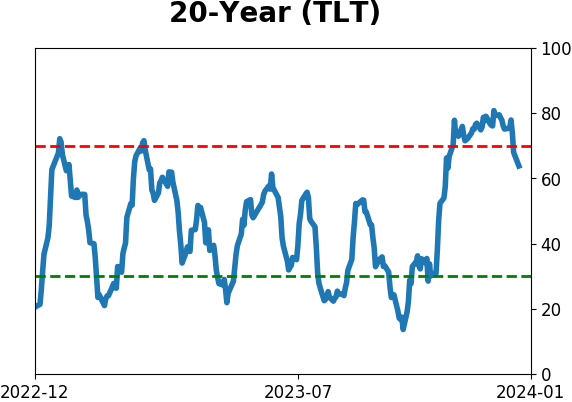
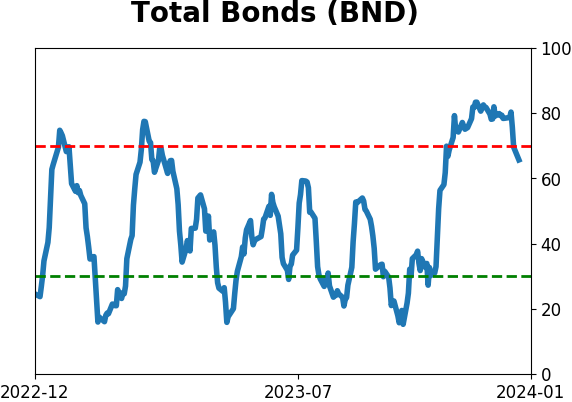
Bond ETF's - 10-Day Moving Average
|
|
|
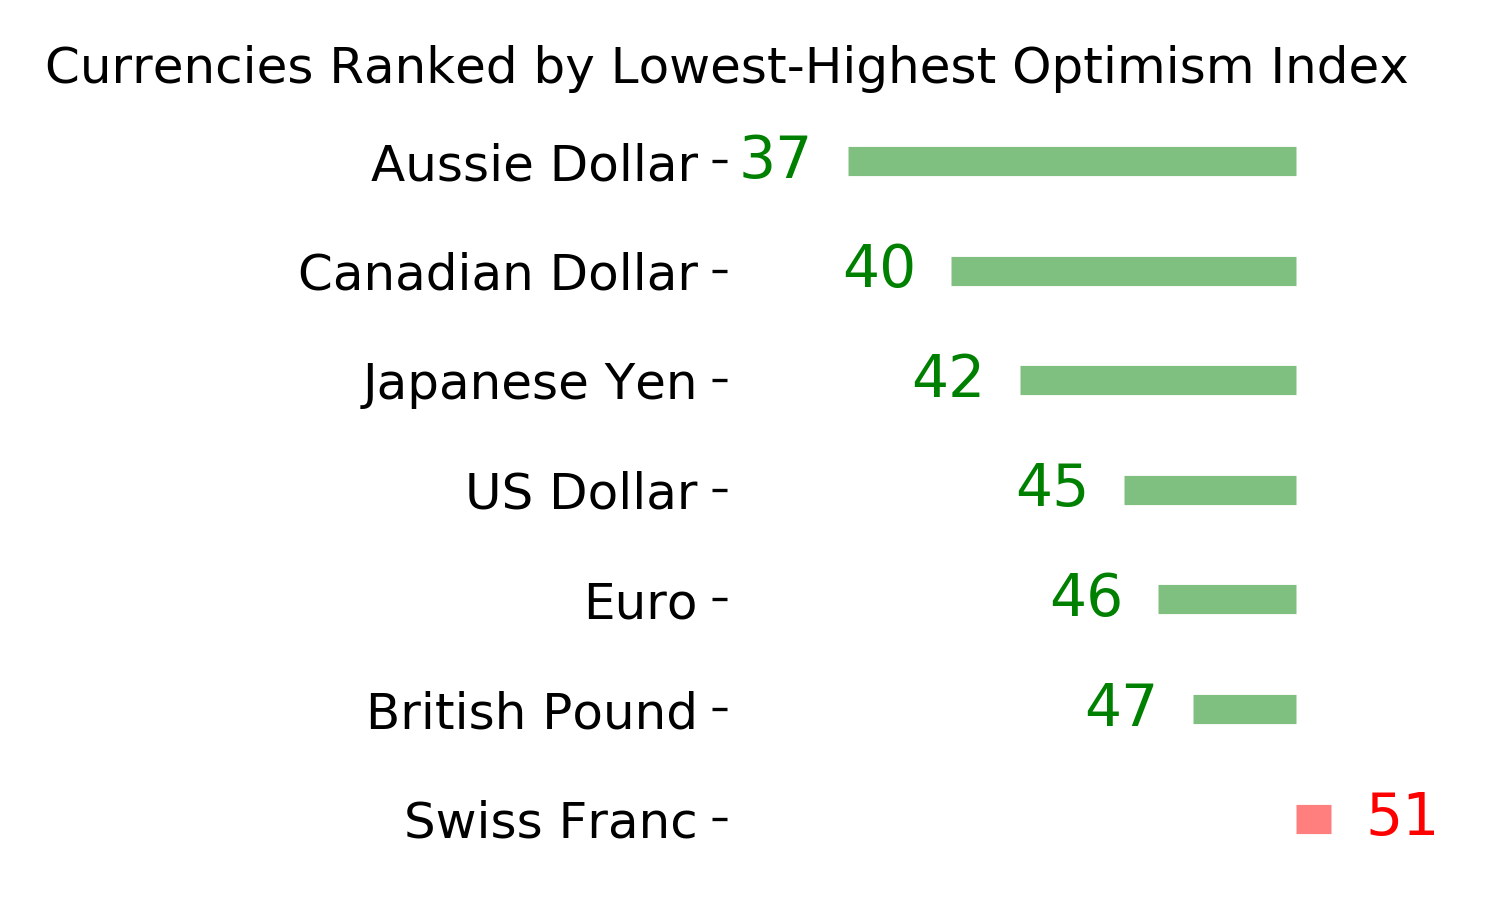
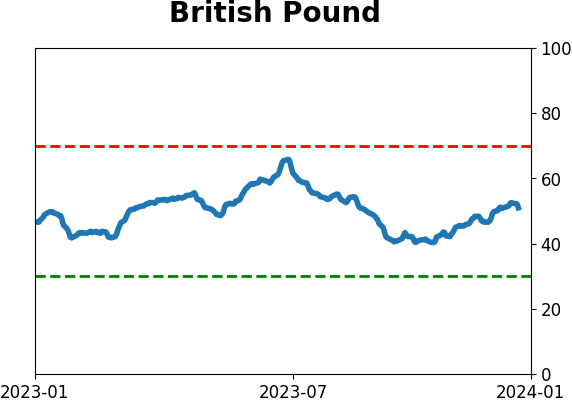
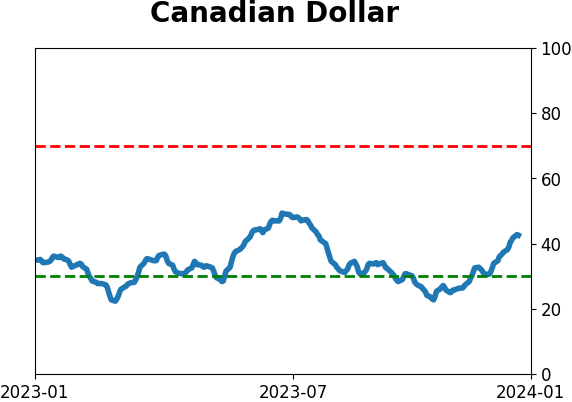
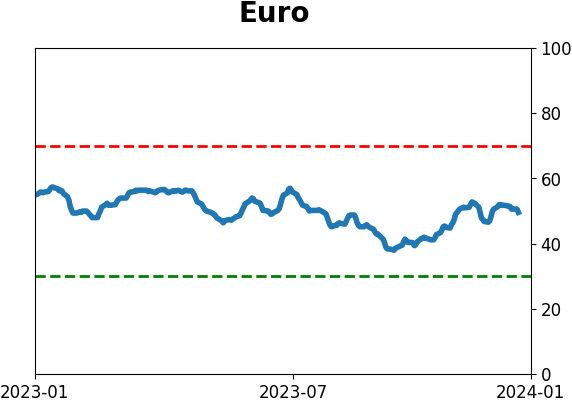
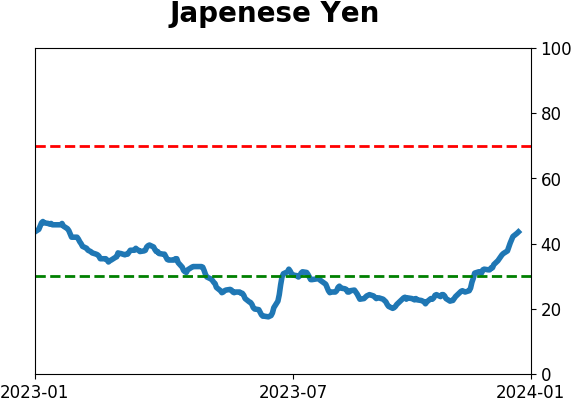
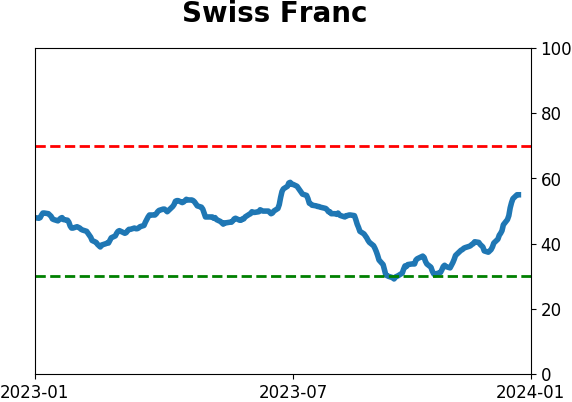
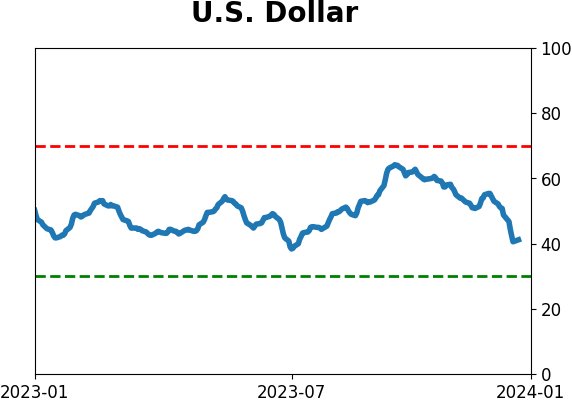
Currency ETF's - 5-Day Moving Average
|
|
|
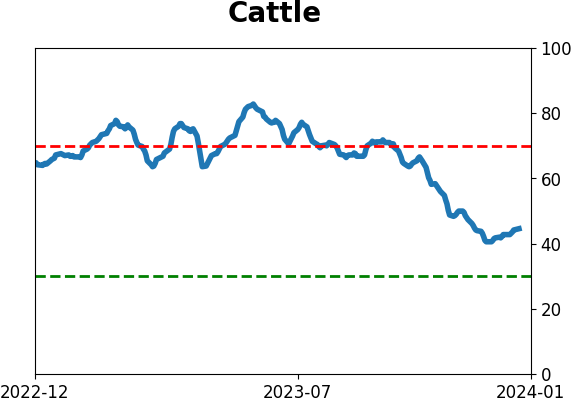
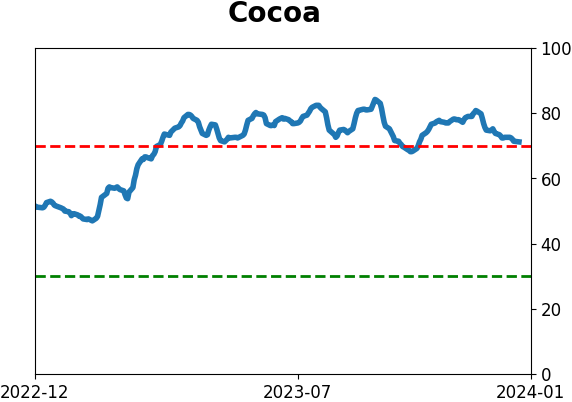
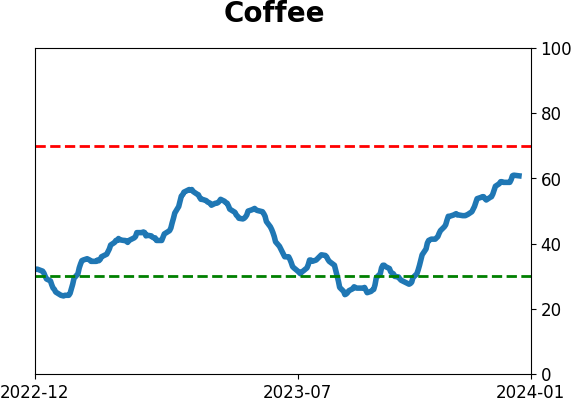
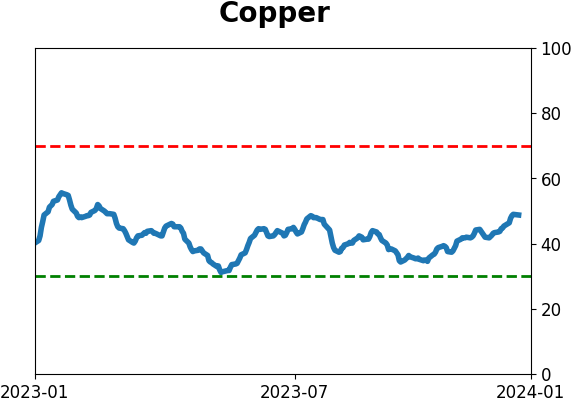
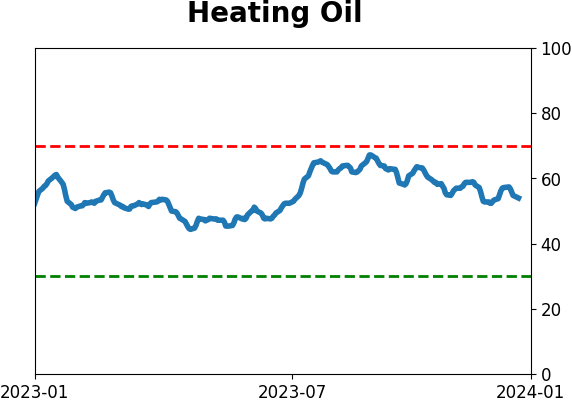
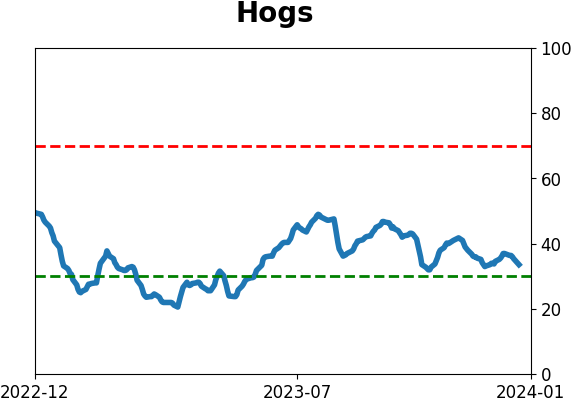
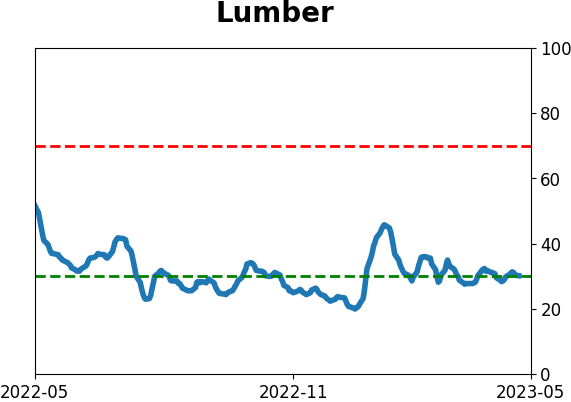
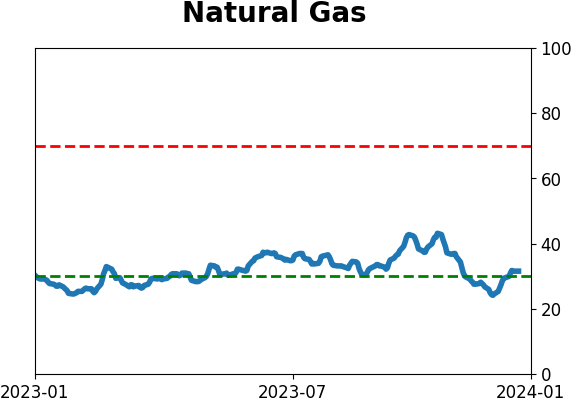
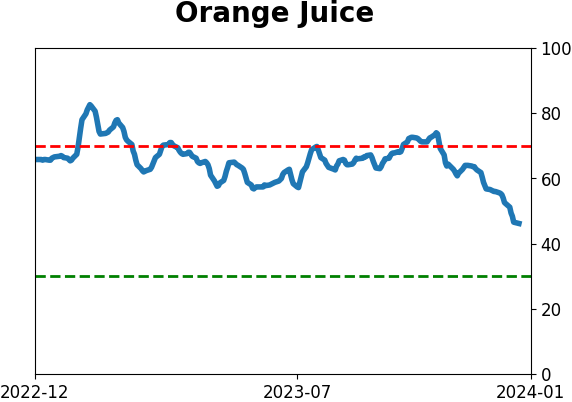
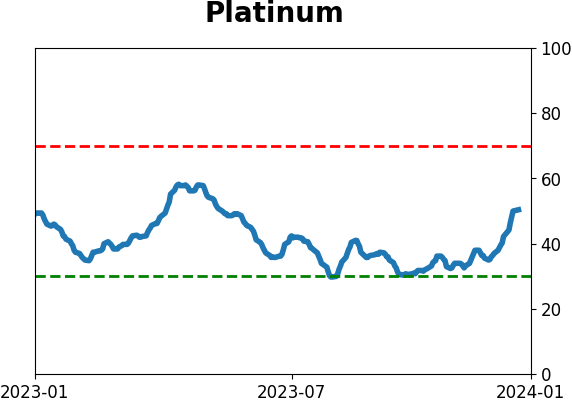
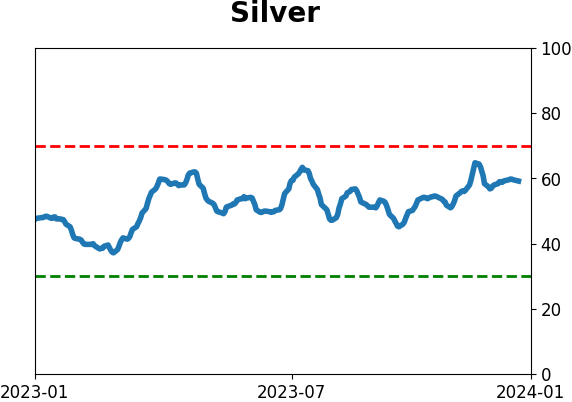
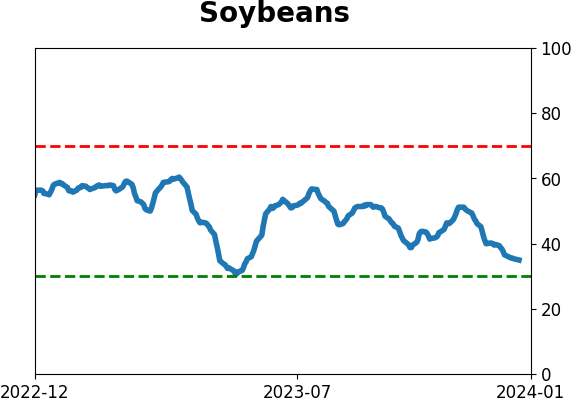
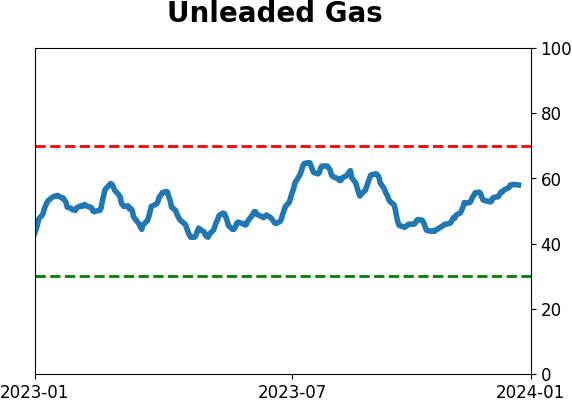
Commodity ETF's - 5-Day Moving Average
|
|