
Cyclical stocks dominate the new highs list

Key points:
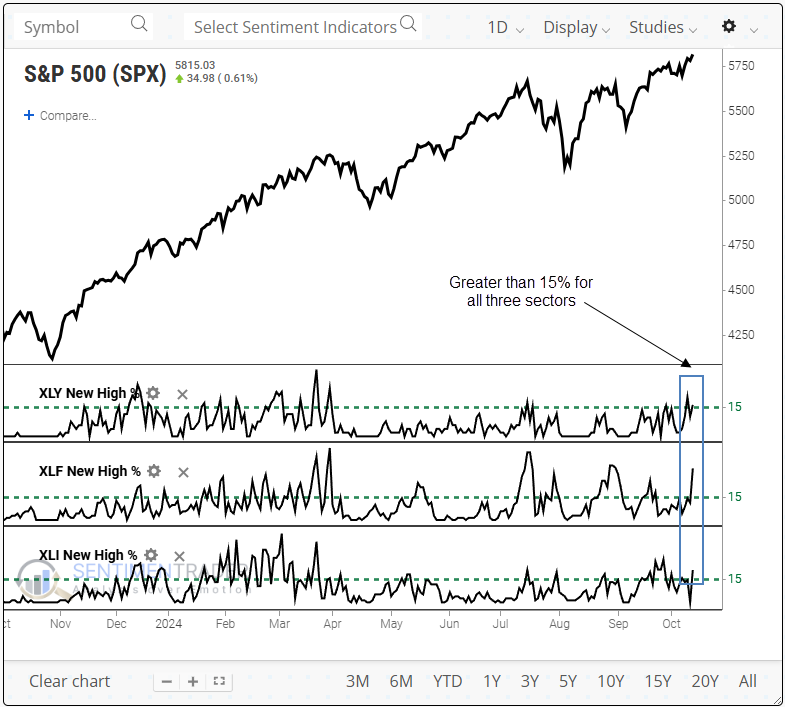
- Over 15% of S&P 500 Discretionary, Financial, and Industrial stocks registered a 52-week high
- Similar expansions in highs produced solid returns and consistency for the S&P 500 over long-term horizons
- A bear market peak has never materialized when cyclical sector 52-week highs reach current levels
A bullish market message from economically sensitive stocks
Cyclical-oriented stocks, which are sensitive to economic shifts, continue to exhibit bullish market breadth profiles, indicating that investors are confident in economic growth prospects.
Last Friday, the S&P 500 closed at a new record high, and cyclical stocks dominated the 52-week highs list. For only the 31st time since 1954, over 15% of stocks in the Consumer Discretionary, Financial, and Industrial sectors hit new highs simultaneously.
Although the last instance aligned with a short-term peak in the S&P 500, markets rarely establish a significant top when the 52-week highs list expands as it is now, especially when led by cyclicals.
Given that 52-week highs simultaneously exceeded 15% for the first time in over two months, I required two months to pass before a new signal could trigger again.
Similar expansions in 52-week highs from cyclical stocks suggest the uptrend is sustainable
Whenever more than 15% of stocks in the Consumer Discretionary, Financial, and Industrial sectors hit a 52-week high, with the S&P 500 closing at a 5-year high, the world's most benchmarked index delivered robust returns and consistency, particularly over six and twelve months.
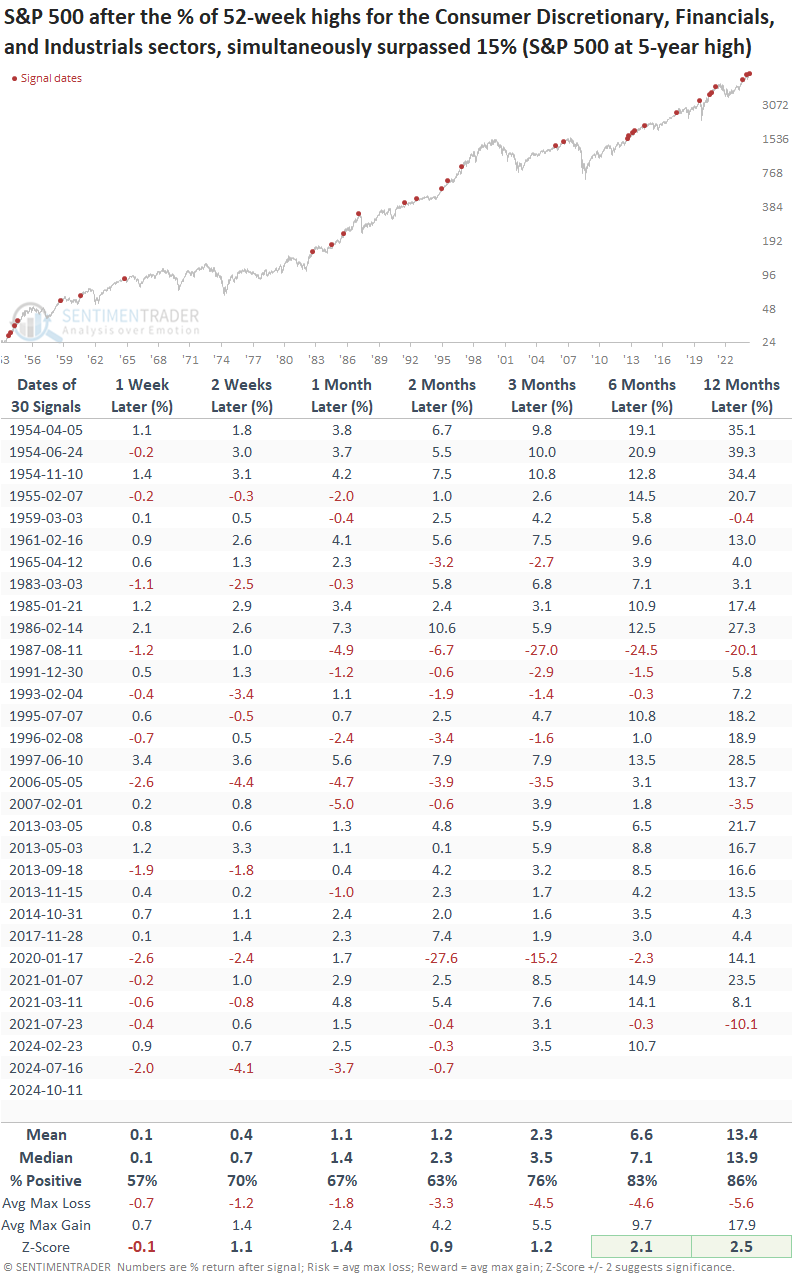
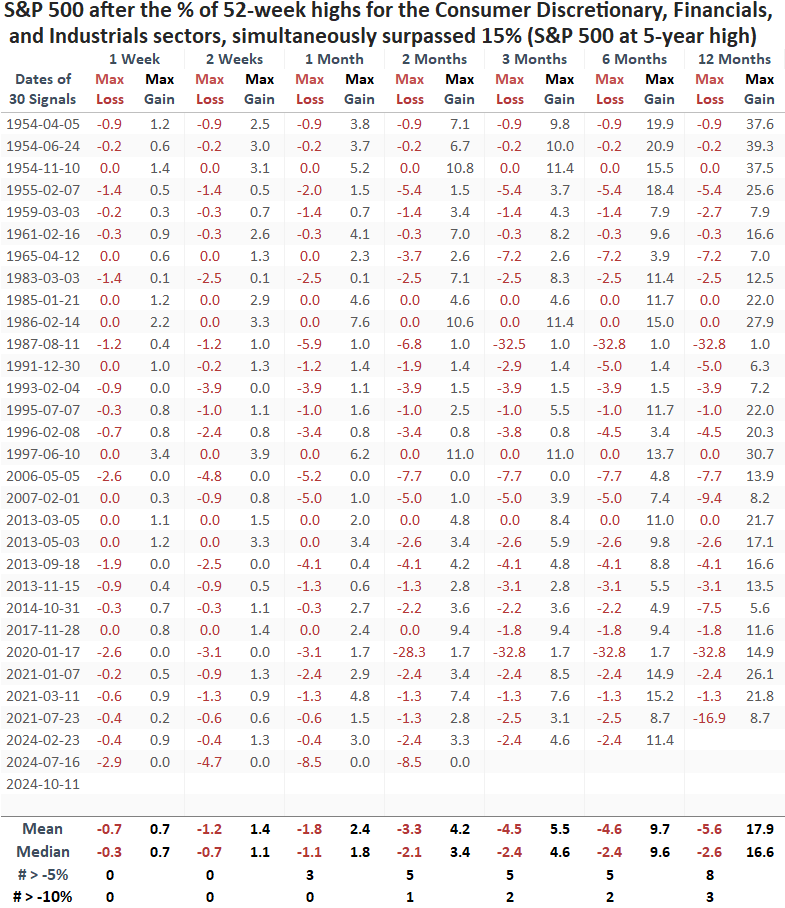
Over the subsequent year, the S&P 500 experienced just three instances of a maximum loss exceeding 10%, two of which were tied to rare, crash-related market events.
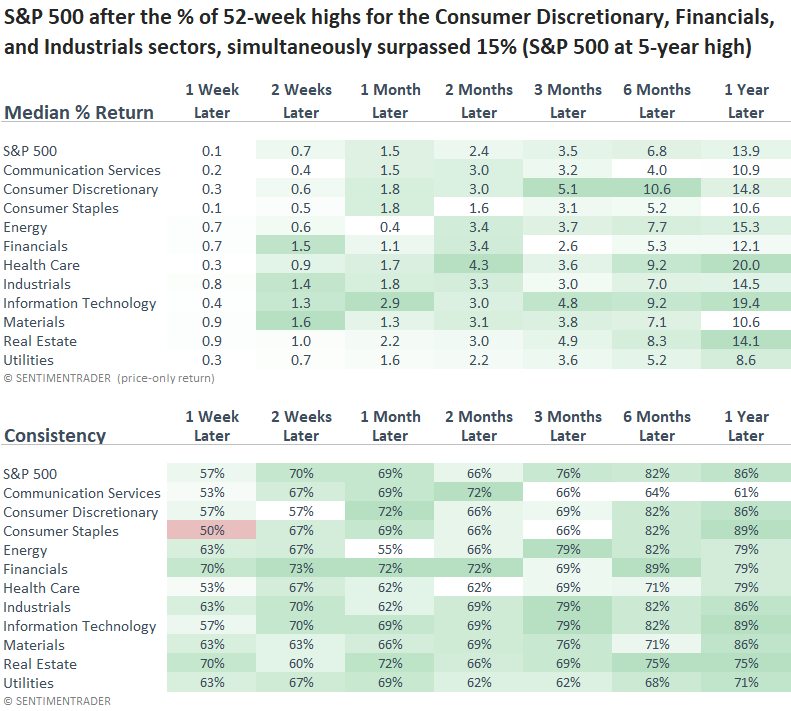
In the months that followed, Consumer Discretionary, Financial, and Industrial stocks generally outperformed the broader market. However, six to twelve months later, Discretionary and Industrial stocks sustained their lead, with Financial stocks falling behind.
Technology, another cyclical group, outperformed the S&P 500 across all time frames.
Historical perspective
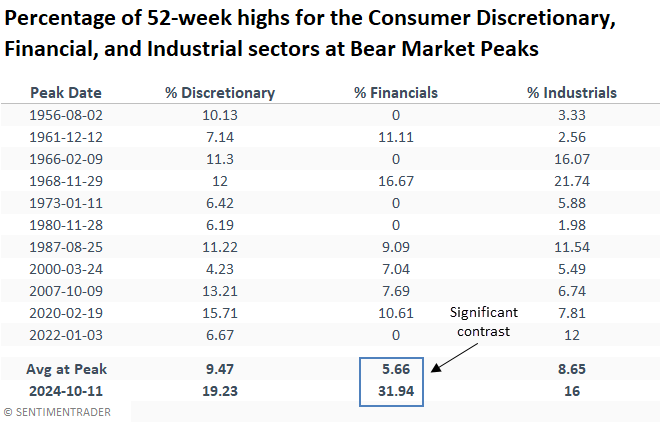
As the table below illustrates, when the S&P 500 achieves a bear market peak, the percentage of cyclical stocks recording a 52-week high has typically dwindled to only a handful of issues. In contrast, Friday's readings are well above the historical averages seen at such peaks.
The new highs list
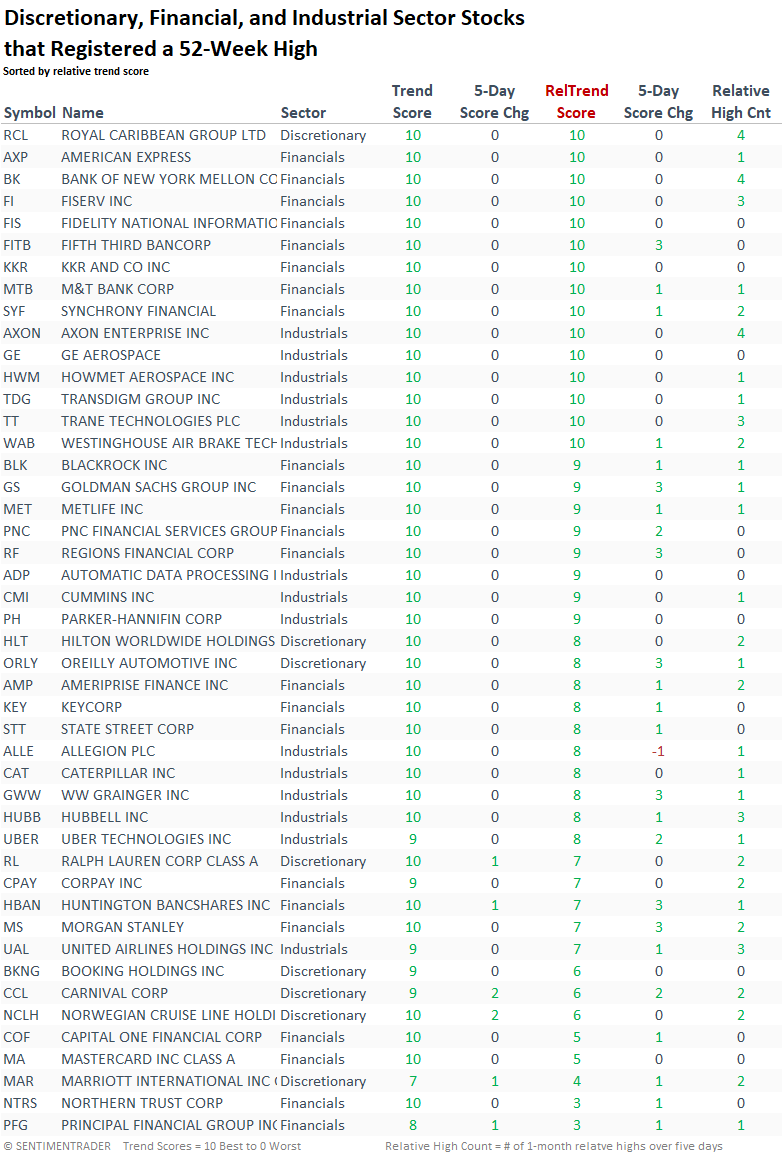
The following table lists each stock in the Consumer Discretionary, Financial, and Industrial sectors that reached a 52-week high last Friday, along with its absolute and relative trend scores. All of these stocks have positive scores, with most surpassing a bullish threshold of 8 or higher.
Experiences over things continue to be an overriding theme in the Discretionary sector.
Current sector trend scores
Although the defensive utility sector continues to rank high, it's overbought and typically does not outperform in uptrends. Therefore, I would encourage investors to seek opportunities in more offensive-oriented groups like Financials, Industrials, and Technology, which display favorable trend scores.
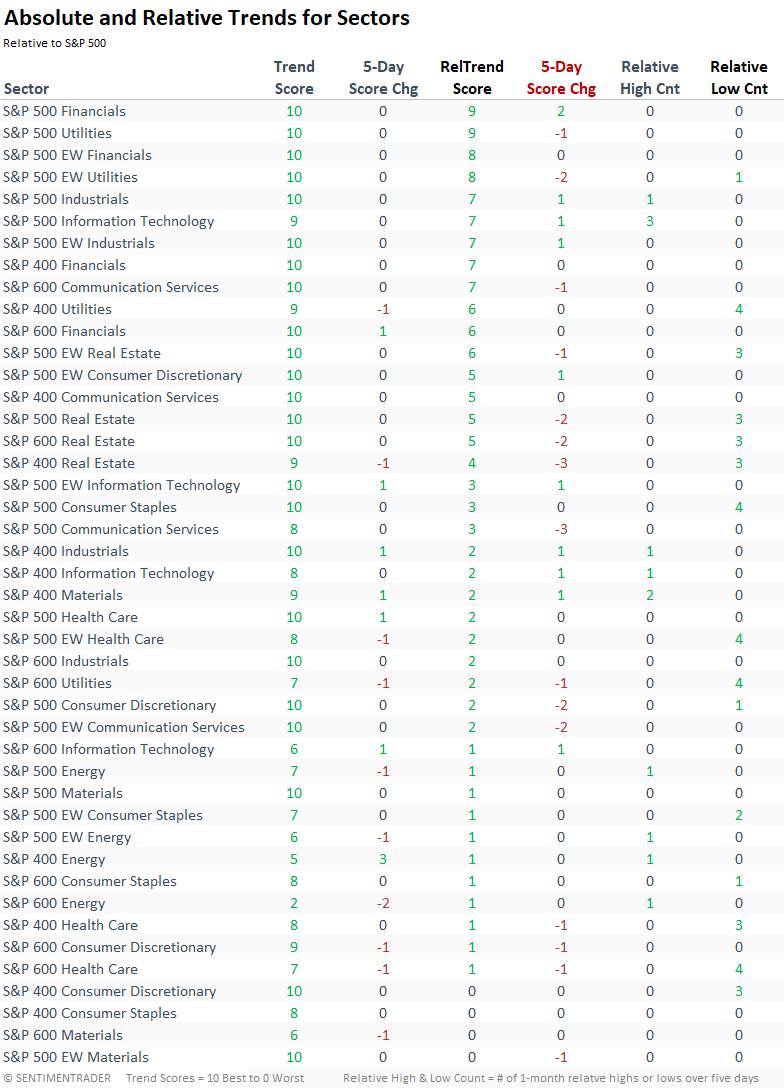
A closer look at individual stocks within each sector reveals that Financials and Industrials boast favorable absolute and relative trend scores, offering ample opportunities for investors.
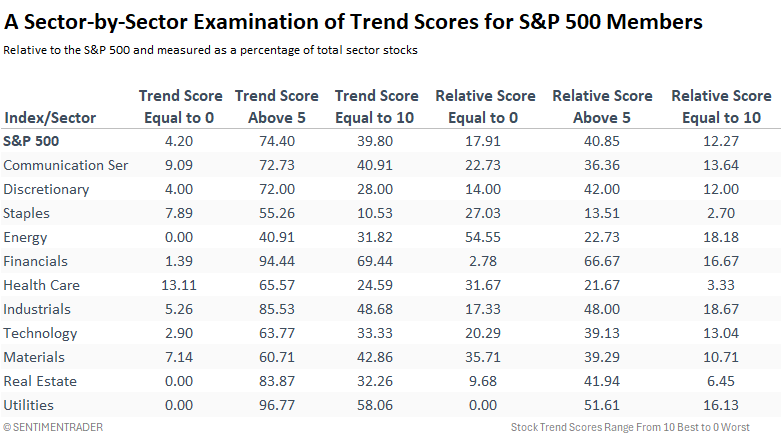
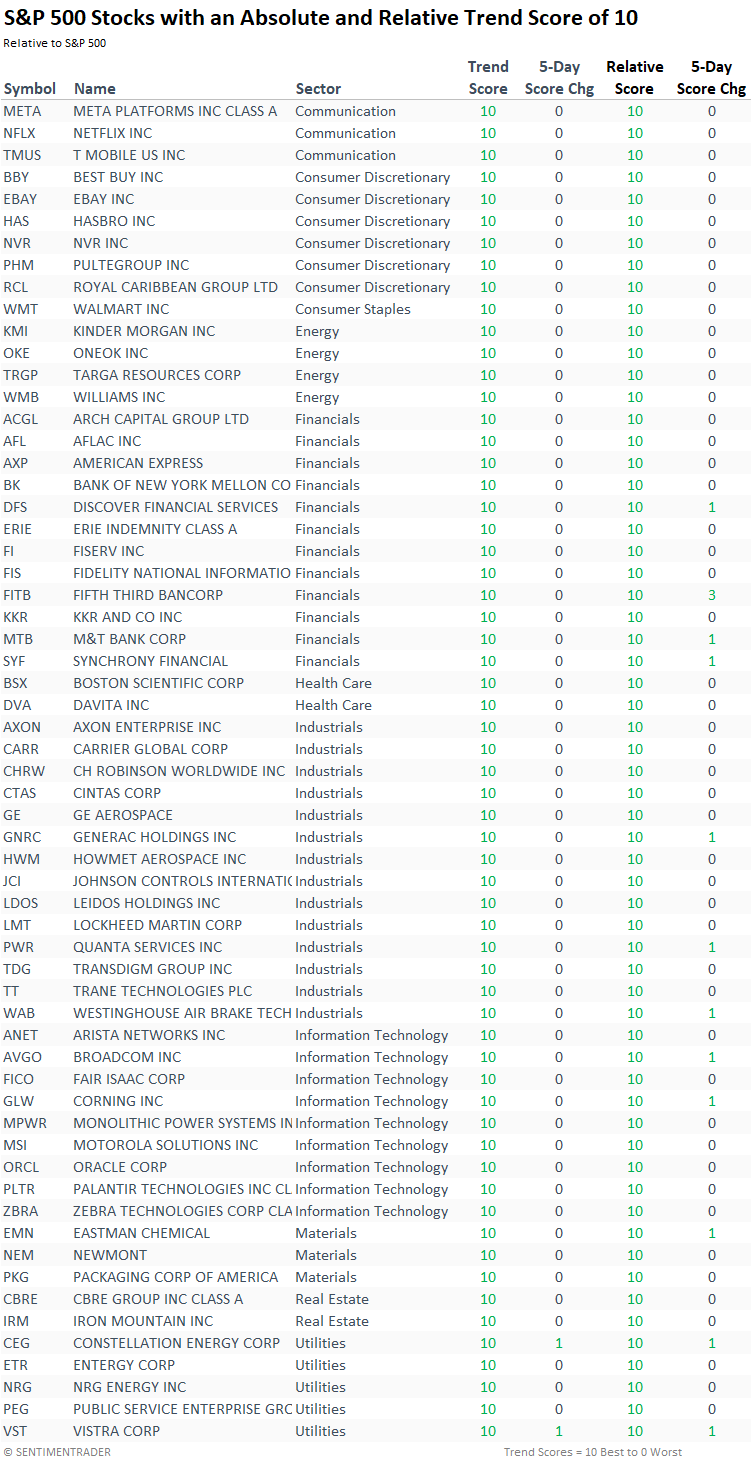
The following table contains all S&P 500 stocks with a perfect absolute and relative trend score of ten. Though cyclical stocks dominate the list, investors adopting a more balanced approach can uncover opportunities in other sectors.
What the research tells us...
Stocks in cyclical-oriented sectors like Consumer Discretionary, Financials, and Industrials dominate the 52-week highs list, signaling offensive market leadership from these economically sensitive groups. This favorable participation is a bullish development for the broader market, as cyclical sectors tend to lead during periods of economic expansion. Historically, the S&P 500 rarely reaches a peak when cyclical sectors are breaking out as they are now, suggesting that the current momentum in these sectors supports the continuation of the market's uptrend.