
Cyclical industries are once again seeing an increase in 52-week highs

Key points:
- More than 35% of cyclical sub-industry groups closed at a 52-week, with the S&P 500 recording a new high
- Similar breakouts from cyclical groups preceded an 86% win rate for the S&P 500 over the next six months
- Technology outperformed the world's most benchmarked index across all time horizons over the ensuing year
"The best economist I know is the inside of the stock market." Stanley Druckenmiller
Last week, I highlighted the potential outcome for stocks following other periods when the average 30-year fixed-rate mortgage declined by 95 bps over 52 weeks. Typically, the more favorable rate environment benefited cyclical-oriented groups, especially housing-related ones.
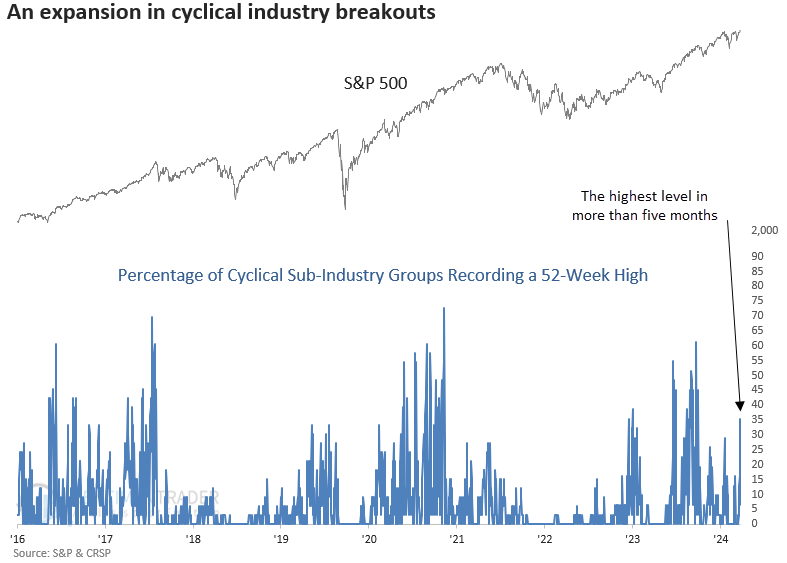
With investors celebrating the first Federal Reserve rate cut following a tightening cycle since 2019, stocks exploded to the upside, producing the highest percentage of 52-week highs from cyclical sub-industry groups in more than five months, with a reading of 35%. This expansion in 52-week highs also coincided with the S&P 500 reaching a new high.
When market breadth indicators like this exhibit bullish characteristics, I always read the Stanley Drunkenmiller quote, especially when calls for a recession grow louder. Then I ask myself: If stocks are teetering on the brink of a bear market or an economic downturn is imminent, would over a third of cyclical industries be recording new 52-week highs?
History suggests otherwise.
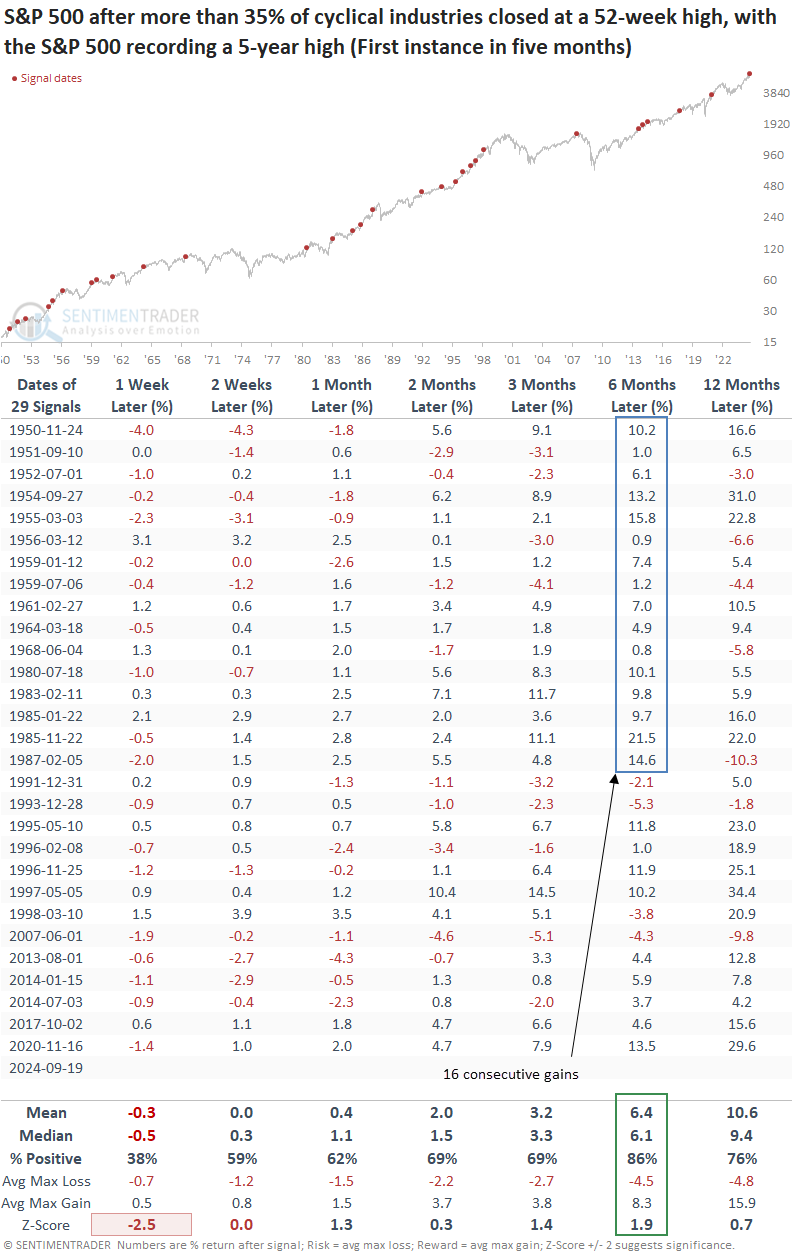
Similar expansions in 52-week highs for cyclical groups preceded positive returns for stocks
Whenever more than 35% of cyclical industries closed at a 52-week high, and the S&P 500 closed at a 5-year high, the world's most benchmarked index was likely to continue trending higher, rising 86% of the time over the subsequent six months. However, one should not rule out a brief pause in the near term, which also aligns with seasonal trends near the end of September, as my colleague Jay Kaeppel pointed out in a recent note.
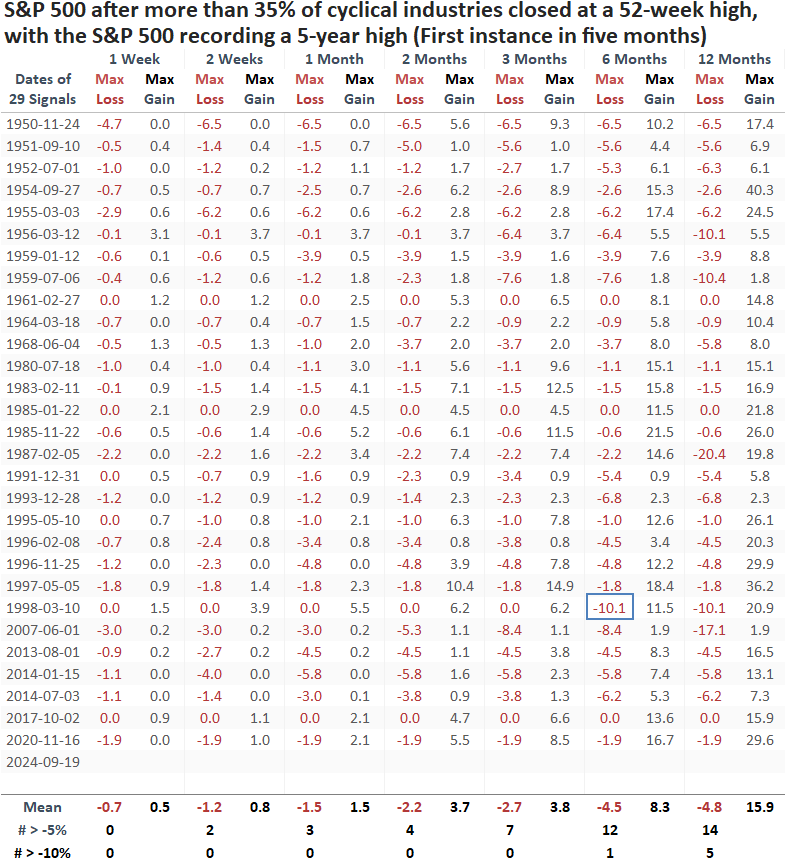
The potential for a short-term pause becomes more apparent when looking at the maximum gain and loss table, where risk overshadowed reward in the following month. This behavior is typical after a breadth surge to record highs, often leading to a buyers' strike. In the subsequent six months, the S&P 500 recorded just one instance of a maximum loss greater than 10%.
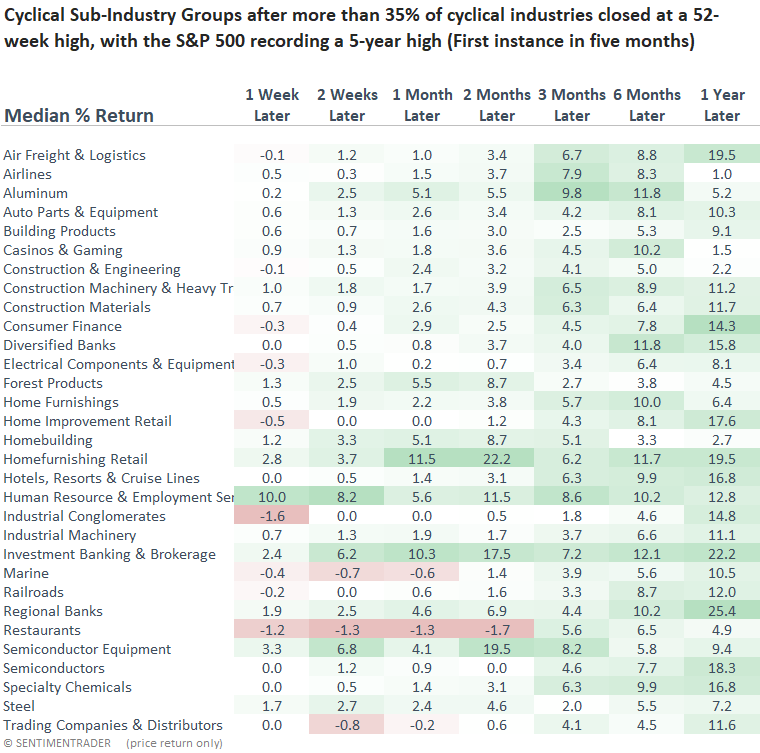
Growth-oriented sectors like Consumer Discretionary, Healthcare, and Technology outperformed the S&P 500 and value groups over most medium to long-term horizons.
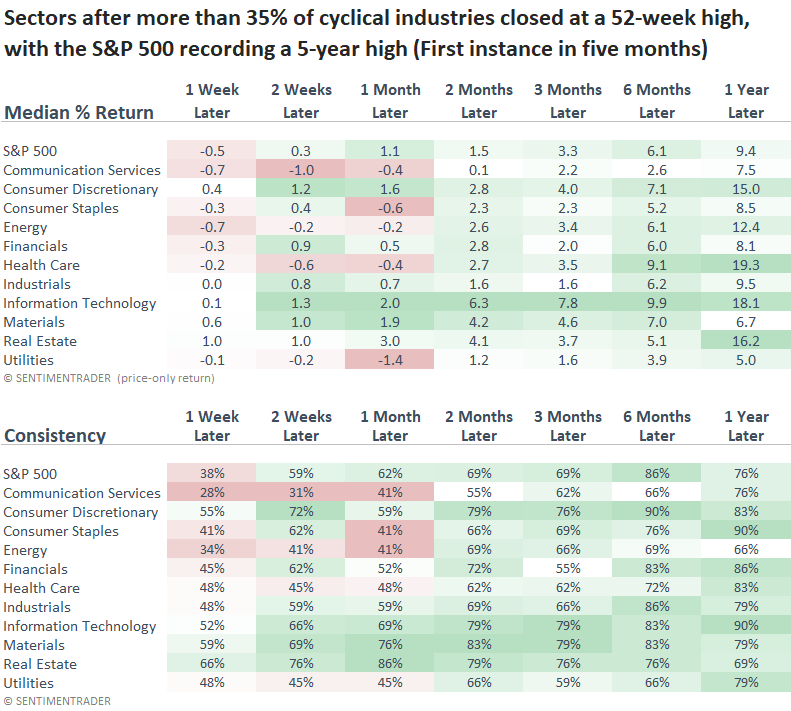
The following outlook table contains the cyclical sub-industry groups used in the 52-week high calculation. As expected, most groups produced excellent returns over the ensuing year.
Current trends
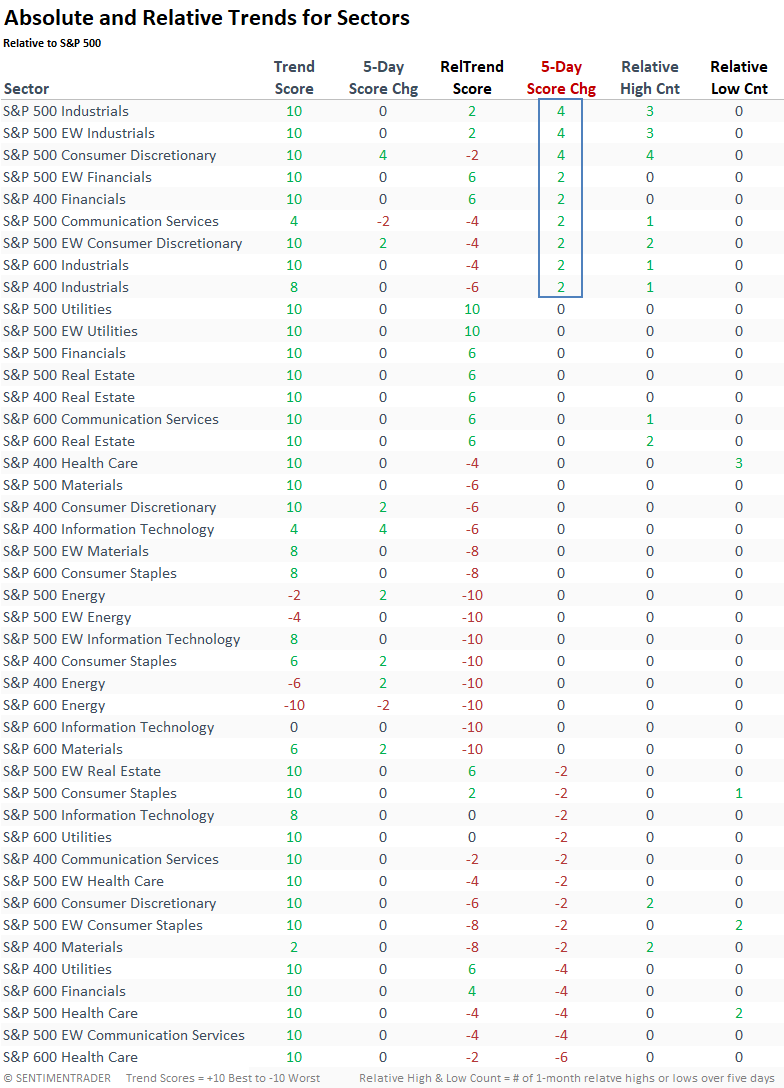
Over the past week, the cap and equal-weighted industrial sectors have seen a 4-point rise in their relative trend scores, pushing them into positive territory. Consequently, investors may find it prudent to monitor this group.
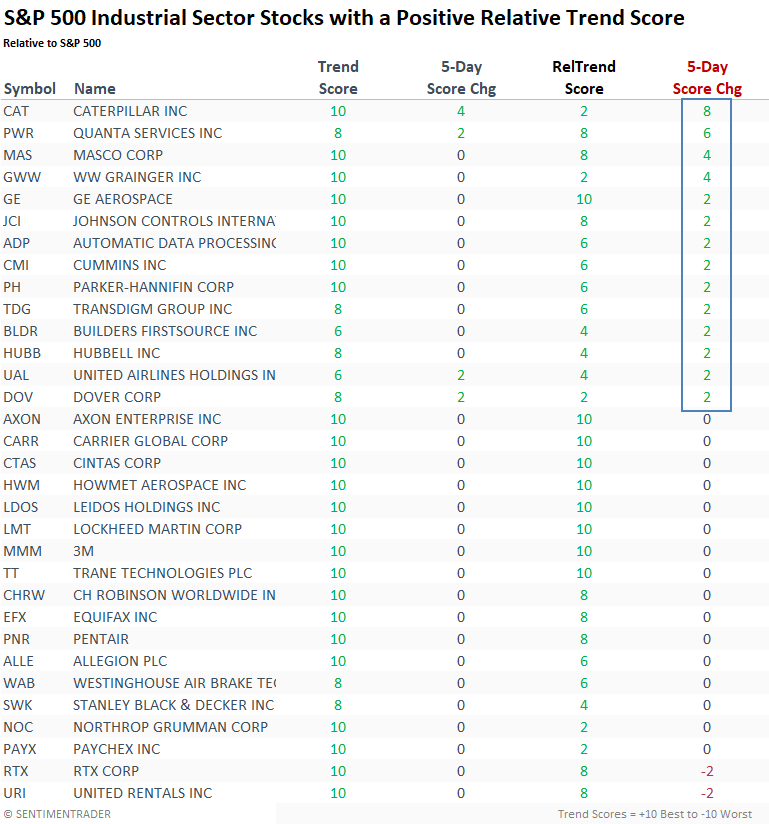
The table below lists all S&P 500 Industrial sector stocks with a positive relative trend score, sorted by their one-week change in score.
Additional context
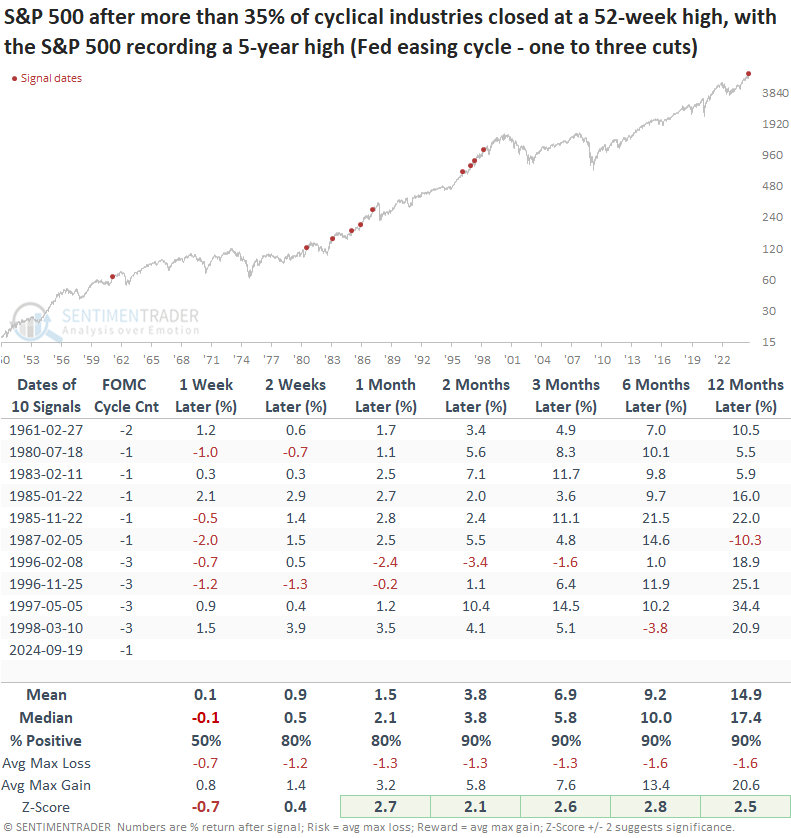
In light of concerns that the Fed is behind the curve in shifting its monetary policy stance, I analyzed when the surge in 52-week highs among cyclical groups coincided with just one Fed rate cut, i.e., at the early stages of an easing cycle. Due to the limited sample size, I increased the Fed easing cycle count to three or fewer occurrences.
When the Federal Reserve lowered its target rate three or fewer times, and the percentage of cyclical groups recording a 52-week high exceeded 35% with all the other previously discussed conditions in place, the S&P 500 exhibited excellent returns and win rates over medium and long-term horizons.
What the research tells us...
With the S&P 500 reaching a new record high last week, over 35% of cyclical industries hit a 52-week high, indicating that market breadth among groups sensitive to economic fluctuations supports the uptrend-a bullish sign. Following comparable breakouts, the S&P 500 rose 86% of the time over six months. Moreover, when this expansion in 52-week highs occurred near the outset of an easing phase by the Federal Reserve, the outlook for the world's most benchmarked index remained bullish. Among sectors, growth-oriented groups outperformed the S&P 500.