Products
SentimenTrader Trading Tools
‍
Backtest Engine
My Trading Toolkit
Correlation Analysis
Seasonality
Market Prediction
Indicators & Data API
‍
Proprietary Indicators & Charts
Market Data API
Strategies & Scanner
‍
50+ Trading Strategies
Smart Stock Scanner
Smart Option Scanner
Research Reports
‍
Research Solutions
Reports Library
Free Resources
Simple Backtest Calculator
Simple Seasonality Calculator
The Kelly Criterion Calculator
Sentiment Geo Map
Public Research Reports
Education
Sentiment Indicators
Technical Indicators
Pricing
Company
About
In the News
Testimonials
Client Success Stories
Contact
Log inLoginSign up
< BACK TO ALL REPORTS

Cyclical growth stocks descend into bear market territory

Dean Christians
2025-03-11
A significant number of stocks in the Technology and Consumer Discretionary sectors transitioned into bear markets. Similar precedents suggest the S&P 500 could struggle over the subsequent six months. Furthermore, traders should not rule out a bullish to bearish trend change in the world's most benchmarked index as several signals aligned with meaningful market peaks.

Key points:

  • 50% of Technology and Consumer Discretionary stocks have entered a bear market
  • Similar precedents near a high suggest the S&P 500 could struggle over the subsequent six months
  • Technology and Consumer Discretionary underperformed the broad market over a medium-term horizon

An uptick in growth stocks falling into bear market territory suggests more downside risk

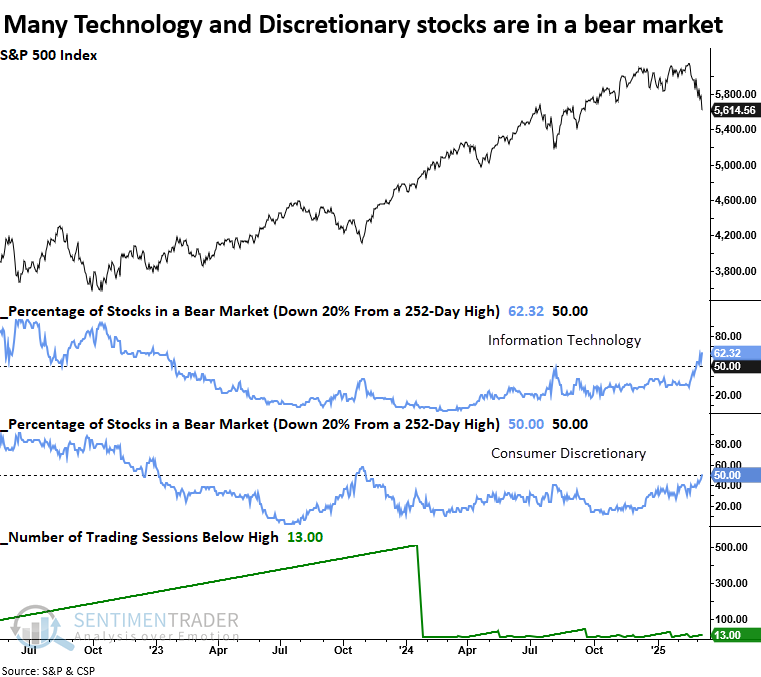
Stock market pressure intensified on Monday as key indexes and sectors dropped between -2.7% and -4.25%, pushing more stocks into bear market territory - defined as a 20% decline from a 252-day high.

S&P 500 Technology and Consumer Discretionary, two critical growth-oriented sectors, now show 50% or more of their respective stocks in a bear market. Considering the S&P 500 is only 13 sessions from an all-time high, this is an alarming scenario.

The last signal appeared in January 2022, and although the S&P 500 rallied briefly, we all remember how that played out over the next nine months.

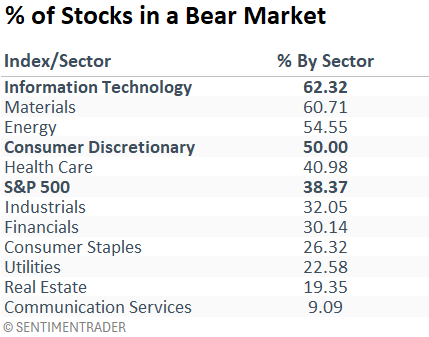
Technology holds the highest concentration of stocks in a bear market, while Consumer Discretionary ranks the fourth weakest. As expected, defensive sectors like Staples and Utilities have among the lowest levels of stocks in a bear phase. 

Comparable market breadth conditions indicate stocks may face headwinds 

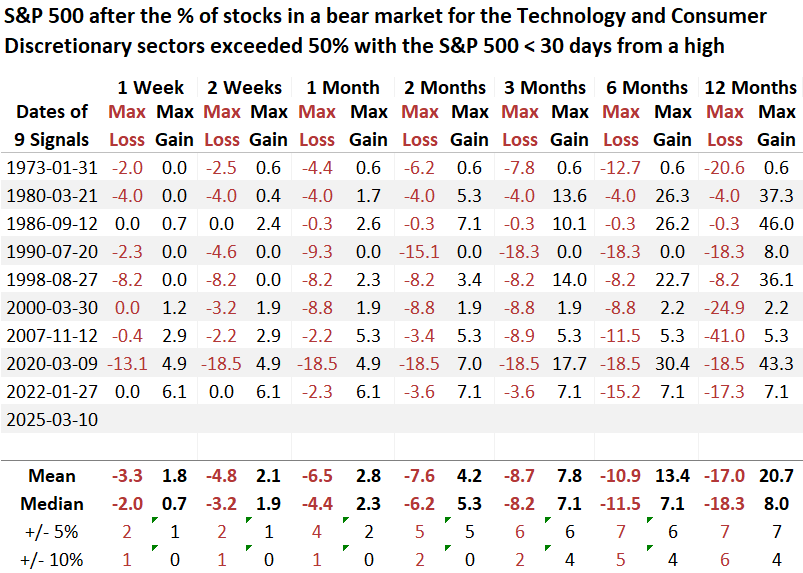
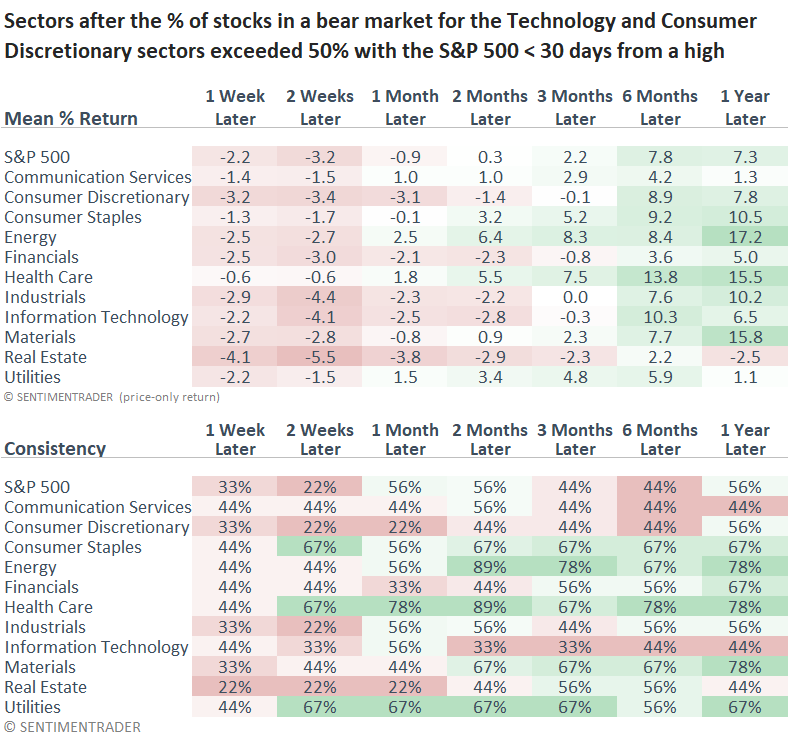
When 50% or more of stocks in the Technology and Consumer Discretionary sectors closed in bear market territory with the S&P 500 within 30 sessions or fewer from a multi-year high, the world's most benchmarked index exhibited unfavorable win rates and returns over the following six months.

At some point over the six-month horizon, the S&P 500 was lower in all but one case. Furthermore, six out of nine instances were associated with a significant market top.

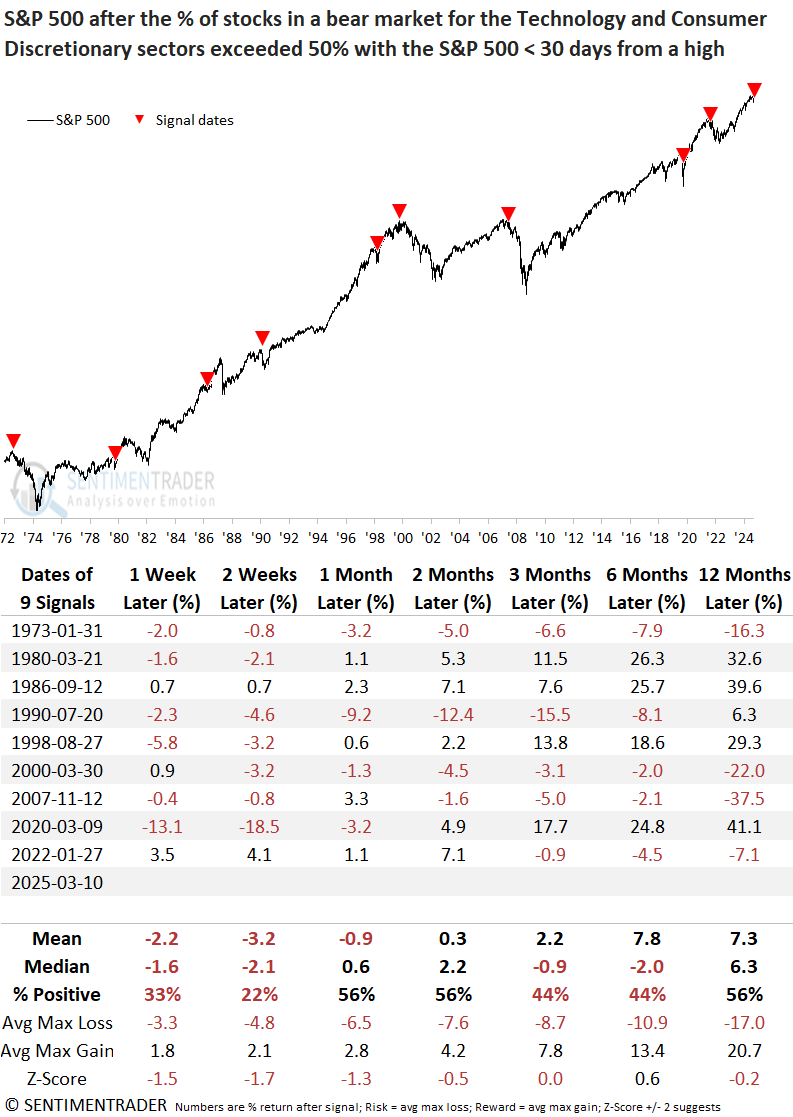
The 1980 and 1986 signals occurred near a market low, but in the other cases, the S&P 500 fell by 8% or more over the subsequent six months. 

Technology and Consumer Discretionary lagged the S&P 500 in five out of seven horizons, with the bulk of the relative weakness concentrated in the first three months. 

More evidence of a rotation away from growth

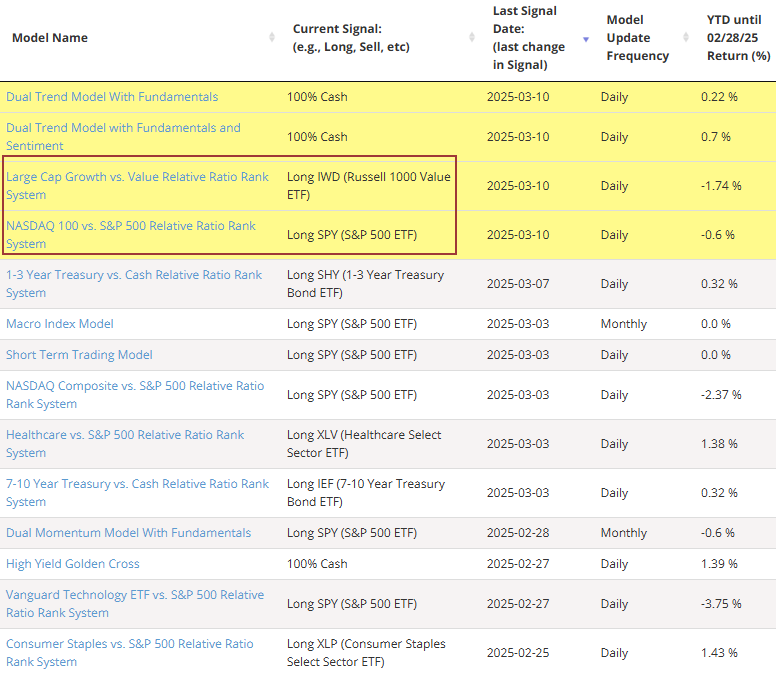
The relative strength timing systems on the website's strategies page exited more growth-oriented ETFs on Monday.

What the research tells us...

Two of the most pivotal growth sectors, Technology and Consumer Discretionary, have seen a significant portion of their stocks enter bear market territory even though the S&P 500 recently achieved a record high. Similar precedents suggest the world's most benchmarked index could see further downside in the next six months. Additionally, given that several of these signals occurred alongside notable market peaks, investors would be wise not to dismiss the possibility that this warning points to a more serious downturn than a garden variety correction. Even with a high percentage of stocks down 20% or more, the Technology and Consumer Discretionary sectors tended to underperform relative to the broader market. 

PRODUCTS
SentimenTrader
Trading Tools
Indicators & Data API
‍
Strategies & Scanner
‍
Research Reports
FREE
RESOUrCES
Simple Backtest
Calculator
Simple Seasonality
Calculator
The Kelly Criterion
Calculator
Sentiment Geo Map
‍
Public Research Reports
‍
Education
Sentiment Indicators
‍
Technical Indicators
‍
Pricing
Bundle pricing
‍
FAQ
‍
Announcements
‍
COMPANY
‍
About
‍
In the News
‍
Testimonials
‍
Client Success Stories
CONTACT
‍
General Inquiries
‍
Media Inquiries
‍
Financial Professionals Inquiries
‍
© 2026 Sundial Capital Research Inc. All rights reserved.
Setsail Marketing
TermsPrivacyAffiliate Program
Risk Disclosure: The information and tools provided are for research and analytical purposes only and are not intended as investment advice. Market analysis involves uncertainty, and outcomes may differ from expectations. Users should conduct their own due diligence and consider their individual circumstances before making any financial decisions. Past performance is not necessarily indicative of future results.

Hypothetical Performance Disclosure: Hypothetical performance results have many inherent limitations, some of which are described below. No representation is being made that any account will or is likely to achieve profits or losses similar to those shown; in fact, there are frequently sharp differences between hypothetical performance results and the actual results subsequently achieved by any particular trading program. One of the limitations of hypothetical performance results is that they are generally prepared with the benefit of hindsight. In addition, hypothetical trading does not involve financial risk, and no hypothetical trading record can completely account for the impact of financial risk of actual trading. for example, the ability to withstand losses or to adhere to a particular trading program in spite of trading losses are material points which can also adversely affect actual trading results. There are numerous other factors related to the markets in general or to the implementation of any specific trading program which cannot be fully accounted for in the preparation of hypothetical performance results and all which can adversely affect trading results.

Testimonial Disclosure: Testimonials appearing on this website may not be representative of other clients or customers and is not a guarantee of future performance or success.