
Cutting through all the noise regarding inflation

Key Points
- The stock market hates uncertainty; few things cause more uncertainty for investors than extreme inflation (or deflation)
- The discussion regarding the current state and future trend of inflation is loud and impassioned
- While inflation can be analyzed six ways to Sunday, a simple objective measure has proven quite helpful over the years
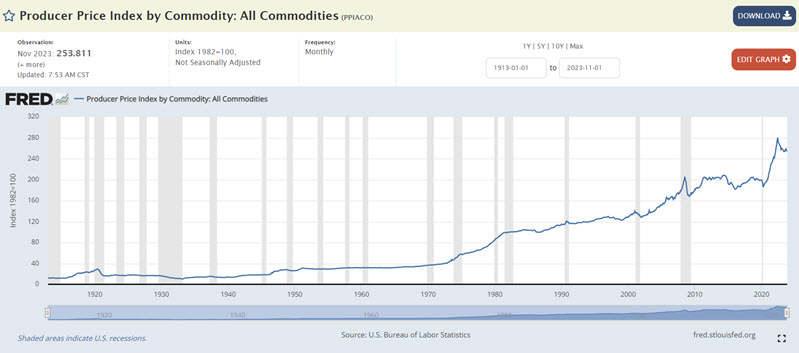
A quick look at the Producer Price Index
What exactly is the Producer Price Index (PPI)? Per Investopedia:
The Producer Price Index (PPI) measures the average change over time in the prices domestic producers receive for their output. It is a measure of inflation at the wholesale level that is compiled from thousands of indexes measuring producer prices by industry and product category. The U.S. Bureau of Labor Statistics (BLS) publishes the index monthly. The PPI is different from the consumer price index (CPI), which measures the changes in the price of goods and services paid by consumers.
The raw monthly data for the Producer Price Index by Commodity: All Commodities is updated monthly by the U.S. Bureau of Labor Statistics and can be found here.
The most relevant information is the 12-month percentage rate-of-change, which can be found here and is displayed in the chart below.
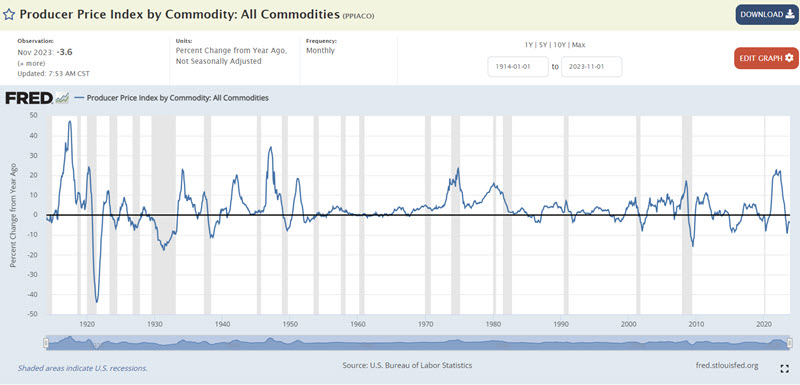
The only time the PPI becomes a problem for the stock market is when it reaches an extreme - i.e., too much inflation or deflation, which can cause chaos with business, government, and individual budgets and, in turn, significant uncertainty.
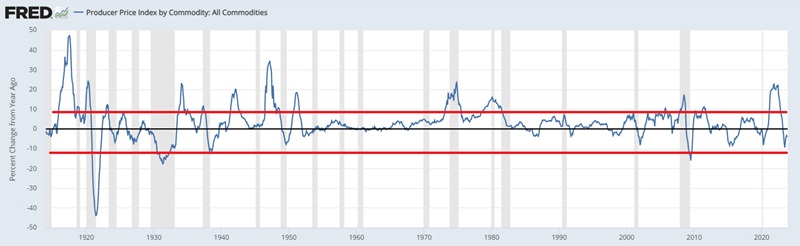
The chart below draws extremes at +9% and -12% based on the 12-month percentage rate of change. Readings above or below the red lines indicate trouble, and between the two red lines indicate "moderate" inflation.
The effects of too much inflation
The chart below displays the growth of $1 invested in the Dow Jones Industrials Average only when the 12-month percentage rate-of-change at the end of the previous month was above +9% since 1914.
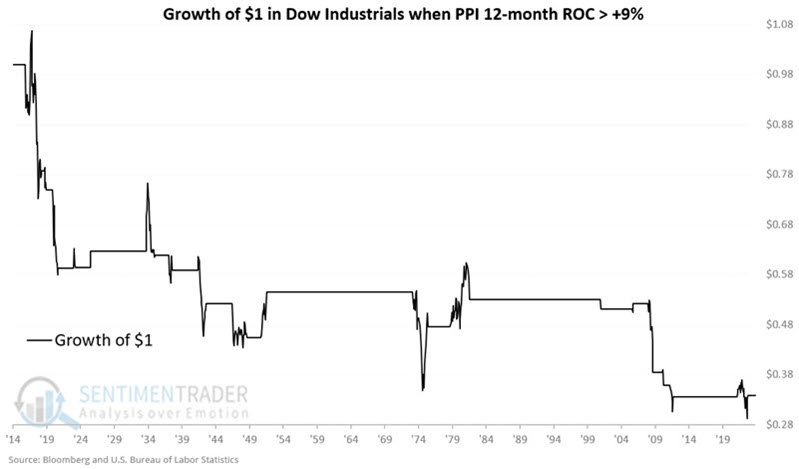
The cumulative result was a loss of -66.1%.
The effects of too much deflation
The chart below displays the growth of $1 invested in the Dow Jones Industrials Average only when the 12-month percentage rate-of-change at the end of the previous month was below -12% since 1914.
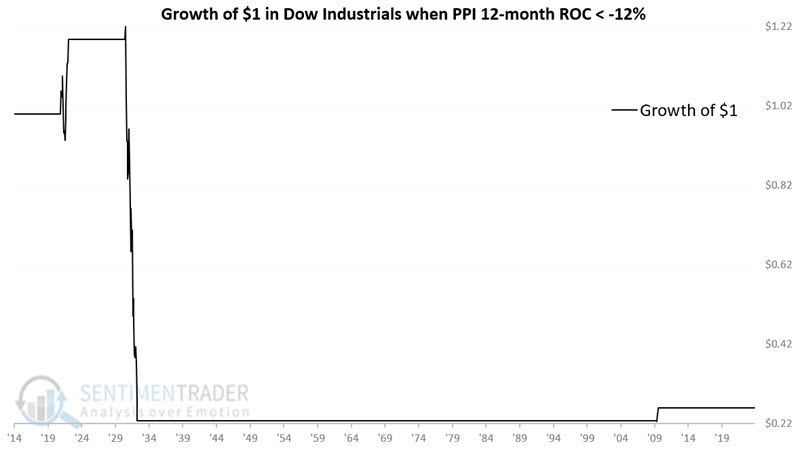
The cumulative result was a loss of -74.1 %.
Stock market performance during any and all extremes
The chart below displays the growth of $1 invested in the Dow Jones Industrials Average only when the 12-month percentage rate-of-change at the end of the previous month was either above +9% OR below -12% since 1914.
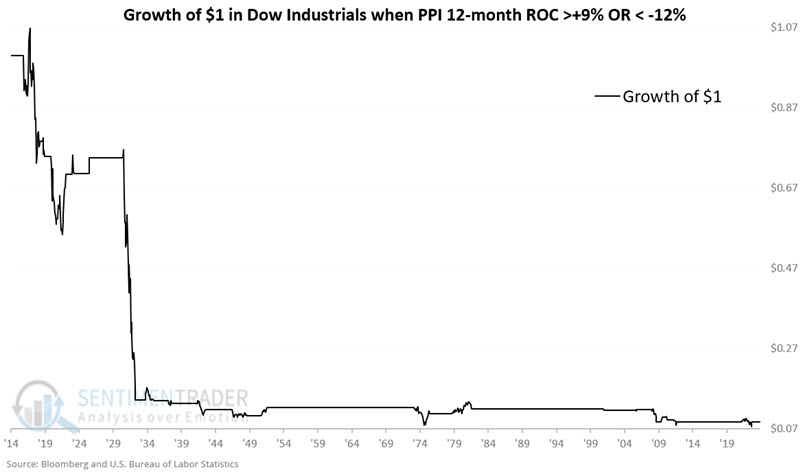
The cumulative result was a loss of -91.2%.
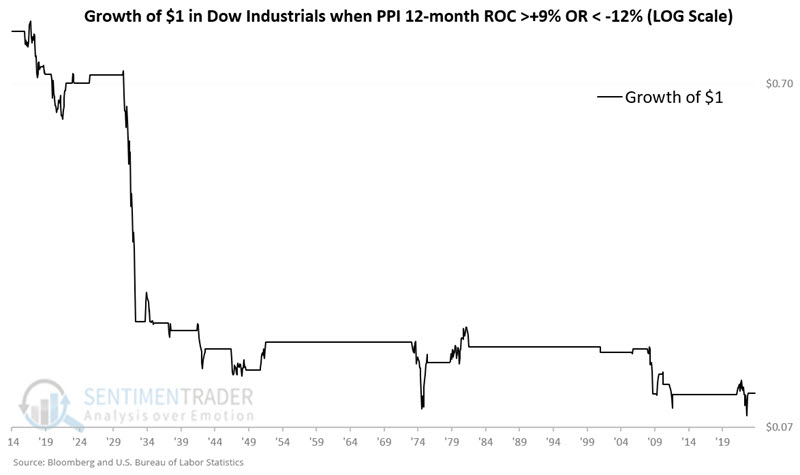
The chart below displays the same results on a logarithmic scale to highlight better and visualize the post-1933 results.
Stock market performance during moderate inflation
The chart below displays (on a logarithmic scale) the growth of $1 invested in the Dow Jones Industrials Average only when the 12-month percentage rate-of-change at the end of the previous month was less than or equal to +9% AND more than or equal to -12% since 1914.
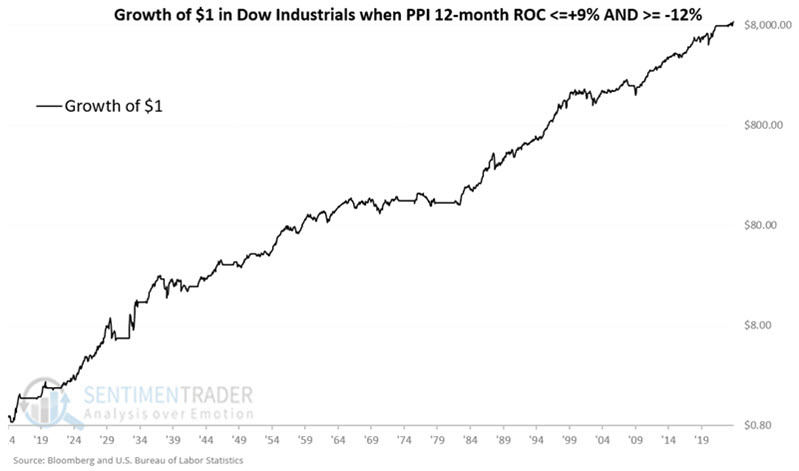
While the stock market does not "always go up" when inflation is moderate (because other factors influence stock price), the results slope nicely from lower left to upper right over time. The cumulative result was a gain of +864,788%.
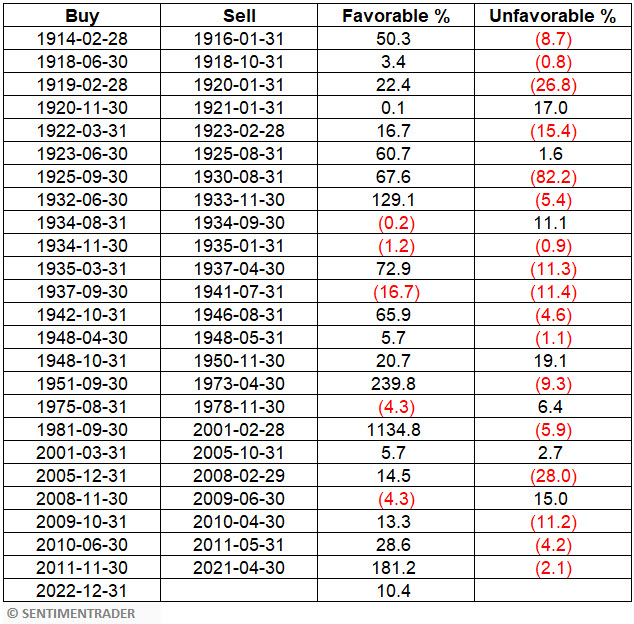
As of the report on 2023-12-14, the current 12-month change for PPI is -3.57%. For the record, this value will be applied at the close of trading for December 2023, and this indicator will be deemed favorable during January 2024.
For the record, this indicator has been favorable since 2022-12-31 (during December 2022, the November 2022 PPI value was published and showed the 12-month rate of change falling from +10.23% to +8.19% - i.e., back below the +9% cutoff between moderate and extreme inflation).
The table below displays the Dow Jones Industrial Average's historical results during favorable and unfavorable periods.
What the research tells us...
Inflation remains a hot topic among the pundit class, and many investors are focusing on the day's narrative. Does the information above mean that the market is sure to rally? Not at all. Many other factors impact the stock market. However, The data above suggests that - despite the deafening noise regarding inflation - investors might do well to focus their attention on other factors.