
Current Status of Market Sentiment Indicators for Materials Sector

Key Points:
- Corporate insider selling volume has dropped to a historic low (reading of 36)
- The Optix sentiment index has broken above 90, and historical backtests show negative short-term returns in the subsequent period.
- 95% of individual stocks are above their 50-day moving average, and fund flows have hit a 12-month high
Corporate Insider Selling Remains at Historic Lows
We have observed that the Corporate Insider Sells index for XLB is at a historically low level.
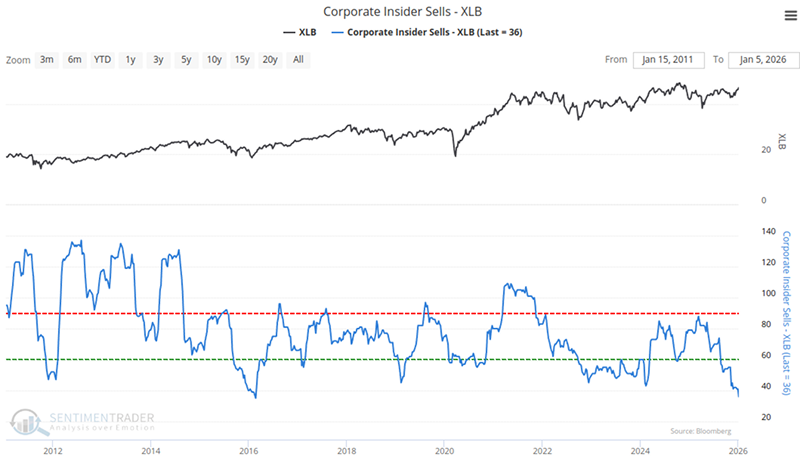
This indicator tracks the selling activities of company executives and directors. Such "reluctance to sell" behavior at high price levels is typically interpreted as insiders' confidence in long-term structural trends.
Short-Term Sentiment Reaches "Extreme Optimism"
Next, we look at the XLB Optix. This index has recently broken through the 90 threshold, entering the "excessive optimism" zone marked by the red dashed line. Historically, this extreme situation has occurred 57 times.
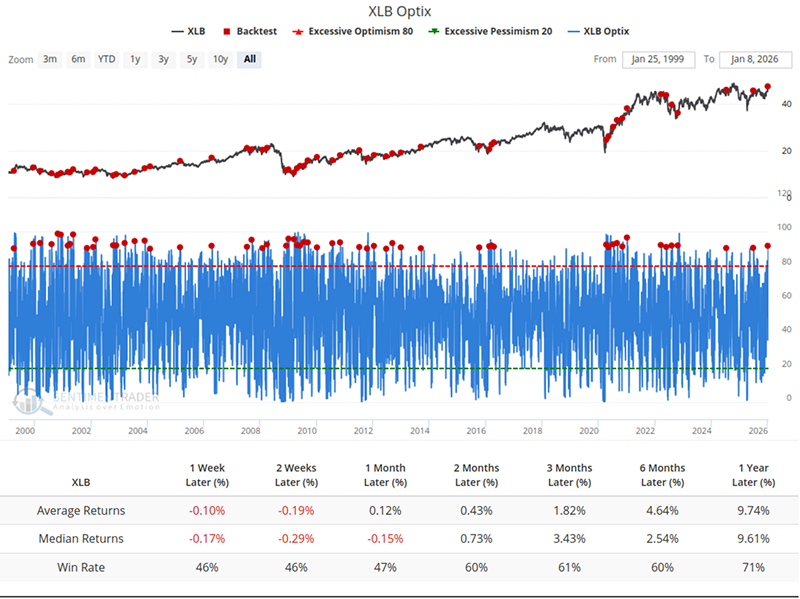
Data shows that one week after this signal is triggered, XLB's average return is -0.1% with a win rate of only 46%. This indicates that market sentiment is in an over-exuberant state at this time.
Market Breadth and Momentum Indicators Are Extremely Stretched
We assess XLB's medium-term market breadth by looking at the proportion of XLB stocks with prices above their 50-day moving average. This figure has recently climbed to a high of approximately 95%, a scenario that has occurred 46 times in history. While such a high level of participation indicates a strong trend, it also means there are almost no laggard stocks left to play catch-up.
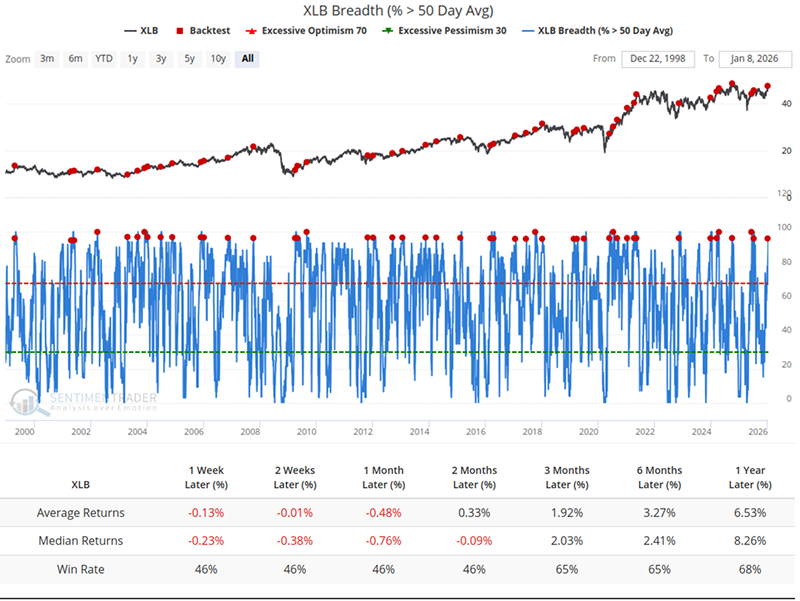
As shown in the chart, one month after the signal appears, the median return is -0.76% and the average return is -0.48%, indicating unoptimistic short-term returns.
Similarly, the 10-day Relative Strength Risk Range (RSRR) shows that over 80% of constituent stocks are in the extremely strong zone. This situation has also occurred 46 times in history.
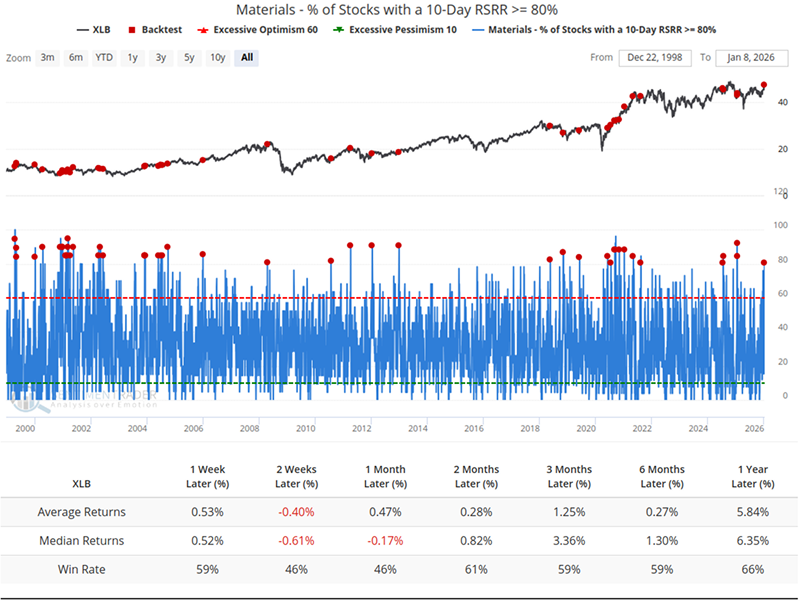
Such extreme consistency in momentum is often unsustainable; data shows that within two weeks of the signal appearing, the median return is -0.61% and the win rate drops to 46%.
Fund Flows and New Highs Indicate FOMO Behavior
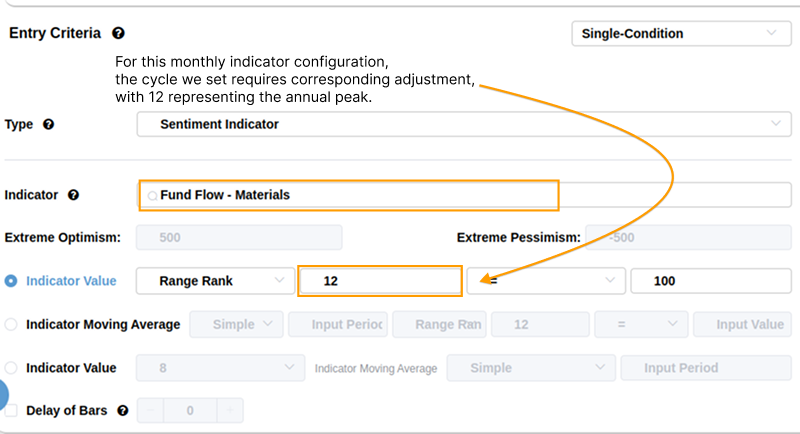
In terms of fund flows, the Fund Flow indicator has hit a 12-month high, a signal that has occurred 28 times in history.Related Backtest Click Here.
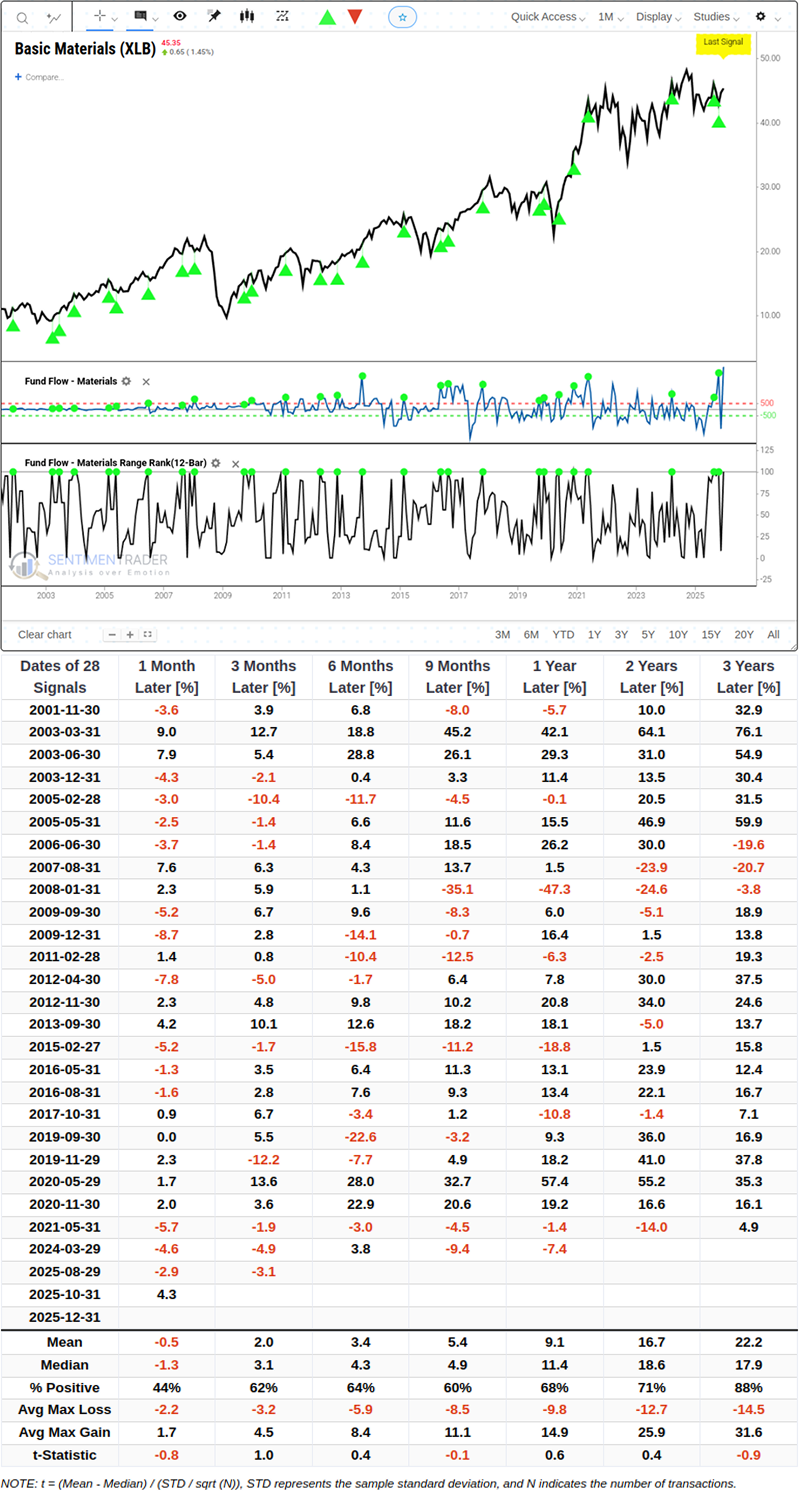
Data shows that in the short term, the rapid influx of capital has not brought immediate positive feedback: one month after the signal is triggered, the median return is -1.3% and the average return is -0.5%. However, over a longer time horizon, the average return after one year is as high as +9.1% with a win rate of 68%.
You can set signal conditions in the BacktestEdge as follows:
At the same time, the proportion of stocks hitting 4-week new highs has broken through 70%. This situation has occurred 45 times in history.
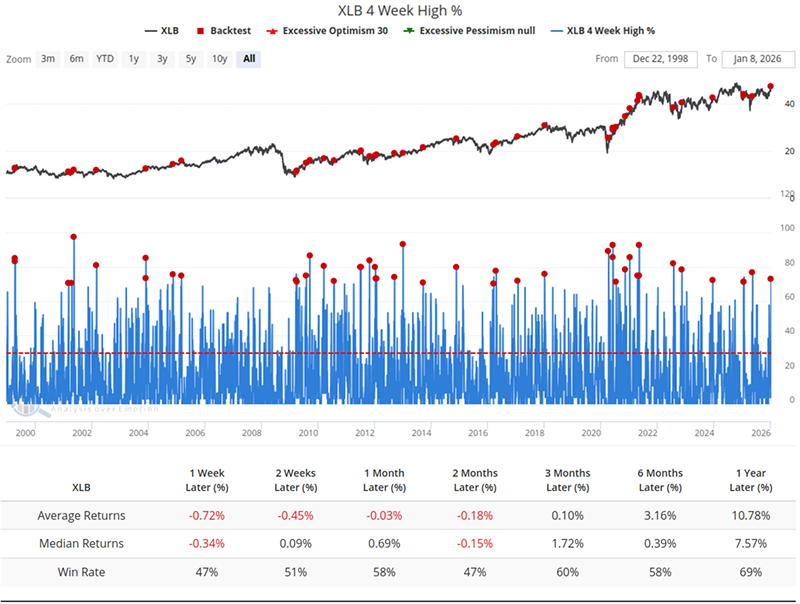
This is one of the signals with the worst short-term risk-reward ratio. Backtests show that in the subsequent week, the average return is -0.72% and the median return is -0.34%. This indicates that entering the market when such a high proportion of stocks hit new highs simultaneously leads to a higher probability of short-term pullbacks.
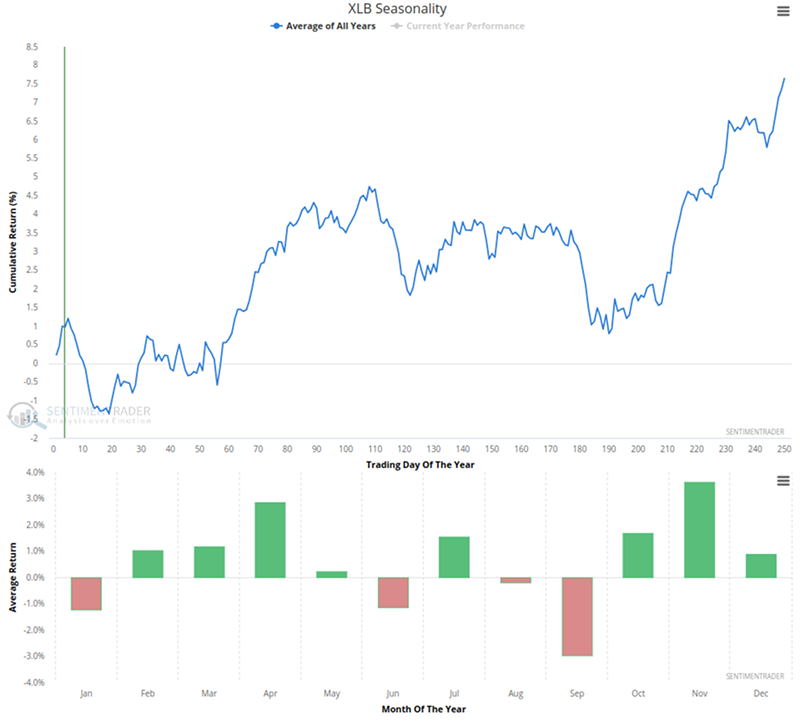
Looking at the seasonal factors for XLB, historical data shows that XLB tends to perform unfavorably in the first month of the year.
What the Research Tells Us...
When we see nearly all stocks in a sector rising together, it is usually a good omen, indicating that the uptrend can continue in the coming months. However, in the Materials sector (XLB), we are now seeing signs of "overextension".
Although these stocks have performed exceptionally well in recent weeks, historical data shows that with sentiment this exuberant and nearly everyone already long, it is difficult for the sharp rally to continue directly in the following weeks-the market usually needs to take a breather. However, long-term returns are generally acceptable, and we have also seen some encouraging signals. For example, even at high price levels, corporate insiders are not in a hurry to sell their shares, which provides some support for the market's long-term performance after digesting short-term overheating.
We observe how these indicators have performed in the same period historically, which provides a glimpse into the current market situation. However, this does not mean these signals are a "holy grail" for trading, as there are various unforeseeable factors in the actual market.