Products
SentimenTrader Trading Tools
‍
Backtest Engine
My Trading Toolkit
Correlation Analysis
Seasonality
Indicators & Data API
‍
Proprietary Indicators & Charts
Market Data API
Strategies & Scanner
‍
50+ Trading Strategies
Smart Stock Scanner
Research Reports
‍
Research Solutions
Reports Library
Free Resources
Simple Backtest Calculator
Simple Seasonality Calculator
The Kelly Criterion Calculator
Sentiment Geo Map
Public Research Reports
Pricing
Company
About
In the News
Testimonials
Client Success Stories
Contact
Log inLoginSign up
< BACK TO ALL REPORTS

Crude oil's new bear market

Jason Goepfert
2021-12-02
Crude oil has dropped 20% from its peak. This is a relatively quick bear market, and ends a long bull run. Those developments had a tendency to lead to poor future returns in oil, Energy stocks,and the Canadian dollar.

Key points:

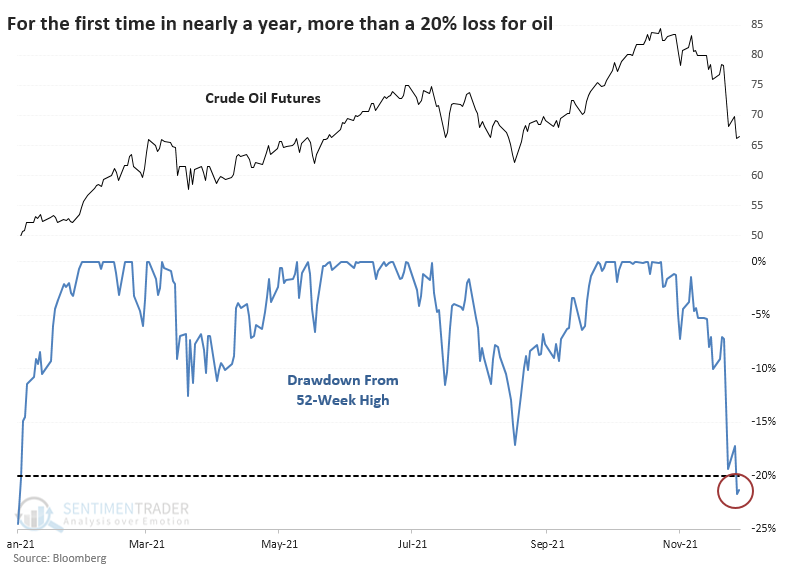
  • Crude oil has dropped 20% from its 52-week high in fewer than 30 days
  • Other quick reversals led to negative forward returns in oil, Energy stocks, and the Canadian dollar
  • The ends of long bull runs also led to mostly negative returns in those markets

A new bear for a widely-watched market

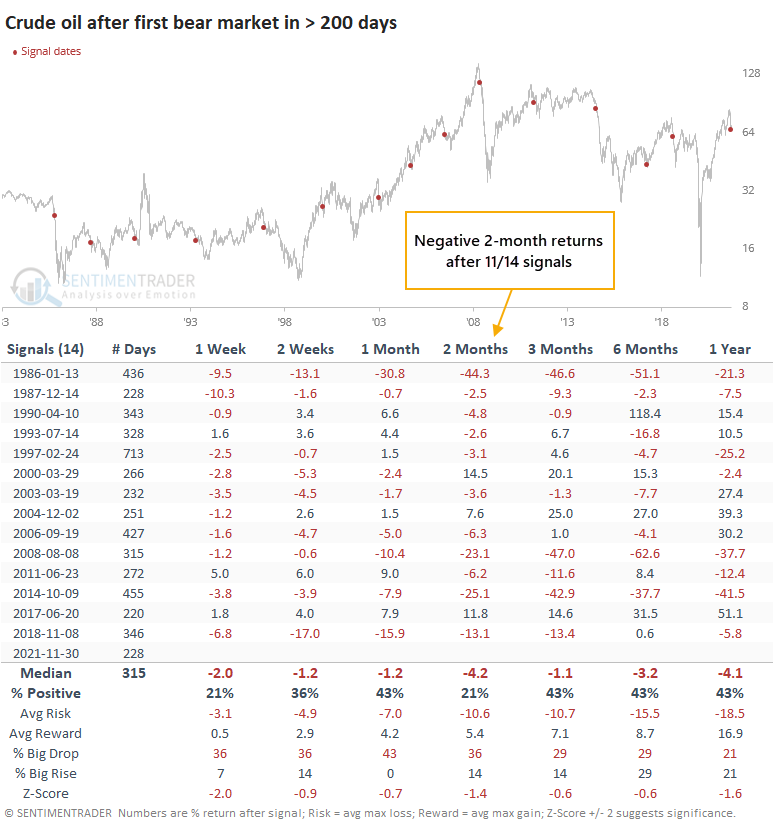
After a plunge to start the week, crude oil bounced back quickly. Dean showed why that was likely just a dead-cat bounce, and already oil has plunged to new lows. The selling pressure was enough to push it more than 20% below its prior 52-week high, the first bear market in nearly a year.

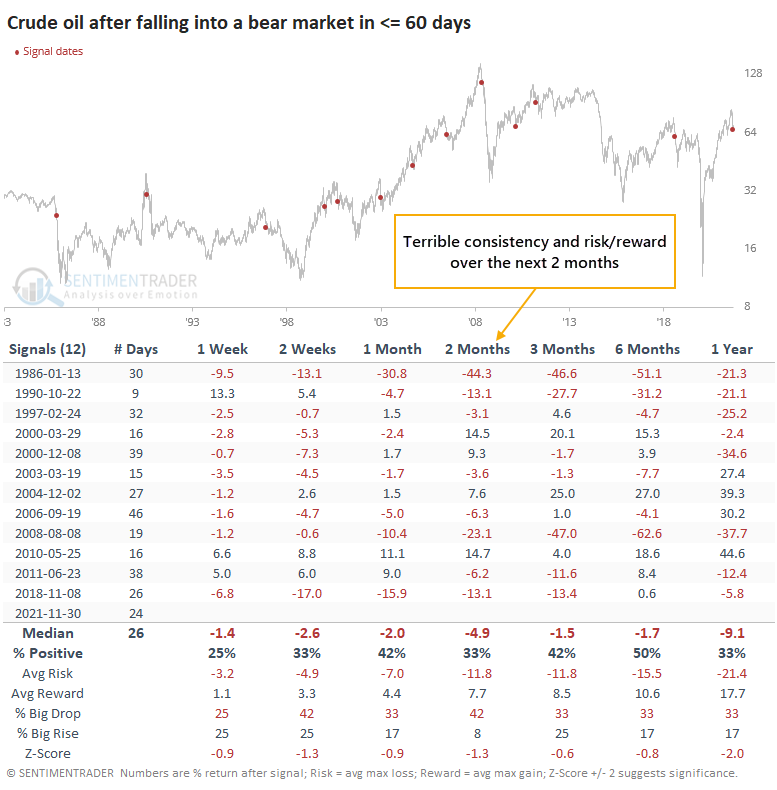
It took crude oil only 24 days to cycle from a new high to a bear market. This is relatively quick but not totally out of bounds for such a hit-or-miss market. Since 1985, there have been 12 other times when oil cycled into a bear market in under 60 days, and it was not a good sign for future returns. Over the next 2 months, oil rebounded only a third of the time.

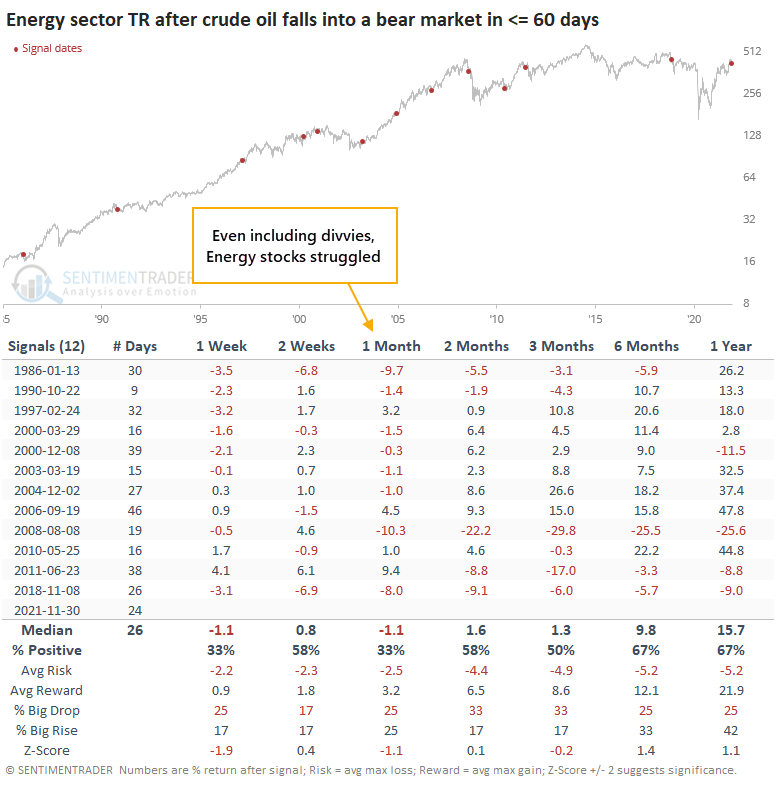
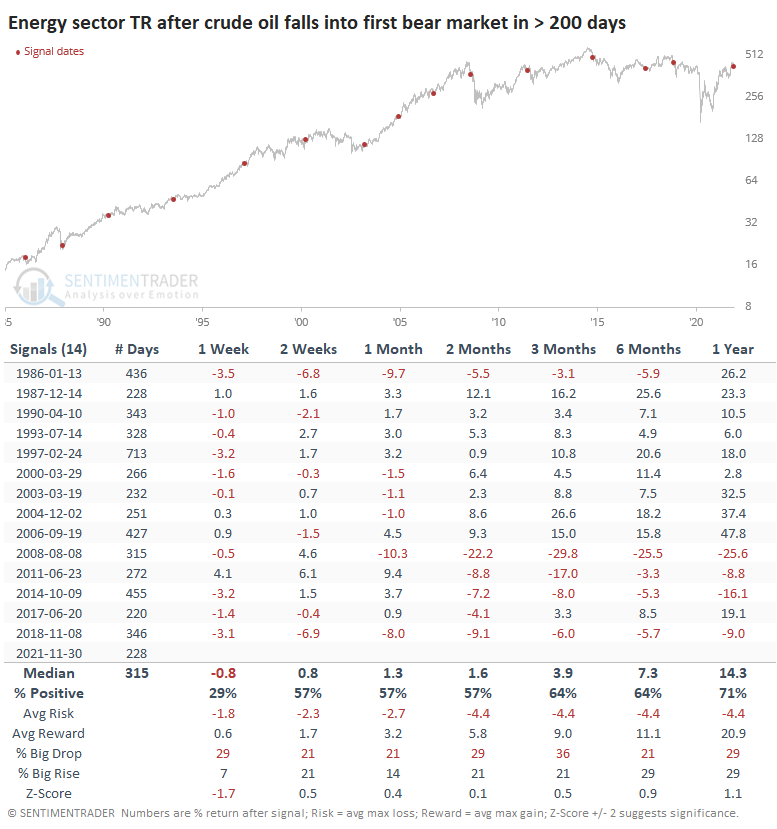
There is not a perfect correlation between crude oil and the price of Energy stocks. Even so, these new bear markets in oil were not all that great of a sign for the sector, even when using total return, which includes sometimes-hefty dividend payouts.

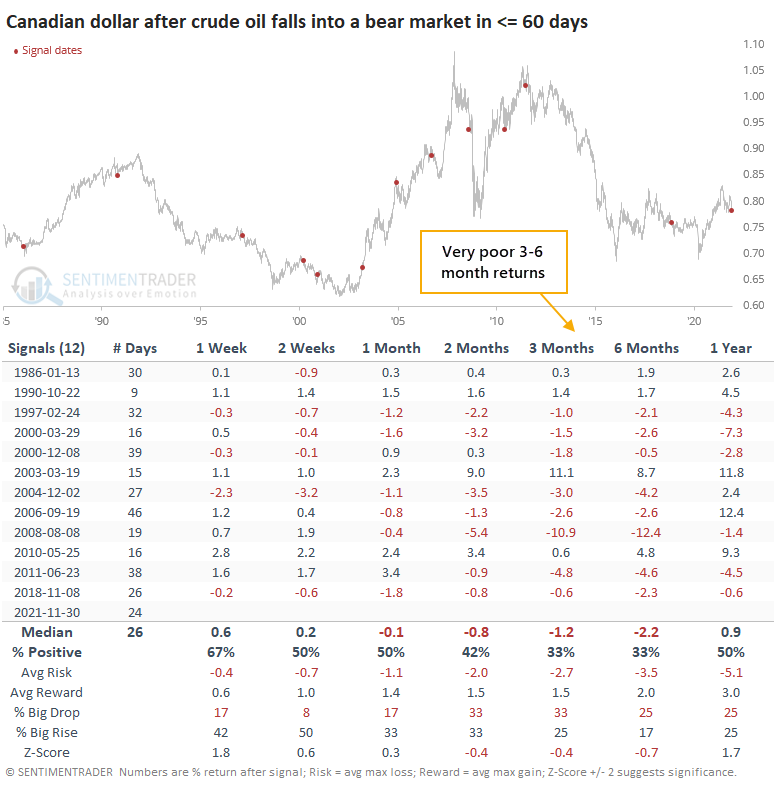
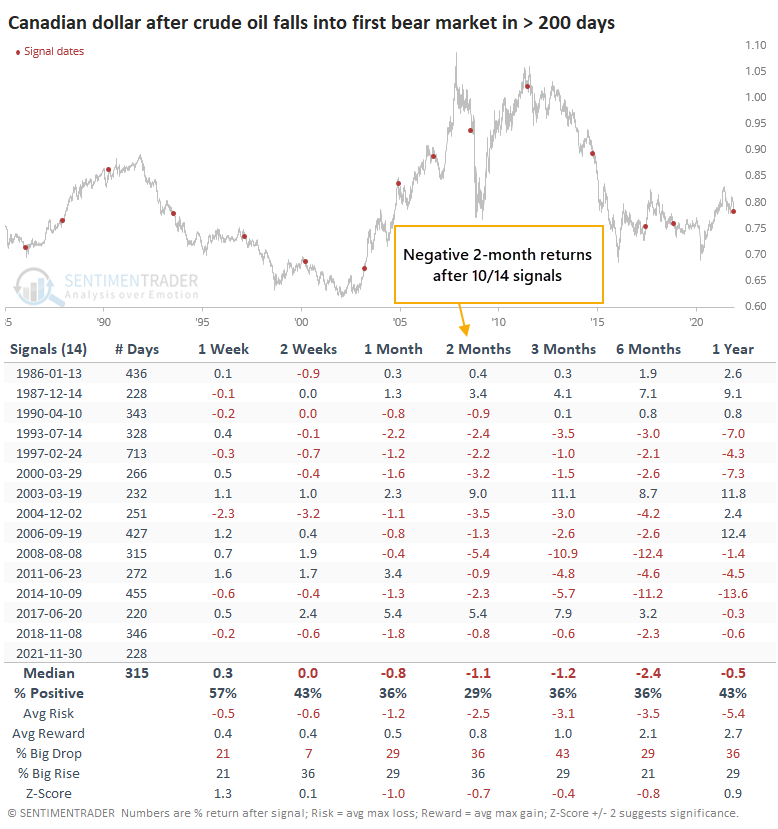
According to Bloomberg, the currency with the most significant 60-day correlation to crude oil is the Canadian dollar. So, it's not too surprising that currency had trouble holding any gains.

The end of a long bull run

This week's drop also ended nearly a year-long bull run in oil. It had been 228 days since oil was more than 20% below a 52-week high, ending one of the longer positive streaks in the history of the futures contract.

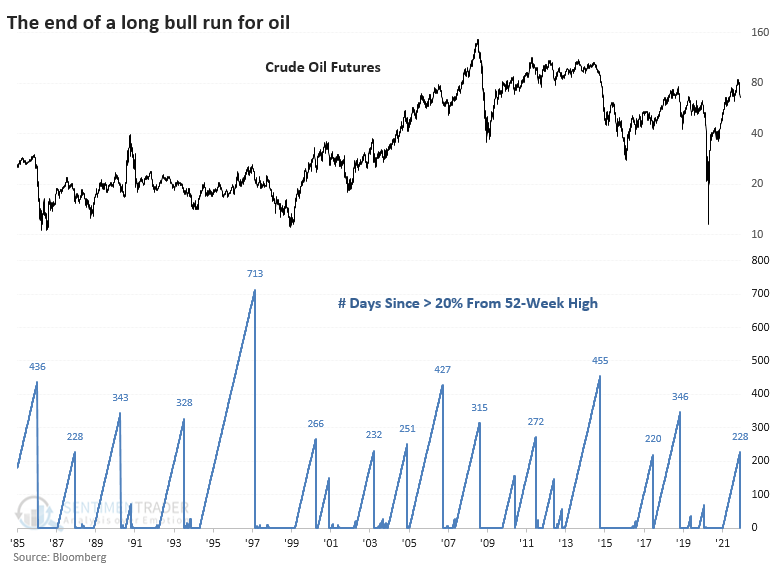
The ends of long periods without a bear market were even worse for oil prices going forward. Over the next 2 months, oil lost ground after 11 out of 14 signals.

These weren't as bad for the stocks that depend primarily on oil and its after products.

Again, though, the loonie did not do well after these signals.

What the research tells us...

Like small-cap stocks, crude oil has suffered a quick reversal from a recent new high. This market is subject to all kinds of structural, geopolitical, and environmental factors that can impact historical comparisons instantly. But if we rely on the general patterns, then quick reversals from a peak, and the ends of long bull runs, have consistently led to poor medium-term returns. This also had a modest negative influence on Energy sector stocks and an enormous negative impact on currencies like the Canadian dollar.

Sorry, you don't have access to this report

Upgrade your subscription plan to get access
Go to Dasboard
PRODUCTS
SentimenTrader
Trading Tools
Indicators & Data API
‍
Strategies & Scanner
‍
Research Reports
FREE
RESOUrCES
Simple Backtest
Calculator
Simple Seasonality
Calculator
The Kelly Criterion
Calculator
Sentiment Geo Map
‍
Public Research Reports
‍
Pricing
Bundle pricing
‍
Announcements
‍
FAQ
COMPANY
‍
About
‍
In the News
‍
Testimonials
‍
Client Success Stories
CONTACT
‍
General Inquiries
‍
Media Inquiries
‍
Financial Professionals Inquiries
‍
© 2025 Sundial Capital Research Inc. All rights reserved.
Setsail Marketing
TermsPrivacyAffiliate Program
Risk Disclosure: Futures and forex trading contains substantial risk and is not for every investor. An investor could potentially lose all or more than the initial investment. Risk capital is money that can be lost without jeopardizing ones’ financial security or life style. Only risk capital should be used for trading and only those with sufficient risk capital should consider trading. Past performance is not necessarily indicative of future results.

Hypothetical Performance Disclosure: Hypothetical performance results have many inherent limitations, some of which are described below. No representation is being made that any account will or is likely to achieve profits or losses similar to those shown; in fact, there are frequently sharp differences between hypothetical performance results and the actual results subsequently achieved by any particular trading program. One of the limitations of hypothetical performance results is that they are generally prepared with the benefit of hindsight. In addition, hypothetical trading does not involve financial risk, and no hypothetical trading record can completely account for the impact of financial risk of actual trading. for example, the ability to withstand losses or to adhere to a particular trading program in spite of trading losses are material points which can also adversely affect actual trading results. There are numerous other factors related to the markets in general or to the implementation of any specific trading program which cannot be fully accounted for in the preparation of hypothetical performance results and all which can adversely affect trading results.

Testimonial Disclosure: Testimonials appearing on this website may not be representative of other clients or customers and is not a guarantee of future performance or success.