
Crude Oil Traders: Beware the Idea of October (and November)

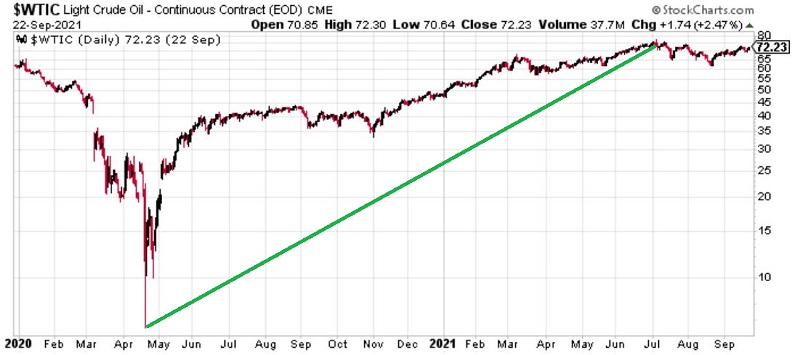
Up until about July of this year, crude oil had been one of the hottest commodities around. As you can see in the chart below (courtesy of Stockcharts.com), after cratering in April 2020, crude has rallied north of $75 a barrel.
In the chart below, we see that crude oil futures just broke out to a new high in powerful fashion after several months of consolidation.
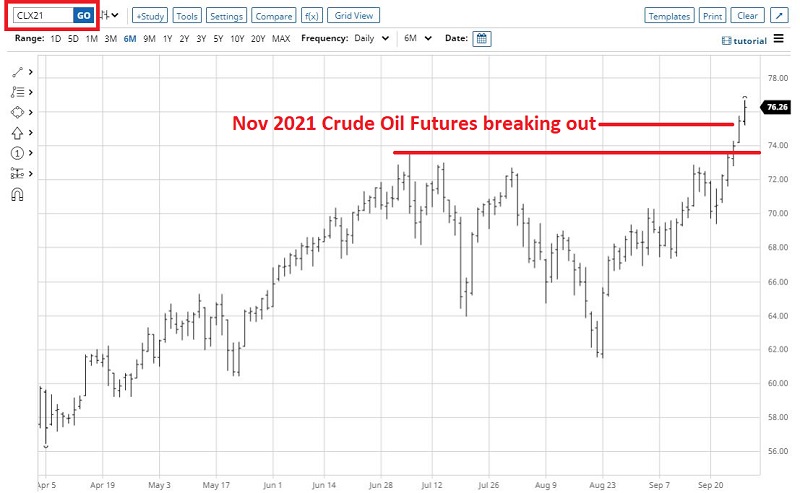
In this scenario, there are two things to remember:
- The trader's rule-of-thumb is to give the bullish case the benefit of the doubt when price alone gives such a powerful signal
- At the same time, if price falls from here AND breaks back below recent support, that can be an especially unfavorable signal
So this seems like a good time to invoke:
Jay's Trading Maxim #18: Follow the trend, but DO NOT fall in love with the trend.
At the moment - and as always - some pundits "expect crude to continue to rally much higher," while others hold the opposite opinion. Who will be correct? I can't say. But one thing I do know is that owning a long position in crude during October and November can be a dangerous place to be.
ANNUAL SEASONAL TREND
The chart below displays the Annual Seasonal Trend for Crude Oil.
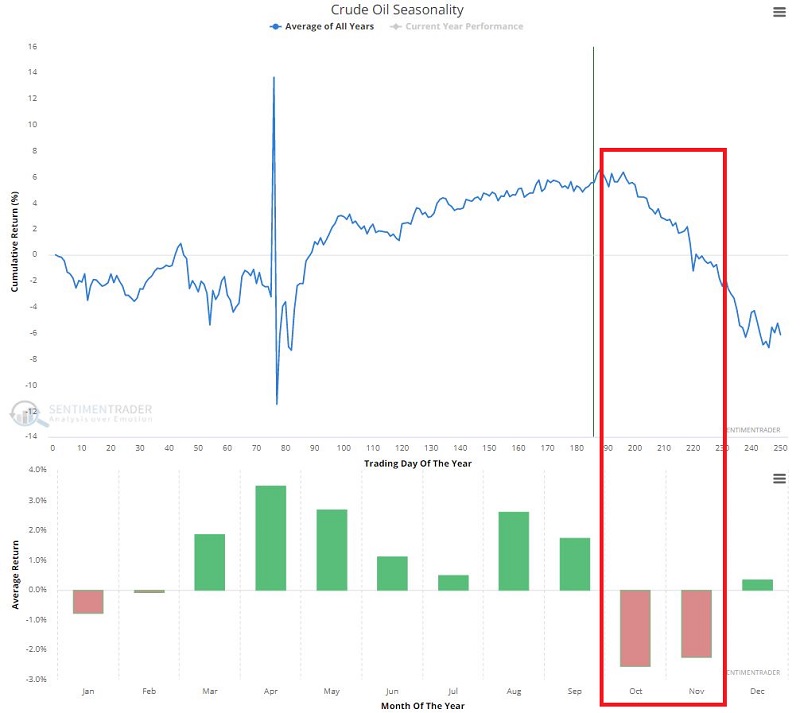
The bearish tendency for crude during October and November is pretty apparent.
The chart below displays:
- The cumulative $ + (-)
- From holding along position in crude oil futures
- ONLY during October and November
- Every year since 1984
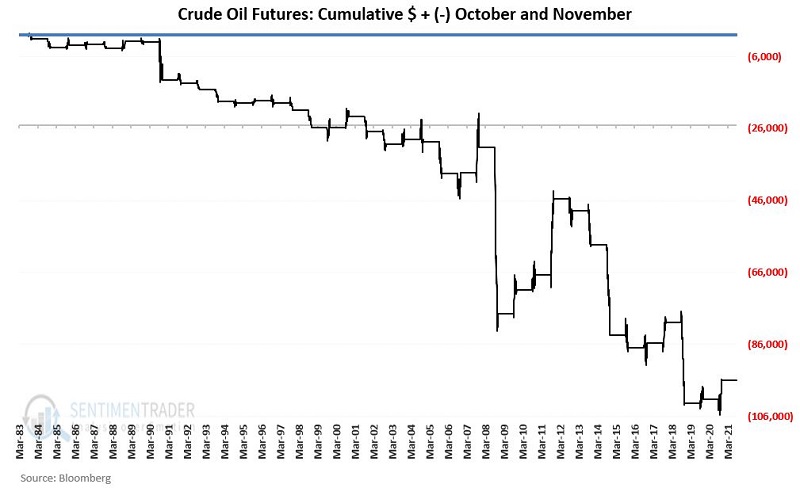
Now the first reaction from many people when they see this chart is to assume that crude oil is doomed to lose ground in the months ahead. But that is not the correct message. Consider the following pieces of information:
- 42% of the time (16 out of 38 years), crude has registered a new gain during October and November combined
- In 2011, crude oil futures gained over $21,000 per contract
So, blindly assuming that crude is headed lower over the next two months is probably a mistake. At the same time, one would typically need a compelling reason (not to mention nerves of steel) to hold a long position in crude oil during this period.
Things to Note:
- # of times Oct-Nov UP = 16
- # of times Oct-Nov DOWN =22
- Average UP $ = +$3,759
- Average DOWN = (-$7,098)
A LONGER-TERM PERSPECTIVE
To highlight the long-term consistency of this particular seasonal trend, let's look at rolling 5-year returns. In other words, every year, we look at the total net gain or loss for crude oil held long-only during October and November over the most recent five years.
The results appear in the chart below.
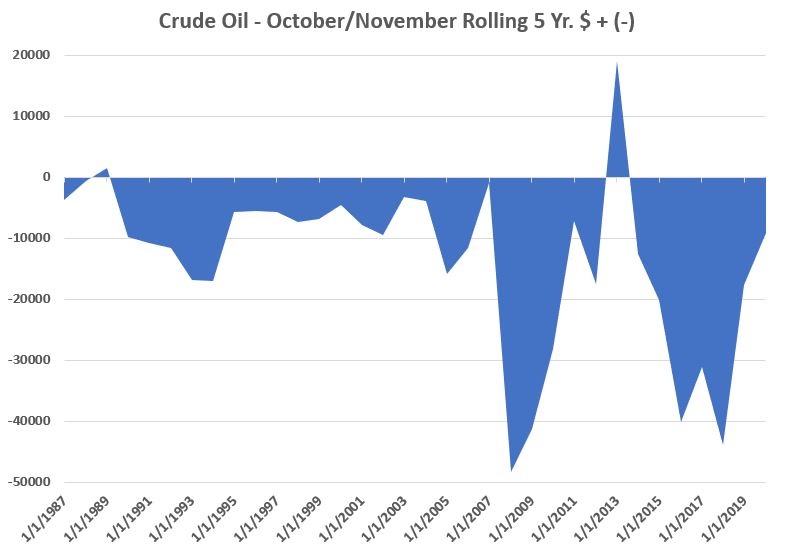
Note that only 2 of 34 rolling 5-year periods showed a gain.
SUMMARY
There cannot be much debate that historically, October/November is a seasonally weak period for crude oil. However, what will happen this time around is always open to discussion. From a real-world trading perspective, my frank advice is this (assuming you have some objective method that you use to designate trend as up or down):
- As long as your trend method is bullish, continue to trade crude oil to the long side. However, it would be best to consider a tight trailing stop and exit at the earliest sign of trouble. The odds are not on your side.
- If price shows some sign of reversing lower AND your trend method is bearish, consider trading crude oil aggressively to the short side during Oct/Nov