Products
SentimenTrader Trading Tools
‍
Backtest Engine
My Trading Toolkit
Correlation Analysis
Seasonality
Market Prediction
Indicators & Data API
‍
Proprietary Indicators & Charts
Market Data API
Strategies & Scanner
‍
50+ Trading Strategies
Smart Stock Scanner
Smart Option Scanner
Research Reports
‍
Research Solutions
Reports Library
Free Resources
Simple Backtest Calculator
Simple Seasonality Calculator
The Kelly Criterion Calculator
Sentiment Geo Map
Public Research Reports
Education
Sentiment Indicators
Technical Indicators
Pricing
Company
About
In the News
Testimonials
Client Success Stories
Contact
Log inLoginSign up
< BACK TO ALL REPORTS

Crude oil surges into overbought territory

Dean Christians
2023-09-19
The Relative Strength Index (RSI) for crude oil increased to the most overbought condition in more than 18 months, a level achieved only 1% of the time since 1983. After similar conditions, the commodity struggled over most time horizons.

Key points:

  • The Relative Strength Index (RSI) for crude oil rose above 77, indicating an overbought status
  • Similar overbought conditions suggest oil could struggle over a medium-term horizon
  • Energy stocks tend to exhibit somewhat weak returns over the next month

Momentum in crude oil lifts the Relative Strength Index into overbought territory

The Relative Strength Index (RSI), developed by J. Welles Wilder Jr., is a popular technical analysis indicator that measures market momentum. As per the classical interpretation, when the RSI reading reaches 70 or higher, it denotes an overbought scenario, whereas a reading of 30 or lower signifies an oversold condition. 

In previous reports, I've demonstrated the significance of an overbought RSI condition as a potential indication of bullish price momentum, a signal that traders should embrace, especially for stocks.

Unlike stocks, commodities are known for their tendency to revert to the mean. Hence, the sustainability of overbought conditions is generally lower. 

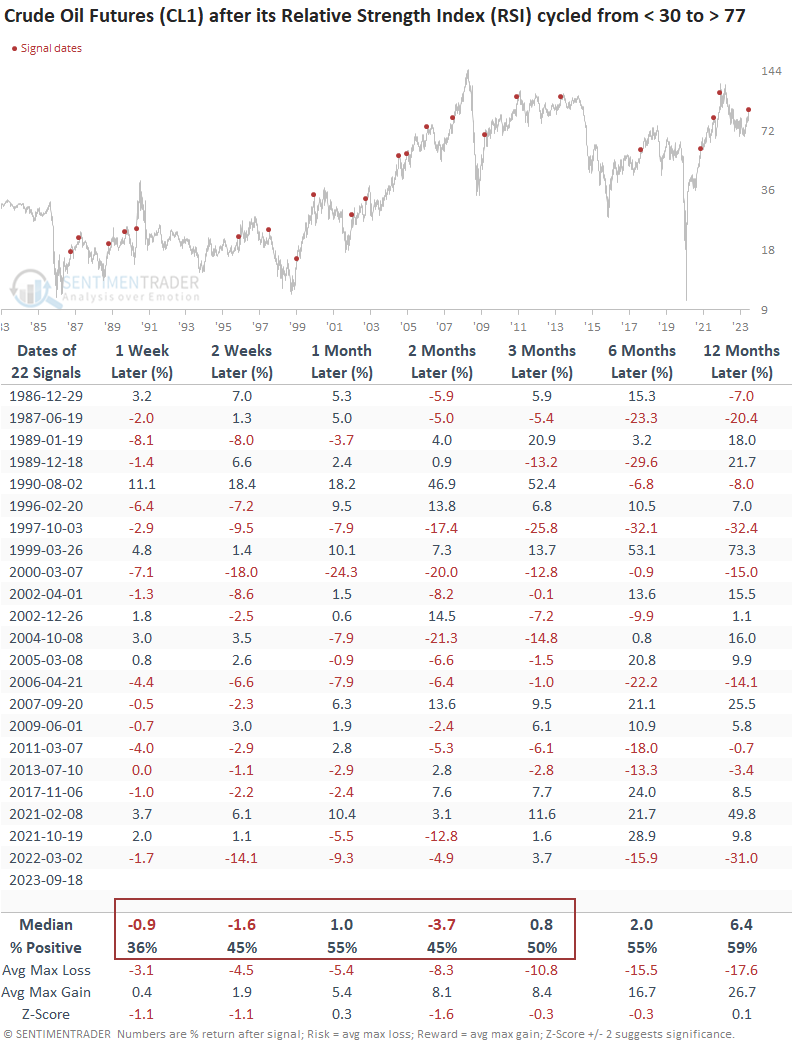
For the first time in more than 18 months, the Relative Strength Index (RSI) for crude oil rose above 77, a condition achieved only 1% of the time since 1983. While the sample size is small, annualized returns are extremely unfavorable when the RSI increases to the current level.

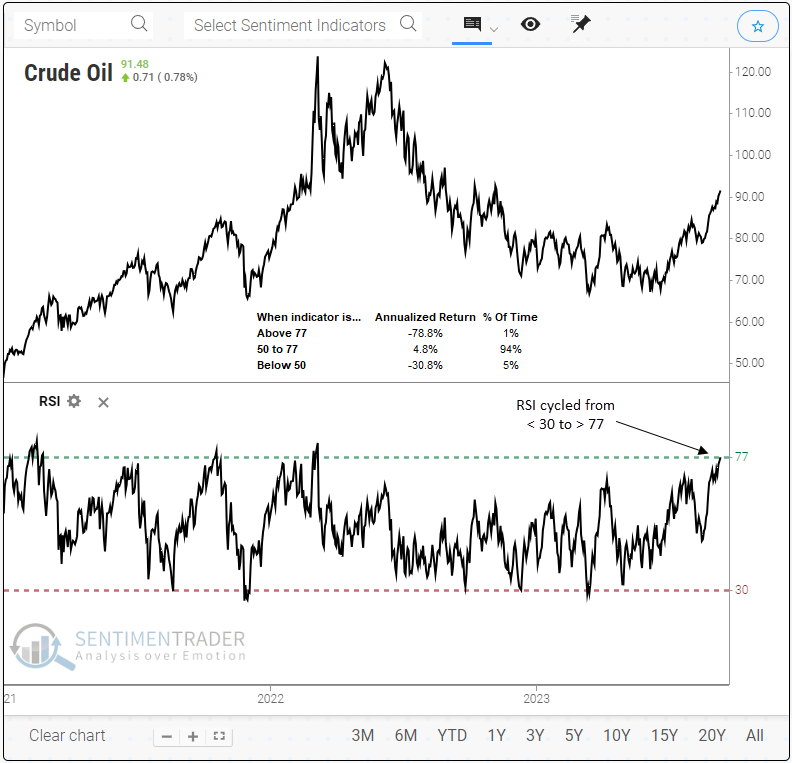
Similar overbought conditions led to an unfavorable outlook 

When the RSI for crude oil cycles from less than 30 to greater than 77, the commodity tends to encounter difficulties over short and medium-term horizons. In 19 out of 22 precedents, oil experienced negative returns at some point within the next two months. 

Additional context

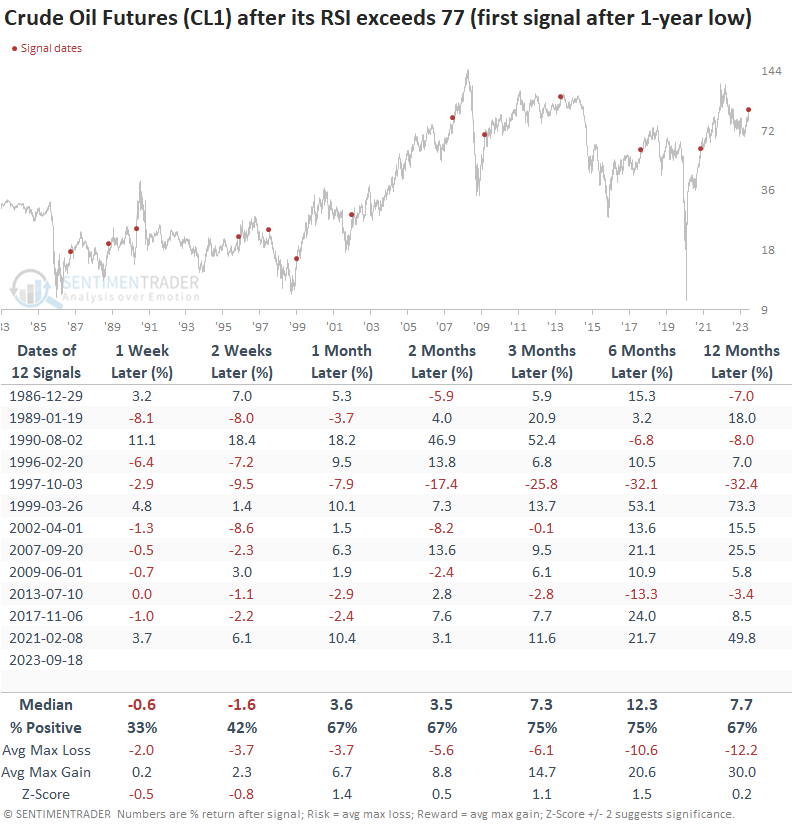
When the RSI for oil exceeds 77 for the first time after a 1-year low, the commodity tends to digest the recent gains over the next few weeks. However, with bullish medium and long-term results, we must be mindful that a short-term dip could represent a pause in the early stages of a new uptrend.

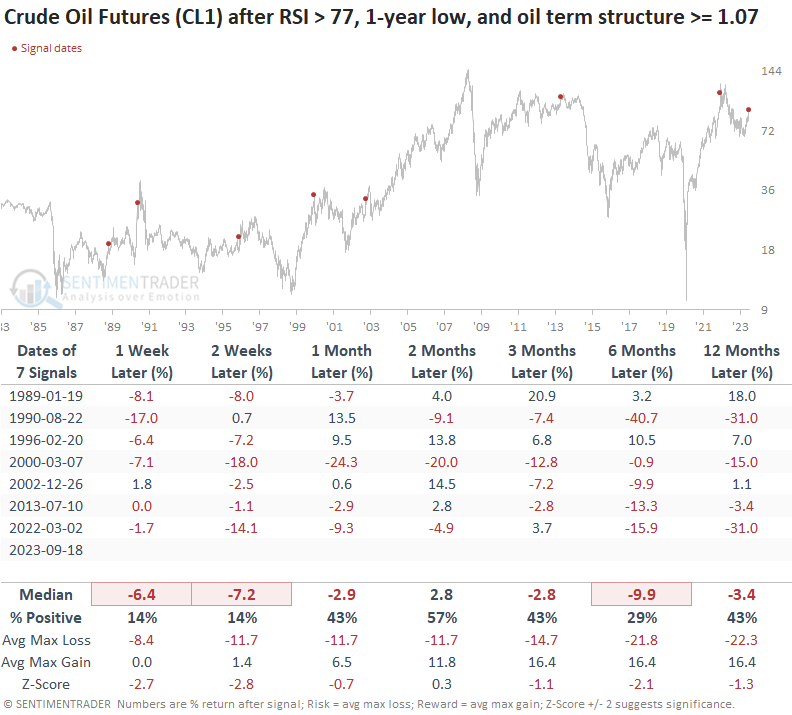
My colleague, Jay Kaeppel, published a research report on the term structure for crude oil, pointing out the potential for weak returns due to backwardation. Let's include the term structure condition for oil with our previous study conditions. 

So, we will now identify instances when the RSI was above 77 for the first time after a 1-year low, and the term structure was 1.07 or greater.

The outlook for crude oil doesn't look promising across any time horizon. 

What about energy stocks?

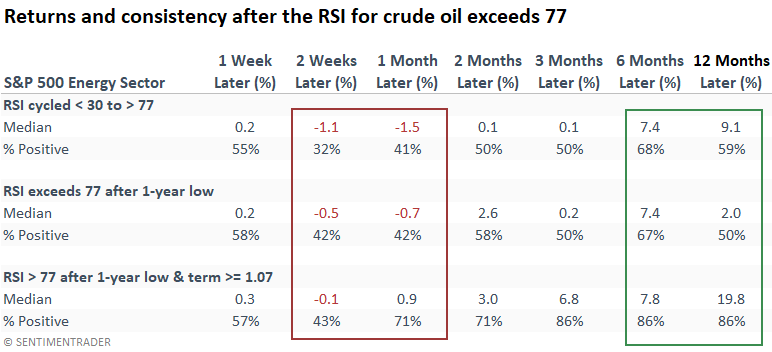
The S&P 500 energy sector shows sluggish results over the subsequent month for each of our crude oil studies. However, the overbought condition in oil leans bullish over long-term horizons.

What the research tells us...

The Relative Strenth Index (RSI) for crude oil increased into overbought territory for the first time after an annual low with the term structure in backwardation. Similar conditions suggest the recent bullish price momentum could reverse course. If history rhymes, energy stocks will struggle in the near term.

PRODUCTS
SentimenTrader
Trading Tools
Indicators & Data API
‍
Strategies & Scanner
‍
Research Reports
FREE
RESOUrCES
Simple Backtest
Calculator
Simple Seasonality
Calculator
The Kelly Criterion
Calculator
Sentiment Geo Map
‍
Public Research Reports
‍
Education
Sentiment Indicators
‍
Technical Indicators
‍
Pricing
Bundle pricing
‍
FAQ
‍
Announcements
‍
COMPANY
‍
About
‍
In the News
‍
Testimonials
‍
Client Success Stories
CONTACT
‍
General Inquiries
‍
Media Inquiries
‍
Financial Professionals Inquiries
‍
© 2026 Sundial Capital Research Inc. All rights reserved.
Setsail Marketing
TermsPrivacyAffiliate Program
Risk Disclosure: The information and tools provided are for research and analytical purposes only and are not intended as investment advice. Market analysis involves uncertainty, and outcomes may differ from expectations. Users should conduct their own due diligence and consider their individual circumstances before making any financial decisions. Past performance is not necessarily indicative of future results.

Hypothetical Performance Disclosure: Hypothetical performance results have many inherent limitations, some of which are described below. No representation is being made that any account will or is likely to achieve profits or losses similar to those shown; in fact, there are frequently sharp differences between hypothetical performance results and the actual results subsequently achieved by any particular trading program. One of the limitations of hypothetical performance results is that they are generally prepared with the benefit of hindsight. In addition, hypothetical trading does not involve financial risk, and no hypothetical trading record can completely account for the impact of financial risk of actual trading. for example, the ability to withstand losses or to adhere to a particular trading program in spite of trading losses are material points which can also adversely affect actual trading results. There are numerous other factors related to the markets in general or to the implementation of any specific trading program which cannot be fully accounted for in the preparation of hypothetical performance results and all which can adversely affect trading results.

Testimonial Disclosure: Testimonials appearing on this website may not be representative of other clients or customers and is not a guarantee of future performance or success.