
Crude oil plunges to multi-year low

Key points
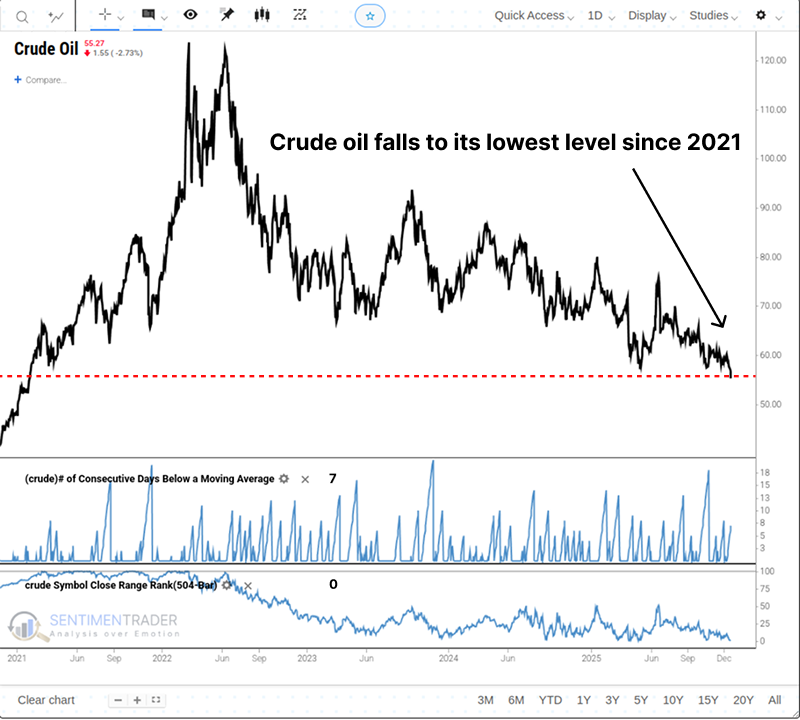
- Crude oil has fallen to its lowest level since 2021.
- Sentiment has turned pessimistic, but historically (over the last 20 years), low optimism readings in this context have preceded further price declines.
- Technical patterns, specifically a descending triangle, suggest a continuation of the primary downtrend.
- While short-term bounces are possible, the weight of the evidence points to a challenging environment for energy prices.
A prominent global barometer fell to its low level
Crude oil, a key commodity influencing the global economic trajectory, fell to its lowest point since 2021. Previously, crude prices attempted a rally, but that momentum stalled. The commodity has been consolidating within a wide range and is currently testing the lower bounds of that channel.
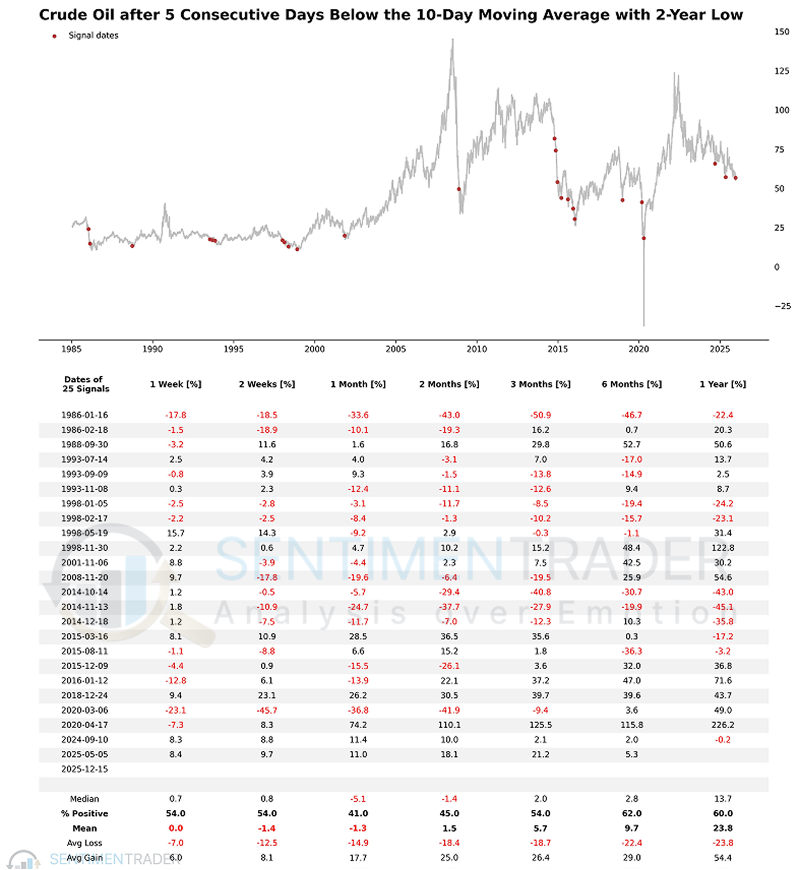
As of the close on December 16, 2025, crude oil prices had closed below their 10-day moving average for seven consecutive trading sessions. For this study, we lowered the threshold to five days and added a filter requiring crude oil prices to be at a two-year low.
Compared to historical averages, the short-to-medium-term performance following such setups has been weak. Notably, the risk/reward ratio over the one-month timeframe is unfavorable. While the six-month oil price trend performed slightly better than flipping a coin, it was not without risk. During this period, crude oil prices declined in 20 out of 25 cases.
As oil prices fall, expectations follow
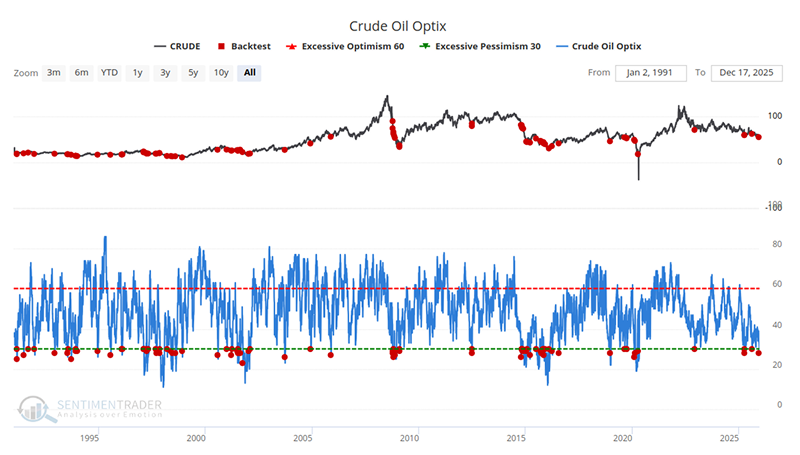
As is the case with almost all financial assets throughout history, as the price of oil has already fallen, investors have become more pessimistic about its future prospects. Consequently, the Crude Oil Optix has shifted from slightly optimistic to pessimistic.
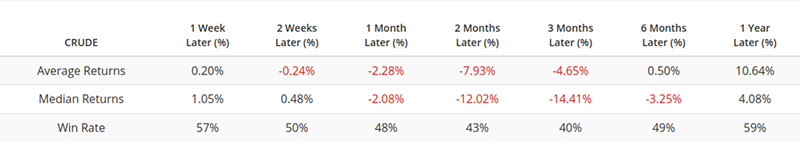
The table below summarizes the performance of Crude Oil futures following the dates highlighted in the chart above.
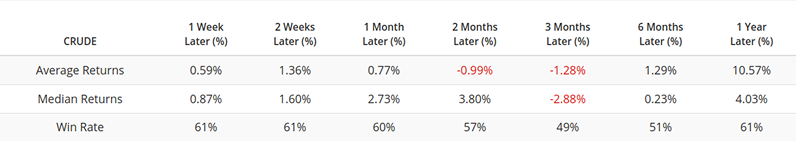
The results are essentially not all that meaningful, with Win Rates mostly in "coinflip" territory and with lackluster Average and Median Returns.
Focusing on the last 20 years
Instead of reviewing the entire history of crude oil futures trading, let's focus only on the past 20 years. Admittedly, some readers will find this approach meaningful, while others may view it as biased by curve fitting or recency effects. There is no standard answer to this; it requires your own judgment.
The chart and table below display the performance of crude oil prices only over the past 20 years.
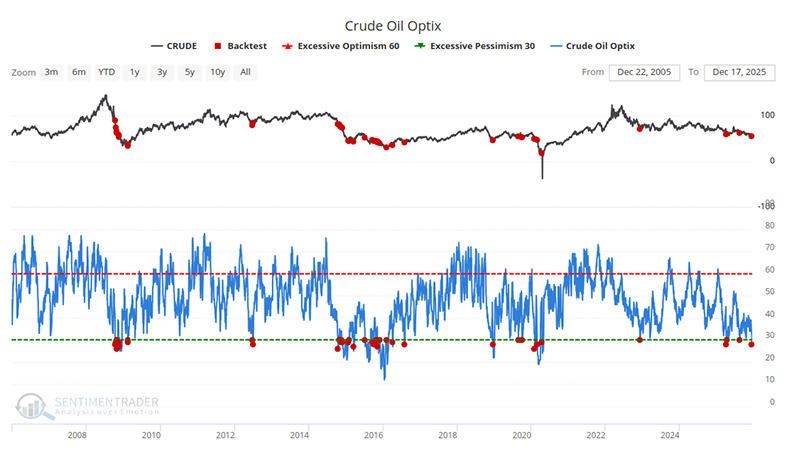
The Backtest Engine shows that when Crude Oil Optix is below 30%, crude oil prices have averaged negative returns over periods ranging from two weeks to three months.
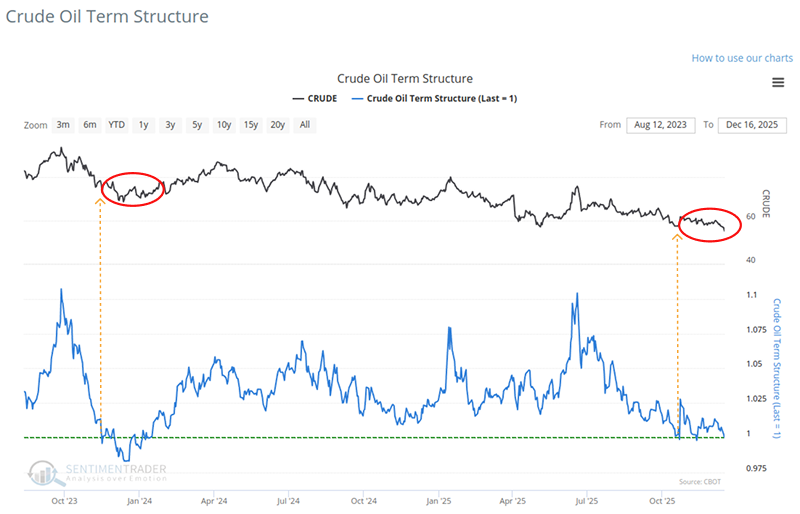
Crude Oil Term Structure
The term structure of crude oil futures shows the relationship of the near-term futures contract to a further-out contract. If it is above 1.0, the near-term contract is priced higher than the further-out contract, called backwardation. Spikes in this measure can flag impending market weakness. If below 1.0, then the market is in contango. When it goes into severe contango, that is a sign of stress in the market and has typically only occurred when crude oil is forming a long-term bottom.
It is worth noting that the latest value has reached 1.002.
An ominous price pattern
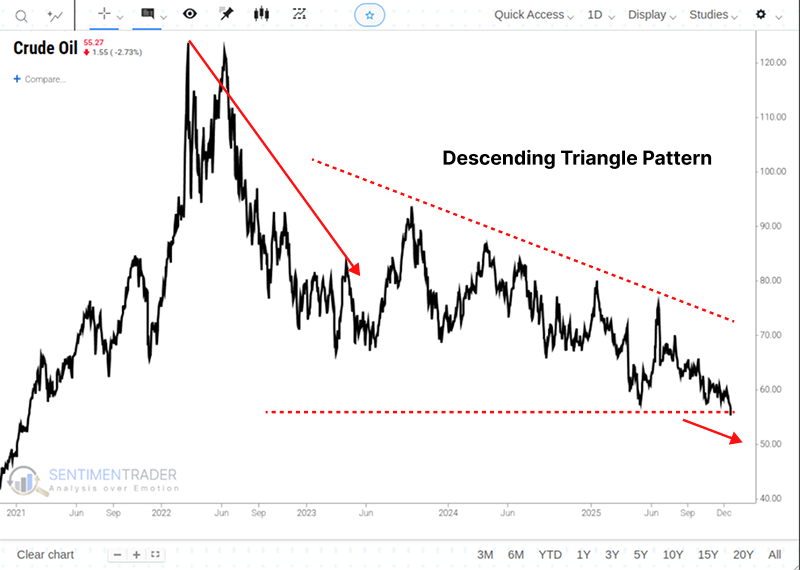
From a technical analysis perspective, the price pattern in crude oil resembles a descending triangle, a continuation formation that often resolves in the direction of the previous trend-which has been downward since oil's peak in 2022.
Although the overall trend of crude oil prices appears bleak, it would not be surprising if it rallies one last time before falling.
What the research tells us...
Crude oil is flashing warning signs across multiple disciplines. Price action has deteriorated to multi-year lows, and technical patterns like the descending triangle suggest the path of least resistance remains downward. While sentiment has turned pessimistic, recent history (the last 20 years) indicates that this is not necessarily a contrarian "buy" signal; instead, low sentiment has often acted as a momentum indicator, preceding further weakness. The broader downtrend in energy prices is likely to persist.