
Crude oil at the crossroads

Key points
- While attempting to establish an uptrend in price, crude oil is about to enter what is traditionally its weakest time of year
- From year to year, there is no guarantee regarding any seasonal trend, so traders should pay close attention to price confirmation (or lack thereof)
- Crude oil futures term structure is also a potential warning sign for crude in the months directly ahead.
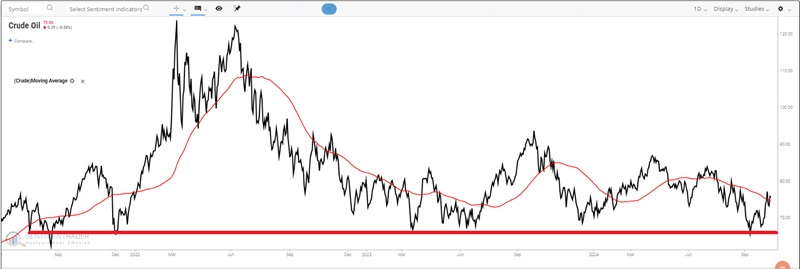
Crude oil attempts to form a bottom
Crude oil futures have attempted several times in the past few years to break below $70 a barrel, most recently in September 2024. Each time, the price has reversed higher, forming a support level. At the moment, crude is back above its 70-day moving average. So, for the moment, a price-based trader can make a sound argument for the bullish case for crude oil.
Nevertheless, there are a few reasons to question the idea of chasing the long side of crude oil in the next several months - and good reason to consider playing the short side.
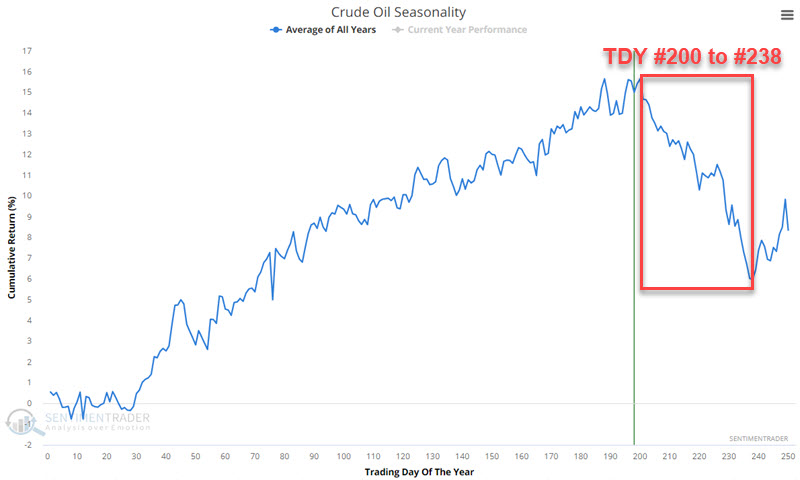
Crude oil is entering its least favorable time of year
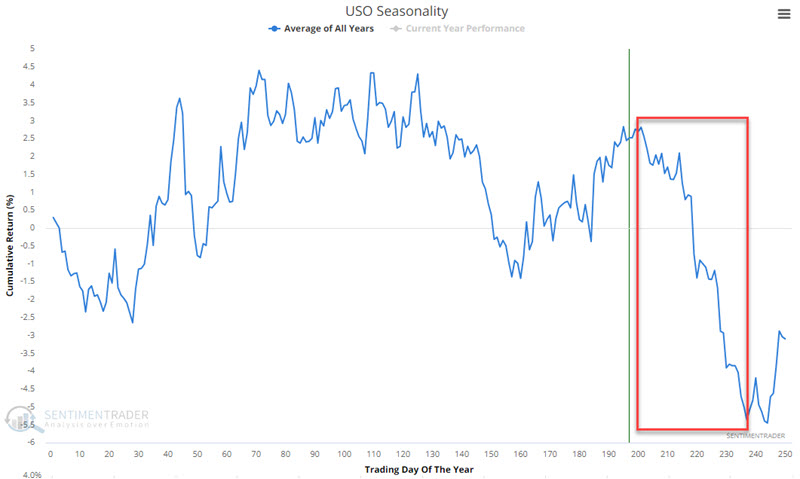
The chart below displays the annual seasonal trend for crude oil futures. Note that an unfavorable period extends from Trading Day of Year (TDY) # 200 through TDY #238. For 2024, that period extends from the close on 2024-10-14 through 2024-12-05.
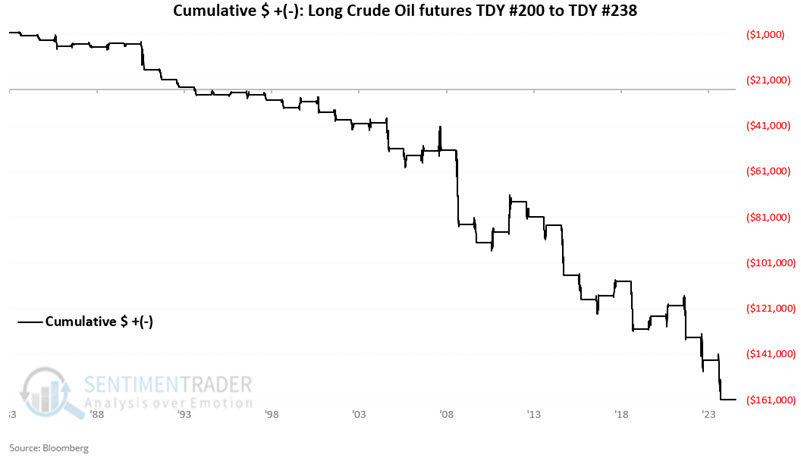
The chart below displays the hypothetical cumulative $ +(-) achieved by holding a long position in crude oil futures only during the TDY #200 to #238 period since 1983. It is not a pretty picture.
The table below summarizes crude oil's performance during this period.
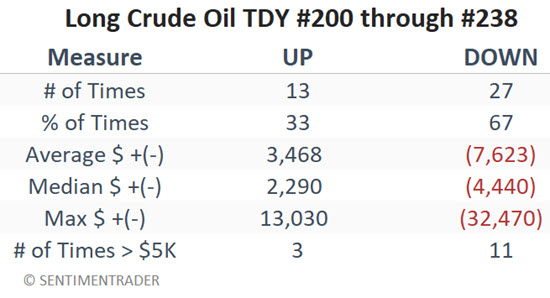
The 33%-win rate reminds us that there is no guarantee that crude oil is "doomed" to fall in the months ahead. Based on recent price strength, a trader looking to play the long side of crude oil is cautioned to consider where to place a stop-loss or trailing stop order. If crude does turn down, it could plunge quickly. On the other side, a trader looking to play the short side of crude based on this seasonal trend must decide a) when and where to enter, and b) similarly, where to place a stop-loss order in case crude bucks the bearish seasonal trend in 2024.
Ticker USO for non-futures traders
The United States Oil Fund LP (ticker USO) is an ETF that tracks the price of crude oil futures. The chart below displays the annual seasonal trend for ticker USO
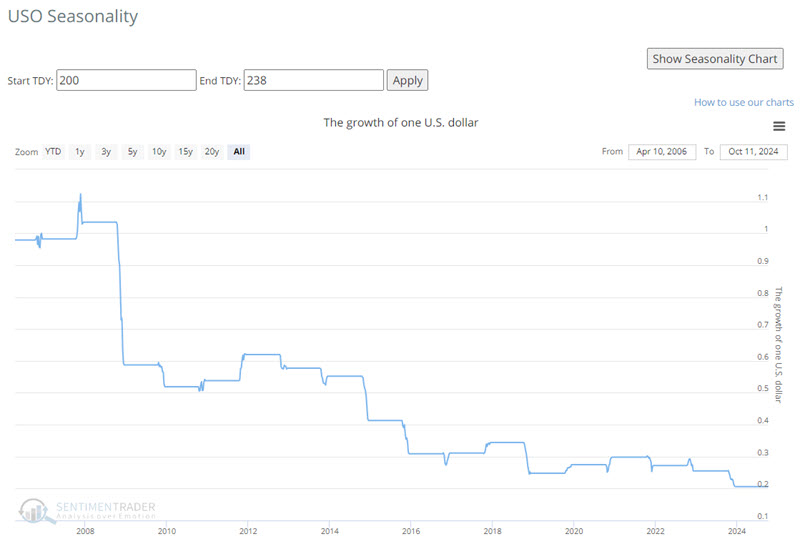
The table below shows that $1 invested in USO only during the TDY #200 through #238 every year since 2006 has declined in value by 80%.
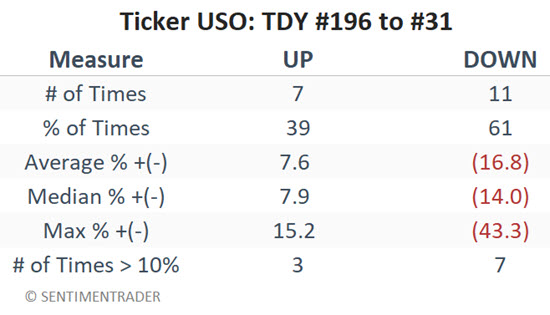
The table below summarizes USO's performance during this period.
Crude oil term structure remains as a headwind
The term structure of crude oil futures shows the relationship of the near-term futures contract to a further-out contract. If it is above 1.0, then the near-term contract is priced higher than the further-out contract, called backwardation. If below 1.0, then the market is in contango.
In this article dated 2024-06-24, I pointed out the Crude oil term structure had crossed above 1.05. The chart below highlights all dates in the last 15 years when our Crude Oil Term Structure indicator crossed above 1.05 for the first time in 21 days.
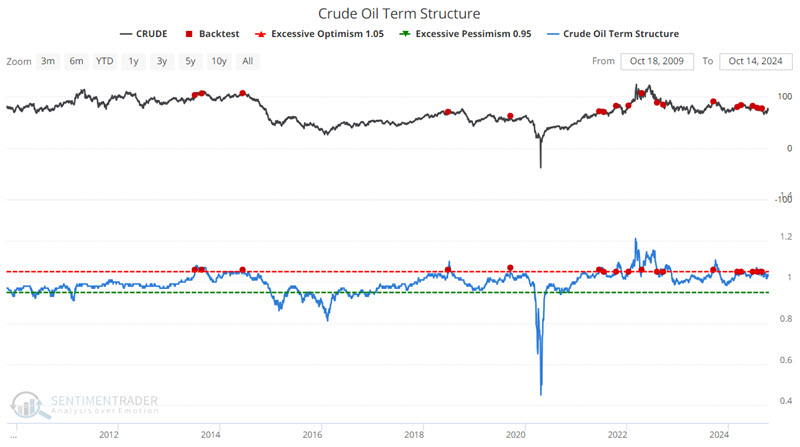
The tables below summarize subsequent crude oil performance and display signal-by-signal results following the dates highlighted in the chart above.
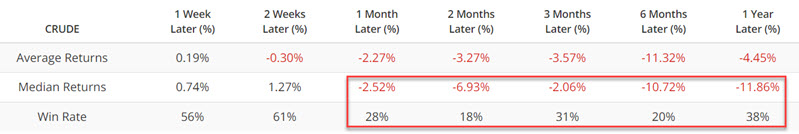
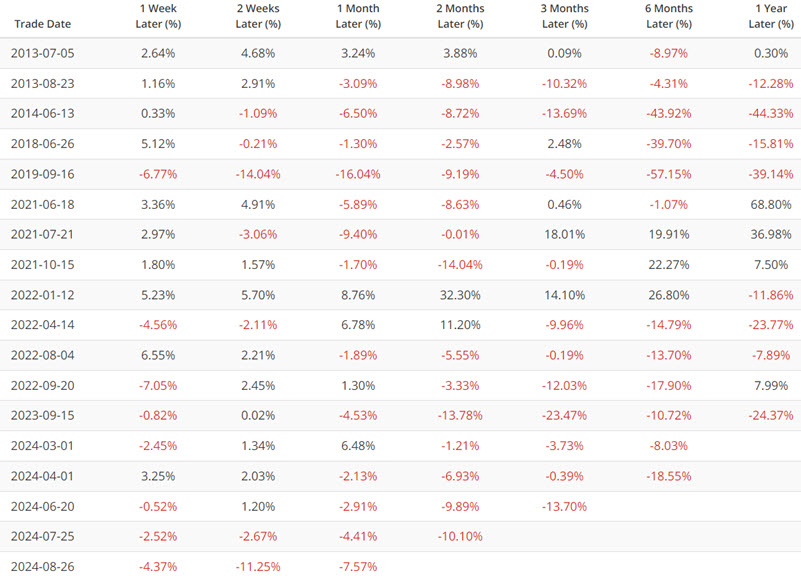
The most recent unfavorable signal occurred on 2024-08-26. Given the 18%-win rate six months after a signal, this indicator still falls on the unfavorable side of the ledger.
What the research tells us…
Is the message that crude oil is sure to plunge in the months ahead? Not at all. The markets will do what the markets will do. Since we cannot control what happens after we enter a trade, our primary job as traders is to a) assess opportunities, b) intelligently allocate capital, and c) control risk. Seasonality and futures term structure strongly suggest that traders seek opportunities to play the short side of crude oil futures. Non-futures traders might also consider put options on ticker USO.