
Crude oil and yields signal a bullish scenario for stocks

Key points:
- Over the last five sessions, crude oil has fallen over 8%, and long-dated Treasuries have risen almost 3%
- Similar precedents produced outstanding returns and consistency for the S&P 500 regardless of the environment
- Consumer Discretionary and Technology outperformed all other sectors following similar instances
Crude oil and yields down equal risk-on for stocks
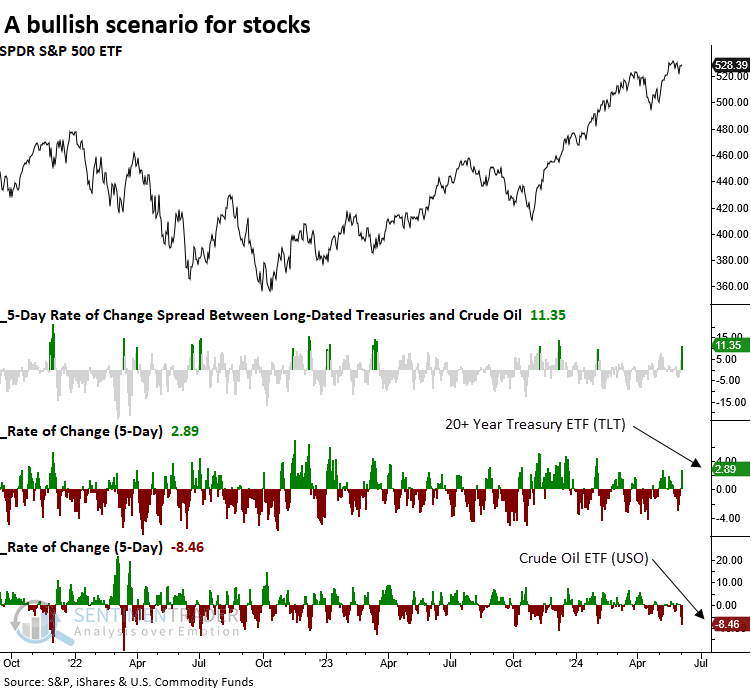
If you're searching for an explanation for the rally in stocks in the last few days, the 8% drop in crude oil prices is likely a factor. The decline has sparked a chain reaction, causing long-term Treasury prices to soar (yields to fall). This, in turn, has driven investors to snap up stocks, as the combination of lower oil prices and yields presents a favorable situation.
To capture this scenario, I applied a 5-day rate of change to the 20+ Year Treasury ETF (TLT) and the Crude Oil ETF (USO) and then calculated the spread between the two.
On Tuesday, the spread surged above 11%, marking the highest reading since December 2023, a favorable time to own stocks.
A bullish macroeconomic combination for stocks
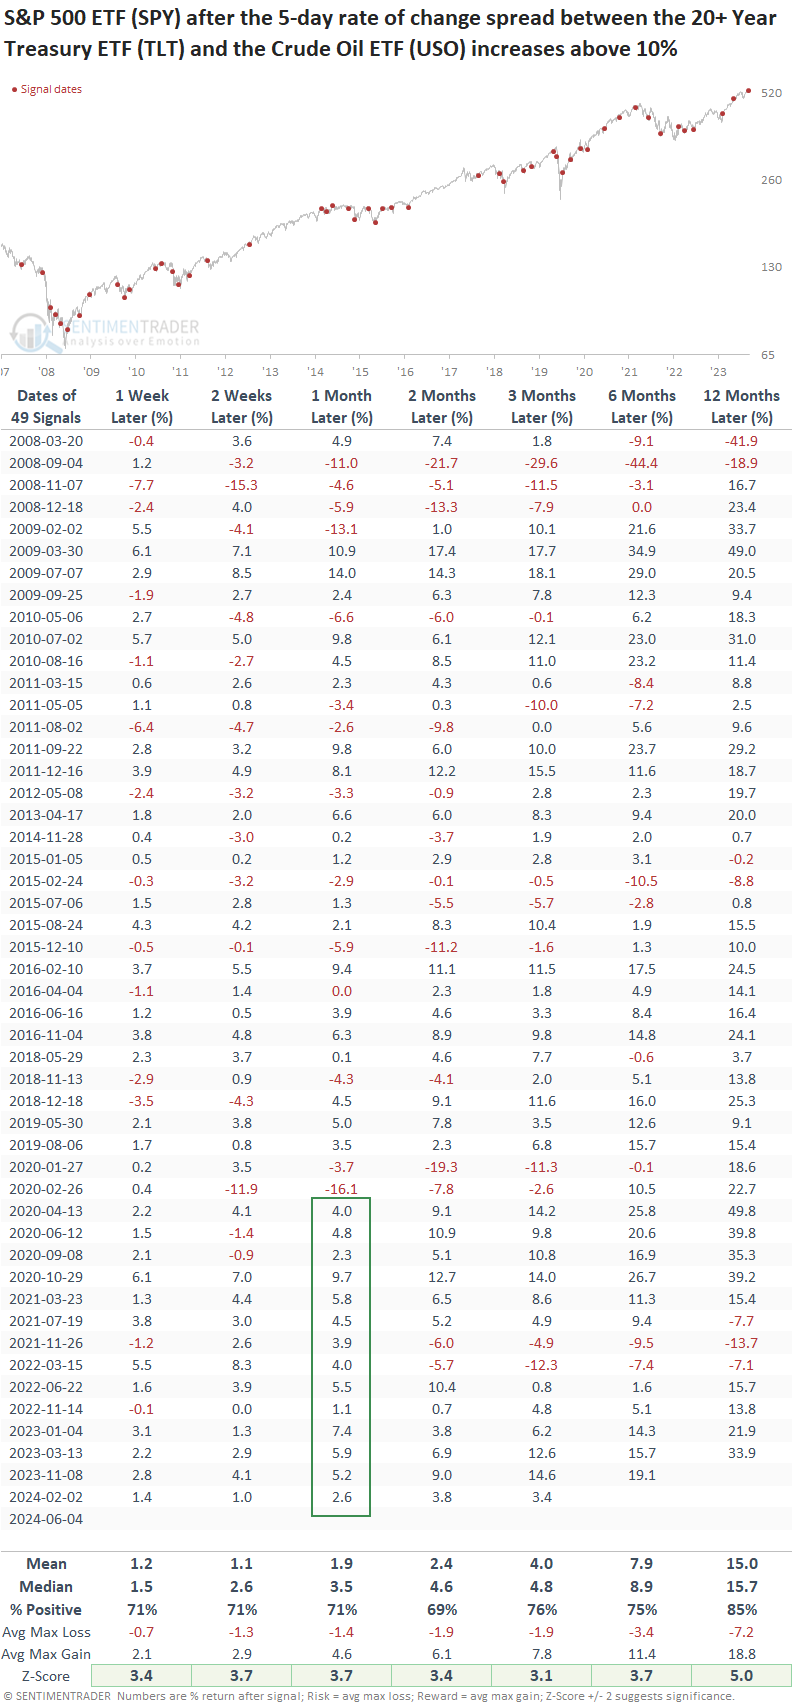
Whenever the 5-day rate of change spread between the 20+ Year Treasury ETF (TLT) and the Crude Oil ETF (USO) exceeded 10%, the world's most benchmarked index displayed outstanding returns and consistency. At some point over the following month, the S&P 500 ETF (SPY) was higher in 44 out of 49 instances, which includes most of the 2007-09 bear market. Additionally, the one-month horizon is currently riding a 14-signal win streak.
Even though the six and twelve-month horizons have benefited from a near straight-up bull market, returns showed significance relative to random returns.
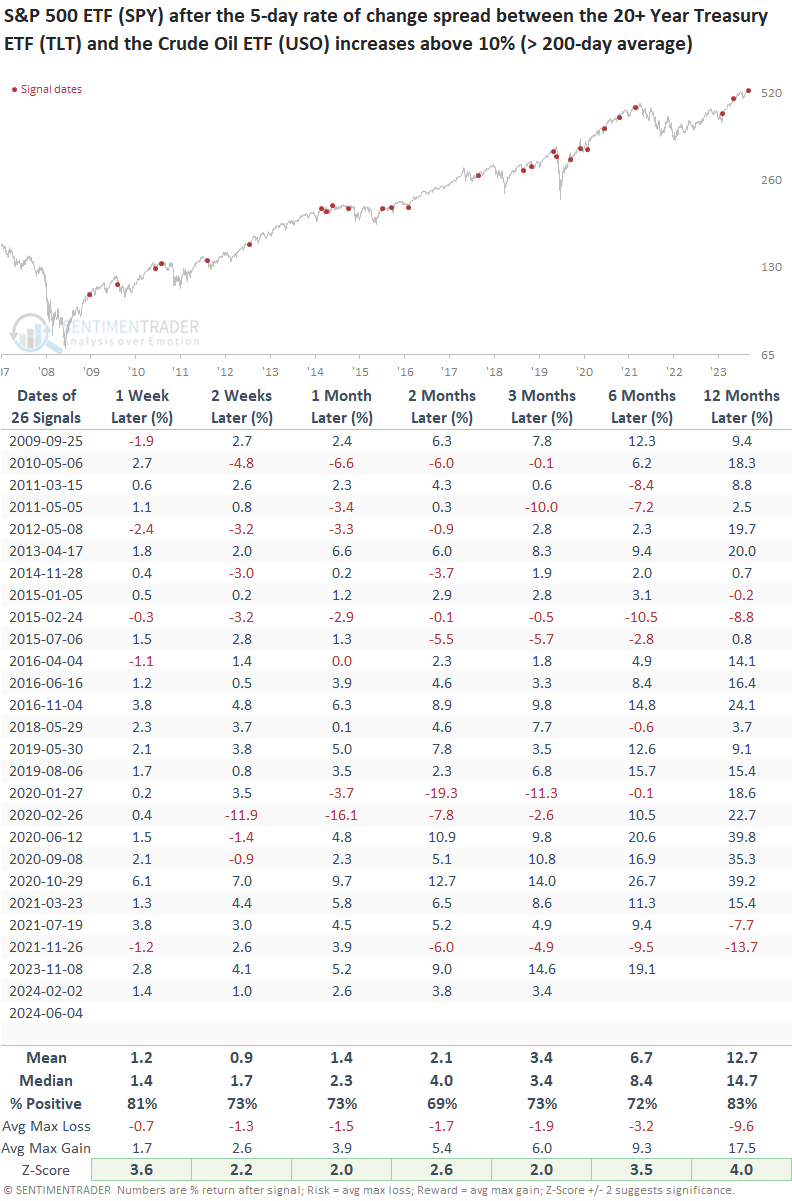
 Suppose I isolated instances when the S&P 500 traded above its 200-day average for context similar to now. In that case, returns were slightly less favorable across all horizons. However, win rates from one to four weeks later were higher, particularly in the first week, which saw an impressive 81% increase.
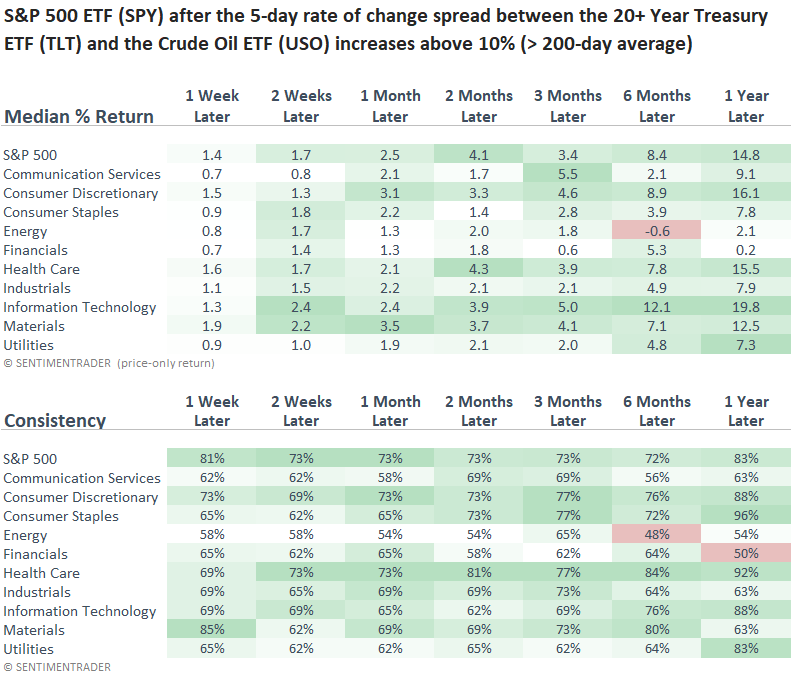
Unsurprisingly, Consumer Discretionary and Technology, two growth-oriented sectors, outperformed the S&P 500 and all other sectors over the following year.
What the research tells us...
Following a swoon in crude oil prices, long-dated Treasuries ripped higher, lowering yields and alleviating investors' concerns regarding two key macroeconomic factors. Similar precedents when the 5-day rate of change spread between the 20+ Year Treasury ETF (TLT) and the Crude Oil ETF (USO) surged higher produced outstanding returns and consistency for the S&P 500, especially over the subsequent month. Technology tended to outperform the broad market and other sectors, which aligns with current-day relative trends.