Products
SentimenTrader Trading Tools
‍
Backtest Engine
My Trading Toolkit
Correlation Analysis
Seasonality
Indicators & Data API
‍
Proprietary Indicators & Charts
Market Data API
Strategies & Scanner
‍
50+ Trading Strategies
Smart Stock Scanner
Research Reports
‍
Research Solutions
Reports Library
Free Resources
Simple Backtest Calculator
Simple Seasonality Calculator
The Kelly Criterion Calculator
Sentiment Geo Map
Public Research Reports
Education
Sentiment Indicators
Technical Indicators
Pricing
Company
About
In the News
Testimonials
Client Success Stories
Contact
Log inLoginSign up
< BACK TO ALL REPORTS

Crossing A Flat 200-Day Average As Optimism Follows The Thrust

Jason Goepfert
2019-02-14
null

Jumping over a flat average

The S&P 500 finally closed above its 200-day average after a couple of months below. Because the decline was not that severe or long-lasting, the average was flat.

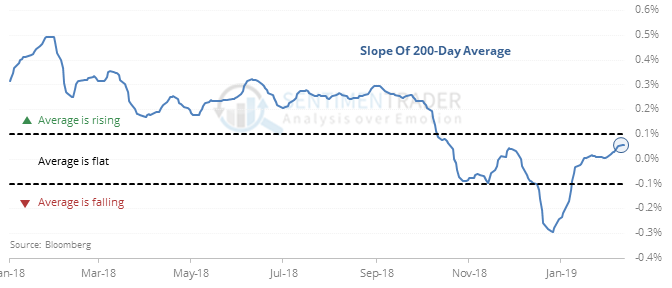
When the S&P has ended a streak below its 200-day average and that average was flat, its returns were quite a bit less positive than if the slope of the average was more negative. Across almost every time frame, the S&P was positive more often, by a greater amount, with less risk, and with more reward, when it crossed above a downward-sloping 200-day average.

Thrust, then optimism

A Zweig Breadth Thrust triggered early in January, and now we’re seeing some signs of returning optimism. When that has happened other times since 1970, stocks mostly kept grinding higher, though the next couple of months were choppy. In the short-term, returns were mostly good, but by two months later, the overall bias was negative, including 7 of the last 9 signals.

Overbought in a downtrend

The McClellan Oscillator for the Shanghai Composite has crossed above 50 while the index is still below its declining 200-day moving average.

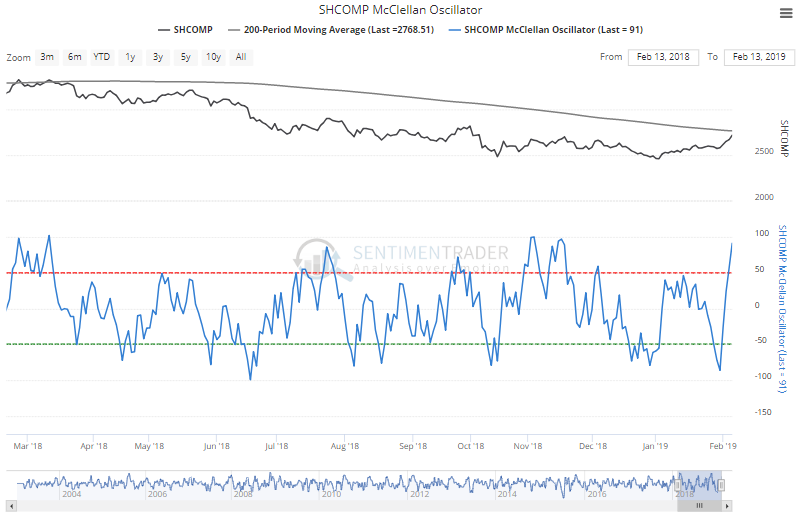
According to the Backtest Engine, since 2003 that has led to a further gain for the Shanghai over the next month only 40% of the time, with an average return of -0.6%.

Longer-term thrust

Breadth momentum has been so positive for tech that the McClellan Summation Index has soared above +1250. This has led to negative returns for the XLK fund over the next 1-2 weeks, but a year later it was higher 95% of the time by an average of 16.3%.

This post was an abridged version of our previous day's Daily Report. For full access, sign up for a 30-day free trial now.

PRODUCTS
SentimenTrader
Trading Tools
Indicators & Data API
‍
Strategies & Scanner
‍
Research Reports
FREE
RESOUrCES
Simple Backtest
Calculator
Simple Seasonality
Calculator
The Kelly Criterion
Calculator
Sentiment Geo Map
‍
Public Research Reports
‍
Education
Sentiment Indicators
‍
Technical Indicators
‍
Pricing
Bundle pricing
‍
FAQ
‍
Announcements
‍
COMPANY
‍
About
‍
In the News
‍
Testimonials
‍
Client Success Stories
CONTACT
‍
General Inquiries
‍
Media Inquiries
‍
Financial Professionals Inquiries
‍
© 2025 Sundial Capital Research Inc. All rights reserved.
Setsail Marketing
TermsPrivacyAffiliate Program
Risk Disclosure: Futures and forex trading contains substantial risk and is not for every investor. An investor could potentially lose all or more than the initial investment. Risk capital is money that can be lost without jeopardizing ones’ financial security or life style. Only risk capital should be used for trading and only those with sufficient risk capital should consider trading. Past performance is not necessarily indicative of future results.

Hypothetical Performance Disclosure: Hypothetical performance results have many inherent limitations, some of which are described below. No representation is being made that any account will or is likely to achieve profits or losses similar to those shown; in fact, there are frequently sharp differences between hypothetical performance results and the actual results subsequently achieved by any particular trading program. One of the limitations of hypothetical performance results is that they are generally prepared with the benefit of hindsight. In addition, hypothetical trading does not involve financial risk, and no hypothetical trading record can completely account for the impact of financial risk of actual trading. for example, the ability to withstand losses or to adhere to a particular trading program in spite of trading losses are material points which can also adversely affect actual trading results. There are numerous other factors related to the markets in general or to the implementation of any specific trading program which cannot be fully accounted for in the preparation of hypothetical performance results and all which can adversely affect trading results.

Testimonial Disclosure: Testimonials appearing on this website may not be representative of other clients or customers and is not a guarantee of future performance or success.