Products
SentimenTrader Trading Tools
‍
Backtest Engine
My Trading Toolkit
Correlation Analysis
Seasonality
Market Prediction
Indicators & Data API
‍
Proprietary Indicators & Charts
Market Data API
Strategies & Scanner
‍
50+ Trading Strategies
Smart Stock Scanner
Smart Option Scanner
Research Reports
‍
Research Solutions
Reports Library
Free Resources
Simple Backtest Calculator
Simple Seasonality Calculator
The Kelly Criterion Calculator
Sentiment Geo Map
Public Research Reports
Education
Sentiment Indicators
Technical Indicators
Pricing
Company
About
In the News
Testimonials
Client Success Stories
Contact
Log inLoginSign up
< BACK TO ALL REPORTS

Crosscurrents in utilities

Jay Kaeppel
2024-05-14
Utilities bottomed out in October 2023 and took flight in the last month. While earlier heavy insider buying portends a further advance, a recent spike in trader bullishness threatens to slow the rally down.

Key points

  • Utility stocks have enjoyed a sharp advance following a period of exceptionally strong insider buying
  • However, an unfavorable sentiment warning sign has now flashed
  • The message may be less "sell everything now" and more "adjust your expectations and pay close attention to price action"

Utilities rally after insiders load up

The chart below shows that the Utilities Select SPDR ETF (XLU) had spent roughly six years in a trading range before launching a strong rally in recent months. 

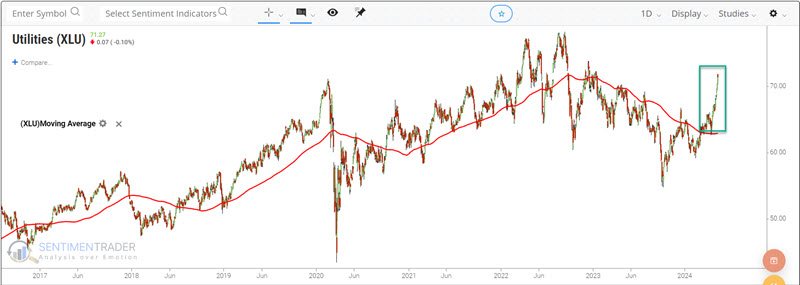
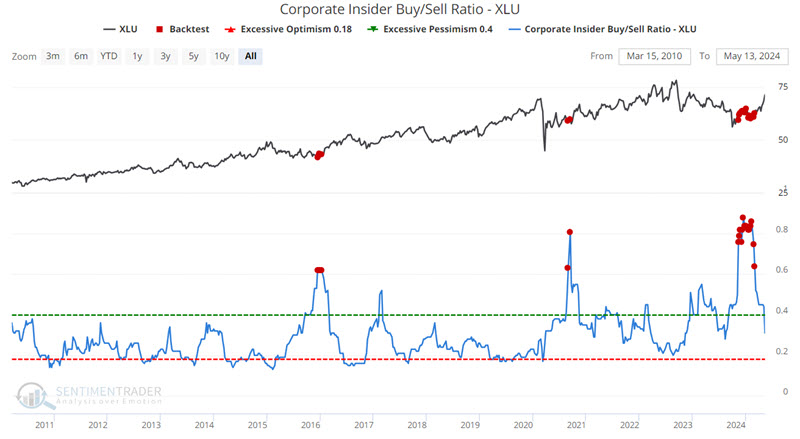
Does this rally have legs? It could. Several favorable signs began to flash last fall before the final decline to the October 2023 low. Likewise, utility industry corporate insiders went on a significant buying spree earlier this year. This type of activity tends to portend favorable industry action for one to three years. 

But nothing is ever easy in the markets. The historical results following similar Optix performance suggest something completely different.

...but the bulls rushing in may be a signal to lower expectations

The chart below highlights with a red dot all dates when our XLU Optix indicator crossed above 96. This suggests rampant bullishness among investors towards the utility sector.

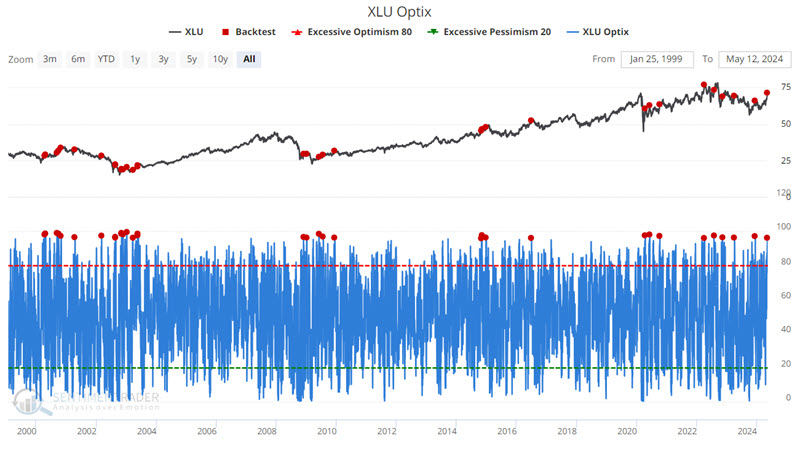
Does this portend that the party is over and that all utility stocks should be sold? Not necessarily. But it does suggest that the rally may have gotten ahead of itself and that investors would do well to adjust their expectations in the months ahead.

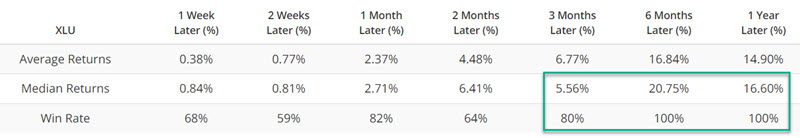
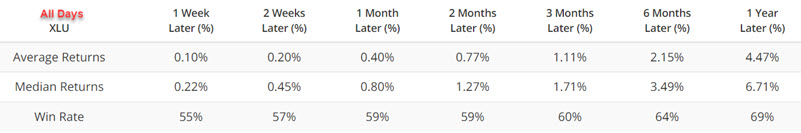
The table below displays a summary of XLU performance for ALL trading days since the inception of XLU trading in 2000. Note the positive median returns and Win Rates of 55% and higher for all time frames.

Compare that to the numbers below, which summarize XLU's performance following the red dot days highlighted in the chart above. 

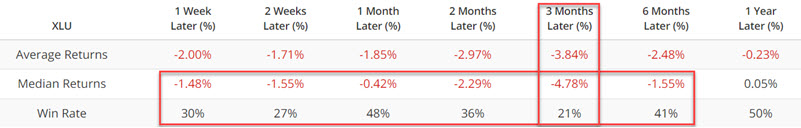
Win Rates are lower across the board, Median Returns are negative through six months, and the 3-month Win Rate is just 21%. These results suggest that current utility investors prepare for some choppiness in the months ahead and that a better buying opportunity may await those looking to enter the utility sector.

What the research tells us…

Will the insiders be correct as we witness a continued uptrend in utilities? Or have overly optimistic traders thrown a monkey wrench into the works? Given the diametrically opposed outlooks of the indicators above, paying close attention to price action is the best advice.

PRODUCTS
SentimenTrader
Trading Tools
Indicators & Data API
‍
Strategies & Scanner
‍
Research Reports
FREE
RESOUrCES
Simple Backtest
Calculator
Simple Seasonality
Calculator
The Kelly Criterion
Calculator
Sentiment Geo Map
‍
Public Research Reports
‍
Education
Sentiment Indicators
‍
Technical Indicators
‍
Pricing
Bundle pricing
‍
FAQ
‍
Announcements
‍
COMPANY
‍
About
‍
In the News
‍
Testimonials
‍
Client Success Stories
CONTACT
‍
General Inquiries
‍
Media Inquiries
‍
Financial Professionals Inquiries
‍
© 2026 Sundial Capital Research Inc. All rights reserved.
Setsail Marketing
TermsPrivacyAffiliate Program
Risk Disclosure: The information and tools provided are for research and analytical purposes only and are not intended as investment advice. Market analysis involves uncertainty, and outcomes may differ from expectations. Users should conduct their own due diligence and consider their individual circumstances before making any financial decisions. Past performance is not necessarily indicative of future results.

Hypothetical Performance Disclosure: Hypothetical performance results have many inherent limitations, some of which are described below. No representation is being made that any account will or is likely to achieve profits or losses similar to those shown; in fact, there are frequently sharp differences between hypothetical performance results and the actual results subsequently achieved by any particular trading program. One of the limitations of hypothetical performance results is that they are generally prepared with the benefit of hindsight. In addition, hypothetical trading does not involve financial risk, and no hypothetical trading record can completely account for the impact of financial risk of actual trading. for example, the ability to withstand losses or to adhere to a particular trading program in spite of trading losses are material points which can also adversely affect actual trading results. There are numerous other factors related to the markets in general or to the implementation of any specific trading program which cannot be fully accounted for in the preparation of hypothetical performance results and all which can adversely affect trading results.

Testimonial Disclosure: Testimonials appearing on this website may not be representative of other clients or customers and is not a guarantee of future performance or success.