
Crosscurrents in the energy sector

Key Points
- The energy sector is trending sharply higher, and this trend could continue indefinitely as inflation remains high and global energy supplies remain a question mark
- That said, there are some crosscurrents building in the energy sector
- Green light: Component correlation is high, which tends to be bullish
- Yellow light: Seasonality is slightly favorable, but only for a short while longer; It will then turn decidedly more unfavorable in the 2nd half of the year
- Red light: Energy sector corporate insiders have been selling shares heavily of late; this tends to bode ill for energy shares
Green light: Component correlation
XLE component correlation shows the correlation among the S&P 500 Energy sector members. Typically, high correlation is a favorable sign. Oddly, peak correlation typically occurs when a sector is falling hard, and group-think causes investors to dump all stocks in the sector indiscriminately. In the case of energy, pretty much every energy-related stock benefits as the sector has been essentially the only safe haven during the recent stock market selloff.
The chart below displays ticker XLE and highlights each time the XLE Component Correlation has crossed above 0.86 for the first time in six months. The table below that shows XLE performance following previous signals.
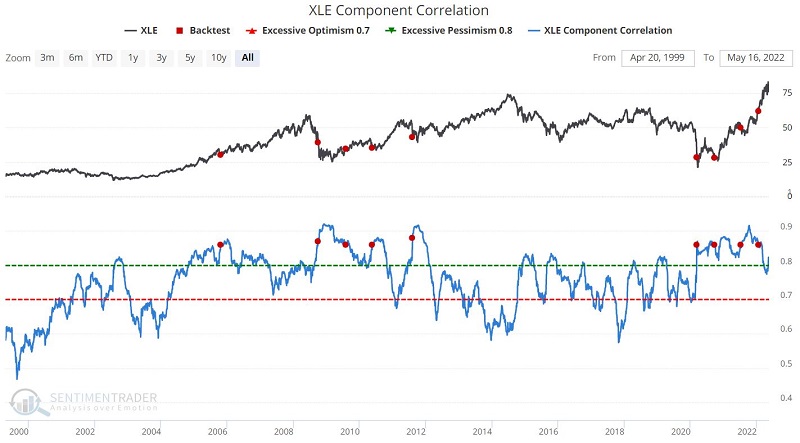
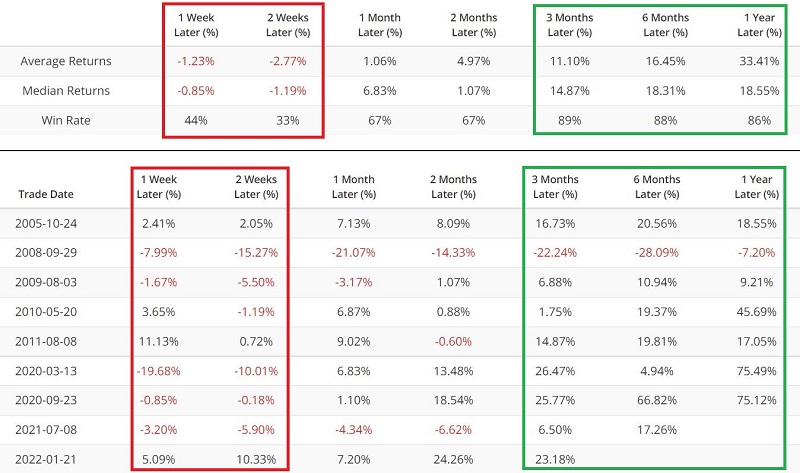
These results show a tendency for weakness during the first two weeks after a signal but for significant strength three to twelve months out. This offers investors a quantifiable reason to continue to ride the trend as energy stocks attempt to break out to new highs.
Yellow light: Seasonality
Historically, the energy sector has been one of the more reliably cyclical sectors - showing strength in the 2nd quarter and weakness - often significant - in the second half of the year.
The chart below displays the annual seasonal trend for XLE.
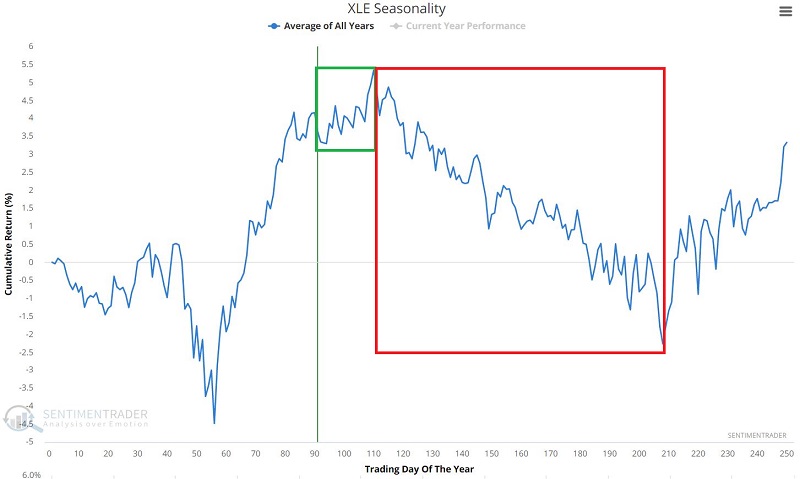
The seasonally favorable period runs through June 11th and the unfavorable period runs into mid-October. However, one must remember that seasonality is "climate, not weather" and that the chart above is NOT a roadmap but merely a visual representation of the average of years in the past.
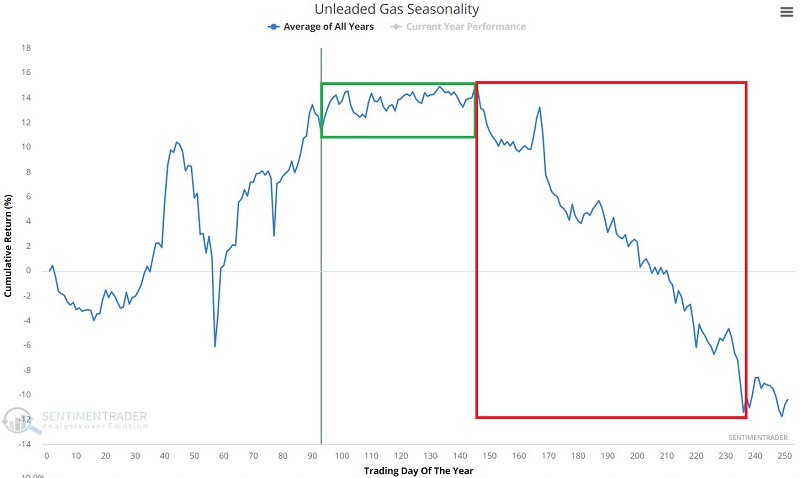
One other seasonal item to note involves unleaded gasoline - which is presently soaring to new highs. Traders would be wise to keep an eye on unleaded gas in the months ahead for an additional clue. The chart below displays the annual seasonal trend for unleaded gas futures. Here too, price weakness is typical in the second half of the year. Unleaded has declined between late July and early January in 23 of the past 30 years (77% of the time).
Red light: Insider selling
Corporate insiders of the companies held by ticker XLE have been doing a lot of selling in recent months. The chart below displays those weeks when our Corporate Insider Sells - XLE indicator showed a reading of 90 or above. The table below that displays a summary of XLE performance following such readings.
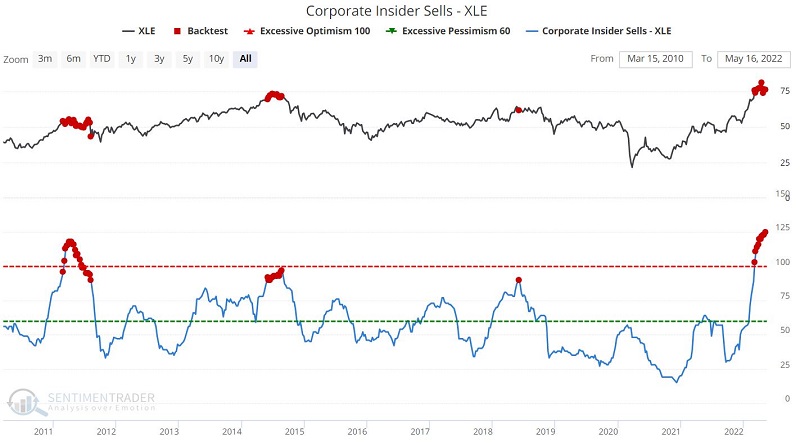
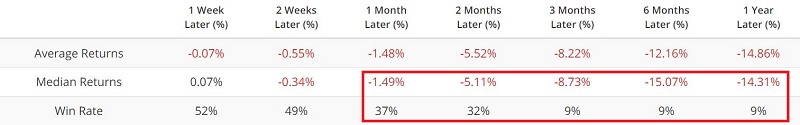
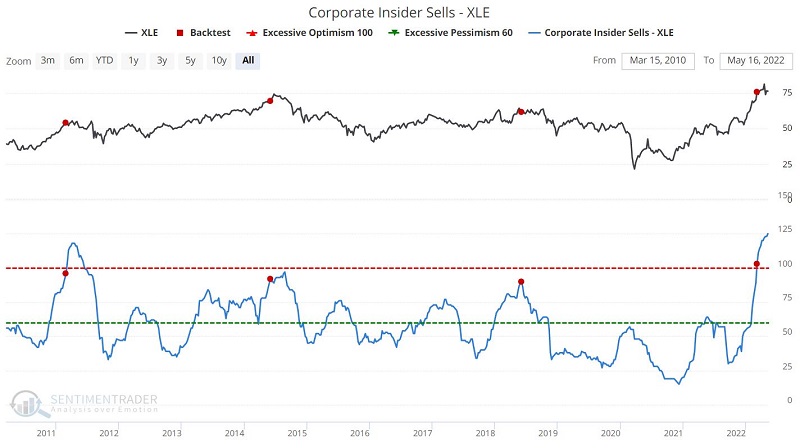
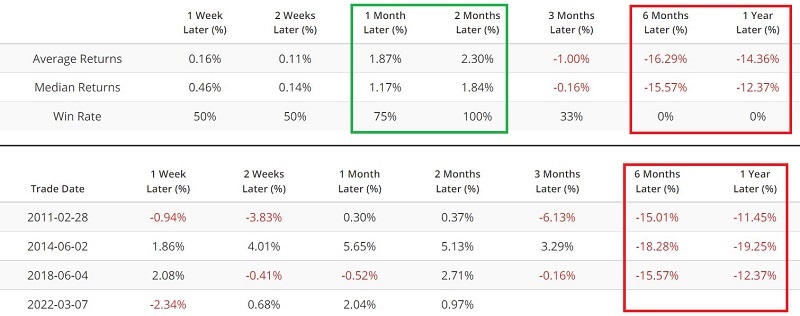
Talk about a crosscurrent. While the component correlation indicator above suggests bright prospects for energy in the next 6-12 months, the level of insider selling is much more foreboding. If we look only at XLE performance following the first-time insider selling crossed above 90 in the latest six months, the results are even more ominous, as shown in the screenshots below.
What the research tells us…
If there is one thing all investors hate, it is contradictory signs. All investors crave some sense of certainty (even if that certainty is, in reality, illusional). In the energy sector, getting too comfortable one way or the other might be a mistake.
Given the current strength in the market and the favorable outlook based on stock correlations, there appears to be little reason for energy sector stockholders to unload their shares at this juncture. Nevertheless, given the heavy selling by insiders and the fact that the seasonal window will turn unfavorable in the months ahead, the best suggestion might be:
Jay's Trading Maxim #18: Follow the trend, but DO NOT fall in love with the trend.