Products
SentimenTrader Trading Tools
‍
Backtest Engine
My Trading Toolkit
Correlation Analysis
Seasonality
Market Prediction
Indicators & Data API
‍
Proprietary Indicators & Charts
Market Data API
Strategies & Scanner
‍
50+ Trading Strategies
Smart Stock Scanner
Smart Option Scanner
Research Reports
‍
Research Solutions
Reports Library
Free Resources
Simple Backtest Calculator
Simple Seasonality Calculator
The Kelly Criterion Calculator
Sentiment Geo Map
Public Research Reports
Education
Sentiment Indicators
Technical Indicators
Pricing
Company
About
In the News
Testimonials
Client Success Stories
Contact
Log inLoginSign up
< BACK TO ALL REPORTS

Crosscurrents in energies updated

Jay Kaeppel
2022-06-02
Energy remains the red-hot sector in the stock market. The good news is that several reliable indicators suggest the possibility of still higher prices. The bad news is that several other useful indicators are flashing more cautionary signals. Which side will prevail? Take a look inside and decide for yourself.

Key Points

  • The energy sector has been the top-performing sector in the last year by a country mile
  • The question on everyone's lips is, "can it continue?"
  • The good news is that "Yes, it can."
  • The bad news is that there are a few reasons to expect a cooling period
  • We report, you decide
  • This article is a follow up to this piece

The Good News - Part 1: XLE Optix

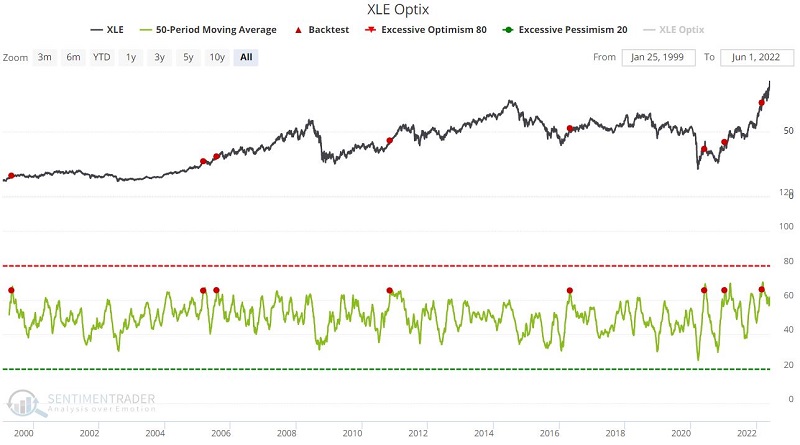
Traditionally low Optix readings indicate too much bearishness and are typically considered favorable, and vice versa. There are some quirky exceptions. Energy is an often "unloved" sector for various reasons, and as such, one can see unfavorable sentiment readings for extended periods. One of the better times to pay attention to energy sentiment is when it begins to pick up.

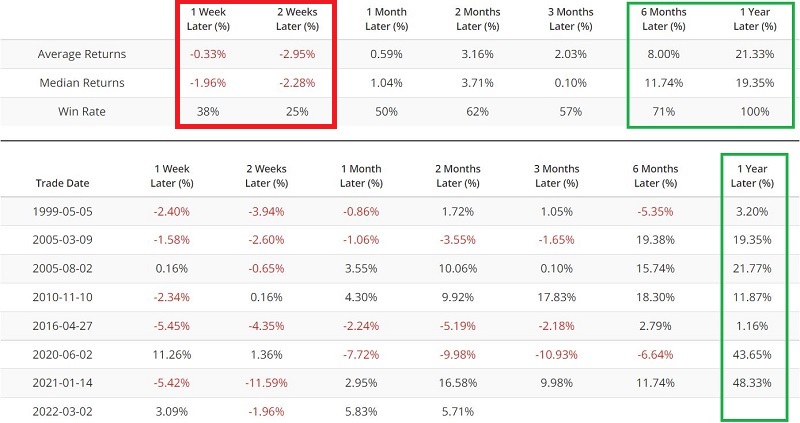
The chart below displays all days when the 50-day average for XLE (Energy Select Sector SPDR Fund) Optix crosses above 65.5 for the first time in three months. The table below displays a summary of the results.

The Good News - Part 2: XLE Component Correlation

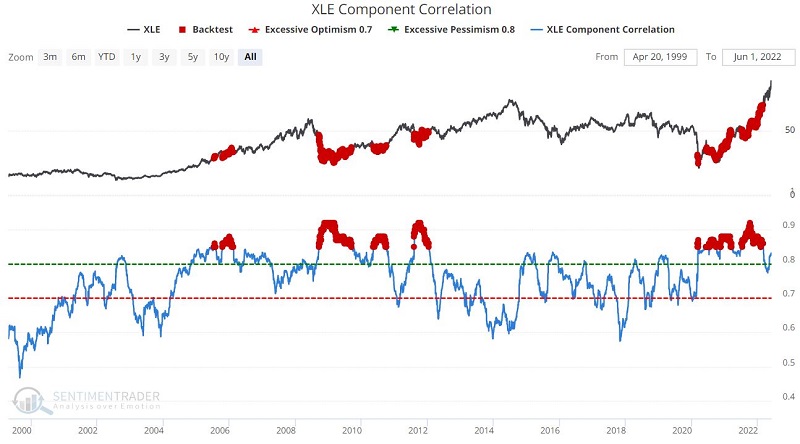
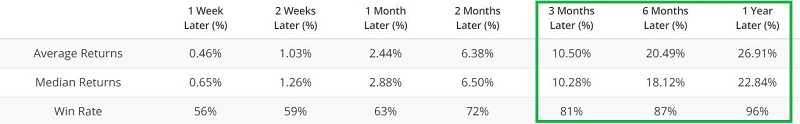
Component correlation measures the degree to which the stocks that comprise an index trend together. High readings are considered favorable. The chart below displays all days when the XLE Component Correlation was above 0.85. The table below displays a summary of the results.

So far, so good. The future continues to look bright for energy, right? For the sake of argument, let's consider two reasons for pause.

The Bad News - Part 1: Corporate Insider Sells - XLE

The chart below displays those times when our Corporate Insider Sells - XLE indicator was above 89. The table below displays a summary of the results.

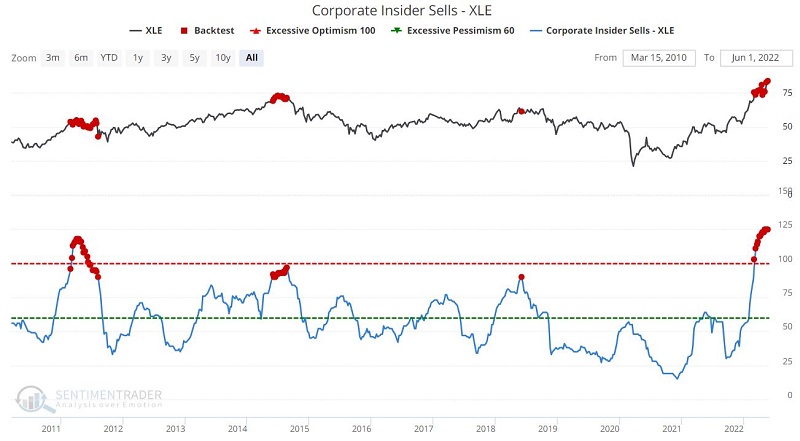
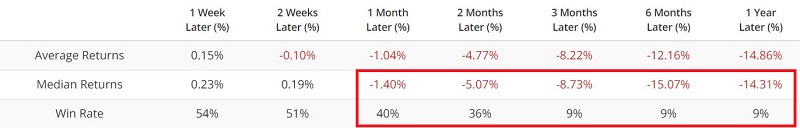
These results are essentially diametrically opposed to those above. Something has to give.

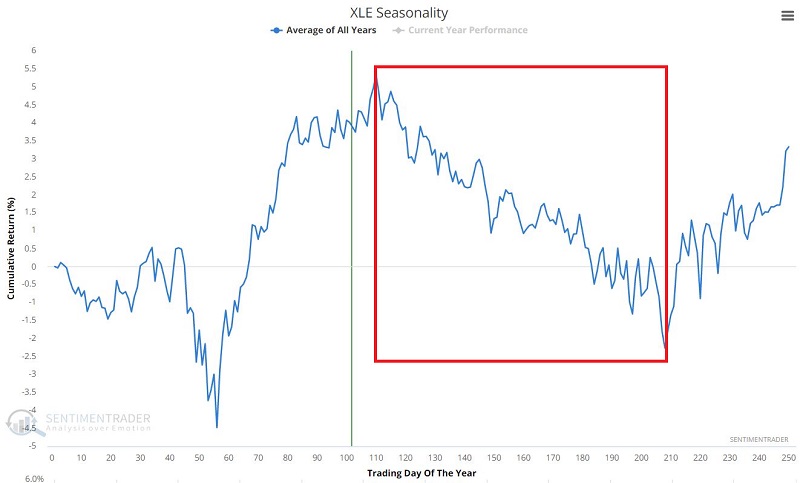
The Bad News - Part 2: XLE Seasonality

The chart below displays the annual seasonal for ticker XLE. We are fast approaching the unfavorable part of the year - extending from Trading Day of Year #110 through Trading Day of Year #208.

The chart below displays the growth of $1 invested I XLE only from TDY #110 through TDY #208 every year since 1999.

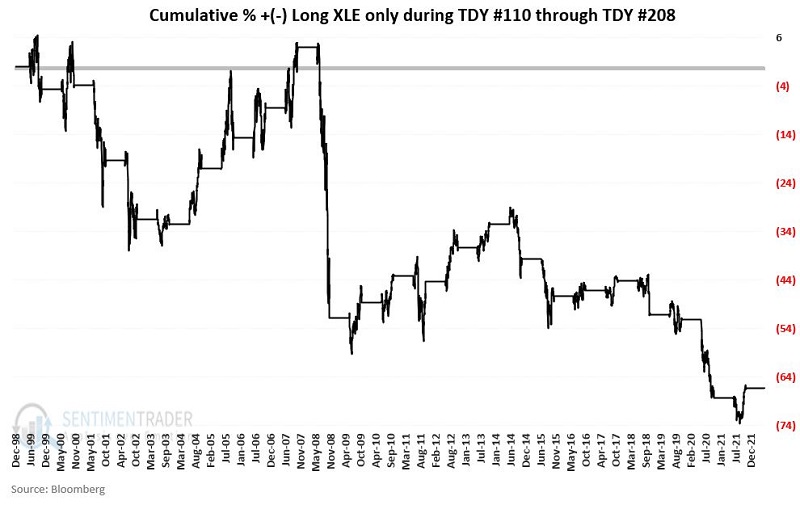
Results are somewhat skewed by the -53% and -34% declines suffered in 2008 and 2020. Overall results are essentially year inconsistent and uninspiring at best.

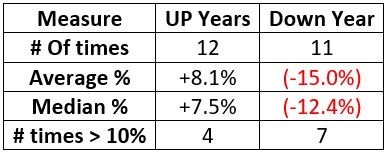
What the research tells us…

Based on the first two items above, traders looking to "join the party" in energy may do so but should have a clear-cut trading plan for taking profits and cutting losses. Based on the last two items, investors with significant gains in energy stocks might start making plans to lock in some of those gains if the sector runs out of steam.

PRODUCTS
SentimenTrader
Trading Tools
Indicators & Data API
‍
Strategies & Scanner
‍
Research Reports
FREE
RESOUrCES
Simple Backtest
Calculator
Simple Seasonality
Calculator
The Kelly Criterion
Calculator
Sentiment Geo Map
‍
Public Research Reports
‍
Education
Sentiment Indicators
‍
Technical Indicators
‍
Pricing
Bundle pricing
‍
FAQ
‍
Announcements
‍
COMPANY
‍
About
‍
In the News
‍
Testimonials
‍
Client Success Stories
CONTACT
‍
General Inquiries
‍
Media Inquiries
‍
Financial Professionals Inquiries
‍
© 2026 Sundial Capital Research Inc. All rights reserved.
Setsail Marketing
TermsPrivacyAffiliate Program
Risk Disclosure: The information and tools provided are for research and analytical purposes only and are not intended as investment advice. Market analysis involves uncertainty, and outcomes may differ from expectations. Users should conduct their own due diligence and consider their individual circumstances before making any financial decisions. Past performance is not necessarily indicative of future results.

Hypothetical Performance Disclosure: Hypothetical performance results have many inherent limitations, some of which are described below. No representation is being made that any account will or is likely to achieve profits or losses similar to those shown; in fact, there are frequently sharp differences between hypothetical performance results and the actual results subsequently achieved by any particular trading program. One of the limitations of hypothetical performance results is that they are generally prepared with the benefit of hindsight. In addition, hypothetical trading does not involve financial risk, and no hypothetical trading record can completely account for the impact of financial risk of actual trading. for example, the ability to withstand losses or to adhere to a particular trading program in spite of trading losses are material points which can also adversely affect actual trading results. There are numerous other factors related to the markets in general or to the implementation of any specific trading program which cannot be fully accounted for in the preparation of hypothetical performance results and all which can adversely affect trading results.

Testimonial Disclosure: Testimonials appearing on this website may not be representative of other clients or customers and is not a guarantee of future performance or success.