
Crosscurrents - and potential opportunities - in EWZ

Key points
- The iShares MSCI Brazil ETF (EWZ) is facing a variety of factors with significantly differing outlooks
- Seasonality in the next two months is unfavorable - EXCEPT for one brief period when it is favorable
- Two variations of the Copper/Gold Ratio applied to EWZ are offering seemingly diametrically opposed signals
- This two-way tension suggests potential trading opportunities (long and short) for active traders
The seasonal backdrop for EWZ in the months ahead
The chart below highlights the annual seasonal trend for ticker EWZ.
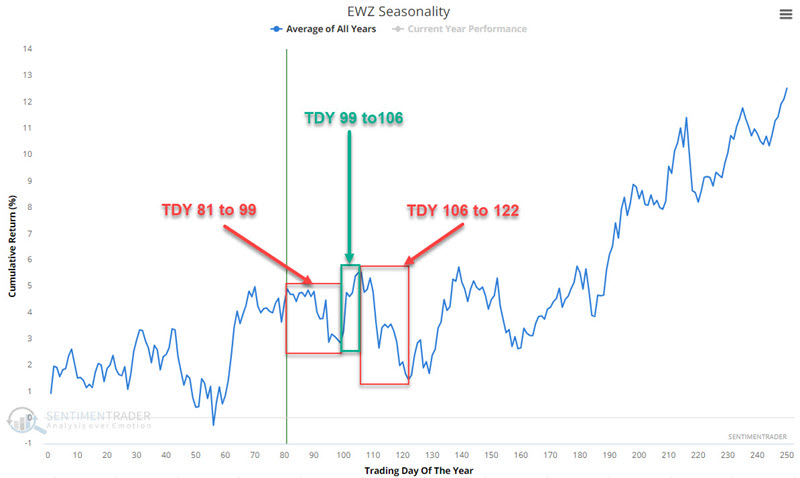
Note that two periods - from Trading Day of the Year (TDY) #81 through #99 and TDY #106 to #122 - are unfavorable. The period between TDY #99 and #106 is favorable. For 2024, these periods are (from the close on the dates below):
#81 through #99: 2024-04-26 through 2024-05-22
#99 through #106: 2024-05-22 through 2024-06-03
#106 through #122: 2024-06-03 through 2024-06-26
Let's first look at EWZ's performance during the purportedly favorable TDY #99 to TDY #106 period. The chart below displays the hypothetical growth of $1 invested in EWZ only during this period since its inception in 2001.
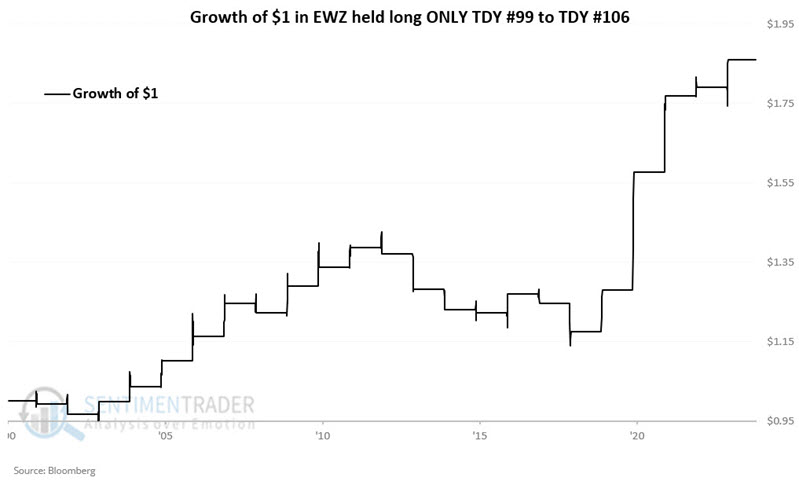
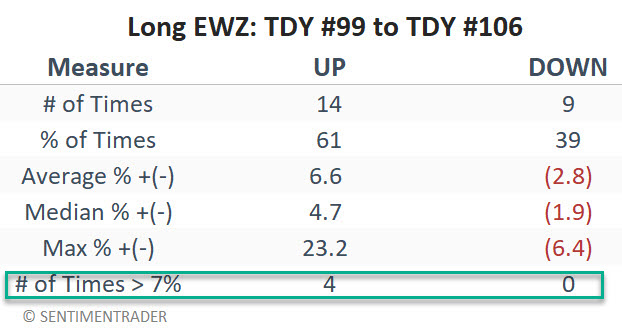
The cumulative gain is +86.0%. The table below summarizes EWZ's performance during this brief annual period.
Let's consider EWZ's performance during the two unfavorable periods combined. The chart below displays the hypothetical growth of $1 invested in EWZ only during both unfavorable periods every year since inception in 2001.
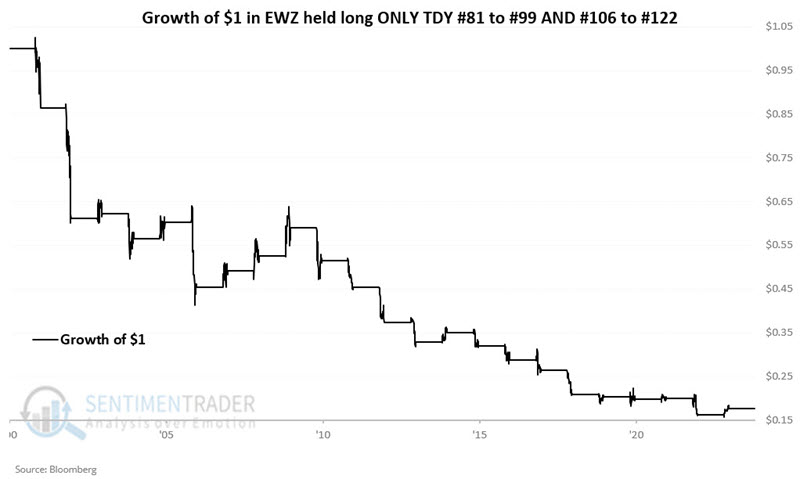
The cumulative loss from holding EWZ only during these two periods each year is -82.4%. This suggests a potential opportunity playing the short side of EWZ shares or via put options on ticker EWZ.
The table below summarizes EWZ's performance during these combined periods.
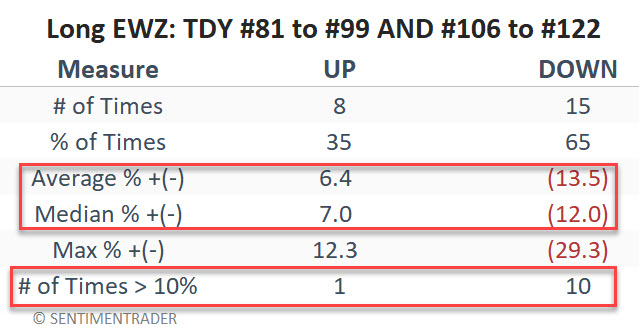
One key statistic to note is ten losses of -10% or more versus just one gain greater than +10%.
Conflicting signals from the Copper/Gold Ratio
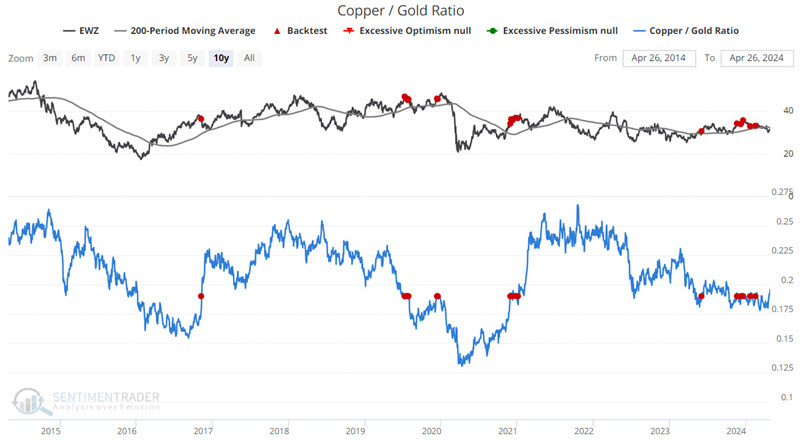
The chart below marks with a red dot those dates when the Copper/Gold Ratio crossed above 0.19 while ticker EWZ was ABOVE its 200-day moving average. Note that there were no signals before 2016, so the chart highlights only the last ten years of data.
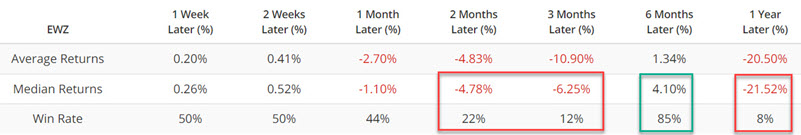
The table below summarizes EWZ performance following these signals and highlights an odd anomaly. Performance was abysmal for 2-month, 3-month, and 1-year holding periods, BUT a 6-month holding period showed a gain 85% of the time. Given that the last signal was on 2024-02-16, this suggests the potential for a rally in EWZ into mid-August (presumably followed by a significant decline between August 2024 and February 2025 if the history in the table above proves an accurate guide).
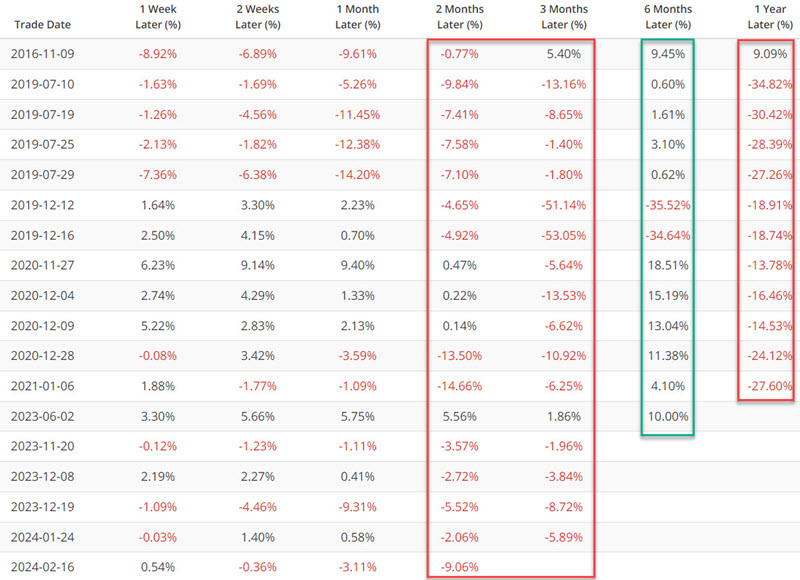
The table below displays signal-by-signal results - and highlights the same anomaly.
As if this were not perplexing enough, the chart below marks with a red dot those dates when the Copper/Gold Ratio crossed above 0.19 while ticker EWZ was BELOW its 200-day moving average, and the table highlights subsequent EWZ performance.
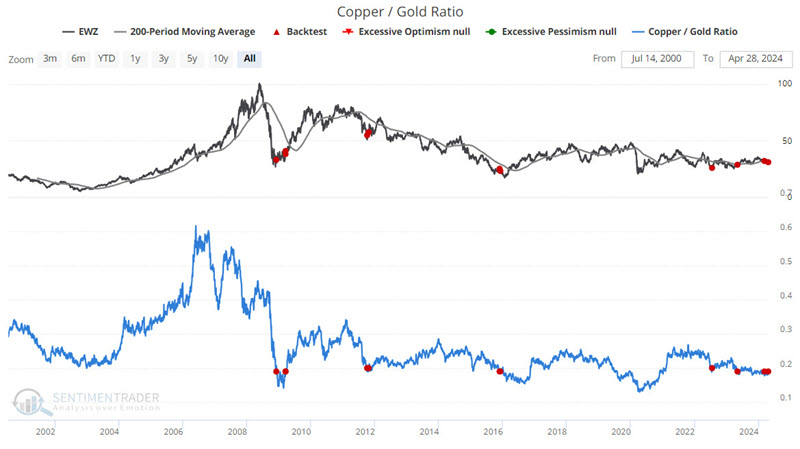
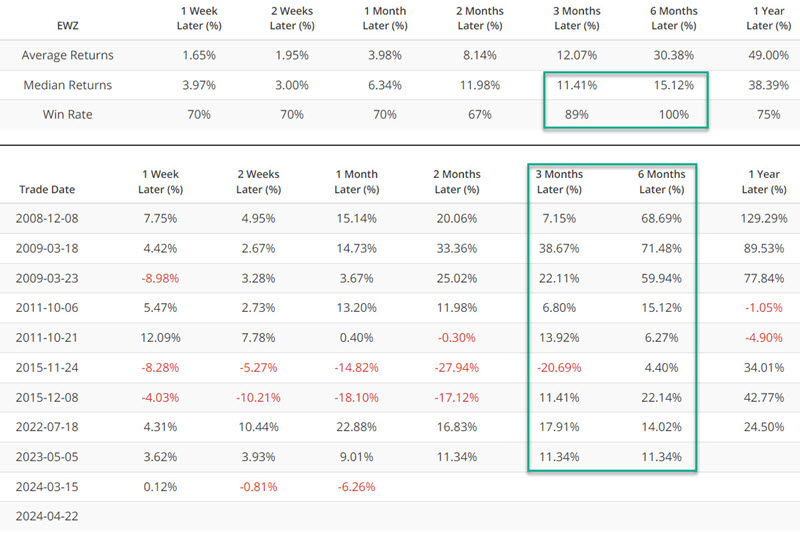
Note that the two most recent signals occurred on 2024-03-15 and 2024-04-22. Note also the extremely high Win Rates for 3-month and 6-month holding periods. This suggests the potential for a meaningful rally in EWZ over the next three to six months.
What the research tells us…
The information above has a lot of conflicting implications. The annual seasonal trend mainly suggests caution during the next several months. Meanwhile, the first version of the Copper/Gold Ratio above suggests bullishness into August 2024 but the potential for severe weakness afterward. On the other hand, the second version of the Copper/Gold Ratio suggests outright bullishness.
From our perspective, designating the outlook for EWZ as favorable or unfavorable seems like a coin flip. If anything, it looks like an opportunity for active and alert short-term traders to latch onto burgeoning trends as early as possible and ride them as long as price action persists.