
Credit spreads versus floating rate bonds

Key Points
- Floating-rate bonds can be beneficial in a rising interest-rate environment
- Treasury floating rate instruments tend to offer safety and steadiness but also relatively low returns
- Corporate floating rate instruments can offer higher returns but can be very volatile at times
- Credit spreads - which measure the yield gap between lower-graded and higher-graded debt securities - can serve as a helpful timing tool
An overview of floating rate bonds
As the name implies, a floating rate bond (or variable or adjustable rate bond) is a bond whose interest rate is adjusted periodically according to a predetermined formula; it is usually linked to an interest rate index such as LIBOR. This is different from a typical fixed-rate bond that has an interest rate that doesn't fluctuate. Floating-rate bonds can be very attractive in a rising interest-rate environment for obvious reasons.
There are two types of floating rate bonds - government-issued and corporate-issued. The good news regarding government-issued floating rate securities is their typical lack of downside volatility. The bad news is that over the long run, their overall returns are relatively low. The good news regarding corporate-issued floating-rate securities is that they offer a higher coupon rate and greater total return potential than government-issued securities. The bad news is that during a credit event or economic downturn, they can suffer sharp interim declines.
Therefore, our goal is to create a model to keep us in corporate-issued floating-rate securities only when the environment is favorable to do so.
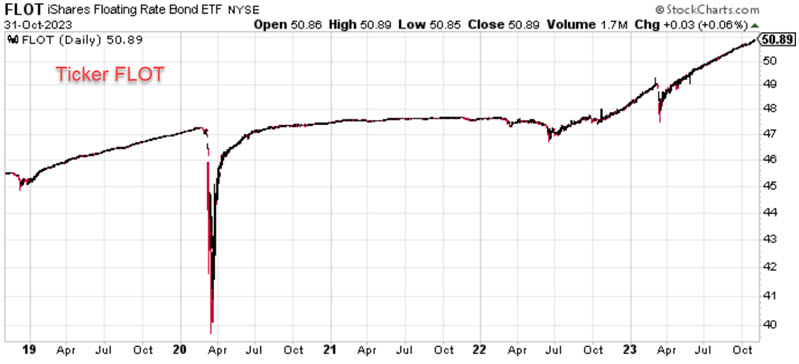
To illustrate the points above, the charts below (courtesy of StockCharts.com) display five-year weekly charts for the WisdomTree Bloomberg Floating Rate Treasury Fund ETF (ticker USFR) and the iShares Floating Rate Bond ETF (ticker FLOT). The former holds government-issued floating-rate securities, and the latter holds corporate-issued securities.
Typically, ticker FLOT will outperform during favorable periods. However, note the performance during the Covid-19 panic of 2020. Treasury-issued securities held up well, while corporate-issued securities temporarily collapsed.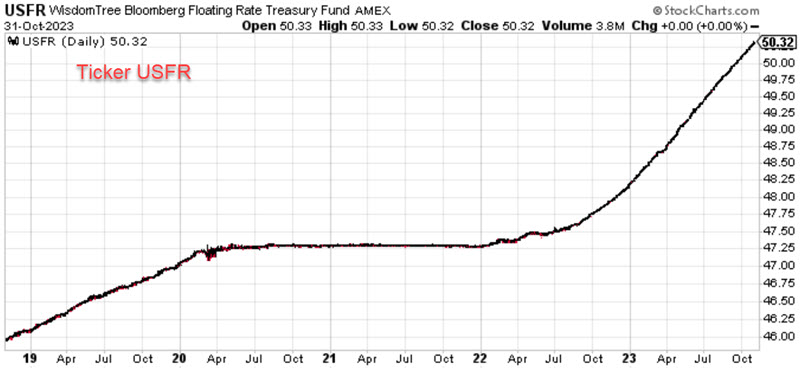
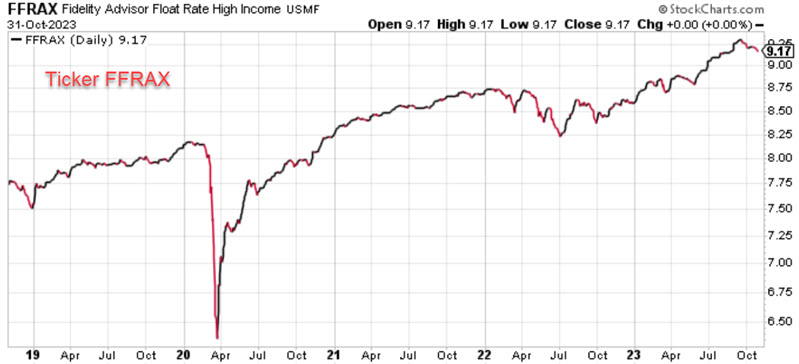
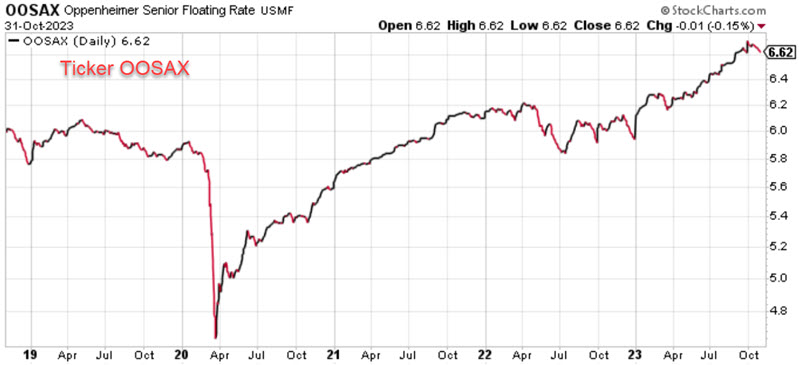
There are also many floating-rate mutual funds. The charts below display charts for the Fidelity Advisor Floating Rate High-Income fund (ticker FFRAX) and the Oppenheimer Senior Floating Rate fund (ticker OOSAX).
An overview of credit spreads
A "credit spread" measures the difference in the current yield for a lower-rated security versus a higher-rated security. The lower the rating for a given debt instrument, the higher the likelihood the issuer will default and be unable to repay all of the promised interest and principal. The higher the rating for a given debt instrument, the less likely the issuer will default and be unable to repay all of the promised interest and principal.
As a result, lower-rated debt instruments must offer a higher interest rate (i.e., yield) to attract buyers. By monitoring the level and trend of credit spreads, an investor can get a sense of the amount of fear in the market. In a sense, credit spreads in the bond market serve a similar function as the VIX Index in the stock market. Credit spreads essentially measure "fear" or disruptions in the credit markets.
When there is fear in the bond market, credit spreads will widen as buyers of lower-rated securities demand much higher yields to compensate for the (real or perceived) increase in risk. On the other hand, if things are generally calm, that demand diminishes, and credit spreads narrow.
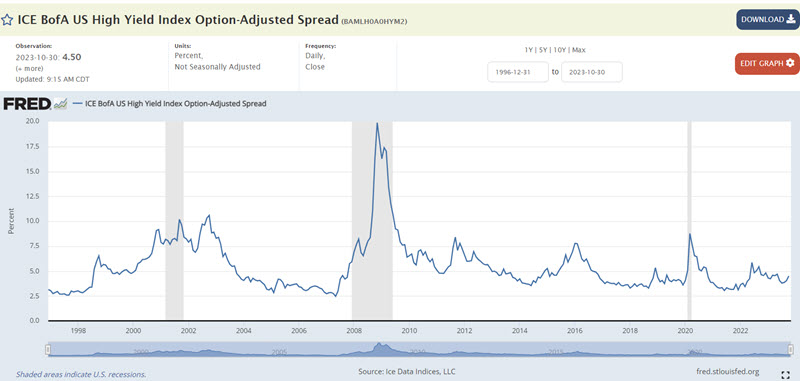
For the test below, we will use the ICE BofA US High Yield Index Option-Adjusted Spread that appears in the chart below. The "spikes" in the chart below almost invariably coincide with above-average stock market volatility and/or declines.
Creating a high-yield credit spread indicator
It is generally considered a negative for financial instruments when credit spreads rise and vice versa. To designate credit spreads as rising or falling, we will use the following calculations.
A = Latest ICE BofA US High Yield Index Option-Adjusted Spread
B = 13-week exponential moving average (EMA) of A
C = 28-week exponential moving average (EMA) of A
D = B - C (i.e., 13-week EMA minus 28-week EMA)
E = D this week minus D two weeks ago
If BOTH D and E are positive, then F = 0; else, F = +1
In plain English:
IF the 13-week EMA is below the 28-week EMA AND the difference between the two averages is below its level of two weeks ago, THEN F = +1
Variable F readings of +1 are considered favorable, and Variable F readings of 0 are considered unfavorable.
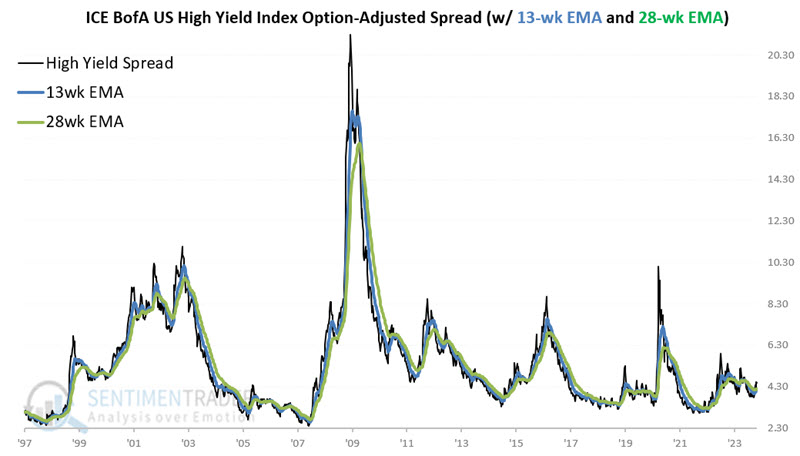
The chart below shows the ICE BofA US High Yield Index Option-Adjusted Spread, along with the 13-week and 28-week EMAs.
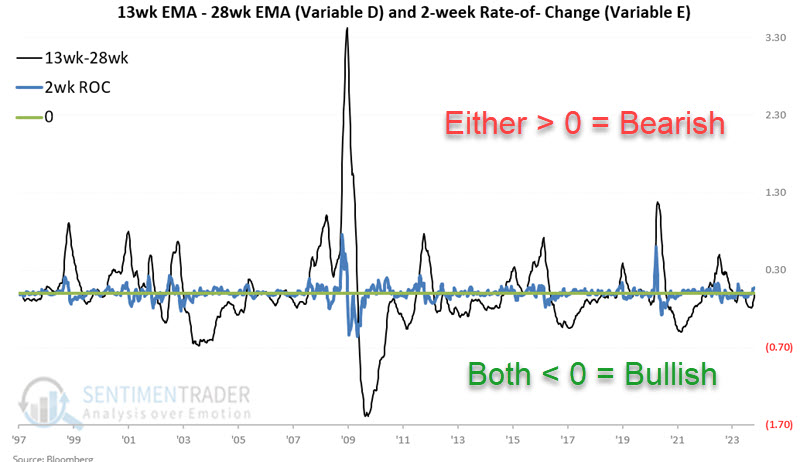
The chart below displays both Variable D and Variable E. If BOTH are negative, that is considered favorable for floating rate bonds.
Strategy Rules
If F = +1, then we will hold ticker a long position in floating rate securities
If F = 0, then we will exit floating rate securities and be flat (for this test, no interest earned is assumed when out of floating rate securities)
For this test, we will use weekly total return data for the Oppenheimer Senior Floating Rate mutual fund. This fund (ticker OOSAX) has data back to September 1999.
The results
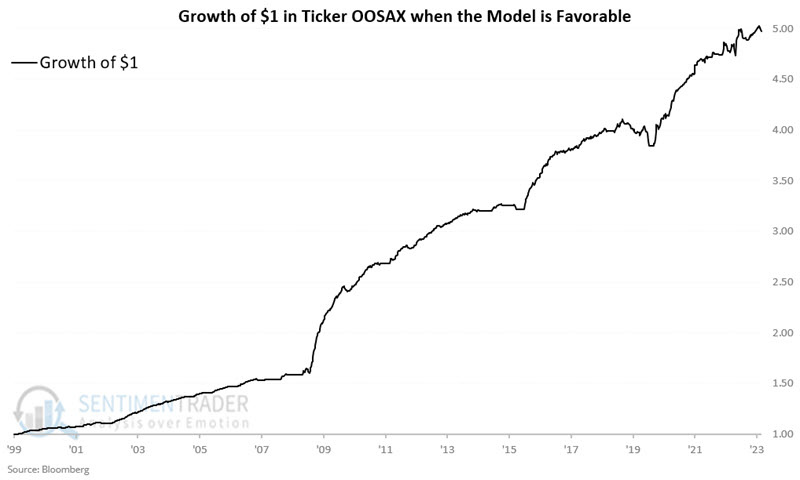
First, let's look at floating rate bond performance when the model is favorable. The chart below displays the growth of $1 invested in ticker OOSAX only when Variable F = +1. From 1998-03-27 to 2020, the hypothetical cumulative return was +397.6%.
The table below summarizes OOSAX performance when Variable F = +1.
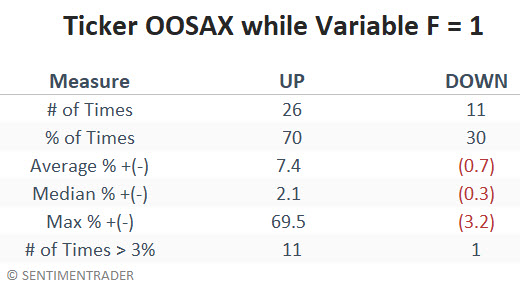
Now, let's look at floating rate bond performance when the model is unfavorable. The chart below displays the growth of $1 invested in ticker OOSAX only when Variable F = 0. From 1998-03-27 to 2020, the hypothetical cumulative return was -47.3%.
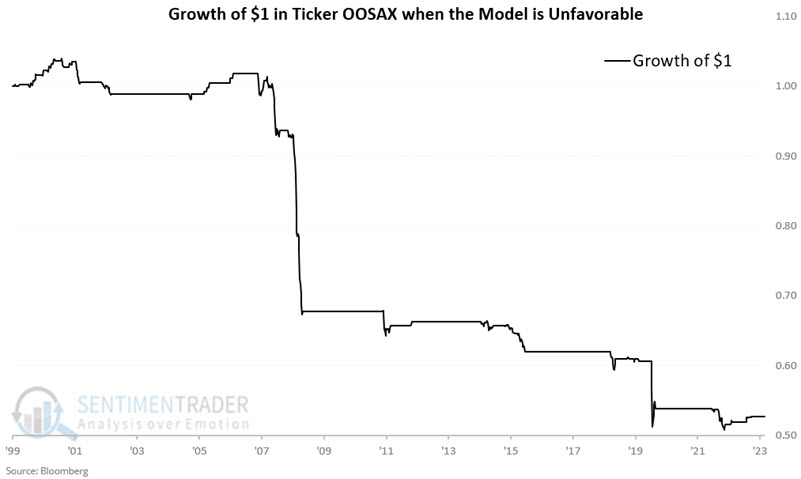
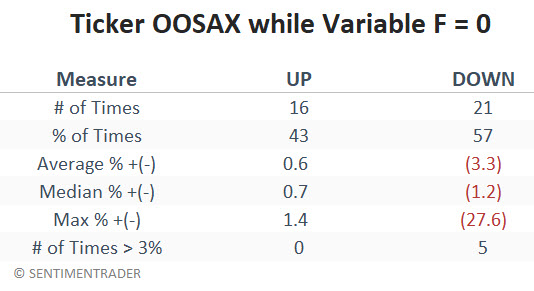
The table below summarizes OOSAX performance when Variable F = 0.
Current Status
As of 2023-10-27, the Variable stands as follows:
A = 4.50
B = 4.19
C = 4.21
D = -0.02
E = +0.07
F = +1
Variable E is greater than zero, but Variable D is less than 0. Since the indicator is only deemed unfavorable when BOTH D and E are positive, then Variable F is equal to +1, and the model is still considered favorable for floating rate bonds. However, note that Variable D could flip to positive as early as 2023-11-03, which would flip this model to unfavorable for floating rate bonds (I will issue an update if that occurs).
What the research tells us…
In a rising interest rate environment, floating rate bonds can offer income investors a way to benefit from higher rates (unlike buyers of straight bonds, which typically decline in value as interest rates rise). Corporate-issued debt offers a higher yield and the potential for greater long-term total returns. The problem is that they entail potentially much greater downside volatility than government-issued debt. The model detailed above attempts to capture the higher return while limiting the downside volatility. As always, past performance is no guarantee of future results. The model detailed above is on the cusp of once again flipping to unfavorable for floating rate bonds.