
Credit spreads moving back to the favorable side of the ledger - Part II

Key points
- Credit spreads can help highlight fear and complacency in the market
- The ICE BofA US High Yield Index Option-Adjusted Spread compares the yield on an index of bonds that are below investment grade (those rated BB or below) and treasury securities
- The current trend lends weight to the bullish case for stocks
The ICE BofA US High Yield Index Option-Adjusted Spread
The ICE BofA US High Yield Index tracks the performance of the US dollar-denominated below investment-grade rated corporate debt publicly issued in the US domestic market. The index represents the calculated spread between a computed option-adjusted spread ("OAS") index of all bonds in the ICE BofA US High Yield Index and a spot Treasury curve.
This spread tends to fluctuate very narrowly in periods of normal economic activity. However, during periods of economic stress or unusual financial market conditions, this spread will rise and can grow rapidly. Because the stock market hates uncertainty, rapid growth in this spread is often a warning sign for stock market investors. On the other hand, when the spread narrows, it tends to mark a decline in uncertainty in the financial markets and is generally favorable for stocks.
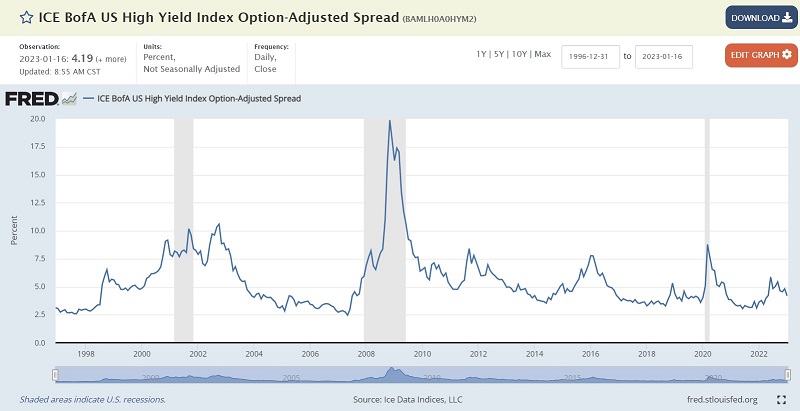
In the chart above, the grey periods represent US economic recessions. A widening spread almost invariably precedes recessions - however, not every increase in this spread is followed by a recession.
Measuring the trend in high-yield credit spreads
The data for this index can be retrieved here. We will use week-ending data for this index and the S&P 500 Index. Our calculations are as follows:
A = week-ending value for The ICE BofA US High Yield Index
B = 13-week exponential average of A
C = 28-week exponential average of A
D = (B - C)
E = Current value for D - value for D two weeks ago
In plain English, we calculate a 13-week and 28-week exponential average and take the difference between the two. A positive reading means the spread (Variable D) is widening bearish for stocks), and a negative reading means the spread is narrowing (bullish for stocks). Additionally, we see if Variable D rose or fell over the last two weeks.
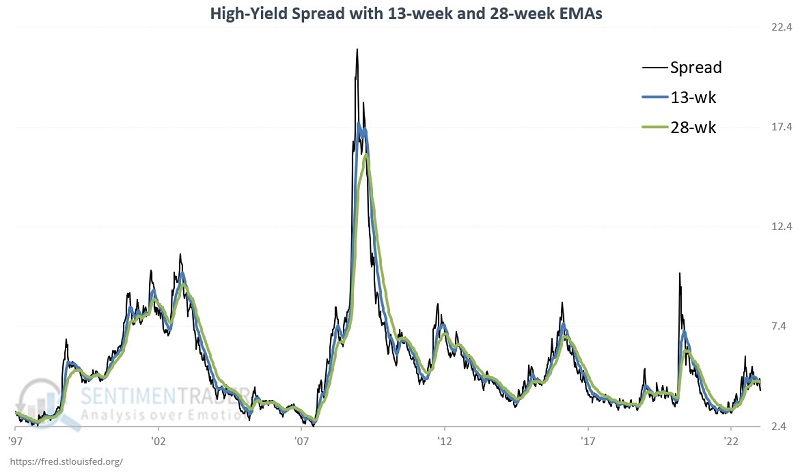
The chart below displays the yield spread along with the 13-week and 28-week exponential averages.
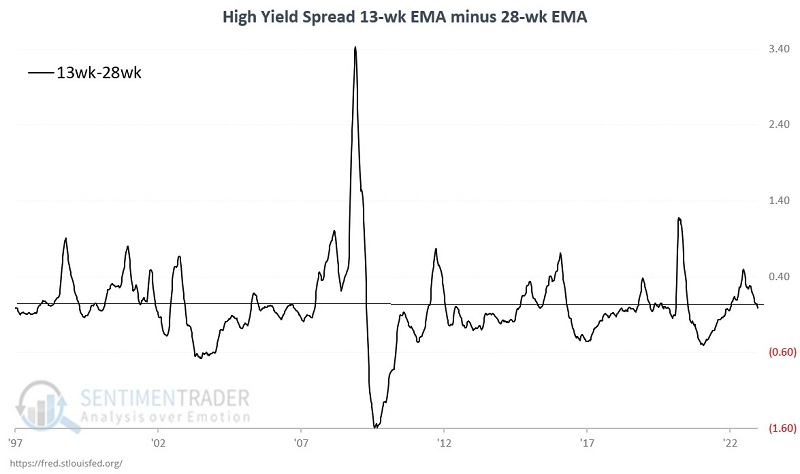
The chart below displays the difference between the 13-week and 28-week average (Value D). Note that readings above 0 are a warning sign of potentially unfavorable conditions for stocks and the overall economy. Note that this value spent much of 2022 in positive territory before recently dropping back below zero.
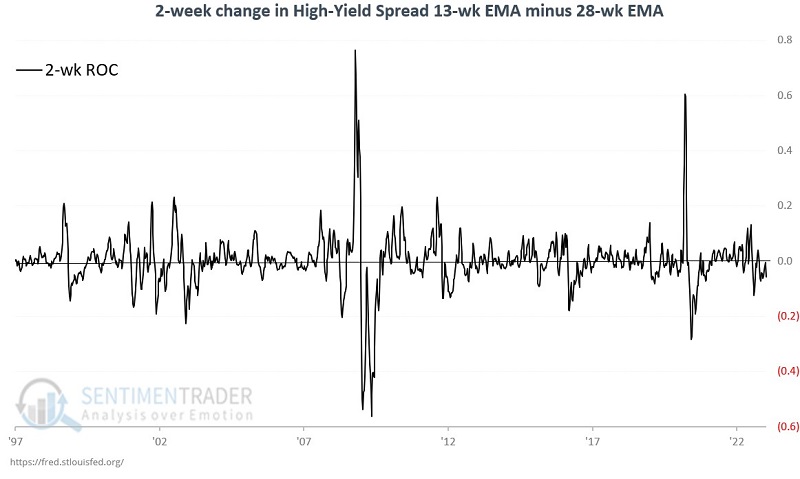
The chart below displays the two-week change in Value D. Once again, readings above 0 are a warning sign of potentially unfavorable conditions for stocks and the overall economy.
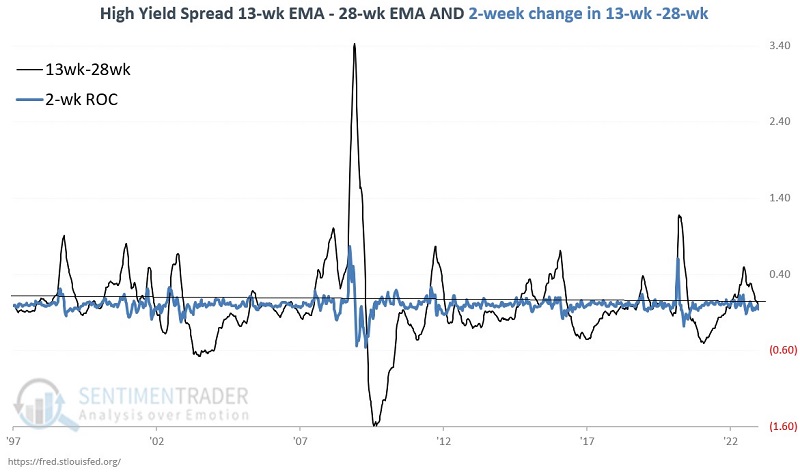
Finally, the chart below combines the previous two charts.
What really matters
This method issues a warning sign for stocks and the overall economy when Variable D and Variable E (the two lines in the chart above) are both above zero. This tells us that a) the credit spread is widening, and b) the velocity of the increase is increasing.
How the stock market reacts to widening versus tightening credit spreads
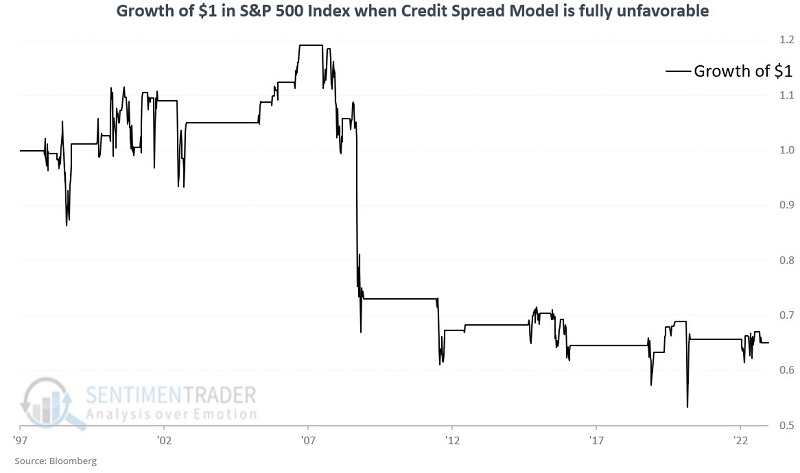
The chart below displays the hypothetical growth of $1 invested in the S&P 500 Index ONLY when both Variable D and Variable E are positive simultaneously. As you can see, the stock market can rise under these circumstances, but there is a tendency for extended choppiness and severe declines. Hence the reason this is considered to be a warning sign.
The chart below displays the hypothetical growth of $1 invested in the S&P 500 Index ONLY when EITHER Variable D or Variable E is negative.
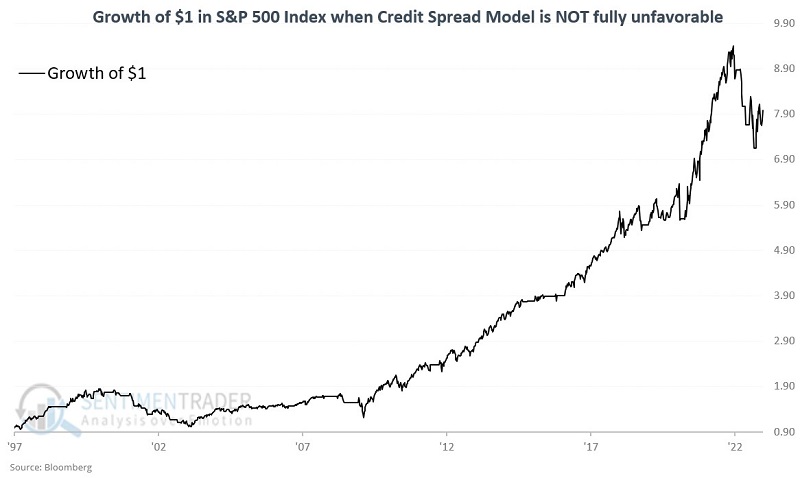
From 1/31/1997 through 1/13/2022, the S&P 500 Index lost -35%, while this model was fully unfavorable and gained +698% the rest of the time.
Where the model stands now
As of the week ending 2023-01-13, the 13-week exponential average for the High Yield credit spread detailed above is below its 28-week exponential average. In addition, the two-week change in the 13-week EMA minus the 28-week EMA is declining. So neither of the two model indicators is unfavorable. Does this mean that it is smooth sailing for stocks from here? Not necessarily. But it does signal that a potentially significant weight (I.,e., uncertainty in the credit market) has been lifted from the market's shoulders for now.
Not intended as a standalone model
It is important to note that not every indicator is meant to be used as a standalone trading system. The model has effectively identified favorable and unfavorable periods for the stock market. However, if used as a trading system (i.e., always 100% long SPX when the model is favorable and 100% cash when the model is unfavorable), a trader would have endured a drawdown of -44% during the 2000-2002 bear market, and a -24% drawdown in 2022. So note that this model's actual value is as a warning sign when both parts of the indicator are bearish. As displayed in the equity curve charts above, while the stock market may not continually advance when one or both of the model's indicators are favorable, it tends to make very little headway when both indicators are unfavorable.
What the research tells us…
Widening credit spreads can be a helpful warning sign of impending economic trouble. But not every uptick is a signal of impending doom. The key is to identify those times when the spread is widening AND doing so at an accelerating rate. Conversely, when both of those trends are not in place, it pays to give the bullish case the benefit of the doubt.