
Credit spreads moving back to the favorable side of the ledger

Key points
- Credit spreads can help highlight fear and complacency in the market
- When there is stress and uncertainty in the financial markets, credit spreads tend to widen
- One new trend in credit spreads appears to be favorable for the stock market
Credit Default Swaps
Over the past few years, one of the fastest-growing derivatives markets is that for credit default swaps (CDS). A CDS allows the various parties to swap the exposure of default of the underlying credit (i.e., bond). For example, the investor of a relatively risky bond might be uncomfortable that the bond issuer could default on their payments. To hedge that risk, the investor buys a CDS.
When they buy the CDS, the investor pays another trader (the seller) a periodic payment. That other trader then takes on the risk that the issuer of the bond will default. If that happens, the seller is responsible for paying the bond investor an agreed-upon amount. This allows the original investor to offset some of their risks and the seller to generate a stable flow of income. Of course, just like selling options, the seller of a CDS takes on possibly significant risks. As a result, when there is stress or uncertainty in the financial system, CDS sellers demand more premium from CDS buyers.
The indicator, as posted to the site (CDX Index), tracks an index created by Dow Jones which monitors the spread between credit default swaps on high-yield (i.e., junk) bonds and Treasury securities. The higher the index, the wider the spread. This means that credit investors are more and more worried about defaults and are willing to pay higher prices for default protection.
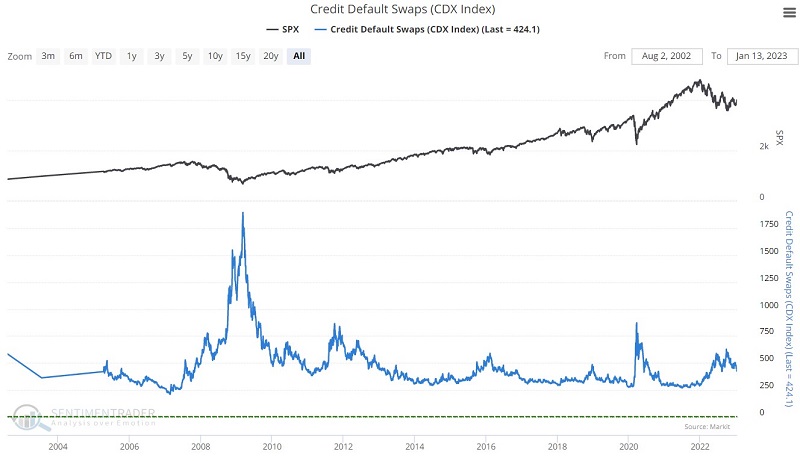
We expect it to track volatility measurements like the VIX quite closely, as times of fear should see this index spike higher, and times of complacency should become very subdued. In that sense, it is a contrary indicator.
Credit Default Swaps (CDX Index)
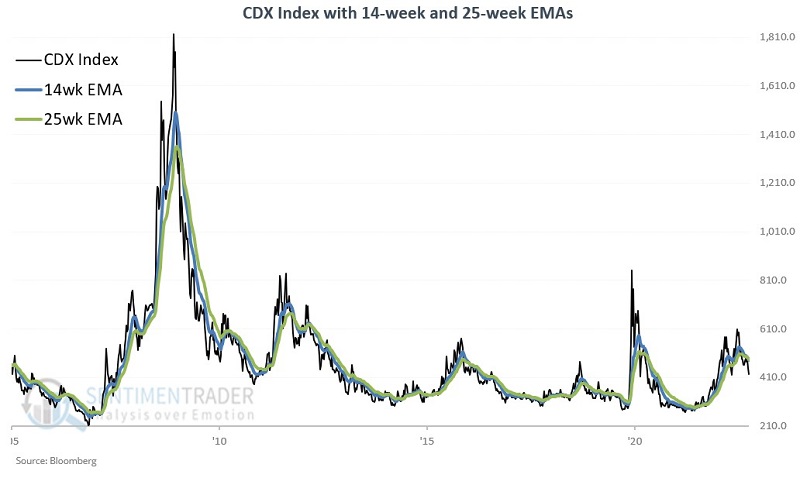
The CDX Index is a "fear gauge" that measures stress in the financial markets. As such, we expect it to rise when the stock market falls and vice versa. To track the trend of the CDX Index, we will use a 14-week and a 25-week exponential moving average. The chart below displays the CDX Index with its 14- and 25-week EMAs.
To get a better feel for how this index moves, the chart below zooms into the 2020-2023 period.
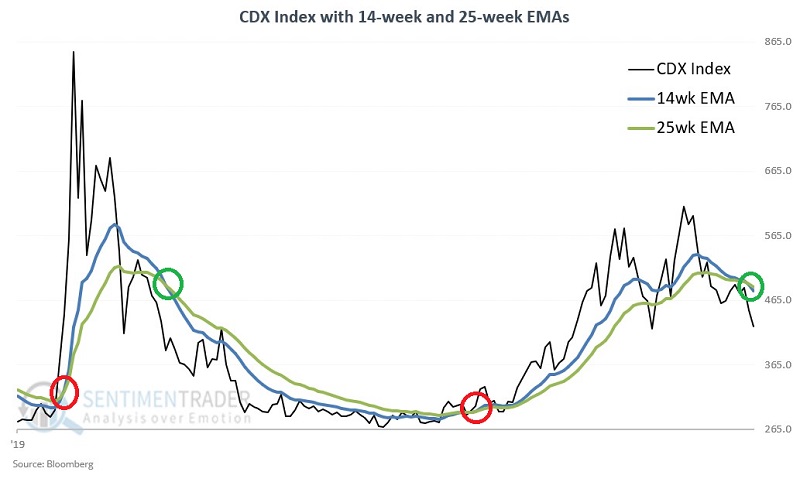
Note the spike during the Covid panic, then the reversal as the stock market turned around. Then the index started increasing in late 2021 as the stock market topped out. The 14-week EMA just recently crossed below the 25-week EMA, thus flashing a favorable signal for stocks.
The CDX Index and S&P 500 performance
Let's analyze S&P 500 Index performance based on whether the 14-week EMA for the CDX Index is above or below its 25-week EMA.
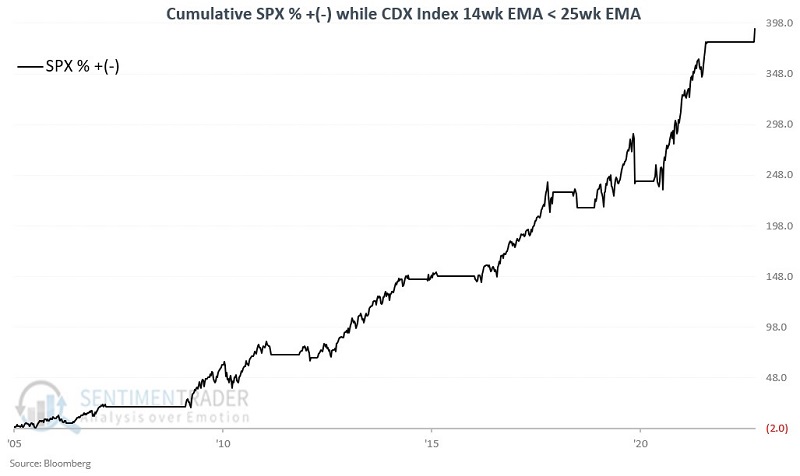
The chart below displays the cumulative percentage performance for the S&P 500 Index if held long only when the CDX Index's 14-week EMA is below its 25-week EMA. Since the CDX Index was first calculated in 2005, the S&P 500 has gained +380% when the 14-week EMA is below the 25-week EMA.
The chart below displays the cumulative percentage performance for the S&P 500 Index if held long only when the CDX Index's 14-week EMA is above its 25-week EMA.
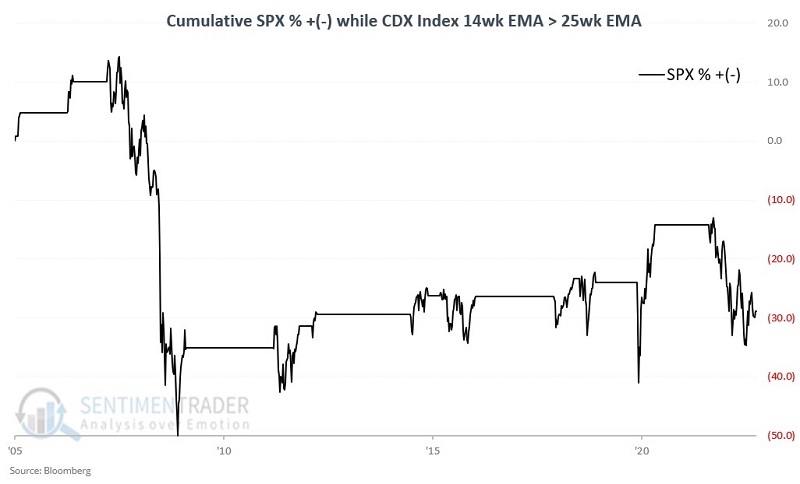
Since the CDX Index was first calculated in 2005, the S&P 500 has lost -28% when the 14-week EMA is above the 25-week EMA.
What the research tells us…
Swings in the CDX Index can offer insight into fear and complacency among large institutional investors. When fear and uncertainty increase in the market and economy, the CDX Index will almost invariably reflect this. During these times, CDS sellers demand more premium to protect themselves, and large institutional bond investors will readily pay up to offload risk. With the CDX 14-week EMA now back below the 25-week EMA, it suggests that large investors are moving back to a more risk-on stance in the credit markets. This typically bodes well for stocks as well