Products
SentimenTrader Trading Tools
‍
Backtest Engine
My Trading Toolkit
Correlation Analysis
Seasonality
Market Prediction
Indicators & Data API
‍
Proprietary Indicators & Charts
Market Data API
Strategies & Scanner
‍
50+ Trading Strategies
Smart Stock Scanner
Smart Option Scanner
Research Reports
‍
Research Solutions
Reports Library
Free Resources
Simple Backtest Calculator
Simple Seasonality Calculator
The Kelly Criterion Calculator
Sentiment Geo Map
Public Research Reports
Education
Sentiment Indicators
Technical Indicators
Pricing
Company
About
In the News
Testimonials
Client Success Stories
Contact
Log inLoginSign up
< BACK TO ALL REPORTS

Credit Filtering for QQQ Signals, But Risks Remain

by Sentimentrader
2025-11-11
QQQ has triggered a long-term positive technical signal with favorable 1-year historical returns, but short-term pullbacks vary sharply. Filtered by CDX Ratio, current credit risks are contained, yet short-term volatility and pullback risks remain.

Key Points:

  • QQQ has triggered a long-term positive technical signal, with favorable average 1-year returns historically.
  • Its short-term pullbacks show significant divergence; credit markets (CDX Ratio) are needed to filter risks.
  • Current credit risks are contained, reducing extreme pullbacks, but short-term volatility and pullback risks persist.

A Historic Long-Term Positive Signal

After months of strong momentum, the Nasdaq 100 Index-dominated by large-cap tech stocks-has been experiencing volatility at elevated levels. Increased market corrections have raised investor concerns.

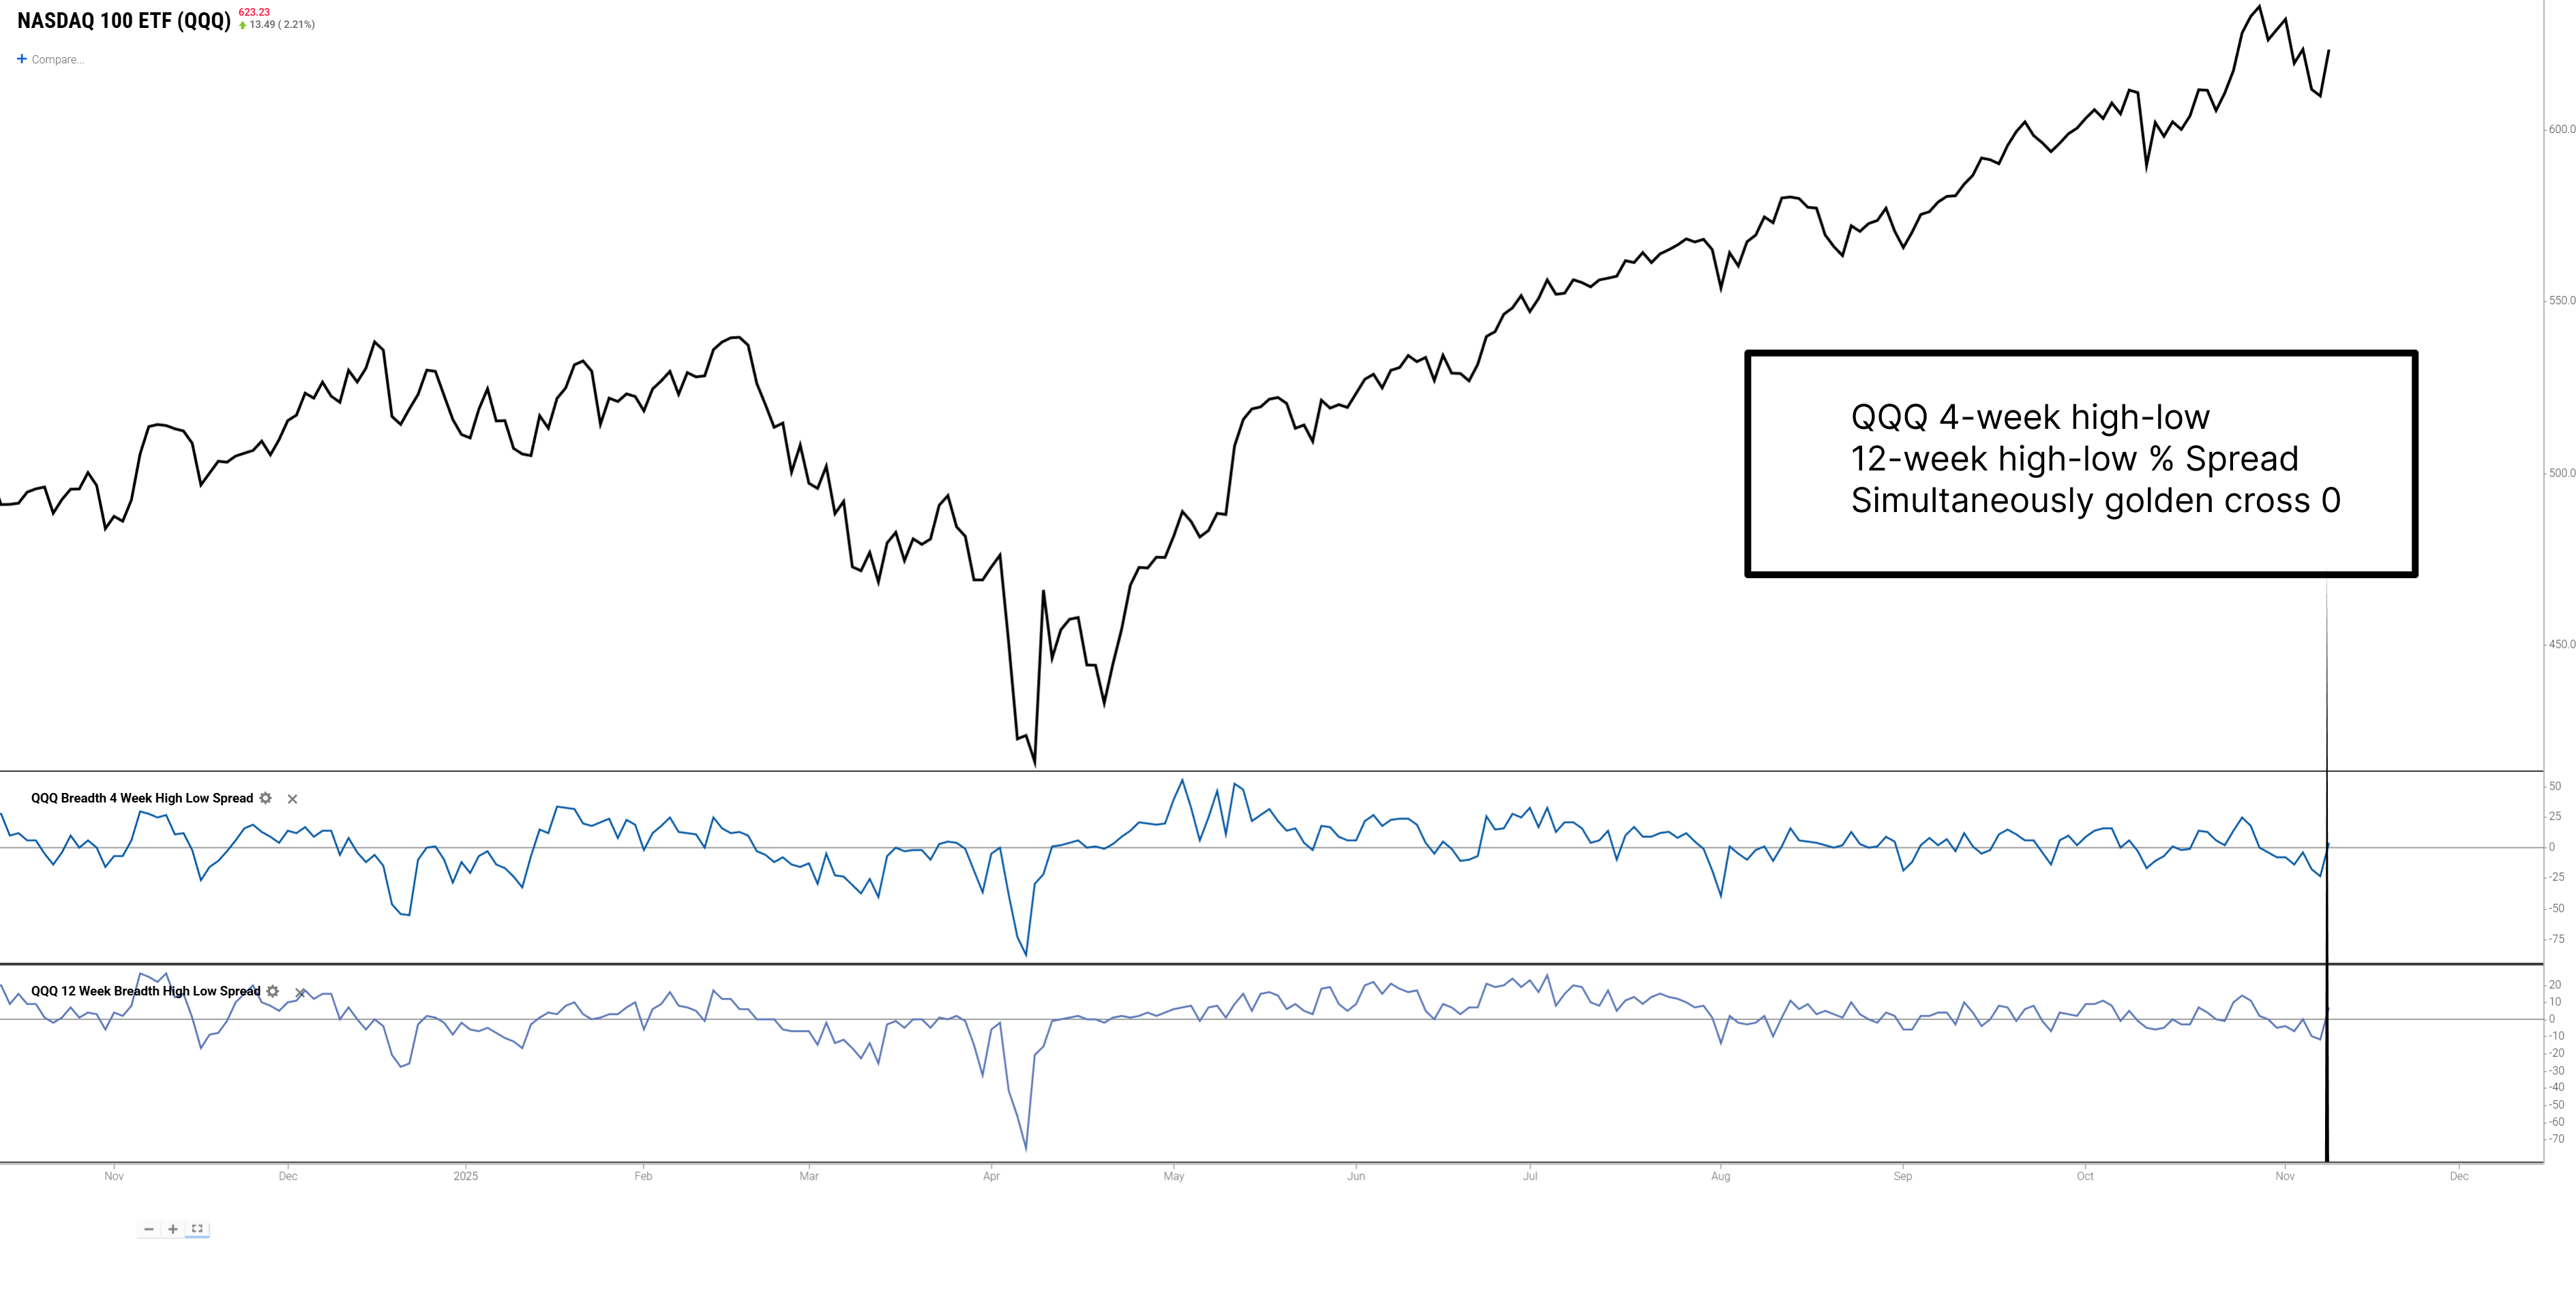
A specific technical signal based on the Nasdaq 100 Index has been triggered. The model requires the market to first be in a confirmed uptrend-trading above its 50-day moving average for 60 consecutive days-followed by a capture of an internal breadth "reset" where both 1-month and 3-month breadth (Which are QQQ 4/12 Week High/Low Spread%) recover simultaneously.Related Backtes Click Here.

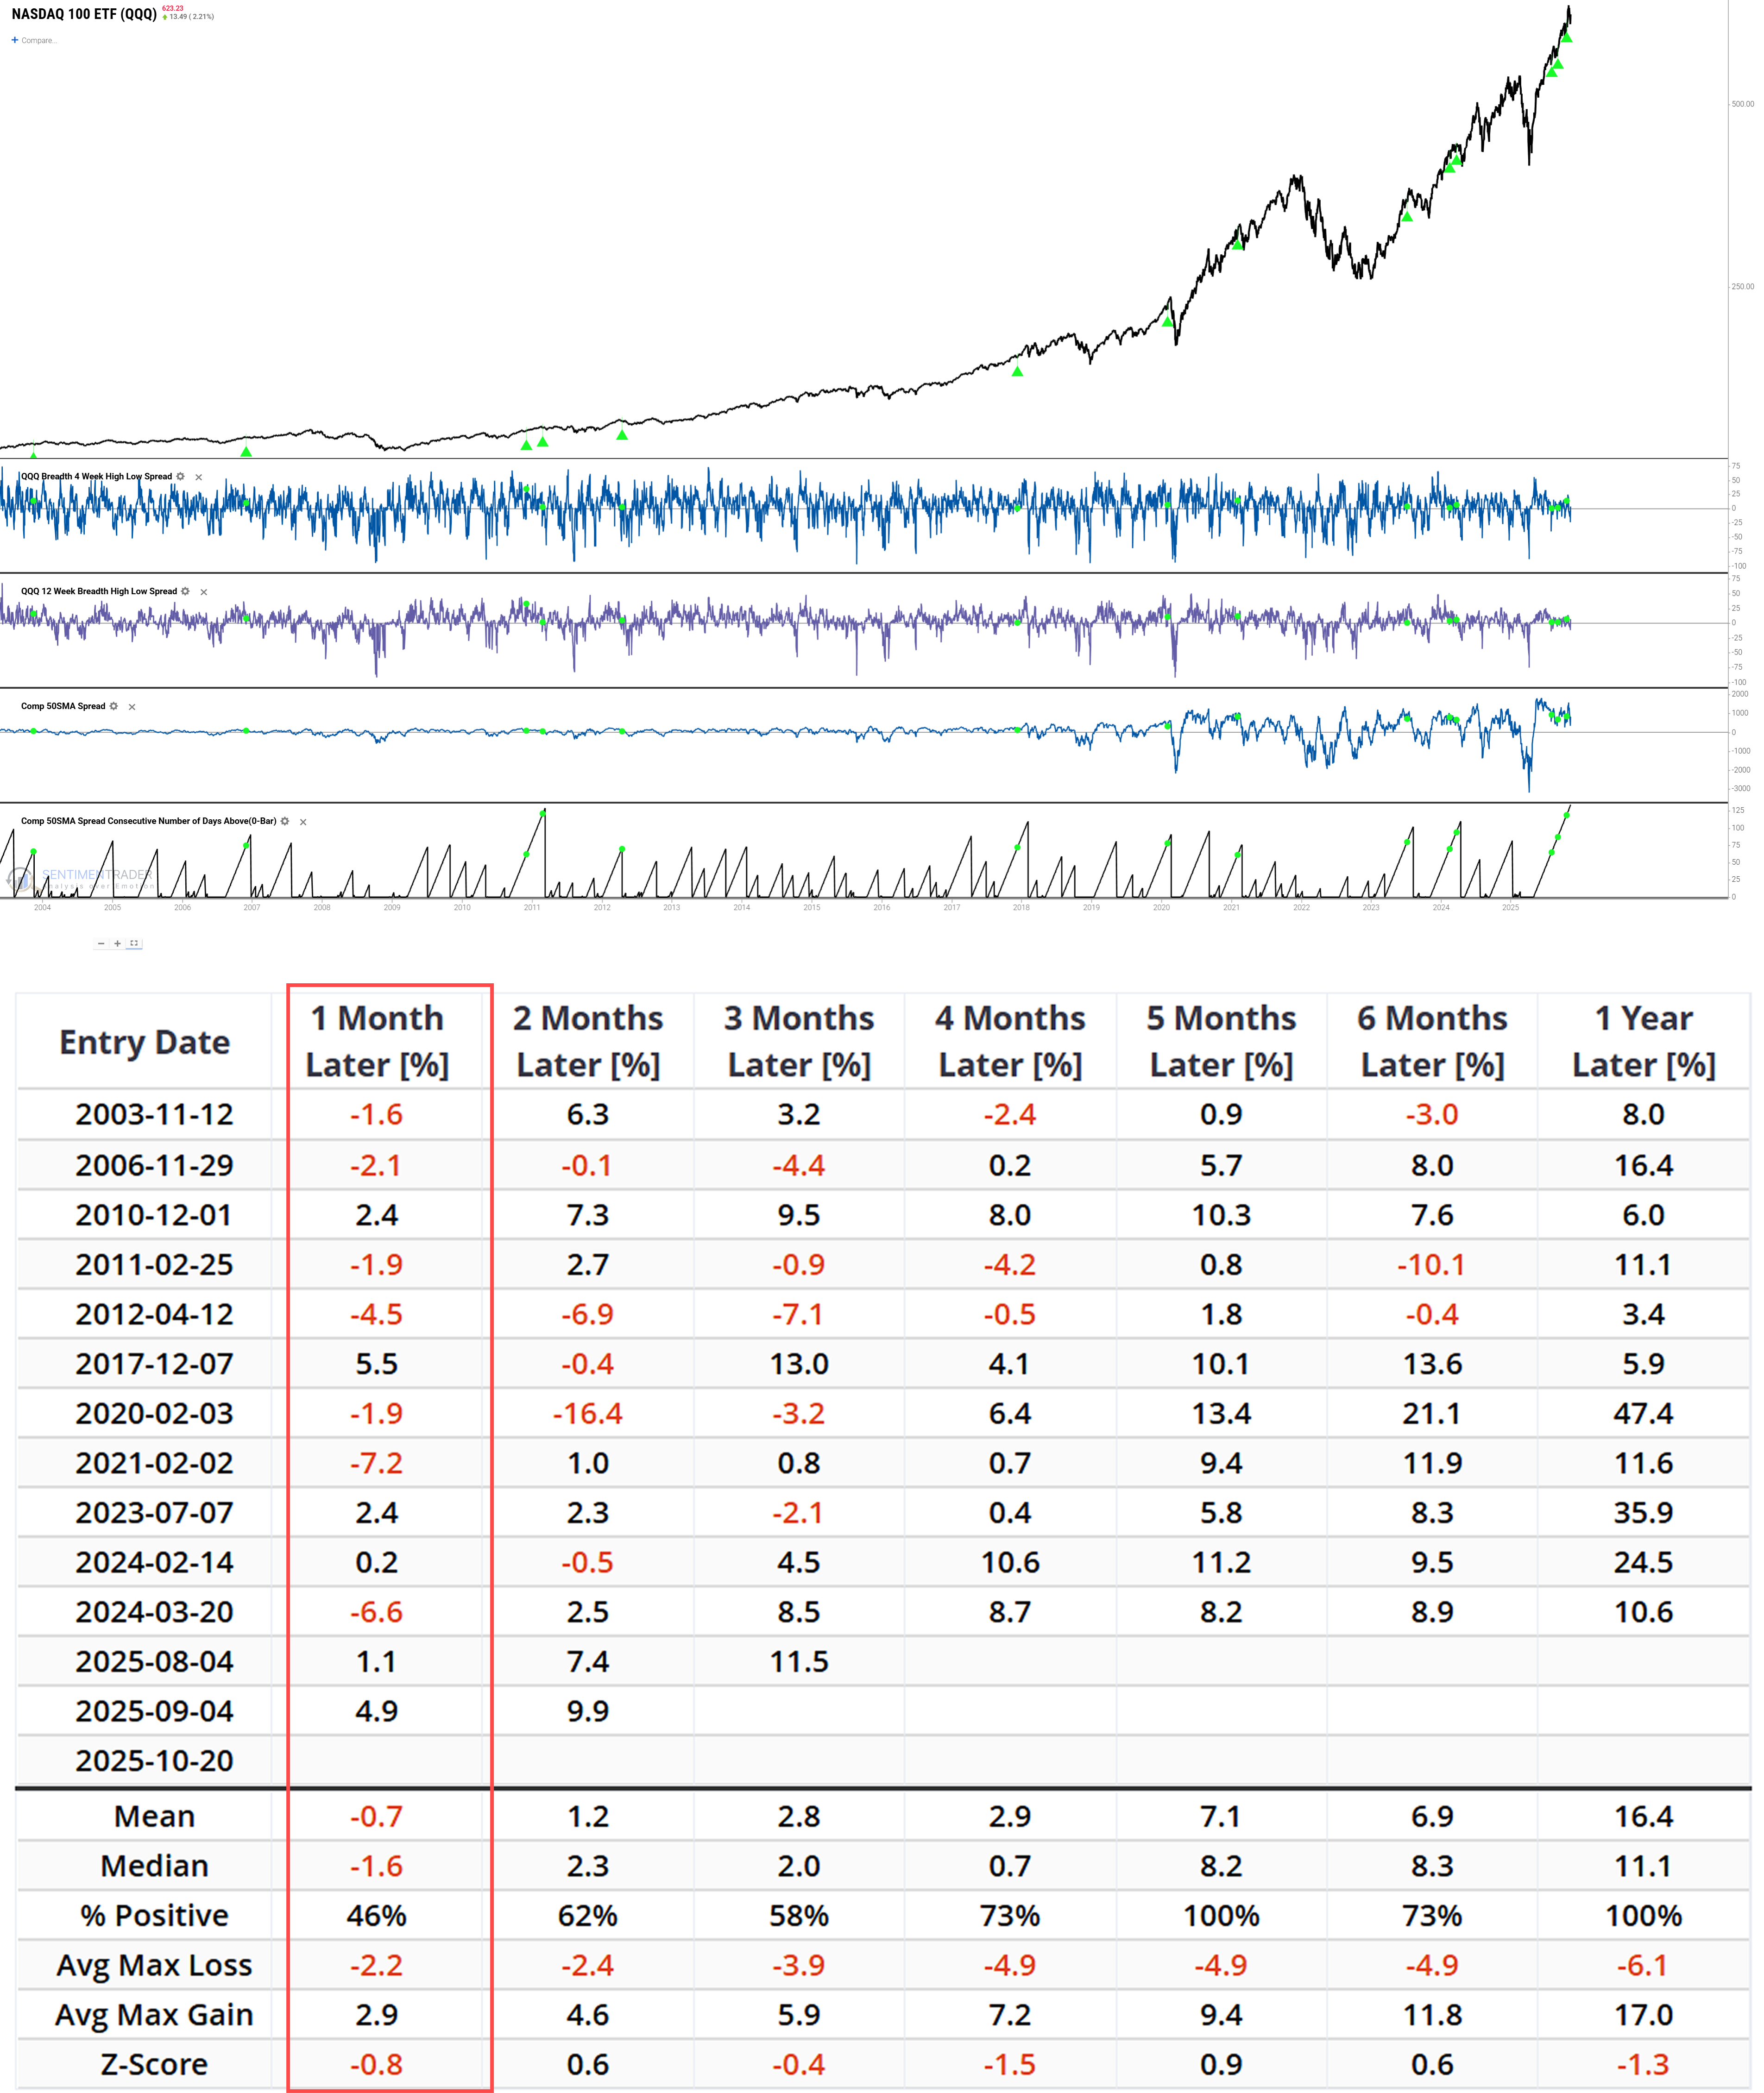
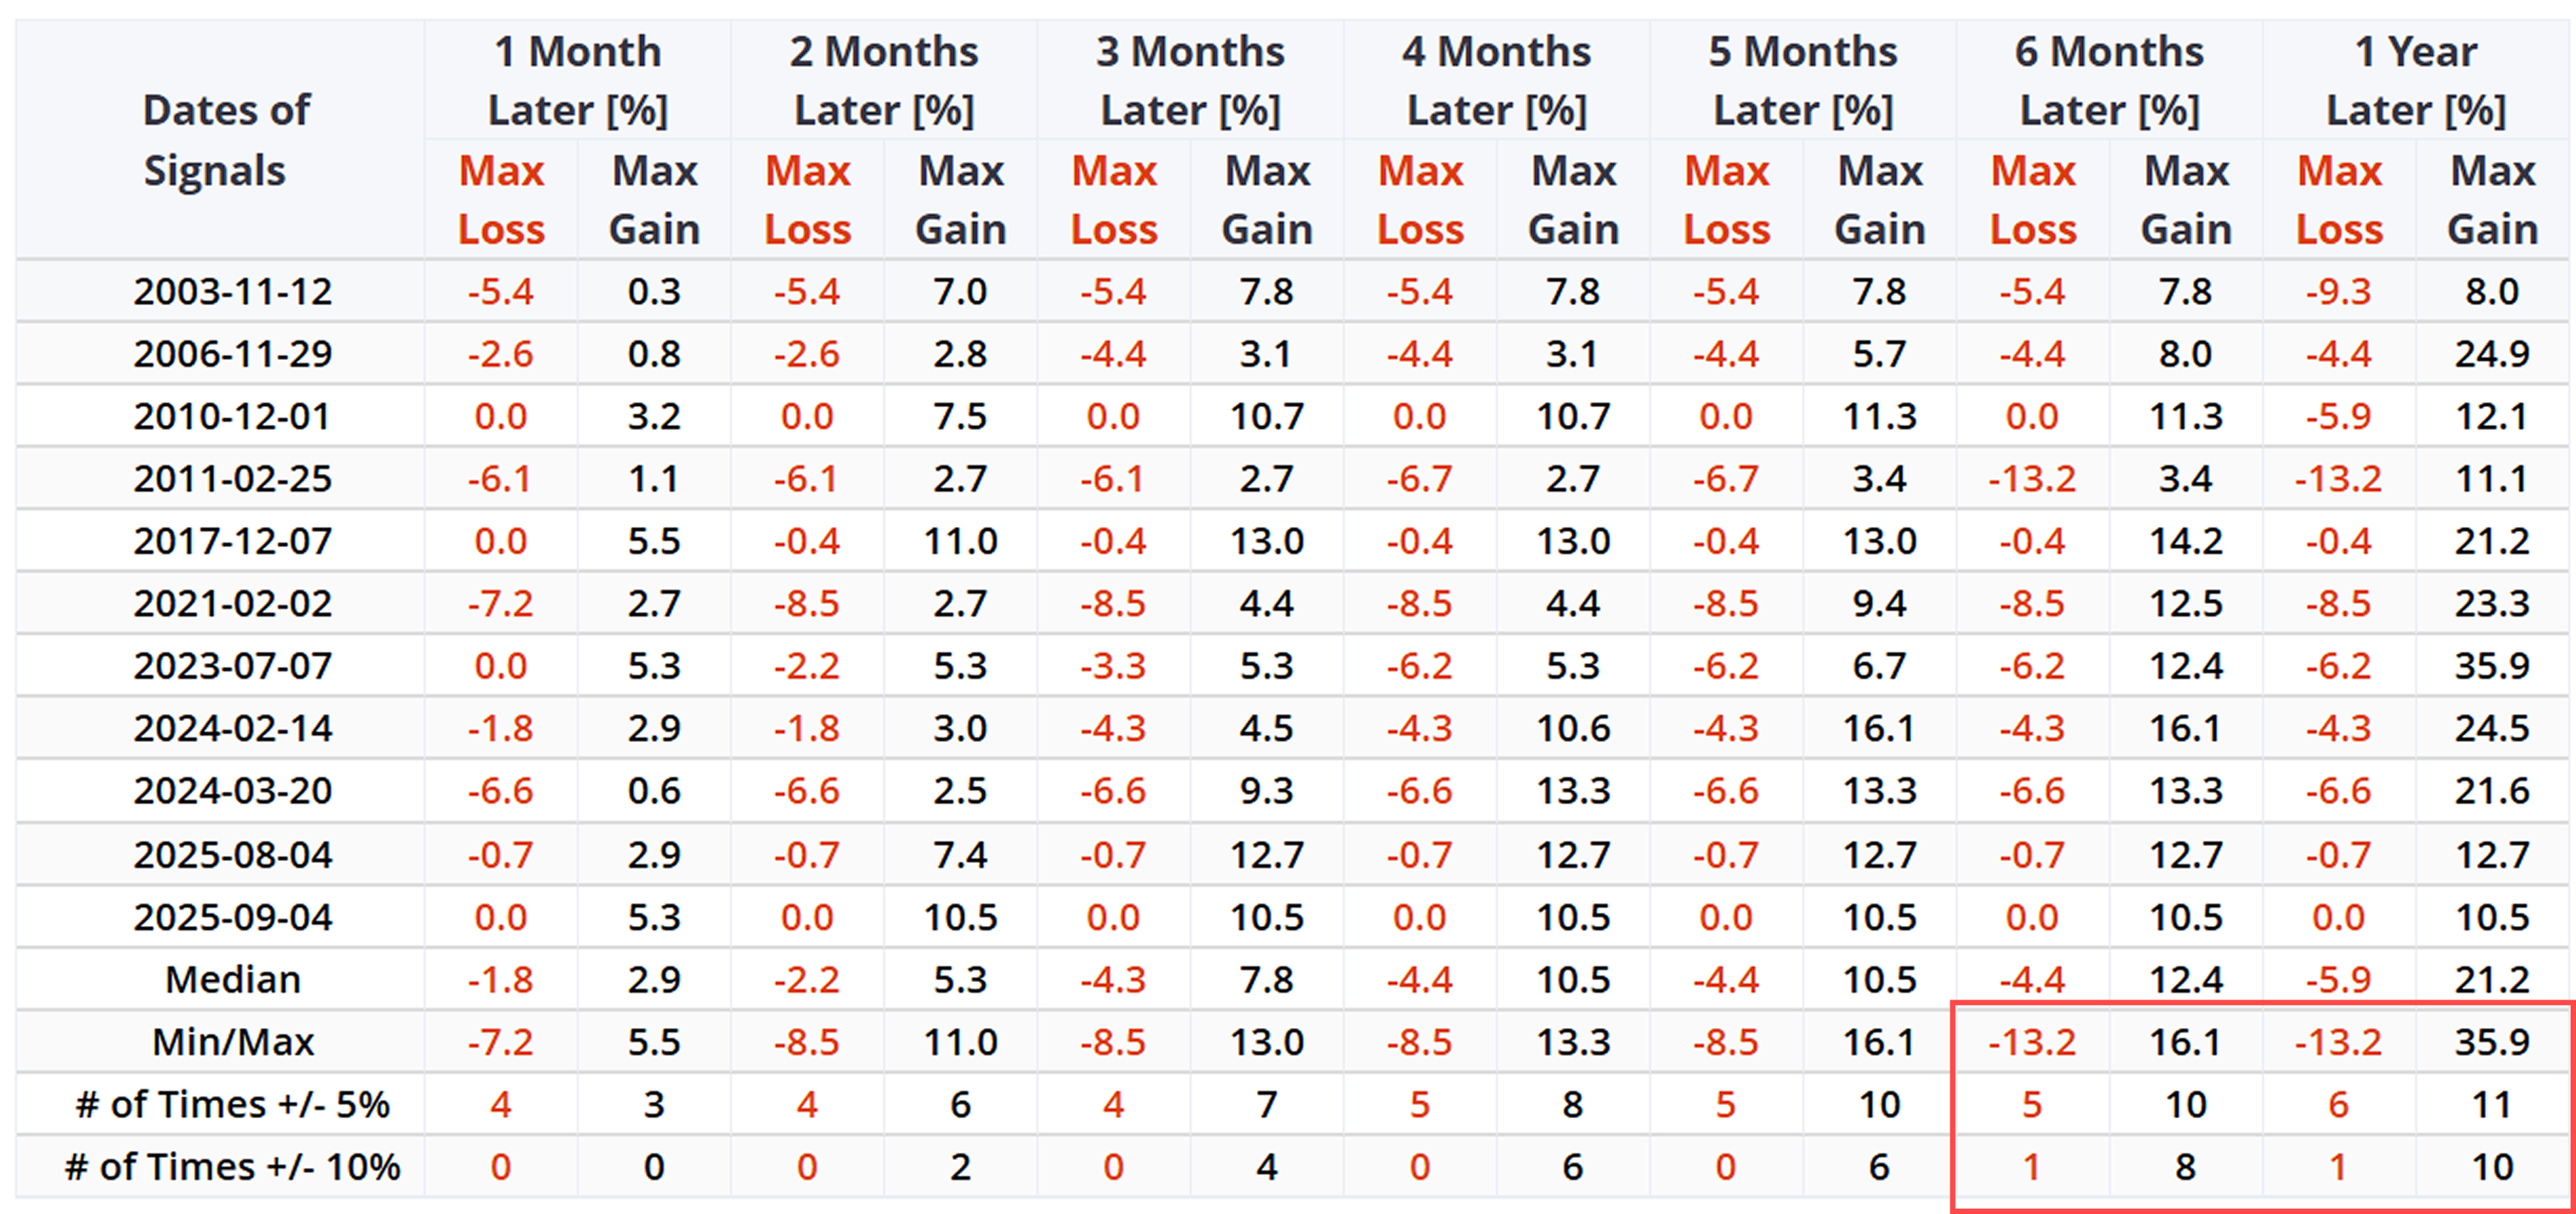
Historically, the long-term performance of this signal is notable. As backtest data shows, among the 13 prior triggers, the signal delivered solid average returns one year later.

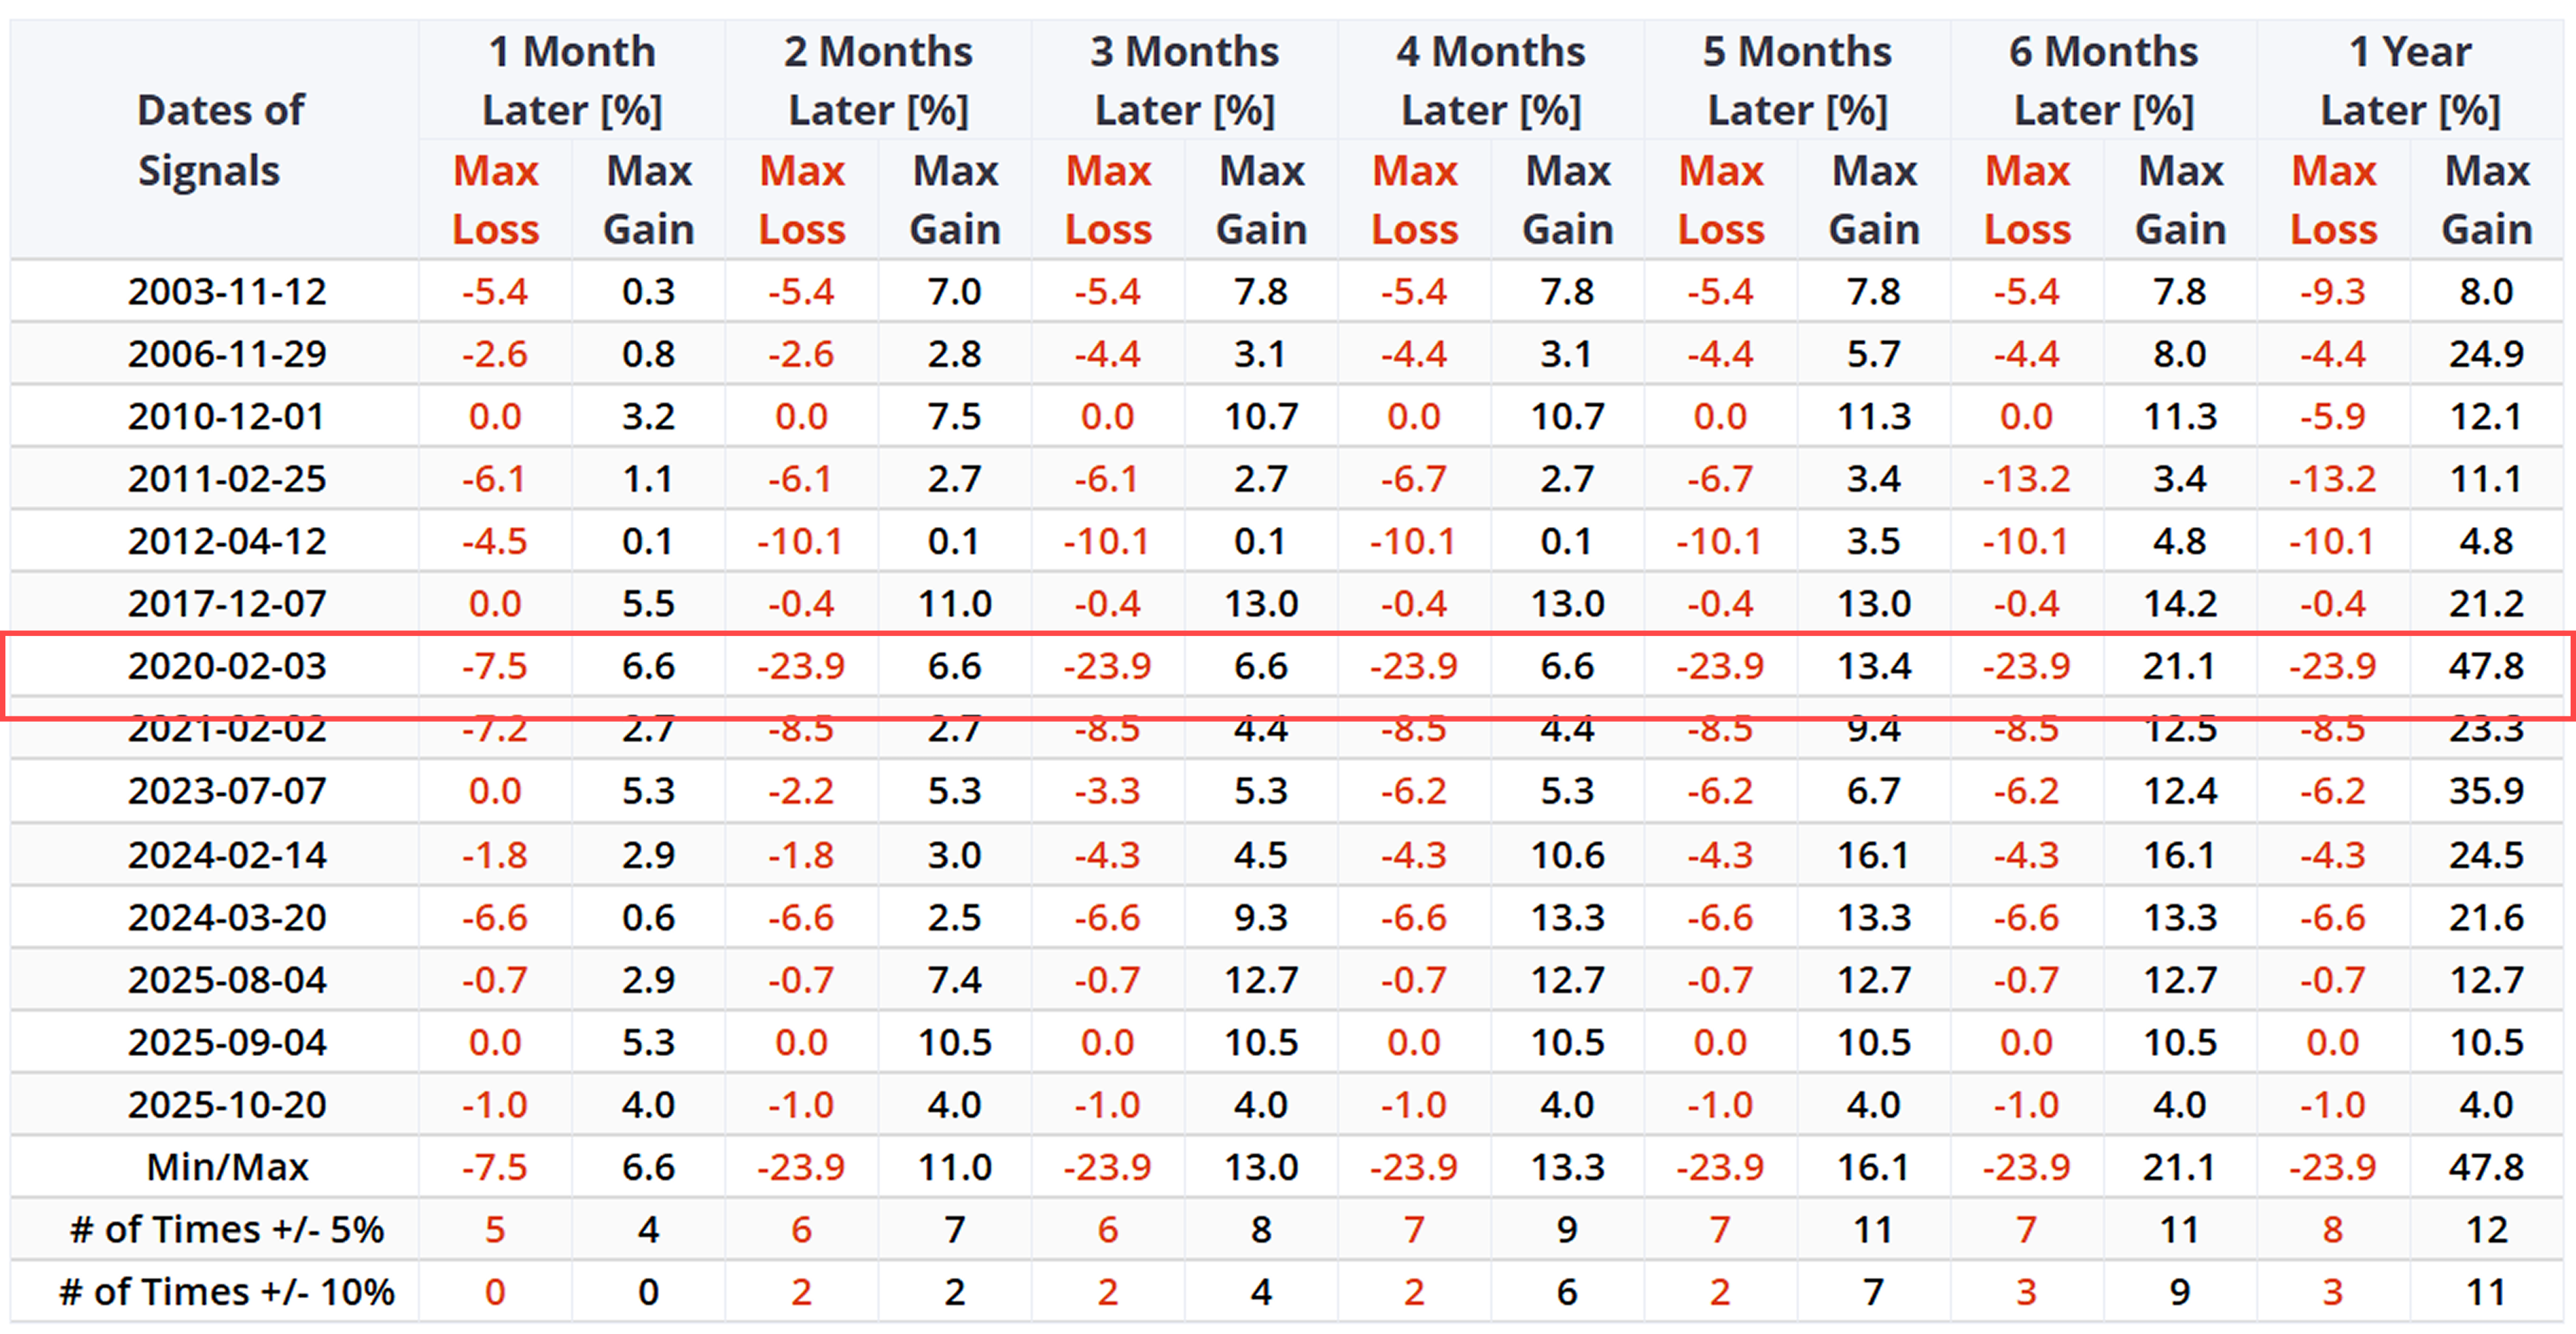
However, the short-term path of the signal is fraught with uncertainty. Its risk profile exhibits large disparities: the signal can trigger a mere minor pullback (as in 2017) or a sharp drawdown (as in 2020).

This divergence in short-term outcomes is undesirable. It indicates that relying solely on QQQ's breadth signal is insufficient, and a "macro context" indicator must be introduced to stratify risks.

Using Credit Markets for Filtering

Our hypothesis is that the two extreme pullbacks were essentially "systemic credit risk" events, not merely technical corrections.

We use the ratio of the CDX to its 50-day moving average as a filter. This ratio is a sensitive measure of market panic over corporate default risks.

Historically, the largest pullbacks all occurred when the CDX Ratio was above its moving average.

When we examine signals triggered against a backdrop of contained credit risks, the risk profile changes.Related Backtes Click Here.

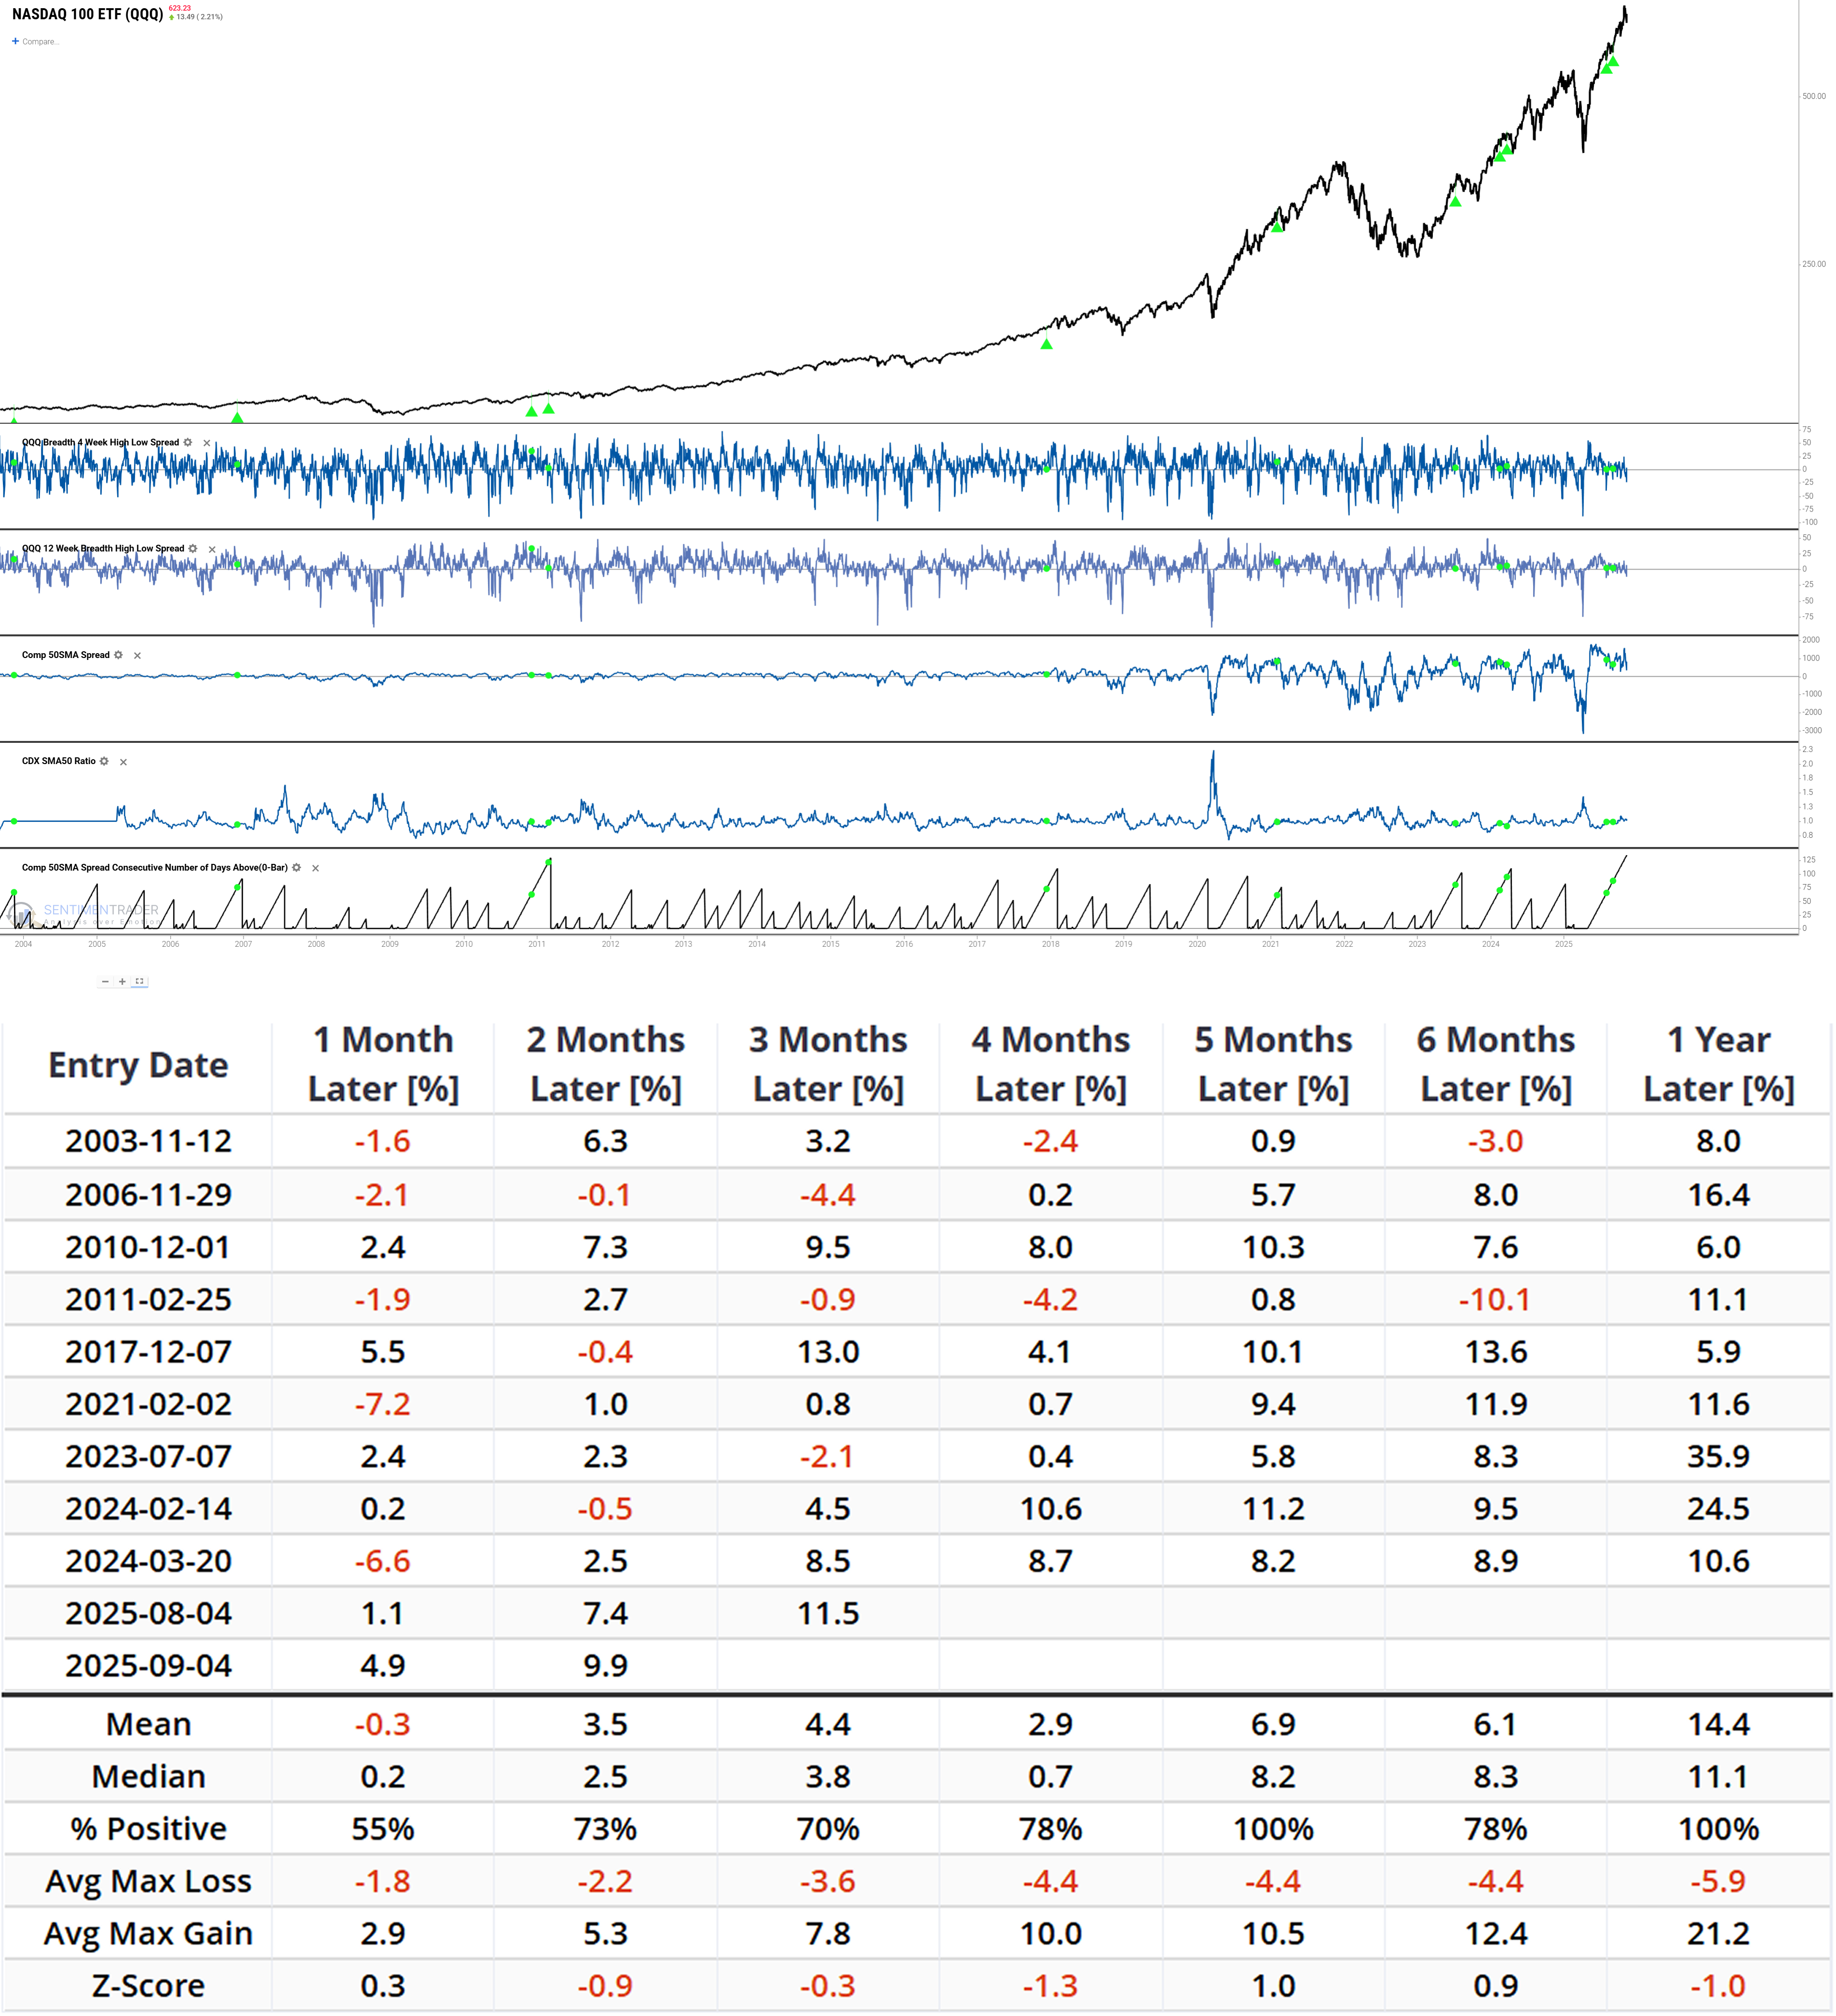
In this "filtered" signal group, extreme scenarios are eliminated.

This does not mean risks disappear. The short-term (1-month) win rate of this group remains low. But the "worst-case scenario" pullbacks have narrowed-though significant drawdowns may still occur.

What the Research Tells Us...

Based on the recently triggered QQQ technical signal, we find that the signal's long-term (1-year) historical returns are positive.

However, we must focus on its short-term risks. The signal's historical short-term pullbacks show extreme divergence-ranging from nearly negligible corrections to "systemic" extreme sell-offs.

Our core hypothesis is that "credit risk" (CDX) is the key differentiator between these two outcomes. Data confirms this: historically, the worst sell-offs indeed occurred during periods of "exploding" credit risks.

Today's signal is triggered against a backdrop of relatively "contained" credit risks. But this does not mean there are no short-term risks-short-term volatility persists, and significant pullbacks remain possible.

PRODUCTS
SentimenTrader
Trading Tools
Indicators & Data API
‍
Strategies & Scanner
‍
Research Reports
FREE
RESOUrCES
Simple Backtest
Calculator
Simple Seasonality
Calculator
The Kelly Criterion
Calculator
Sentiment Geo Map
‍
Public Research Reports
‍
Education
Sentiment Indicators
‍
Technical Indicators
‍
Pricing
Bundle pricing
‍
FAQ
‍
Announcements
‍
COMPANY
‍
About
‍
In the News
‍
Testimonials
‍
Client Success Stories
CONTACT
‍
General Inquiries
‍
Media Inquiries
‍
Financial Professionals Inquiries
‍
© 2026 Sundial Capital Research Inc. All rights reserved.
Setsail Marketing
TermsPrivacyAffiliate Program
Risk Disclosure: The information and tools provided are for research and analytical purposes only and are not intended as investment advice. Market analysis involves uncertainty, and outcomes may differ from expectations. Users should conduct their own due diligence and consider their individual circumstances before making any financial decisions. Past performance is not necessarily indicative of future results.

Hypothetical Performance Disclosure: Hypothetical performance results have many inherent limitations, some of which are described below. No representation is being made that any account will or is likely to achieve profits or losses similar to those shown; in fact, there are frequently sharp differences between hypothetical performance results and the actual results subsequently achieved by any particular trading program. One of the limitations of hypothetical performance results is that they are generally prepared with the benefit of hindsight. In addition, hypothetical trading does not involve financial risk, and no hypothetical trading record can completely account for the impact of financial risk of actual trading. for example, the ability to withstand losses or to adhere to a particular trading program in spite of trading losses are material points which can also adversely affect actual trading results. There are numerous other factors related to the markets in general or to the implementation of any specific trading program which cannot be fully accounted for in the preparation of hypothetical performance results and all which can adversely affect trading results.

Testimonial Disclosure: Testimonials appearing on this website may not be representative of other clients or customers and is not a guarantee of future performance or success.