
Crash insurance using options

Key points
- NO PREDICTION of an impending market crash is being made here
- The purpose of this piece is merely to highlight one or two ways to hedge against a significant adverse move for a trader or investor who wishes to do so
- Options offer a relatively inexpensive way to protect some part of a larger portfolio during a significant market decline
Hedging against a significant adverse event
As always, as the market topped out in late July and declined throughout most of August, the bearish voices came out of the woodwork, forecasting anything from a minor market pullback to "The Crash of 23." This author cannot predict who will be right or wrong. Nevertheless, concerned investors hoping not to sell significant portions of their stock portfolio may be able to avail themselves of other opportunities. It must be emphasized that the following examples are just that - examples - and NOT "recommended" trades.
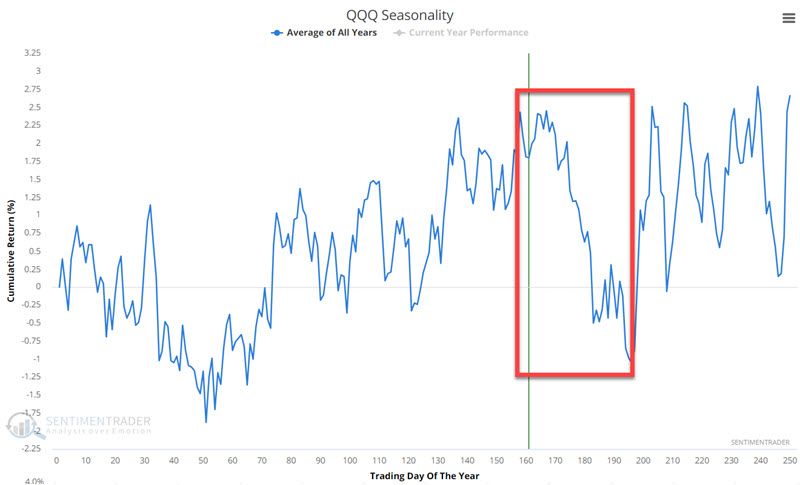
For our examples, we will focus on the Invesco QQQ Trust ETF (ticker QQQ), which is designed to track the performance of the Nasdaq 100 Index. The chart below displays the annual seasonal trend for QQQ. Note the potential for seasonal weakness between now and roughly October 20.
Let's consider some possible hedge examples. Before proceeding, note that our objective is to spend a relatively small amount to hedge against a significant market decline. This differs from trying to hedge the next 3% to 5% decline.
Buying a put option
The most straightforward approach would be to buy a put option on QQQ. There are October options, which expire on October 20 - the end of the unfavorable seasonal window. While it seems logical to use October options, the concern is time decay - which means that every option will lose all of its time premium by expiration - which accelerates in the last 30 days before expiration. This can be very detrimental for traders who buy options. As a result, our examples will use November 2023 options that expire on November 17.
Our first example involves:
- Buying the QQQ Nov17 2023 345 put @ $8.39
This position's particulars and risk curves appear below (courtesy of www.Optionsanalysis.com).
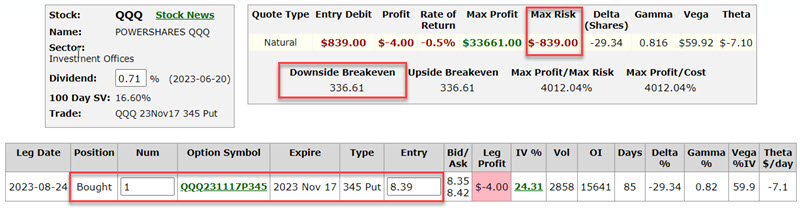
The cost to enter this trade is $839 for a 1-lot, and the breakeven price at November expiration (but remember we are only planning to hedge through October 20) is $366.61 basis QQQ shares.
If the market collapsed and QQQ plummeted to $250 a share (again, NOT a prediction or even an inference), this position would show a gain of roughly $8,600.
The bottom line: For a cost of $839, an investor could conceivably offset $8,600 worth of portfolio losses in a market crash.
A more complicated alternative with more hedging potential
A more complicated alternative to simply buying a put option is covered in the next example, which involves:
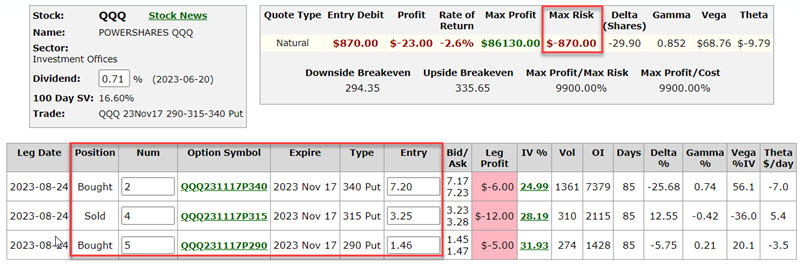
Buying 2 QQQ Nov17 2023 340 puts @ $7.20
Selling 3 QQQ Nov17 2023 340 puts @ $3.25
Buying 5 QQQ Nov17 2023 340 puts @ $1.46
This is a variation of a butterfly spread (which typically is done in a 1x2x1 fashion). But for simplicity's sake, we will refer to the position above as a "butterfly spread."
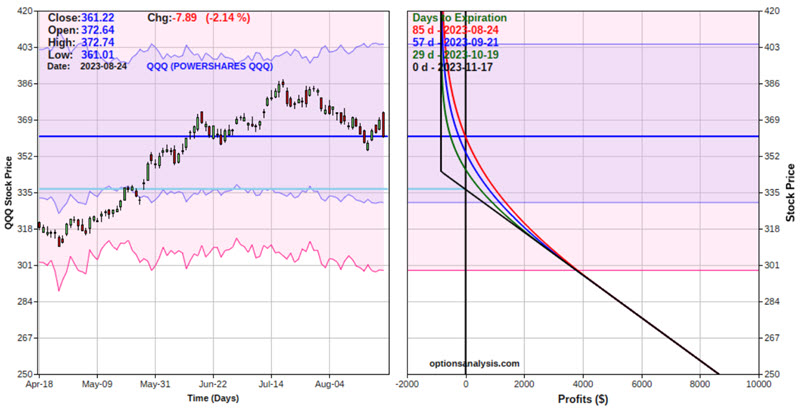
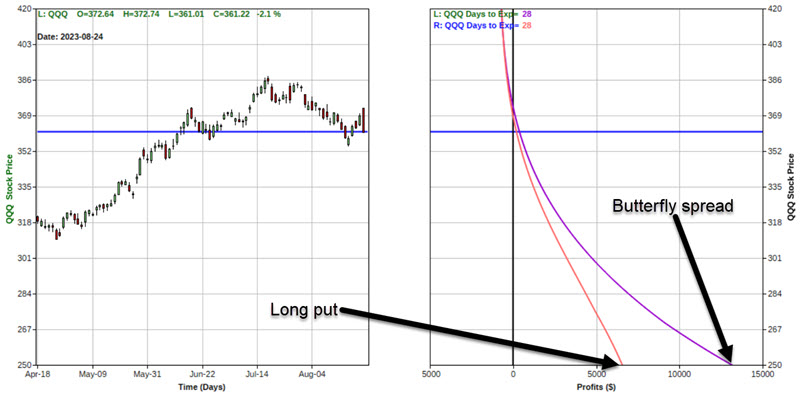
The particulars for this trade and the risk curves (i.e., the expected $ gain or loss based on QQQ share price as of four different dates leading up to November expiration) appear below.
Note that the black line in the chart above represents the expected P/L as of November 17. We are only planning to hold this hedge through October 20.
The cost to enter this trade is $870. Now, let's compare the two examples.
Comparing hedge examples
We have highlighted two separate potential hedge trades. Now, let's compare the two based on the assumption that we will plan to exit the trades no later than October 20. The chart below displays the expected profit/loss (equity) curve for both positions as of October 20.
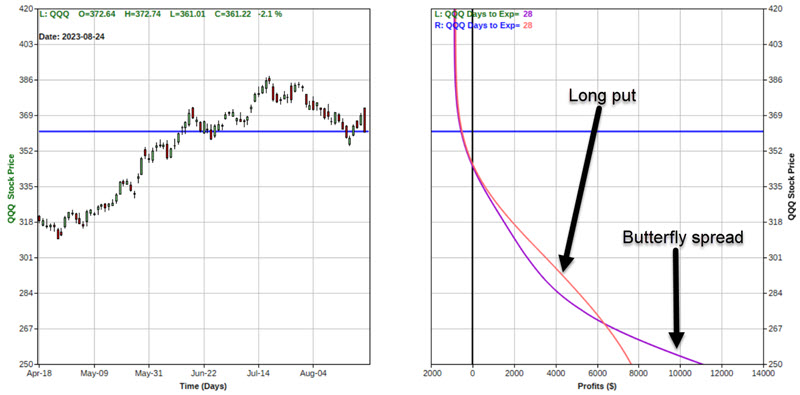
Note that the long put would show a larger gain between roughly $335 and $270 a share. Below $270, the butterfly spread could offer a significantly larger gain.
There is one other factor to consider - implied option volatility.
A closer look at the impact of volatility
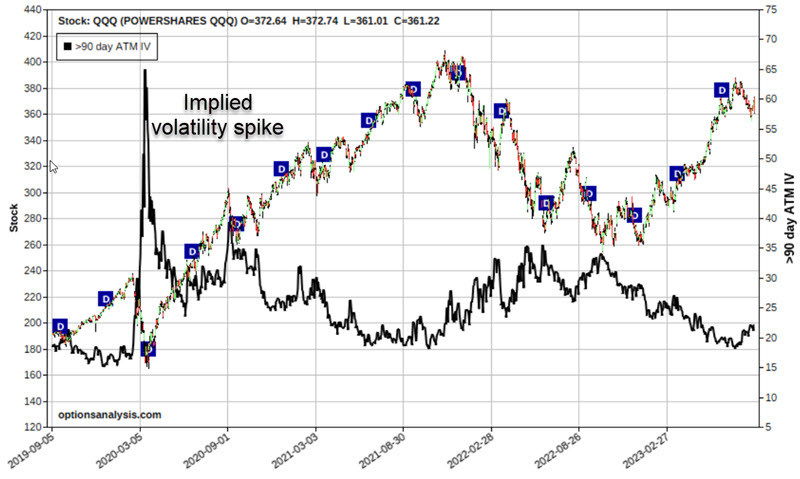
When the stock market declines - particularly when it declines swiftly - volatility almost invariably increases. The more swift the decline, typically, the more significant the spike in volatility. The chart below displays price action for ticker QQQ along with the implied volatility for QQQ options (black line). Note the huge spike higher in IV during the Covid crash of 2020.
This is important because every option has some time premium built into its price. This is essentially to compensate the option seller for agreeing to sell the option in the first place. The amount of time premium built into the price of options can rise or fall significantly if volatility rises or falls. When a stock or index is volatile, option sellers will demand higher premiums to compensate for taking the risk of selling the option in the first place.
High implied volatility tells us that a lot of time premium is built in. Low implied volatility means little time premium built in.
Vega is the Greek option value that relates to volatility.
As seen in the particulars screenshot earlier for the long put example trade, that position has a Vega of $59.92. This implies that for each point that implied volatility rises, this position will gain roughly $60.
As seen in the particulars screenshot for the butterfly example trade, that position has a Vega of $68.76. This implies that for each point that implied volatility rises, that position will gain roughly $69.
So let's assume the following:
- As of October 20, 2023
- QQQ has plummeted to $250 a share (did I mention that that is not a prediction?)
- Implied volatility has doubled (2x)
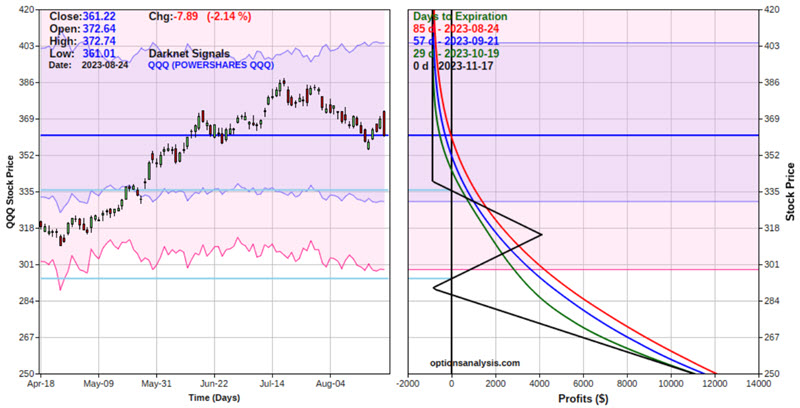
The chart below overlays the expected risk curves for the two positions based on the scenario above.
If QQQ traded at $250 a share as of October 20 AND implied volatility doubled (imagine the VIX Index rising from 17% to roughly 34%):
- The long put position would have an open profit of approximately $6,483
- The butterfly spread would have an available profit of approximately $13,080
It is impossible to definitively state which position above is "better." That is for each individual to decide for themselves. That said, the butterfly spread may have an advantage for a trader expecting the worst - a massive decline combined with soaring volatility. In either case, if QQQ does not decline significantly in the next seven weeks or so, both trades will end up as a "cost of doing business."
What the research tells us…
Hedging is an inexact science at best. It is essentially like buying insurance. You pay a premium as an expense, hope you never suffer a loss, and forfeit the cost of paying the premium as a cost of doing business. However, if you do hold insurance when disaster strikes, it can offset all or at least some of your loss. For an investor who a) holds a stock portfolio but for any of myriad reasons does not want to sell and b) fears the potential for a significant market decline, hedging can make sense.