Products
SentimenTrader Trading Tools
‍
Backtest Engine
My Trading Toolkit
Correlation Analysis
Seasonality
Indicators & Data API
‍
Proprietary Indicators & Charts
Market Data API
Strategies & Scanner
‍
50+ Trading Strategies
Smart Stock Scanner
Research Reports
‍
Research Solutions
Reports Library
Free Resources
Simple Backtest Calculator
Simple Seasonality Calculator
The Kelly Criterion Calculator
Sentiment Geo Map
Public Research Reports
Pricing
Company
About
In the News
Testimonials
Client Success Stories
Contact
Log inLoginSign up
< BACK TO ALL REPORTS

Corporate insiders favor S&P 500 stocks, not Nasdaq 100, as trends diverge

Jason Goepfert
2020-06-11
Corporate insiders in S&P 500 companies greatly picked up their pace of buying as shares fell in March, and they're continuing to buy. In Nasdaq 100 companies, though, insider buying has been tepid. The ratio between insider buys in the S&P 500 versus Nasdaq 100 is now at a decade high. This comes even as the Nasdaq has been above its 20-day average for more than two months, while the S&P has not.

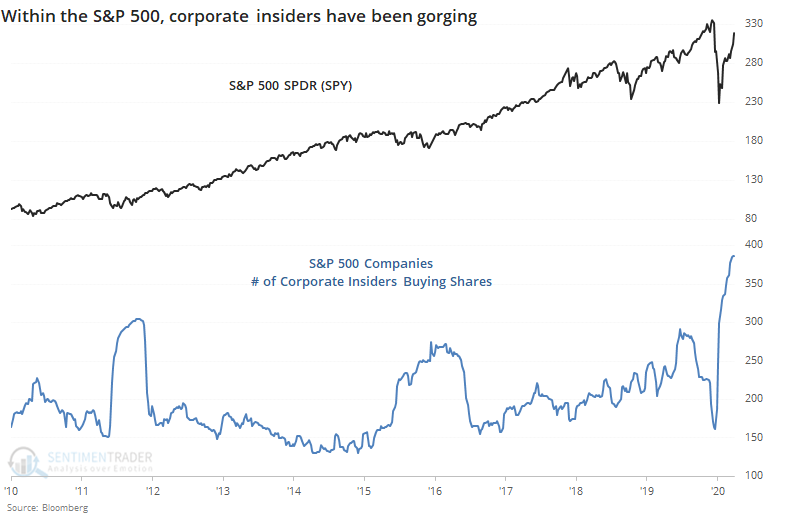
As stocks climbed incessantly higher to start the year, corporate insiders became hesitant. Among S&P 500 companies, there was a multi-year low in the number of insiders buying their firm's shares on the open market.

The pandemic changed all that. As other investors panicked, insiders picked up shares on the cheap. They're still going. The number of insiders that have bought shares in S&P 500 companies within the past six months has soared to a decade high.

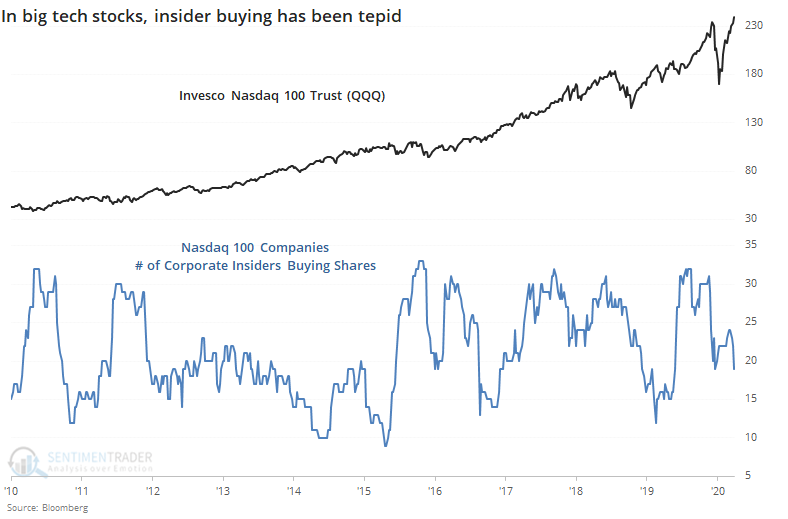
They're maybe not seeing quite the same values in big tech stocks. Insider buying among Nasdaq 100 companies has been tepid.

Insider buying is now 20 times greater in S&P 500 stocks than Nasdaq 100 stocks. While we should expect the ratio to be high simply because there are more stocks, this is still the highest ratio since at least 2010.

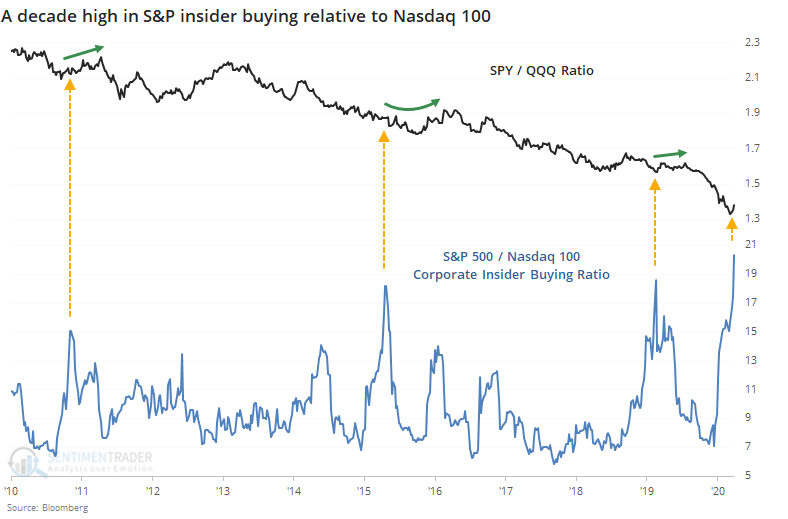
This wasn't a slam-dunk, but other times when insiders in S&P stocks were much more aggressive buyers than insiders of Nasdaq 100 stocks, the ratio between SPY and QQQ showed a modest tendency to rebound in the months ahead. Once the ratio of insider buying settled down, QQQ resumed its relative outperformance.

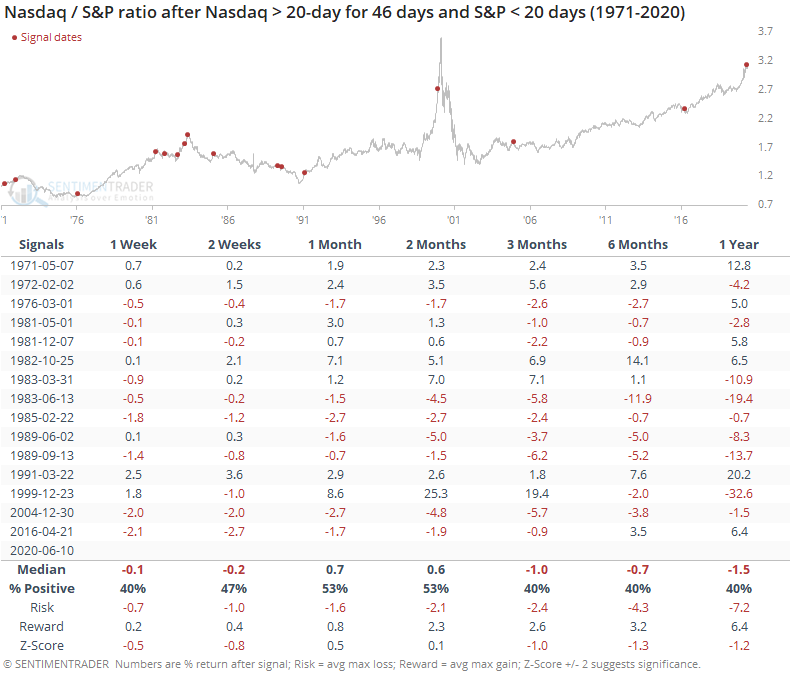
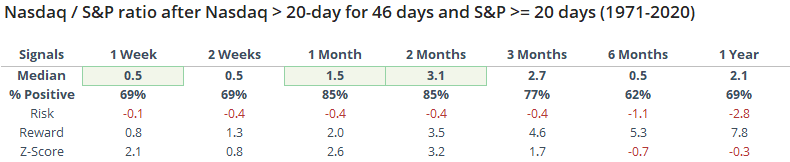
Insider appetite for their own shares in S&P stocks comes despite the Nasdaq's torrid trend (or perhaps because of it). In a premium note, Troy mentioned that the Nasdaq has levitated above its 20-day moving average for 46 days, a historically long stretch. That's the case for both the Nasdaq 100 and Nasdaq Composite.

It's interesting to note that while the Nasdaq indexes have been on such a sustained trend, the S&P 500 has not. It hasn't spent even 20 days above its 20-day average.

When the Nasdaq's trend has been so much stronger than the S&P's, we typically saw mean reversion in the months ahead. The ratio between the Nasdaq Composite and S&P 500 showed a tendency to decline.

Contrast that to times when the S&P had enjoyed a sustained trend above its 20-day average along with the Nasdaq. Then, then Nasdaq showed more of a tendency to outperform.

Anytime the indexes enjoyed such a run above their 20-day average, shorter-term returns were generally poor but quite good in the medium- to long-term. We've seen that time and time again - bouts of extreme momentum often suffer mean-reversion in the short-term but are a sign of intense buying interest that doesn't die easily longer-term.

Given insider positioning and trend divergences, the likelihood is increasing that broader indexes like the S&P should start to do better relative to the hot Nasdaq.

Sorry, you don't have access to this report

Upgrade your subscription plan to get access
Go to Dasboard
PRODUCTS
SentimenTrader
Trading Tools
Indicators & Data API
‍
Strategies & Scanner
‍
Research Reports
FREE
RESOUrCES
Simple Backtest
Calculator
Simple Seasonality
Calculator
The Kelly Criterion
Calculator
Sentiment Geo Map
‍
Public Research Reports
‍
Pricing
Bundle pricing
‍
Announcements
‍
FAQ
COMPANY
‍
About
‍
In the News
‍
Testimonials
‍
Client Success Stories
CONTACT
‍
General Inquiries
‍
Media Inquiries
‍
Financial Professionals Inquiries
‍
© 2025 Sundial Capital Research Inc. All rights reserved.
Setsail Marketing
TermsPrivacyAffiliate Program
Risk Disclosure: Futures and forex trading contains substantial risk and is not for every investor. An investor could potentially lose all or more than the initial investment. Risk capital is money that can be lost without jeopardizing ones’ financial security or life style. Only risk capital should be used for trading and only those with sufficient risk capital should consider trading. Past performance is not necessarily indicative of future results.

Hypothetical Performance Disclosure: Hypothetical performance results have many inherent limitations, some of which are described below. No representation is being made that any account will or is likely to achieve profits or losses similar to those shown; in fact, there are frequently sharp differences between hypothetical performance results and the actual results subsequently achieved by any particular trading program. One of the limitations of hypothetical performance results is that they are generally prepared with the benefit of hindsight. In addition, hypothetical trading does not involve financial risk, and no hypothetical trading record can completely account for the impact of financial risk of actual trading. for example, the ability to withstand losses or to adhere to a particular trading program in spite of trading losses are material points which can also adversely affect actual trading results. There are numerous other factors related to the markets in general or to the implementation of any specific trading program which cannot be fully accounted for in the preparation of hypothetical performance results and all which can adversely affect trading results.

Testimonial Disclosure: Testimonials appearing on this website may not be representative of other clients or customers and is not a guarantee of future performance or success.