
Corporate Insiders are sending a message

Key Points
- Corporate insiders have the most informed insight into the prospects for sales and earnings at their own companies
- When they act en masse - either buying or selling - it sends important information to investors
- The effect of insider buying or selling typically plays out over a 1-2 year time frame
- Insiders are currently in an accumulation phase, which suggests higher stock prices one to two years from now
The data - and a caveat
We use a corporate insider buying and selling database from Bloomberg. This database looks only at "open market" buys and sells and does not count shares purchased as a function of exercising stock options granted by the company to an executive as compensation.
The good news is that we consider it to be the cleanest, most accurate database of this kind we could find. The bad news is that the data only goes back to March 2010. That makes this a relatively short time for testing, mainly since the stock market was primarily bullish during most of this period. As such, it is noted that - as always - past results do not guarantee future returns.
Insider buying is good but not extreme
The chart below displays Corporate Insider Buys. This series shows the total number of corporate insiders of S&P 500 companies that have bought shares on the open market during the past six months. Generally speaking, a quick and dramatic pick-up in buying tends to be an excellent sign for the stock market.
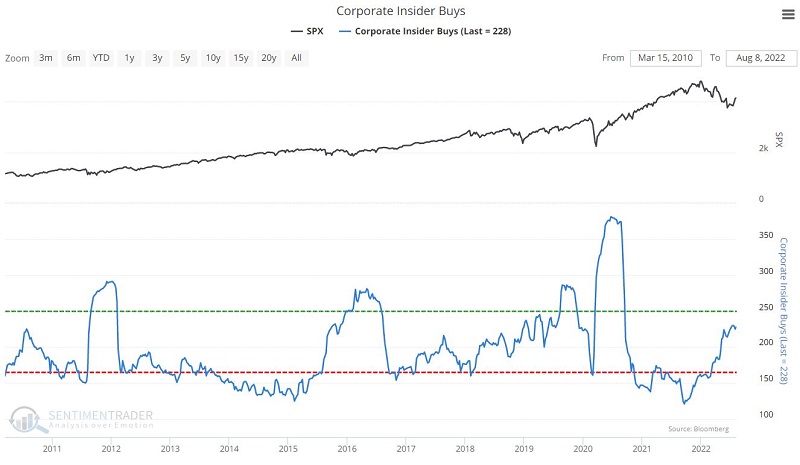
As you can see in the chart above, buying picked up substantially as the market declined in 2022. However, the current reading is by no means "off the charts," with a reading of 228. For reference, the chart and table below display all weeks when this indicator read 228 or higher.
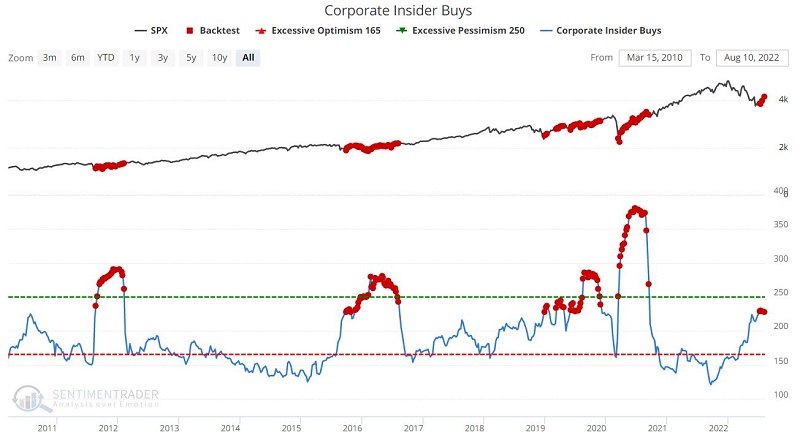
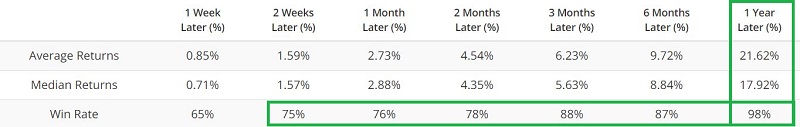
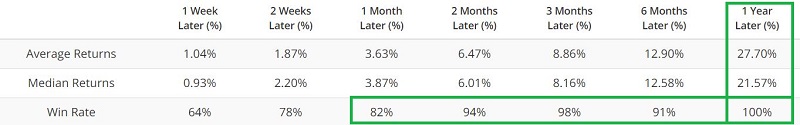
The chart above shows that extended periods of accumulation by corporate insiders tend to occur before stock prices start moving higher in earnest. At least since 2010, readings of this level or higher have been followed by higher stock prices twelve months later 98% of the time.
Insider selling has plummeted
The most favorable insider action is massive buying. However, it is also favorable when insider selling plummets to a relatively low level. The chart and table below display those weeks when the Corporate Insider Sells indicator has crossed below 1800.
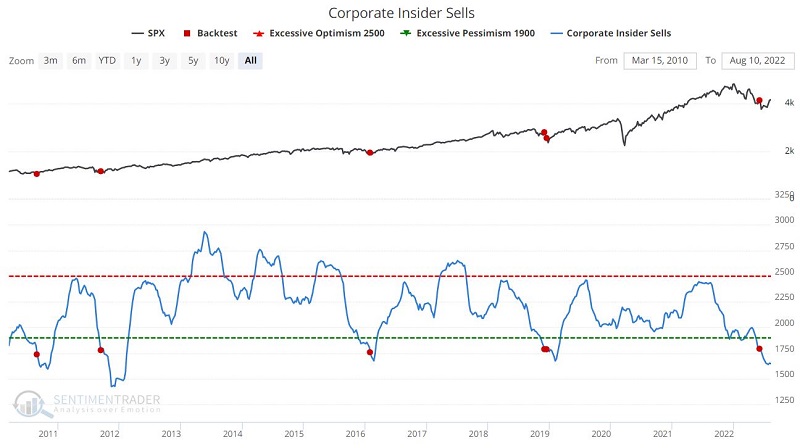
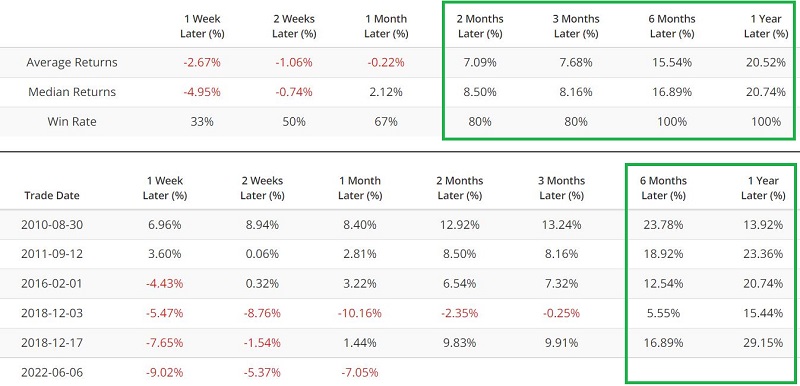
If we broaden the test and look at all weeks where this indicator was below 1800, we once again see periods of several weeks to several months where buying stock would have been timely. The chart and table below display all weeks when Corporate Insider Sells were below 1800.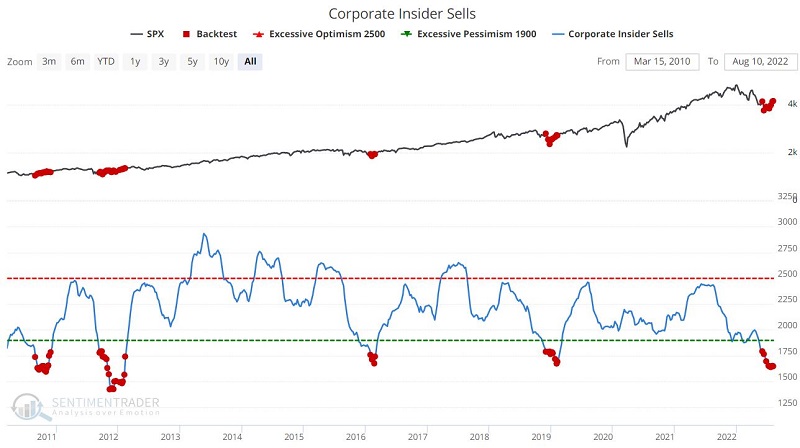
The high Win Rate percentages from 2 weeks out to 1 year suggest that a trader need not treat this as a precision timing tool (i.e., with a need to pile in automatically the instant this value drops below 1800) but can instead wait for a period of accumulation to unfold before putting money into the market.
Buy/Sell Ratio has touched a favorable level
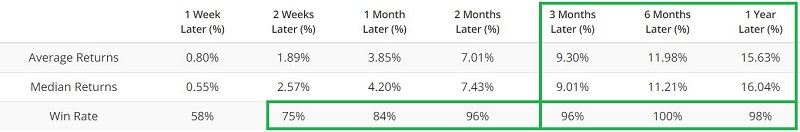
The chart and table below display those weeks when the Corporate Insider Buy/Sell Ratio crossed above 0.13 for the first time in four months.
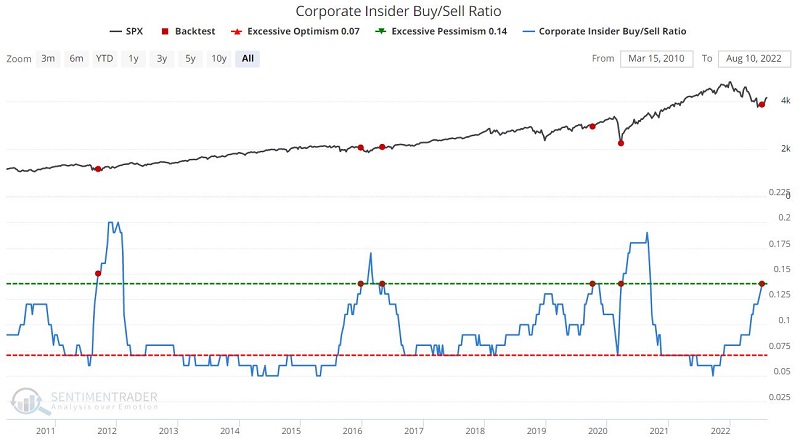
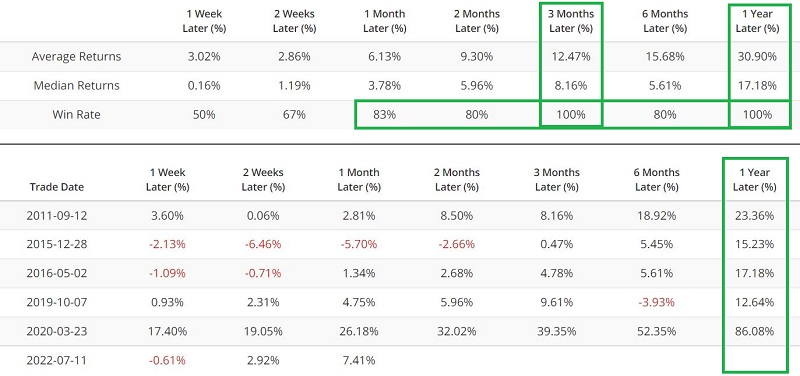
If we broaden the test and look at all weeks where this indicator was at or above 0.13, we once again see periods of several weeks to several months where buying stock would have been timely. The chart and table below display all weeks when the Corporate Insider Buy/Sell Ratio was 0.13 or higher.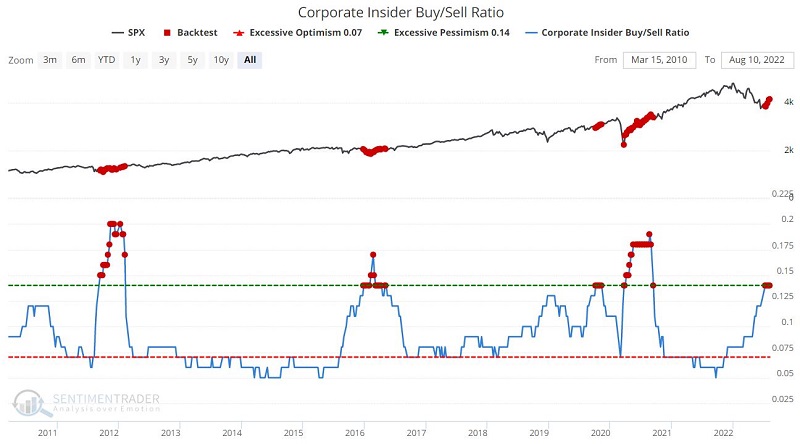
Once more, we see periods of accumulation by corporate insiders. The most recent period of accumulation began on 7/11/2022 and continues as this is written.
What the research tells us…
Corporate insider buying and selling should not be considered a precision market timing tool. Insiders tend to have a one-to-two-year timeframe. However, when you see a period of insider accumulation, as shown in the charts above, it tells you two things, 1) that insiders are anticipating improved fundamentals (higher sales and earnings), and 2) history suggests following their lead.