
Corporate Insider Velocity as part of the toolbox

Key points
- Some indicators are best used as part of the decision-making process and not as "automatic" buy or sell signal generators
- Our Corporate Insider Velocity indicator fits in this category
- Extremes and/or reversals in corporate insider activity often highlight potential opportunities for alert investors
Adding Corporate Insider Velocity to the indicator toolbox
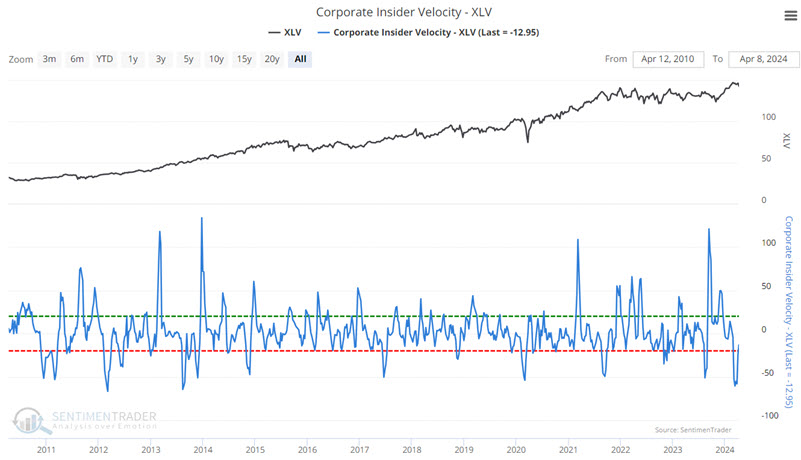
The Sentimentrader Corporate Insider Velocity indicator shows the velocity of corporate insider buying versus selling. It takes a 4-week rate of change for insider buys and subtracts a 4-week rate of change for insider sales.
Generally speaking:
- Extremes in insider activity (high or low) have tended to be favorable for the underlying index or sector
- Extreme readings are often "early" and serve more as "alert" than as actual trading signals
- Reversals from extremes are often an excellent time to consider entering a position
- Lastly, signals from this indicator are generally best used in conjunction with other information and not necessarily as a standalone trading model
The Healthcare sector
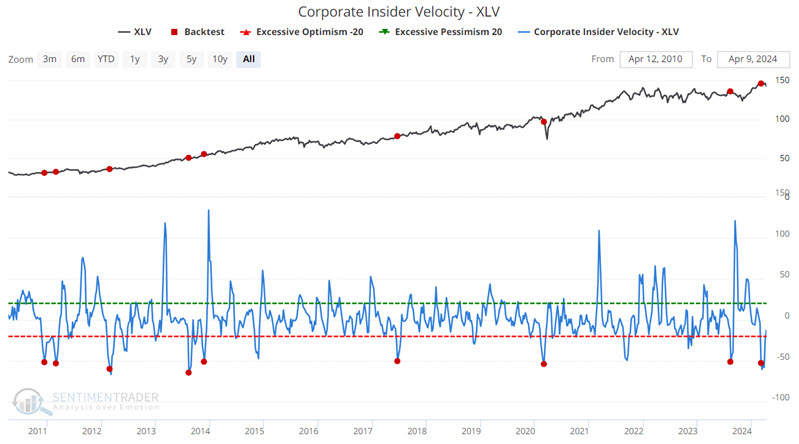
The chart below highlights the dates when the Corporate Insider Velocity-XLV indicator crossed below -50. Note that some signals were early. The most recent signal occurred on 2024-03-04.
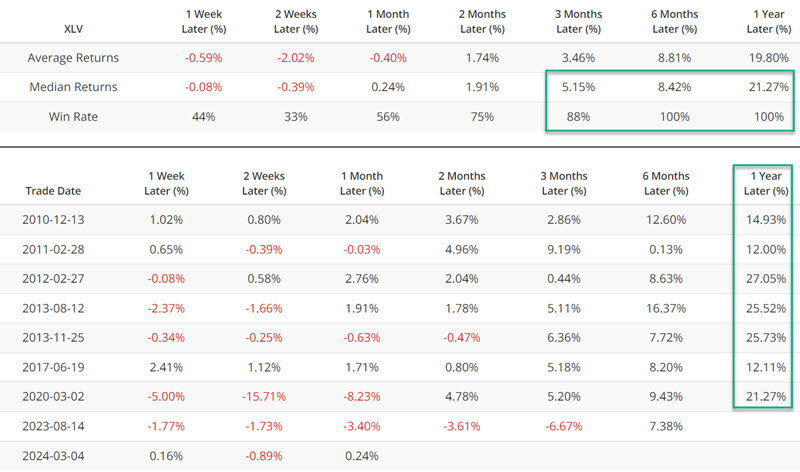
The table below summarizes subsequent XLV performance.
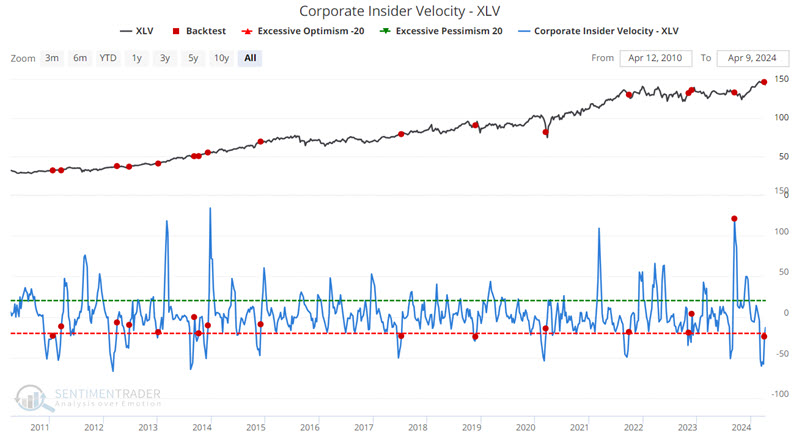
The chart below highlights the dates when the Corporate Insider Velocity-XLV indicator crossed above -25.
The table below summarizes subsequent XLV performance.
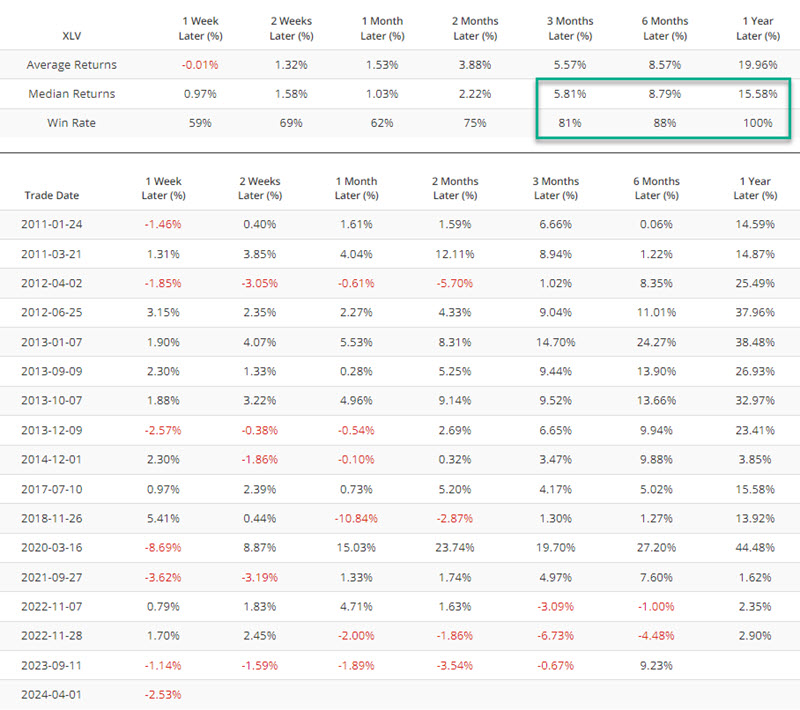
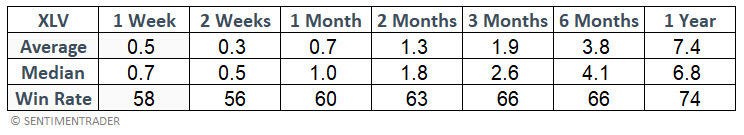
For comparison, the table below displays XLV performance for all dates.
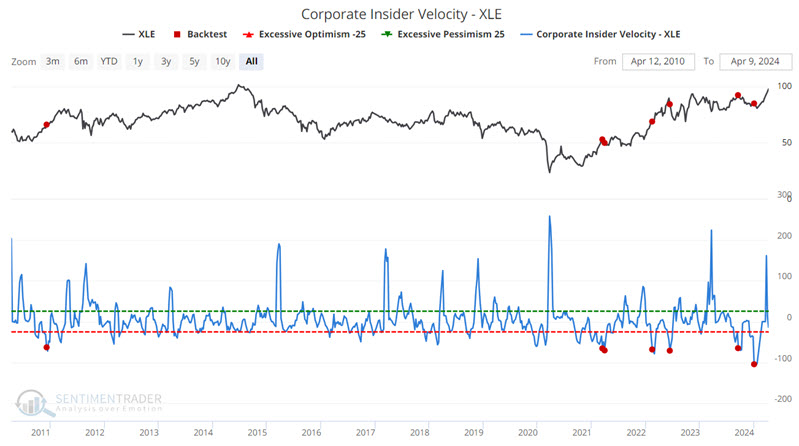
The Energy sector
As another example of the potential utility of monitoring Corporate Insider Velocity, the energy sector saw some early clues before the most recent rally.
The chart below highlights those dates when the Corporate Insider Velocity - XLE indicator crossed below -61.
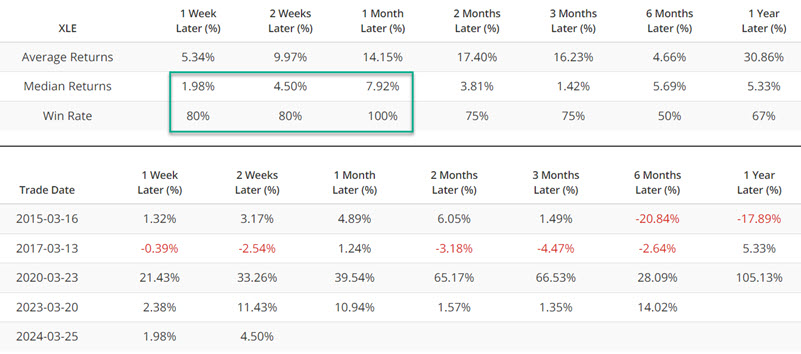
The table below summarizes subsequent XLE performance.
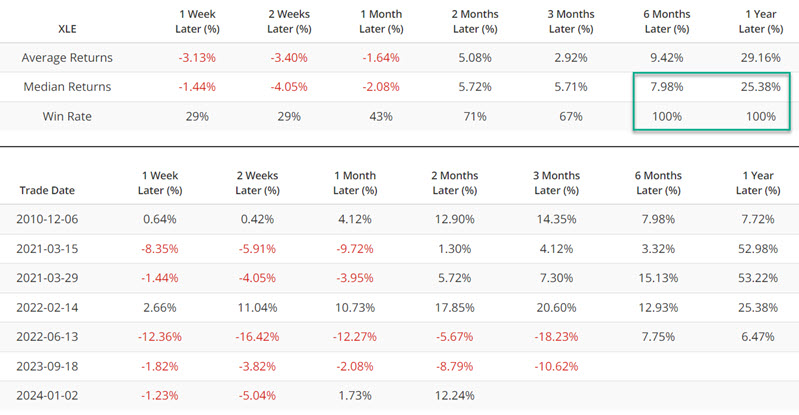
The chart below highlights those dates when the Corporate Insider Velocity - XLE indicator crossed above 160.
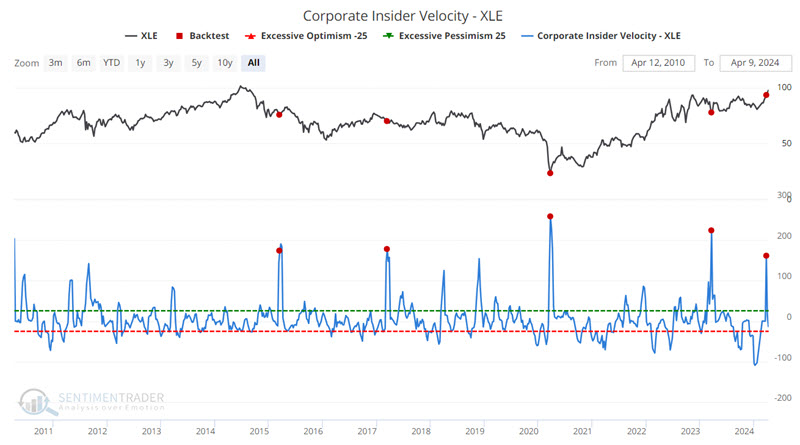
The table below summarizes subsequent XLE performance.
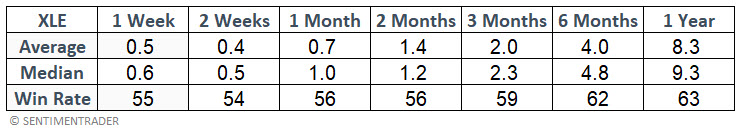
For comparison, the table below displays XLE performance for all dates.
The Technology sector
Now, let's turn our attention to the technology sector.
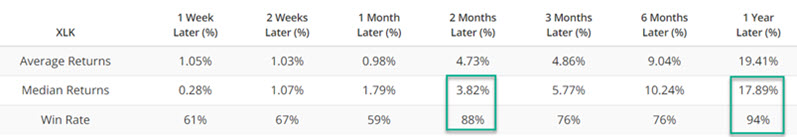
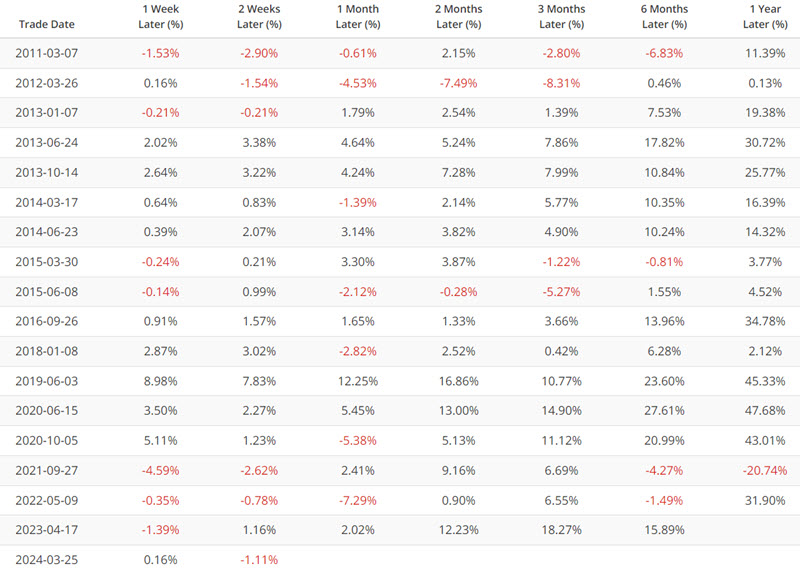
The chart below highlights those dates when the Corporate Insider Velocity - XLK indicator crossed above -28.
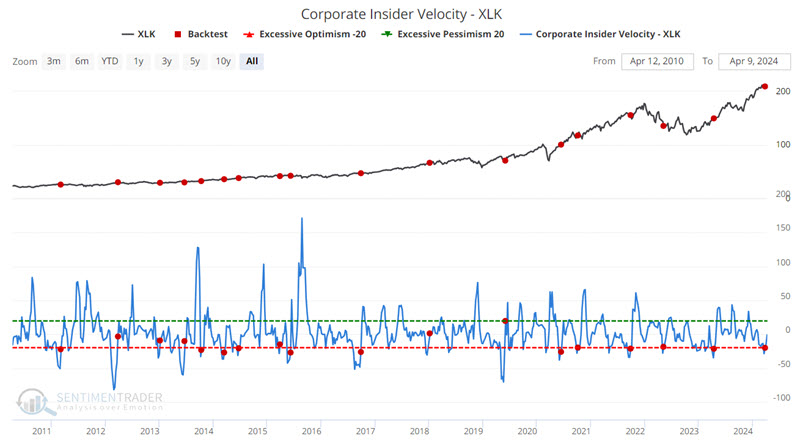
The table below summarizes subsequent XLK performance.
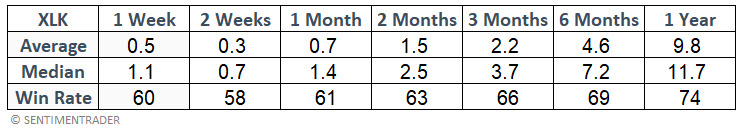
For comparison, the table below displays XLK performance for all dates.
The Utilities sector
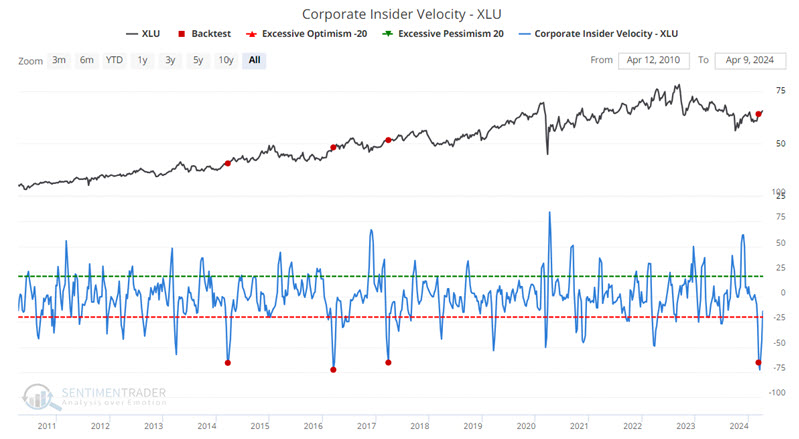
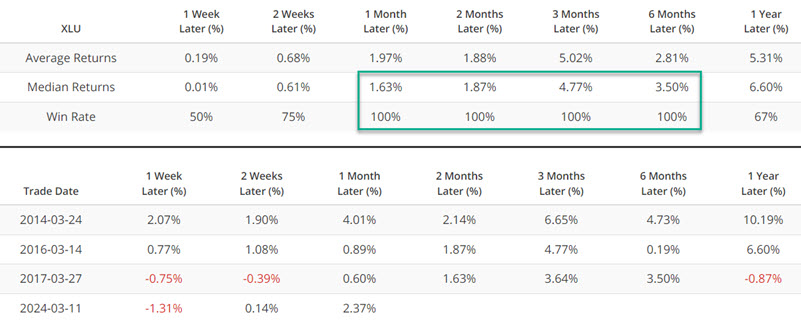
The chart below highlights those dates when the Corporate Insider Velocity - XLU indicator crossed below -65.
The table below summarizes subsequent XLU performance.
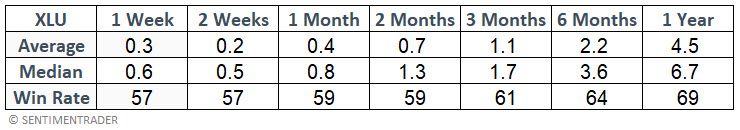
For comparison, the table below displays XLU performance for all dates.
What the research tells us…
A common mistake for many investors is to expect a given indicator to act as a full-fledged trading system. However, most indicators give information regarding only one factor that might affect a given stock, index, or market. Thus, individual indicators are typically best used not as a standalone trade generator but as part of a process. Conversely, individuals must not consider too many indicators simultaneously to avoid "analysis paralysis." Our Corporate Insider Velocity indicator at time conveys information about extremes and/or reversals in corporate insider activity. As these individuals know their companies' prospects best, it can be beneficial to consider their actions as part of a larger strategy.