
Corporate Insider Activity that Most Investors Never See

Key points:
- Bullish corporate insider activity is typically a favorable sign
- Our Corporate Insider Velocity indicators alert investors to important shifts in insider buying not visible simply by looking at raw buying and selling data
- In this note, we apply a longer-term moving average to measure the rate of change in insider activity, which can identify important clues
Velocity indicators offer a look "below the surface"
For the S&P 500 Index, the Nasdaq 100 Index, and the S&P 500 sectors, we track insider buying and selling across the constituent stocks. We track separately buying, selling, the buy/sell ratio, and a unique measure we call "insider velocity."
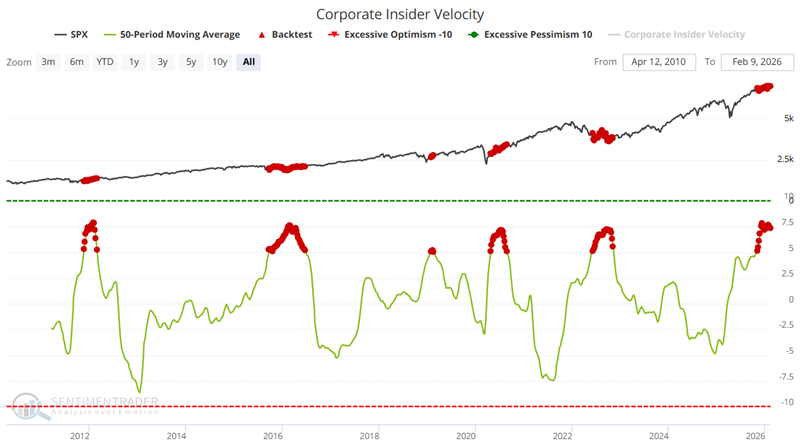
This indicator shows the velocity of corporate insider buying versus selling in S&P 500 stocks. It takes a 4-week rate of change for insider buys and subtracts a 4-week rate of change for insider sales. The greater the positive difference, the more insiders are buying their stock, and the more positive it is for the market. The lower the difference, the more intensely they're selling their stock, and the worse it is for the market.
We've noticed that applying a longer-term moving average to this data series has often helped identify recent important shifts. Let's take some recent developments one at a time.
Index #1: S&P 500 Index
Our Corporate Insider Velocity indicator considers buying and selling for corporate insiders from the 500 stocks that comprise the S&P 500 index. The chart below highlights all weeks when the 50-week average of Corporate Insider Velocity was above 5.
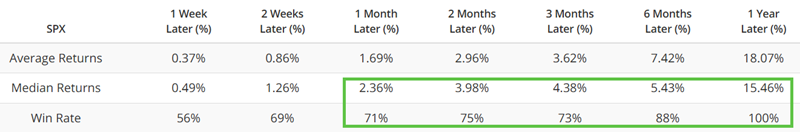
The table below summarizes subsequent S&P 500 index performance. The key thing to note is the high Win Rates.
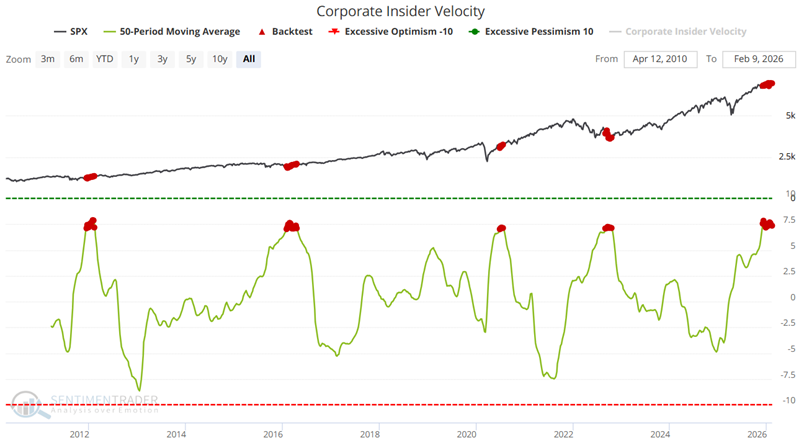
If insider buying is good, then more insider buying should be better. We can test that theory by raising the cutoff level to 7. The chart below highlights all weeks when the 50-week average of Corporate Insider Velocity was above 7.
The table below summarizes subsequent S&P 500 index performance. Note that the Win Rates are higher than in the test above.
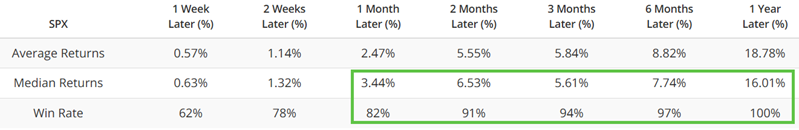
Does the recent flurry of red dots in the chart above guarantee that the index will be higher a year from now? Not at all. As always - and as much as you might dislike it when I say it - indicator signals are merely "weight of the evidence." But the historical numbers are compelling.
Index #2: Materials Index (XLB)
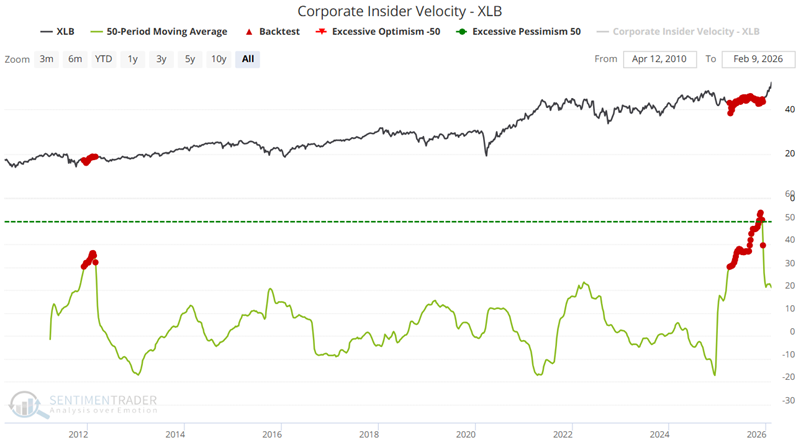
Our Corporate Insider Velocity - XLB indicator considers buying and selling for corporate insiders from the stocks that comprise the S&P 500 Materials Index. The chart below highlights all weeks when the 50-week average was above 30.
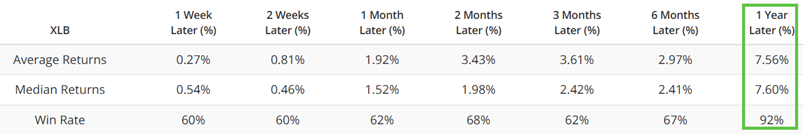
The table below summarizes the subsequent performance of the ticker XLB.
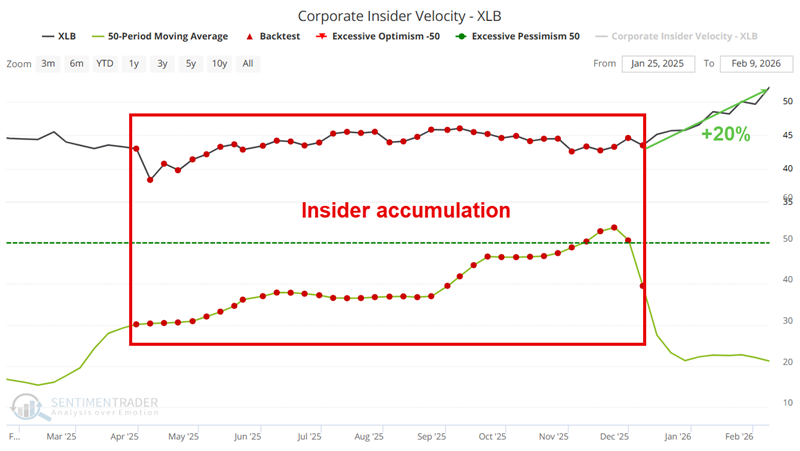
The sample size is minuscule. There was a flurry in late 2011 and early 2012. XLB gained roughly 37% over the subsequent two-plus years. The newest flurry ran from March 2025 into December 2025. Since then, XLB is up 20%, as seen below.
Index #3: Industrials Index (XLI)
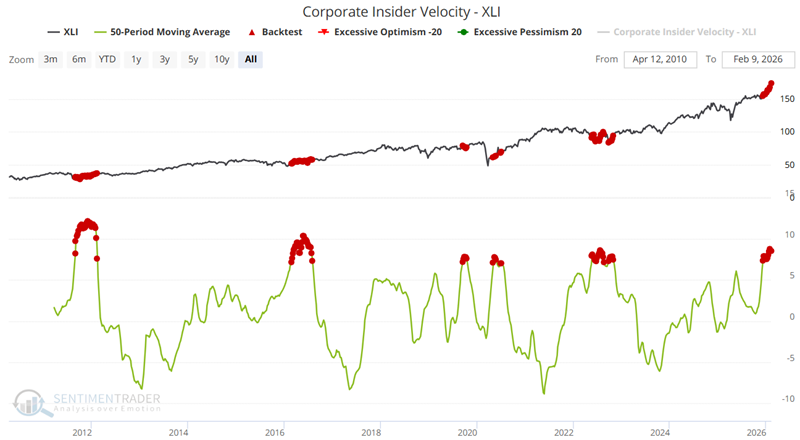
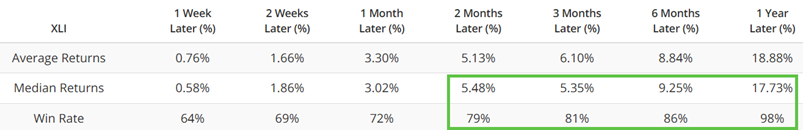
Our Corporate Insider Velocity - XLI indicator considers buying and selling for corporate insiders from the stocks that comprise the S&P 500 Industrials Index. The chart below highlights all weeks when the indicator was above 7. The most recent flurry of signals began in December 2025.
The table below summarizes the subsequent performance of ticker XLI.
Index #4: Technology Index (XLK)
Our Corporate Insider Velocity - XLK indicator considers buying and selling for corporate insiders from the stocks that comprise the S&P 500 Information Technology Index. The chart below highlights all weeks when the indicator was above 9, including overlapping signals.
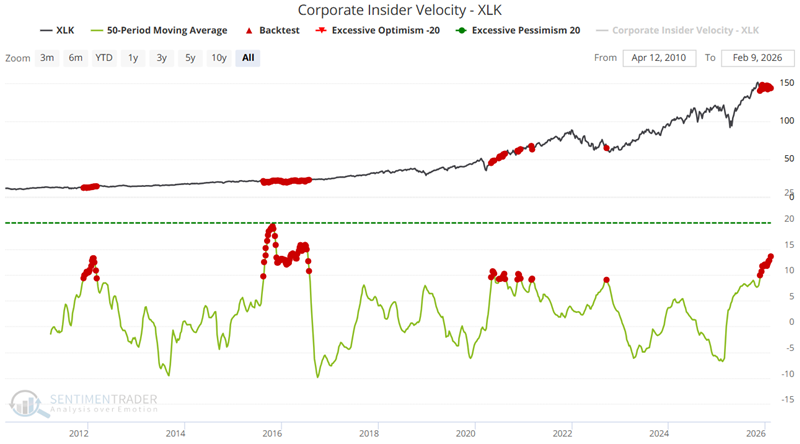
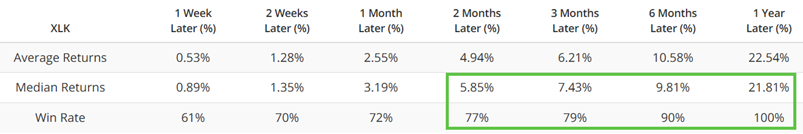
The table below summarizes the subsequent performance of the ticker XLK.
While XLK has traded sideways and been a significant market laggard since late November, industry insider activity has been noticeably favorable. Will this result in a subsequent rally? We cannot predict. However, historical results suggest tech stocks could move higher.
What the research tells us…
Insider activity indicators should not be viewed as "trading systems" that generate specific buy-and-sell timing signals. Instead, they serve as important "weight of the evidence" and alert us to situations where the people who know their company and industry best are seeing exceptional value. There are many reasons why corporate insiders might sell shares (cashing in, buying a house, a boat, a car, paying for college, etc.). But there is only one reason they would commit cash to purchase shares in the open market to the extent shown in the indicators above. The reason is that they expect their company's share price to rise, typically driven by corporate earnings growth.
Our Corporate Insider Velocity indicator offers a unique way to identify meaningful insider activity. Applying a longer-term moving average often helps to identify significant flurries of favorable insider activity within a given index or sector.