Products
SentimenTrader Trading Tools
‍
Backtest Engine
My Trading Toolkit
Correlation Analysis
Seasonality
Market Prediction
Indicators & Data API
‍
Proprietary Indicators & Charts
Market Data API
Strategies & Scanner
‍
50+ Trading Strategies
Smart Stock Scanner
Smart Option Scanner
Research Reports
‍
Research Solutions
Reports Library
Free Resources
Simple Backtest Calculator
Simple Seasonality Calculator
The Kelly Criterion Calculator
Sentiment Geo Map
Public Research Reports
Education
Sentiment Indicators
Technical Indicators
Pricing
Company
About
In the News
Testimonials
Client Success Stories
Contact
Log inLoginSign up
< BACK TO ALL REPORTS

Corn enters the "Danger Zone"

Jay Kaeppel
2026-05-26
Due to the pattern of the planting cycle in the U.S., corn futures have been one of the most reliable seasonal markets over a number of decades. The corn seasonal trend pattern suggests that a specific opportunity is setting up now. Traders are reminded, however, that there are no sure things in trading, particularly regarding seasonality.

Key points:

  • Seasonal trends should not be thought of as "buy" or "sell" signals. Seasonal trends should be thought of as "clues" that tell us "When to where for a potential opportunity"
  • With that caveat in mind, in the U.S., corn primarily gets planted in the Midwest in late winter to early spring, and harvested September through November
  • As a result, risk premiums tend to rise when there is no corn in the ground, and to fall after the planting is done
  • Aggressive traders might consider looking for near-term opportunities to play the short side in corn futures

Corn enters the "Danger Zone"

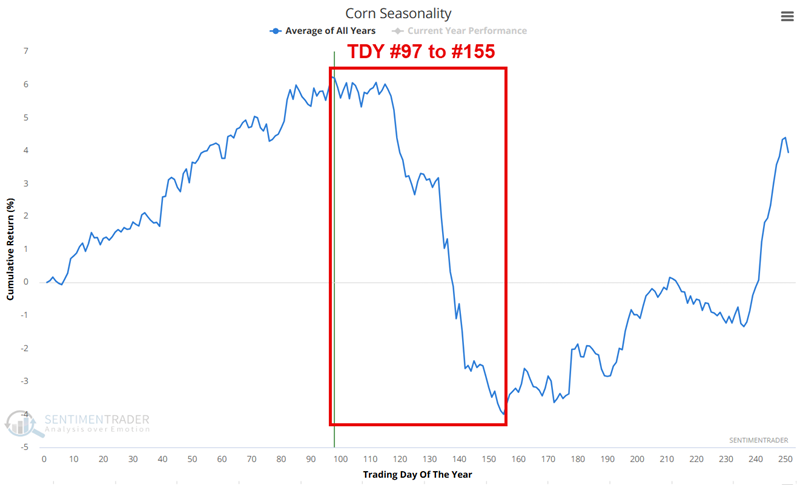
The planting cycle for corn in the U.S. typically results in rising risk premiums from late in the calendar year (after this year's crop is harvested and no new crop goes into the ground for many months) until mid-spring (typically mid-to-late May). After this year's crop is planted, and an assessment of the status of this year's crop is made, risk premiums tend to fall.

This seasonal tendency is obvious in the Annual Seasonal Trend chart for Corn futures below, and suggests a bearish bias between now and mid-August. The chart below highlights the period from Trading Day of the Year (TDY) #97 through TDY #155. For 2026, this period extends from May 21st through August 14th.

Sorry, you don't have access to this report

Upgrade your subscription plan to get access
Go to Dasboard
PRODUCTS
SentimenTrader
Trading Tools
Indicators & Data API
‍
Strategies & Scanner
‍
Research Reports
FREE
RESOUrCES
Simple Backtest
Calculator
Simple Seasonality
Calculator
The Kelly Criterion
Calculator
Sentiment Geo Map
‍
Public Research Reports
‍
Education
Sentiment Indicators
‍
Technical Indicators
‍
Pricing
Bundle pricing
‍
FAQ
‍
Announcements
‍
COMPANY
‍
About
‍
In the News
‍
Testimonials
‍
Client Success Stories
CONTACT
‍
General Inquiries
‍
Media Inquiries
‍
Financial Professionals Inquiries
‍
© 2026 Sundial Capital Research Inc. All rights reserved.
Setsail Marketing
TermsPrivacyAffiliate Program
Risk Disclosure: The information and tools provided are for research and analytical purposes only and are not intended as investment advice. Market analysis involves uncertainty, and outcomes may differ from expectations. Users should conduct their own due diligence and consider their individual circumstances before making any financial decisions. Past performance is not necessarily indicative of future results.

Hypothetical Performance Disclosure: Hypothetical performance results have many inherent limitations, some of which are described below. No representation is being made that any account will or is likely to achieve profits or losses similar to those shown; in fact, there are frequently sharp differences between hypothetical performance results and the actual results subsequently achieved by any particular trading program. One of the limitations of hypothetical performance results is that they are generally prepared with the benefit of hindsight. In addition, hypothetical trading does not involve financial risk, and no hypothetical trading record can completely account for the impact of financial risk of actual trading. for example, the ability to withstand losses or to adhere to a particular trading program in spite of trading losses are material points which can also adversely affect actual trading results. There are numerous other factors related to the markets in general or to the implementation of any specific trading program which cannot be fully accounted for in the preparation of hypothetical performance results and all which can adversely affect trading results.

Testimonial Disclosure: Testimonials appearing on this website may not be representative of other clients or customers and is not a guarantee of future performance or success.