Products
SentimenTrader Trading Tools
‍
Backtest Engine
My Trading Toolkit
Correlation Analysis
Seasonality
Market Prediction
Indicators & Data API
‍
Proprietary Indicators & Charts
Market Data API
Strategies & Scanner
‍
50+ Trading Strategies
Smart Stock Scanner
Smart Option Scanner
Research Reports
‍
Research Solutions
Reports Library
Free Resources
Simple Backtest Calculator
Simple Seasonality Calculator
The Kelly Criterion Calculator
Sentiment Geo Map
Public Research Reports
Education
Sentiment Indicators
Technical Indicators
Pricing
Company
About
In the News
Testimonials
Client Success Stories
Contact
Log inLoginSign up
< BACK TO ALL REPORTS

Corn and the Santa Claus rally

Jay Kaeppel
2022-12-05
While many traders are familiar with the so-called Santa Claus Rally in the stock market, few are aware of the Santa Claus corn rally. The seasonally favorable period begins this week.

Key points:

  • A short timeframe during December has tended to see higher prices for corn futures
  • This period has seen corn gain in price 89% of the time since 1961
  • For 2022, that period starts this week

Corn price action has been weakening

Corn prices have been struggling to stay positive, and there are signs that trends are breaking down.

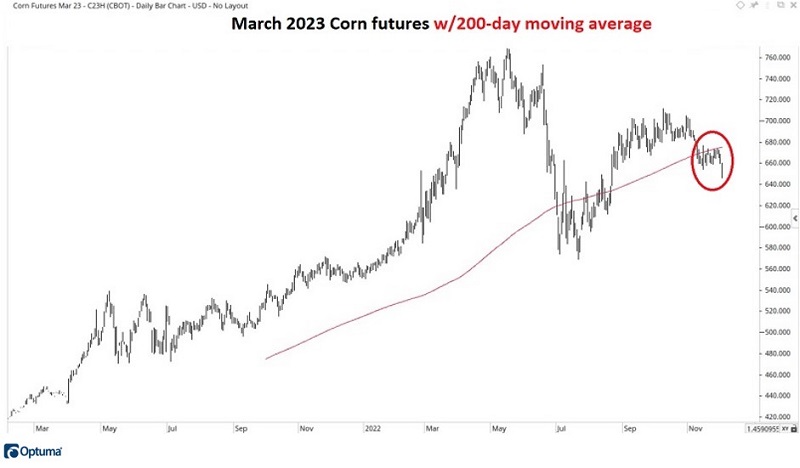
The chart below shows price action in corn futures, and there are some technical concerns here. Price has been working its way lower for over six months and is breaking below the 200-day moving average (red line). Nevertheless, corn is a highly cyclical market and is about to enter the seasonally favorable portion of the year. As such, price weakness in the near term could prove to be a buying opportunity.

Corn seasonality set to turn positive

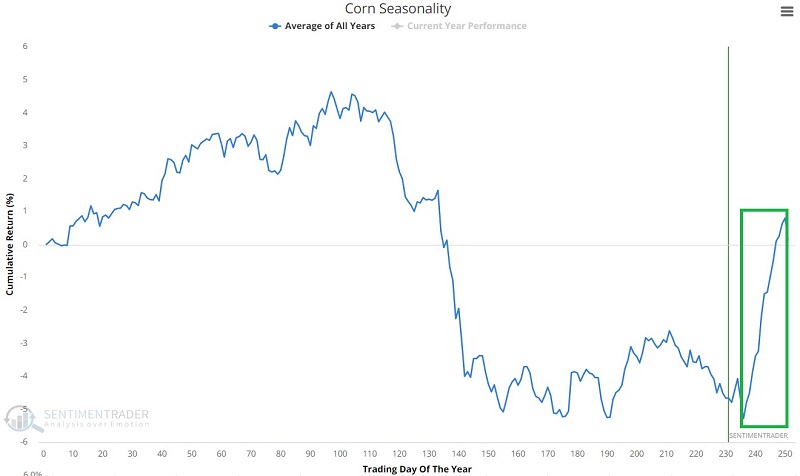
The chart below displays the annual seasonal trend for corn futures. Note that corn is about to enter a favorable seasonal period. For 2022, this period runs from the close on December 8 through the close on December 30.

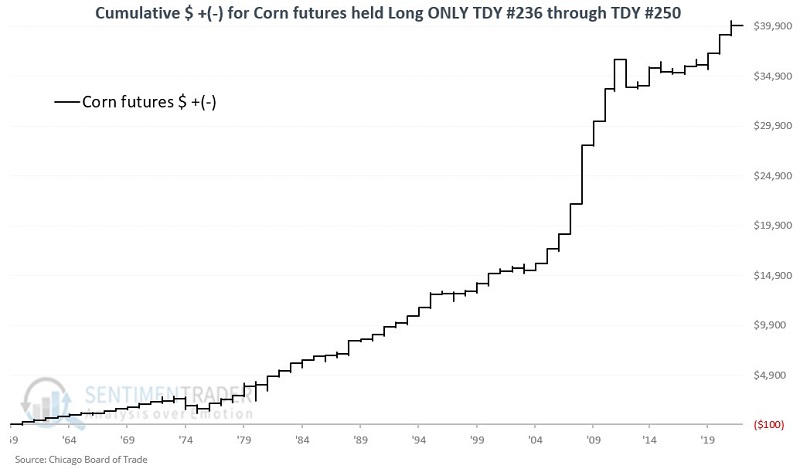
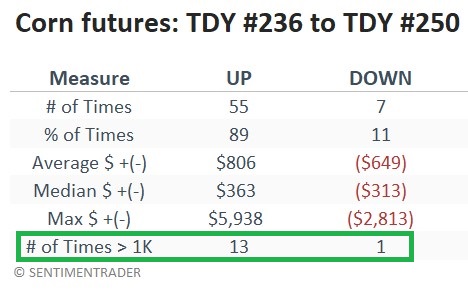
For this test, we will examine the performance of corn futures between Trading Day of the Year (TDY) #236 and TDY #250. The chart below displays the cumulative dollar return achieved by holding a long 1-lot position in corn futures only during this period every year starting in 1960.

The year-by-year results show how consistently profitable this window has been, though there was that exceptional outlier in 2012.

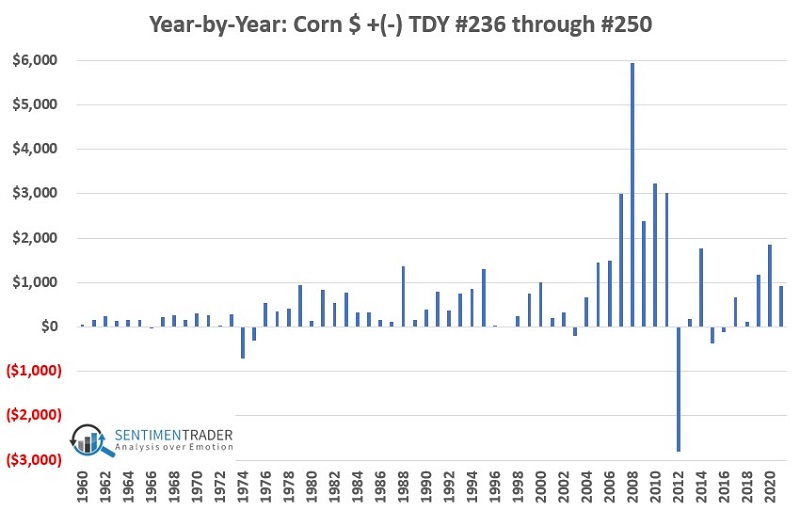
Over the past 62 years, corn futures showed a gain 55 times during this roughly 3-week period. The lopsided nature of gains versus losses over $1,000 (13-to-1) suggests a true edge. However, the sheer size of 2012's loss of -$2,813 reminds us of the need for risk management in every trade, regardless of any perceived edge.

What the research tells us...

During the approximately 3-week seasonally favorable timeframe coming soon, corn futures have shown a gain 89% of the time. This tendency for strength offers traders an edge, but success is never guaranteed from year to year. The significant loss in 2012 reminds us that - from a real-world trading perspective - no matter how consistently any price trend, strategy, factor, or seasonal trend performs, the first job of a trader is risk control.

PRODUCTS
SentimenTrader
Trading Tools
Indicators & Data API
‍
Strategies & Scanner
‍
Research Reports
FREE
RESOUrCES
Simple Backtest
Calculator
Simple Seasonality
Calculator
The Kelly Criterion
Calculator
Sentiment Geo Map
‍
Public Research Reports
‍
Education
Sentiment Indicators
‍
Technical Indicators
‍
Pricing
Bundle pricing
‍
FAQ
‍
Announcements
‍
COMPANY
‍
About
‍
In the News
‍
Testimonials
‍
Client Success Stories
CONTACT
‍
General Inquiries
‍
Media Inquiries
‍
Financial Professionals Inquiries
‍
© 2026 Sundial Capital Research Inc. All rights reserved.
Setsail Marketing
TermsPrivacyAffiliate Program
Risk Disclosure: The information and tools provided are for research and analytical purposes only and are not intended as investment advice. Market analysis involves uncertainty, and outcomes may differ from expectations. Users should conduct their own due diligence and consider their individual circumstances before making any financial decisions. Past performance is not necessarily indicative of future results.

Hypothetical Performance Disclosure: Hypothetical performance results have many inherent limitations, some of which are described below. No representation is being made that any account will or is likely to achieve profits or losses similar to those shown; in fact, there are frequently sharp differences between hypothetical performance results and the actual results subsequently achieved by any particular trading program. One of the limitations of hypothetical performance results is that they are generally prepared with the benefit of hindsight. In addition, hypothetical trading does not involve financial risk, and no hypothetical trading record can completely account for the impact of financial risk of actual trading. for example, the ability to withstand losses or to adhere to a particular trading program in spite of trading losses are material points which can also adversely affect actual trading results. There are numerous other factors related to the markets in general or to the implementation of any specific trading program which cannot be fully accounted for in the preparation of hypothetical performance results and all which can adversely affect trading results.

Testimonial Disclosure: Testimonials appearing on this website may not be representative of other clients or customers and is not a guarantee of future performance or success.