
Copper/Gold Ratio Triggers Historical Lows Once Again

Key Points
- The Copper/Gold Ratio has recently touched the historical low range once again
- Historical statistics show that gold demonstrates a high defensive win rate in such environments
- Although mining stocks have high elasticity, they are often accompanied by risks of sharp short-term pullbacks
- Copper has shown characteristics of mean reversion within one year after extreme values appear
Copper/Gold Ratio Crossing the Extreme Threshold
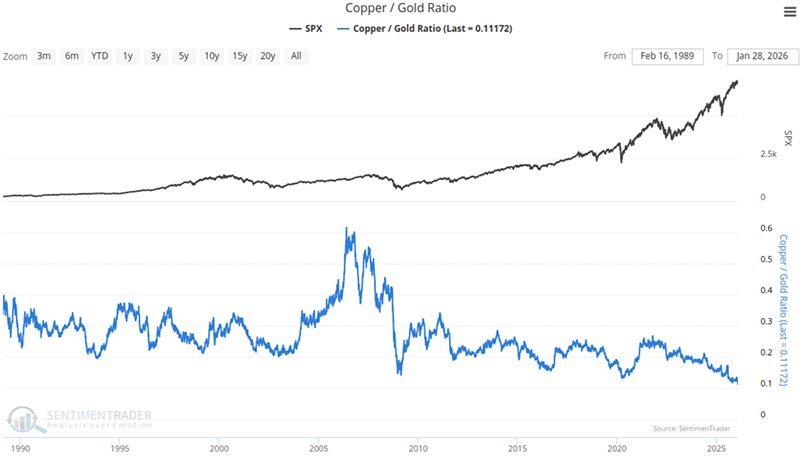
The Copper/Gold Ratio has long been a closely watched indicator in macroeconomic analysis. By comparing the price trends of industrial metals (representing demand for economic growth) and precious metals (representing safe-haven demand), it intuitively reflects market sentiment toward economic prospects. A sharp decline in this ratio usually means the market is pricing in an economic slowdown or that safe-haven sentiment has reached a cyclical peak.
According to the latest charts, after hitting frequent new lows from August to October last year, the Copper/Gold Ratio has triggered a historical low once again in the most recent period.
Gold and Gold Mining
GLD is the primary instrument tracking gold prices. Against the backdrop of extreme safe-haven signals from the Copper/Gold Ratio, gold's performance is typically the focus of investors' attention.Related Backtest Click Here.
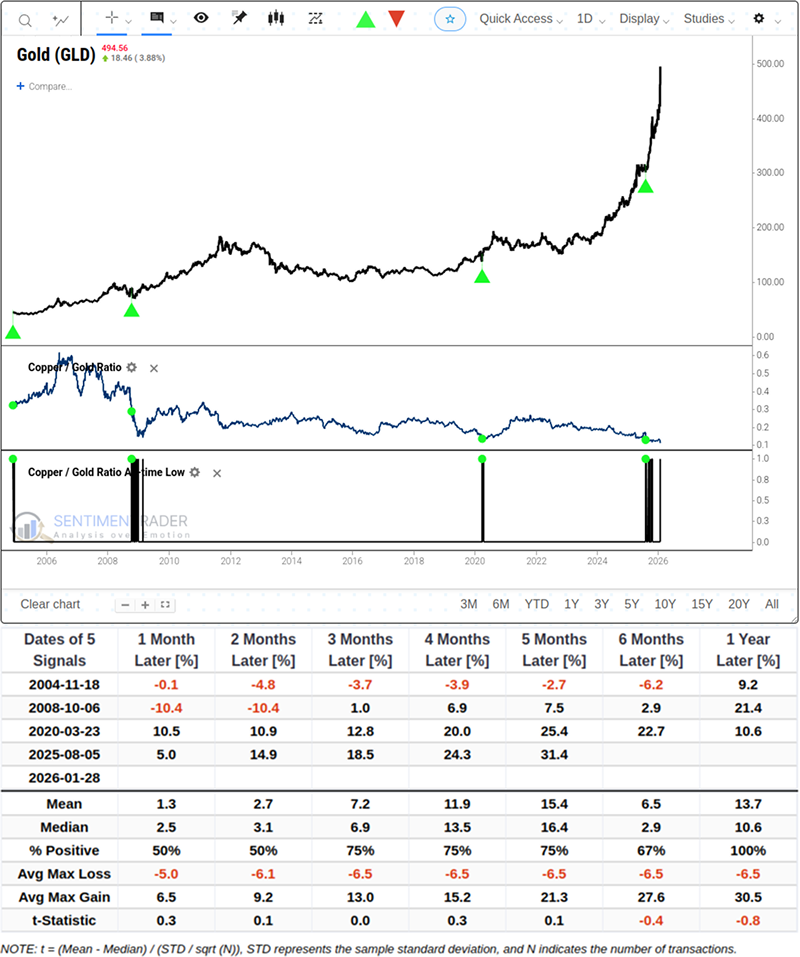
In the limited historical sample, GLD maintained a 100% probability of positive returns within 12 months after the signal was triggered, with a median return of 10.6%.
In contrast to the stability of physical gold, gold mining stocks represented by the Gold Miners ETF (GDX) exhibit more aggressive characteristics.Related Backtest Click Here.
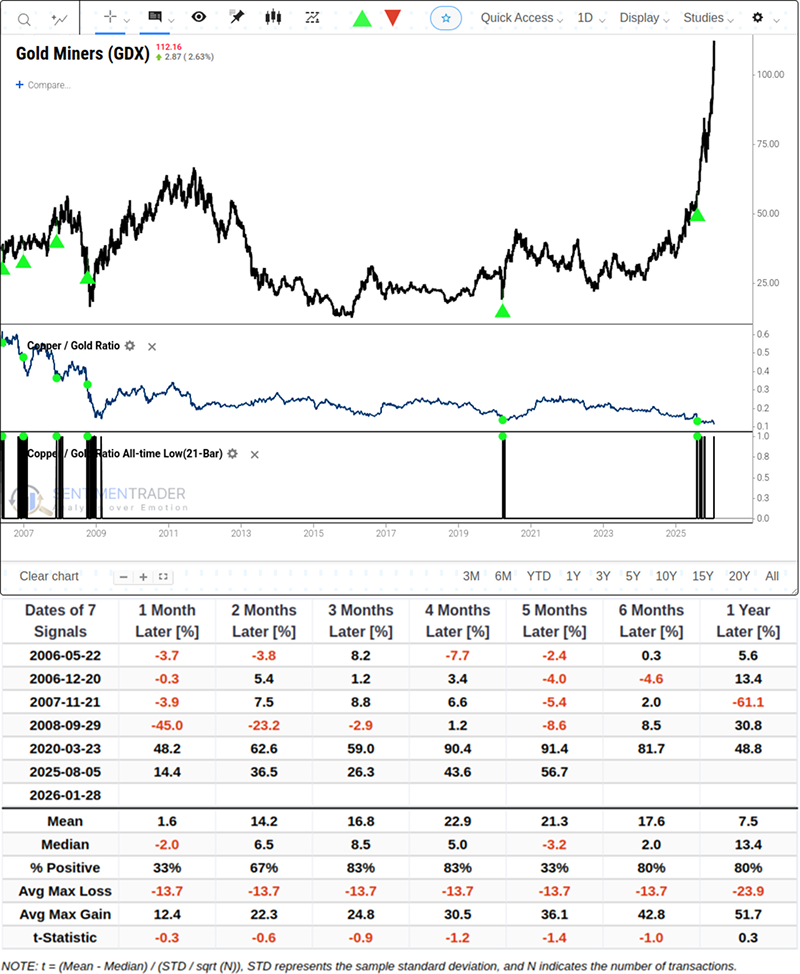
The data reveals a clear asymmetric risk-reward phenomenon. Over a one-year horizon, GDX delivered a median return of 13.4%, outperforming the gold ETF and demonstrating the high elasticity of mining stocks once a trend is established. However, this potential for high returns comes at a cost. In the first month after the signal is triggered, GDX's Average Maximum Loss reached -13.7%, with even deeper pullbacks recorded in extreme years.
Industrial Metals
The chart below shows the performance of copper following the trigger of the signal.Related Backtest Click Here.
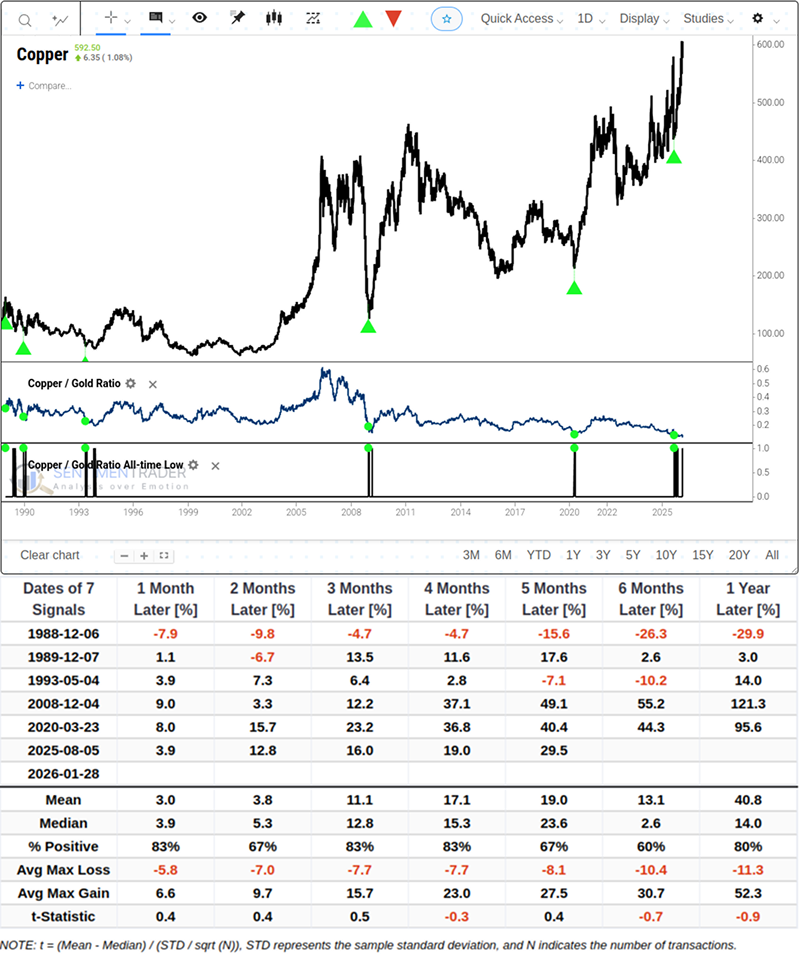
Within one year after the signal was triggered, copper futures posted a median return of 14.0%, with a high probability of positive returns.
In addition, silver (SLV), which has both industrial and financial attributes, showed a more mixed performance.Related Backtest Click Here.
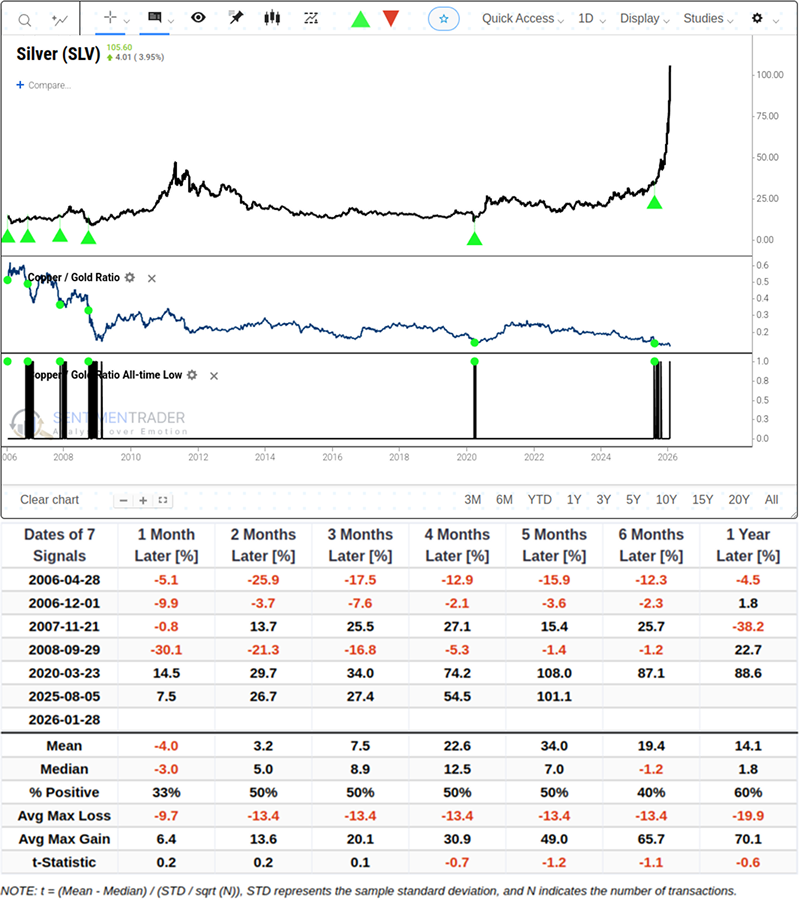
The data mainly indicates its relatively weak short-term performance, with a negative median return (-3.0%) in the first month.
U.S. Dollar
To understand the drivers behind the performance of the above assets, we cannot ignore the impact of the pricing currency-the U.S. dollar.Related Backtest Click Here.
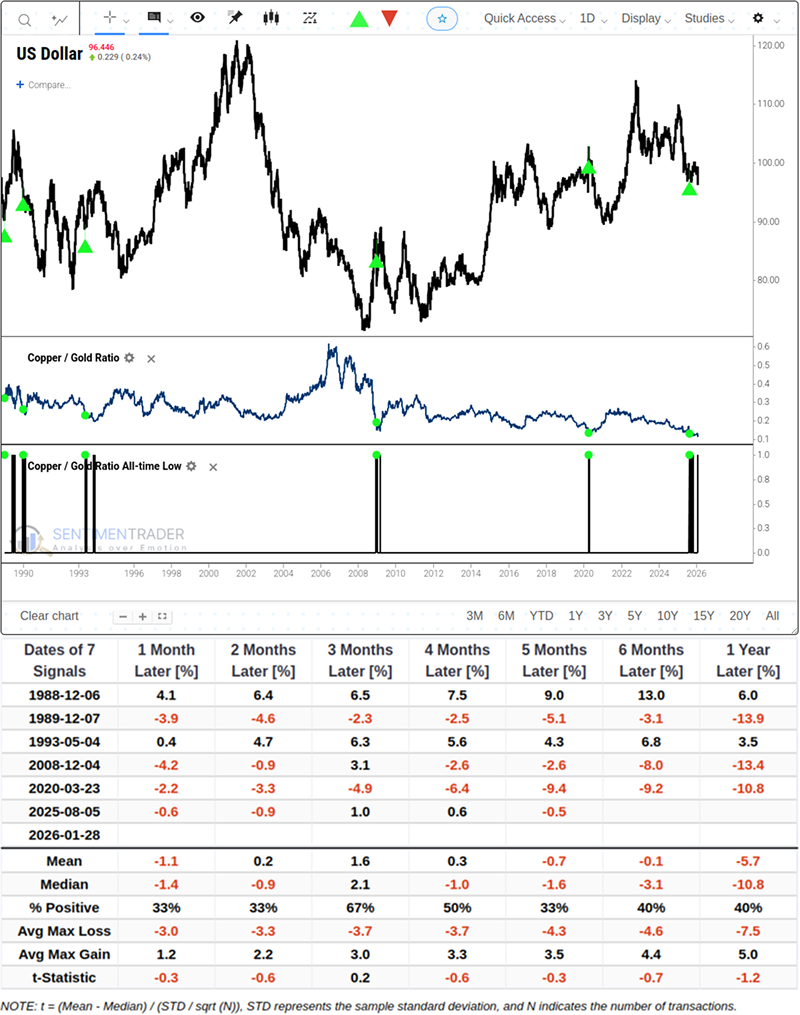
Historical data shows that after the Copper/Gold Ratio hits extremely low levels, the U.S. Dollar Index tends to weaken over the subsequent 12 months, with a median decline of 10.8%.
What the Research Tells Us……
A drop in the Copper/Gold Ratio to historical lows is a rare and extreme macroeconomic event. Much like the boy who cried wolf, extreme bearish or bullish sentiment is often falsified by subsequent market corrections.
While the above statistical results show that precious metals (especially gold) and long-term Treasury bonds tend to perform well after this signal emerges, and mining stocks exhibit high elasticity after experiencing volatility, we must emphasize that the sample size is very small (N=5 to 8). These data include vastly different macroeconomic backdrops such as the 2008 deflationary crash and the 2020 pandemic shock, and each historical episode has unfolded differently.
Therefore, this single indicator should not be used as the sole basis for buying or selling decisions. Instead, the signal serves more as a reminder to investors: market safe-haven sentiment has reached historically extreme levels, a state that is usually accompanied by sharp revaluation of asset prices. For investors with low risk appetite, focusing on gold's defensive properties may be rational; for traders who can tolerate high volatility, the historical high odds of mining stocks may be worth researching-provided they are prepared for sharp short-term pullbacks.
It must be noted that the high win rates in historical data are largely built on the path dependence of "central banks cutting interest rates rapidly after a crisis". If the future macro environment evolves into stagflation (i.e., economic recession coupled with high inflation, which restricts central banks' easing capacity), the U.S. dollar may not weaken as expected, and the defensive properties of bonds and gold will face severe tests. Furthermore, the nominal rise in copper should not mask the stagnation in its real purchasing power, and investors need to be wary of "money illusion".