
Copper/Gold Ratio signals for metals, miners and bonds

Key Points
- The Copper/Gold Ratio (CGR) measures the relationship between industrial metals and precious metals
- Certain actions by this ratio have often presaged significant turning points in a variety of markets
- Markets impacted include precious and industrial metals, gold stocks, and bonds of all stripes
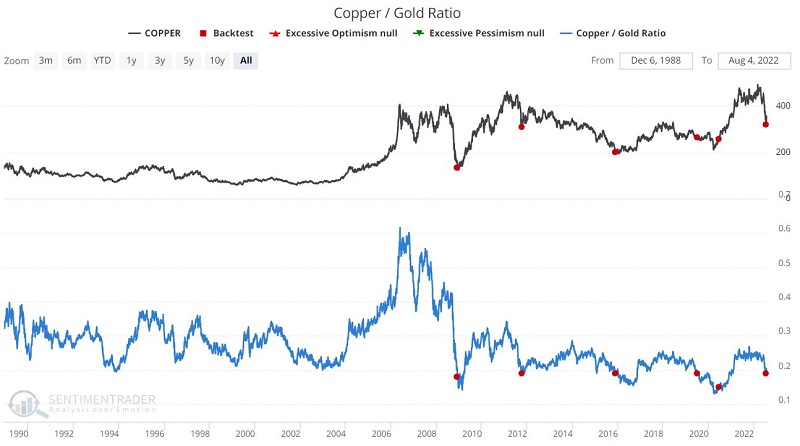
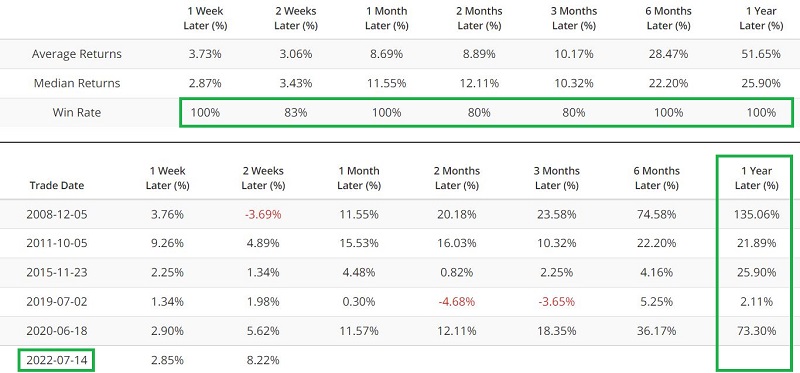
Copper
The chart and table below display the performance of copper when the Copper/Gold Ratio dropped below 0.19 for the first time in a year.
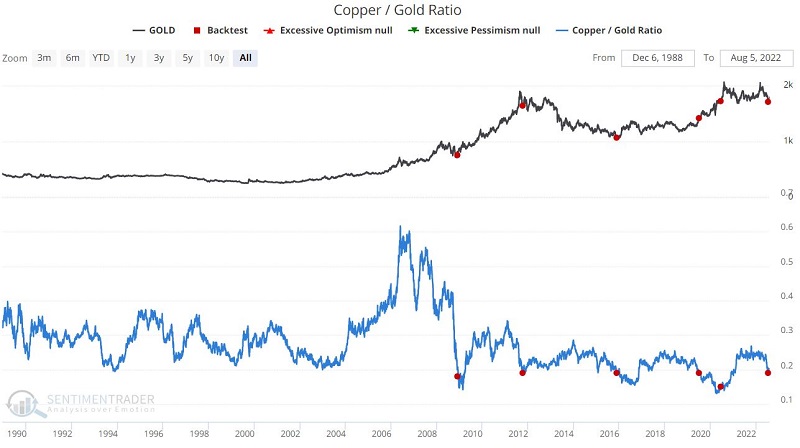
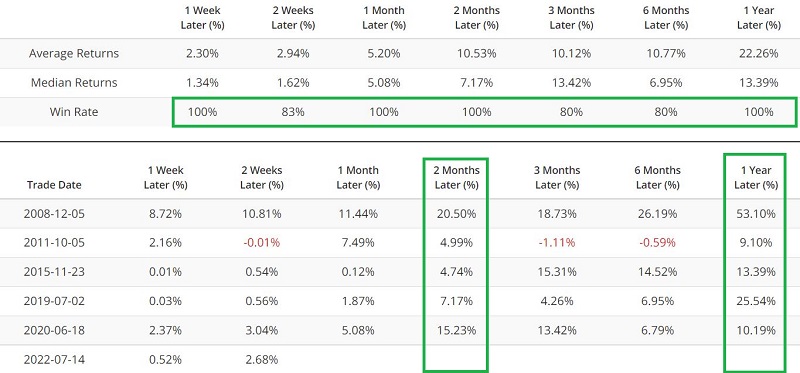
Gold
The chart and table below display the performance of gold when the Copper/Gold Ratio dropped below 0.19 for the first time in a year.
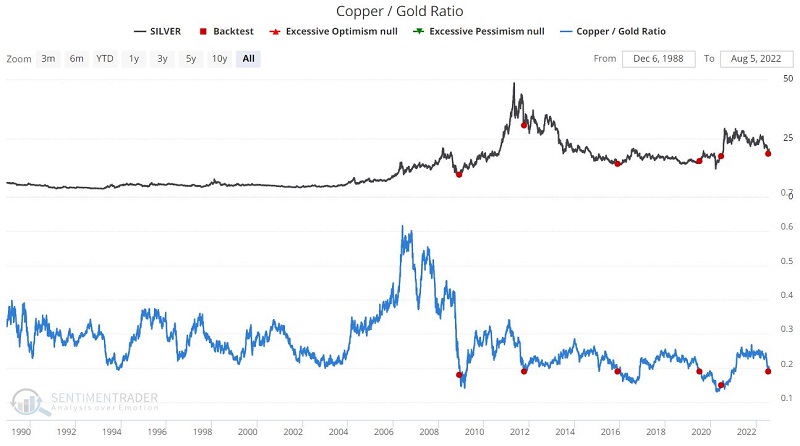
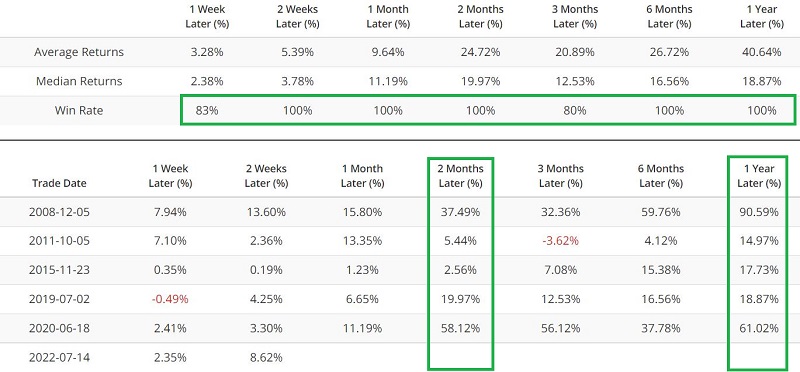
Silver
The chart and table below display the performance of silver when the Copper/Gold Ratio dropped below 0.19 for the first time in a year.
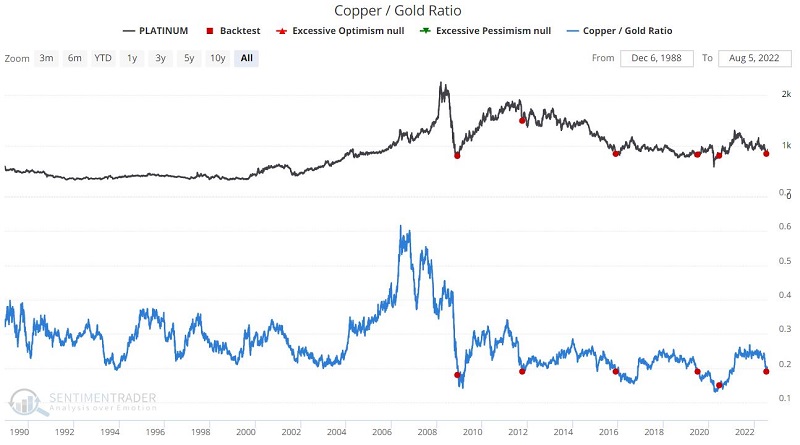
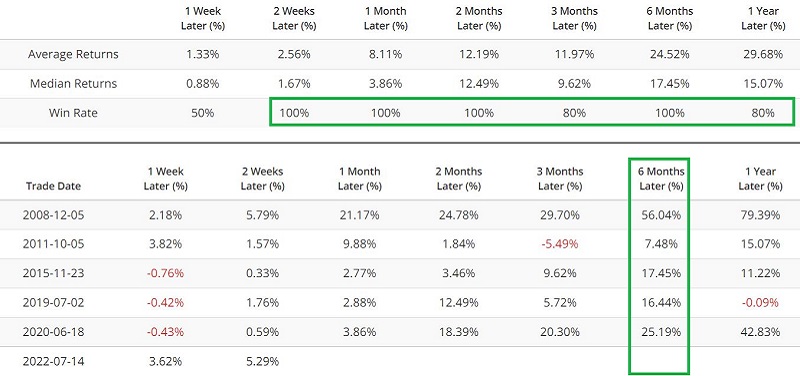
Platinum
The chart and table below display the performance of platinum when the Copper/Gold Ratio dropped below 0.19 for the first time in a year.
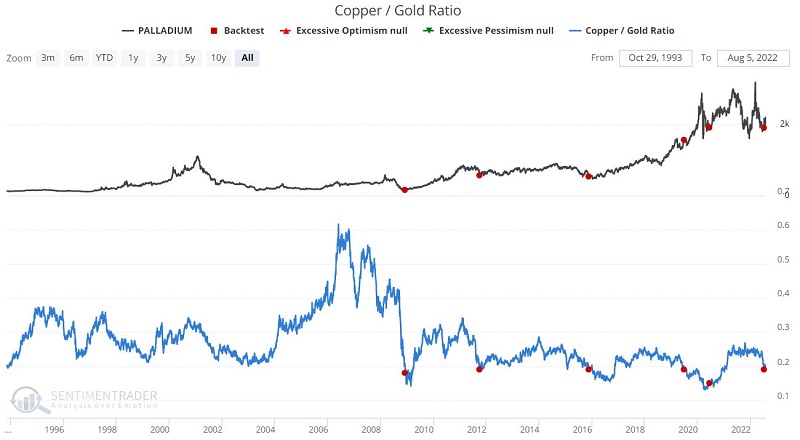
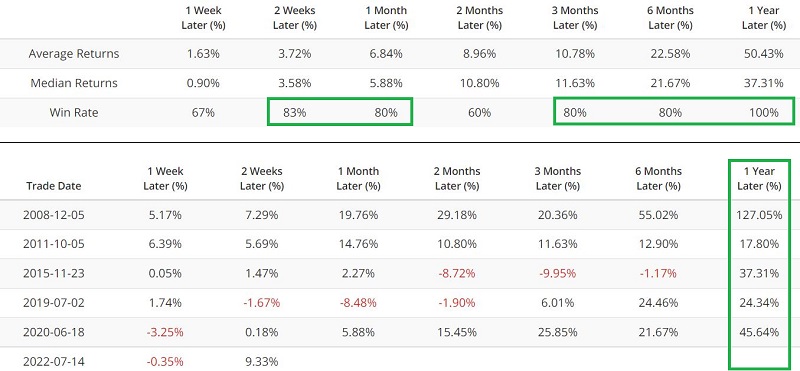
Palladium
The chart and table below display the performance of palladium when the Copper/Gold Ratio dropped below 0.19 for the first time in a year.
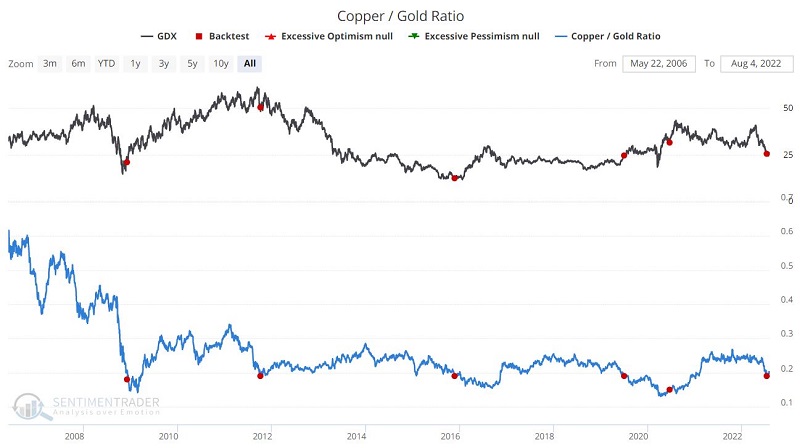
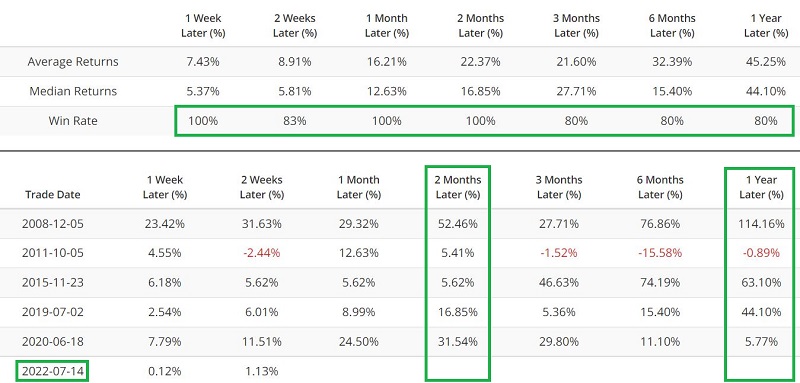
Gold Miners (GDX)
Now let's turn our attention away from physical metals and look at gold mining stocks. The chart and table below display the performance for ticker GDX (VanEck Gold Miners ETF) when the Copper/Gold Ratio dropped below 0.19 for the first time in a year.
Now let's turn our attention to the bond market.
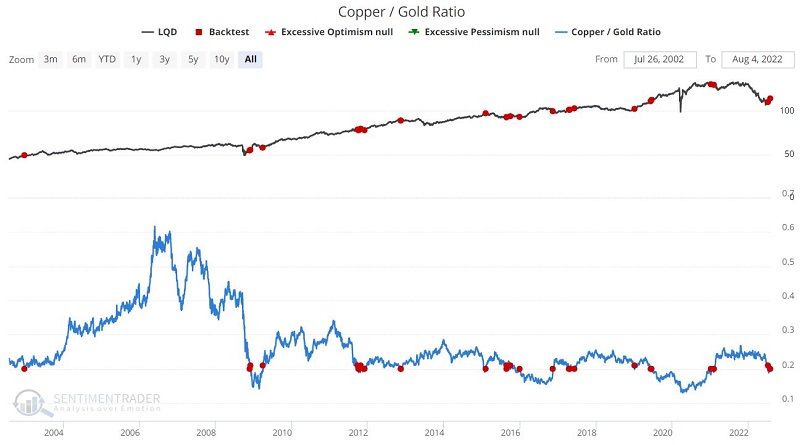
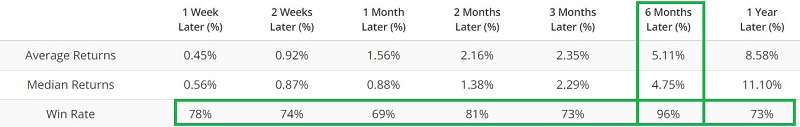
Investment Grade Corporate Bonds (LQD)
The chart and table below display the performance for ticker LQD (iShares iBoxx $ Investment Grade Corporate Bond ETF) when the Copper/Gold Ratio crossed above 0.20.
High-Yield Corporate Bonds (HYG)
Typically, investment grade bond performance is more closely correlated to interest rate movements, and high-yield bond performance is more closely correlated to stock market performance. However, when it comes to the Copper/Gold Ratio, the same signal similarly affects high-grade and low-grade corporate bonds.
The chart and table below display the performance for ticker HYG (iShares iBoxx $ High Yield Corporate Bond ETF) when the Copper/Gold Ratio crossed above 0.20.
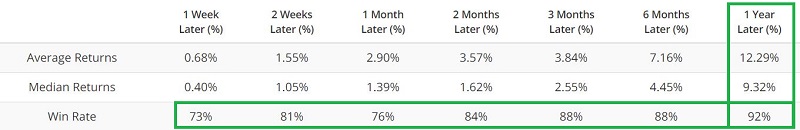

Recent CGR crosses above 0.20 occurred on 7/7 and again on 7/29.
30-Year Treasuries
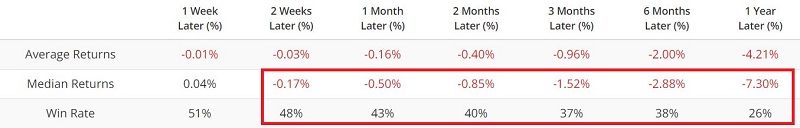
One exception to the rule appears to be long-term treasury bonds. The chart and table below display the 30-year treasuries (THIRTY) performance when the Copper/Gold Ratio is below 0.20.
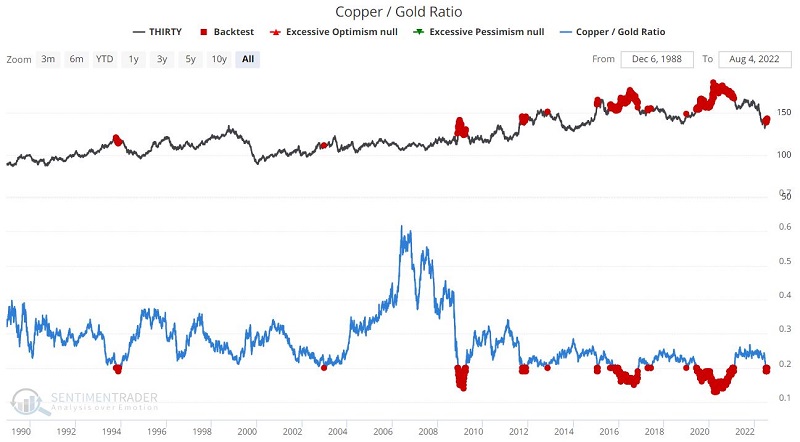
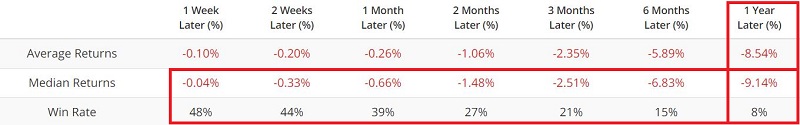
For the record, if we look only at those times when CGR is below 0.17 (which it has not been since November 2020), the results for long-term treasuries are even worse, as reflected in the table below.
What the research tells us…
The historical results shown above are compelling. That said, it is essential to remember that a) we are looking at a small sample size, and b) the Copper/Gold Ratio is only one factor that might influence metals and bonds. As a result, no one should assume that metals, miners, and corporate bonds are sure to advance in the year ahead. That said, given the bearishness in the past year, traders need to open their minds to the possibility of much better than expected returns in metals, miners, and corporate bonds as the year progresses.